Abstract
This paper mainly discusses electrodeposition of gold from iodine leaching solution through single-factor testing and explores the influence of gold concentration in catholyte, mass fraction of iodine in anolyte, anolyte n(I2):n(I−), cell voltage, and electrolysis time on the percentage of gold deposition and coulombic efficiency. Moreover, a response surface methodology was adopted to study interactions among variables and influence on the percentage of gold deposition, with mass fraction of iodine in anolyte, anolyte n(I2):n(I−), and cell voltage as variable factors and percentage of gold deposition as the response value. The electrodeposition process was fitted via pseudo first-order kinetics and pseudo second-order kinetics. Finally, the free surface morphology of gold deposited on the cathode plate was observed by scanning electron microscope. Given the results, a principal effect relationship can be concluded between mass fraction of iodine in anolyte, anolyte n(I2):n(I−), cell voltage, and percentage of gold deposition, with cell voltage > anolyte n(I2):n(I−) > mass fraction of iodine in anolyte and a second-order regression equation obtained with percentage of gold deposition as the response value. The optimized process conditions were gold concentration in catholyte 20 mg/L, mass fraction of iodine in anolyte 0.59%, anolyte n(I2):n(I−) is 1:7.5, cell voltage 12.9 V, and electrolysis time 2 h. The average percentage of gold deposition of three confirmatory experiments was 96.43%, a figure very close to the predicted value of the model 97.76%, which proves that the quadratic polynomial model obtained by response surface methodology optimization is feasible and that the electrodeposition of gold process conforms to a pseudo second-order kinetic model. Au can be attached well to the cathode plate and the deposition layer is formed by granular grain accumulation.
1. Introduction
Iodine leaching of gold is a kind of halogen gold extraction method. The stability of the gold iodine complex formed by leaching of the gold reaction ranks only second to the gold cyanide complex [1], and the ligand in the leaching of the gold system remains stable in the range of 0–14 [2]. Hence, this method is expected to replace gold extraction by cyaniding. A key issue is how to efficiently recover the ionic gold in the leachate, but there has been little research carried out on the recovery of gold from iodine leaching solution up until now, with major recovery methods including zinc dust precipitation [3], activated carbon adsorption [4], ion exchange [5], solvent extraction [6], and the electrodeposition method [7]. The electrodeposition method is advantageous in its easy operation, low recovery cost, good selectivity, and high recovery rate.
A feasibility study on leachate processed by the electrodeposition method was conducted by the National Institute of Precious Metals Exploration in Moscow, Russia and according to the study, it was concluded that the experiment could not be performed unless concentration of the leachate increased by heating because the concentration of gold directly leached from raw ore was much lower than that obtained under laboratory conditions, and it could not be applied in production directly [8]. Hilson et al. [9] analyzed the thermodynamics of the electrodeposition of gold and found that the anodic reaction was mainly the oxidation reaction of iodide ions but that the cathodic reaction related to the hydrogen evolution reaction and the deposition reaction of metal ions. Syed et al. [10] tested and analyzed changes in material composition of the leachate before and after electrodeposition reaction and drew the conclusion that there was a small amount of copper and silver in the sediment, which indicated a cathodic reduction reaction involved in Cu2+ and Ag+, or, in other words, that the electrodeposition method played the role of impurity removal when processing the leachate. Chun et al. [11] performed electrodeposition of gold experiments on leachate after the leaching of gold. According to their results, the cell voltage was 4 V, the initial concentration of gold was not less than 40 mg/L, and the electrolysis time was 4–6 h, signifying that it was feasible to recover gold in the iodized leaching solution by the electrodeposition method, with significant effects. Qu et al. [12] firstly preprocessed non-purposive ions and then studied the influence of the mass fraction of iodine in anolyte, gold concentration in catholyte, cell voltage, and electrolysis time on the percentage of gold deposition, obtaining a gold recovery rate of over 95%. Sahin et al. [13] applied the electrodeposition method to processing gold-containing leachate, compared it with the activated carbon adsorption method from the perspective of energy consumption, and drew the conclusion that the economic cost of the electrodeposition method was only about half of that of the activated carbon adsorption method, which supported the former’s industrial application.
Although some researchers have studied the electrodeposition of gold process, comprehensive studies are still lacking on leachate with lower gold concentrations. In view of this, the authors of this paper, by regarding leachate with low concentrations of gold as a research object, explored the influence of gold concentration in catholyte, mass fraction of iodine in anolyte, n(I2):n(I−), cell voltage, and electrolysis time on the gold deposition effect. Subsequently, the test results were subject to a response surface methodology to optimize process conditions, and a regression model for the response surface of the electrodeposition of gold was established. Finally, SEM was adopted to study the free surface morphology and growth mode of the electrodeposited layer in order to provide a data reference for leachate processing of the iodine leaching process.
2. Experiment
2.1. Experimental Principles
In the cathode reaction, gold underwent a reduction reaction at the cathode of the electrolytic cell (Equation (1)) and was deposited on the surface of the cathode material, and water was electrolyzed to produce hydrogen (Equation (2)).
In the anode reaction, iodine ions in the cathode region entered the anode region through the anion exchange membrane and were oxidized at the anode to generate an iodine elementary substance (Equation (3)), which was accompanied by an oxygen evolution reaction (Equation (4)).
With this, the iodine ion concentration in the anode area continued to increase and to react with the excess potassium iodide (Equation (5)).
After the reaction, part of the iodine was deposited on the anode plate and part of that was circularly dissolved in the iodine solution.
2.2. Materials and Instruments
The reagents used were iodine and potassium iodide as analytic reagents and pure gold foil (99.99%). The test water was deionized water.
Instruments and equipment used were a AA-6880 atomic absorption spectrophotometer (Shimazu international trading Co. LTD, Shanghai, China), FA214 electronic scales (Haikang electronic instrument factory, Shanghai, China), a RXN-305D DC stabilized power supply (Zhaoxin electronic instrument equipment Co. LTD, Shenzhen, China), and a JSM-6510 scanning electron microscope (Japan Electron Optics Laboratory, Tokyo, Japan).
The experimental device used was an electrolytic cell which was a self-made rectangular composite material tank (12 cm × 8 cm × 9 cm) that was separated by an anion-exchange membrane, with the anode plate (graphite plate) and the cathode plate (titanium plate) connected to the positive pole and negative pole of the DC stabilized power supply, respectively.
2.3. Experimental Methods
Within the electrodeposition of gold experiment, an Au-I2-KI solution (50 mL) which was prepared by gold foil was poured into the cathode area of electrolytic cell and an iodine solution (50 mL) prepared by iodine and potassium iodide was poured into the anode area of electrolytic cell at room temperature (25 °C). The influence of gold concentration in catholyte, mass fraction of iodine in anolyte, n(I2):n(I−), cell voltage, and electrolysis time on the percentage of gold deposition and coulombic efficiency was observed. The atomic absorption spectrophotometer was used to measure gold content of the solution after deposition in the cathode area, and, later, the percentage of gold deposition (Equation (6)) and coulombic efficiency (Equation (7)) were calculated.
where η is the percentage of gold deposition (%), C0 is the gold concentration of the solution in the cathode area before electrolysis (mol/L), and C1 is the gold concentration of the solution in the cathode area after electrolysis (mol/L).
where φ is the coulombic efficiency (%), G is the actual gold precipitation of the cathode within t time (g), q is the electrochemical equivalent of gold, , I is the coulombic intensity (A), and t is the electrolysis time (h).
With regard to the design method of the response surface experiment, based on a single-factor test, the influencing factors during the electrodeposition of gold underwent a response surface experiment and were analyzed using Design-Expert 8.0.6 software (Stat-Ease, Minneapolis MN, USA) [14] and by applying a central composite design [15]. With mass fraction of iodine in anolyte, anolyte n(I2):n(I−), cell voltage, and electrolysis time as the variable factors and the percentage of gold deposition as the response value, the process conditions of the electrodeposition of gold in the iodized leaching solution were optimized via the experiment, in which there were three factors, three levels, and 17 experimental points in total, with the optimum process conditions obtained for the electrodeposition of gold.
With regard to the kinetic model, it was necessary to establish a first-order kinetic model and a second-order kinetic model in order to obtain the most matched kinetic model in accordance with the data point distribution of the kinetic models and the fitting effect.
With regard to the Au deposit observation, the cathode plate was removed after the reaction, samples were made, the free surface of the Au deposit was observed via SEM, and the formation mode of the Au deposit was analyzed.
3. Results and Discussion
3.1. Single-Factor Test
3.1.1. Influence of Gold Concentration in Catholyte on Percentage of Gold Deposition and Current Efficiency
Au-I2-KI solutions with different gold concentrations were prepared in order to investigate the influence of gold concentration in catholyte on gold deposition. Moreover, the electrodeposition of gold was tested for different gold concentrations under the conditions of mass fraction of iodine in anolyte 0.6%, anolyte n(I2):n(I−) 1:8, cell voltage 12 V, and electrolysis time 2 h. The test results are shown in Figure 1.
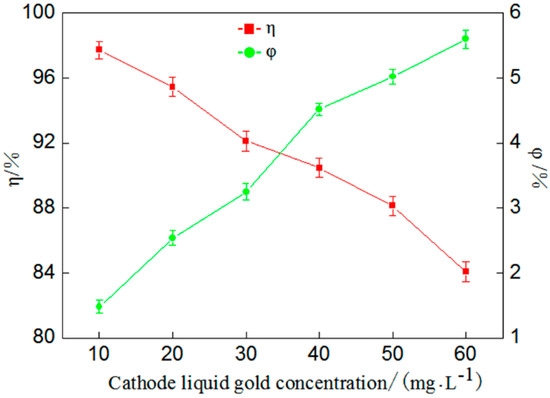
Figure 1.
Influence of gold concentration in catholyte on percentage of gold deposition (η) and coulombic efficiency (φ).
Figure 1 shows that with the increase of gold concentration in catholyte, the percentage of gold deposition seemingly linearly decrease. When the concentration increases from 10 mg/L to 60 mg/L, the percentage of gold deposition decreases from 97.72% to 84.08%, but coulombic efficiency displays a steadily rising trend with the increase of gold concentration in catholyte. This is because the higher the gold concentration in catholyte, the higher the I− concentration in the catholyte, and the longer the electrolysis time required to achieve maximized gold deposition. In other words, when the gold concentration in catholyte is high, most electric energy consumed by the cathodic reaction is used to deposit gold and the hydrogen evolution reaction lessens [16]. However, in actual leachate, the gold concentration was observed to be generally lower than 20 mg/L, so, after overall consideration, the following experiment was conduct by selecting a gold concentration of 20 mg/L.
3.1.2. Influence of Mass Fraction of Iodine in Anolyte on Percentage of Gold Deposition and Coulombic Efficiency
In order to study the influence of the mass fraction of iodine in anolyte on gold deposition, an experiment was carried out under the conditions of a gold concentration in catholyte of 20 mg/L, anolyte n(I2):n(I−) 1:8, cell voltage 12 V, and an electrolysis time of 2 h. Figure 2 shows the results.
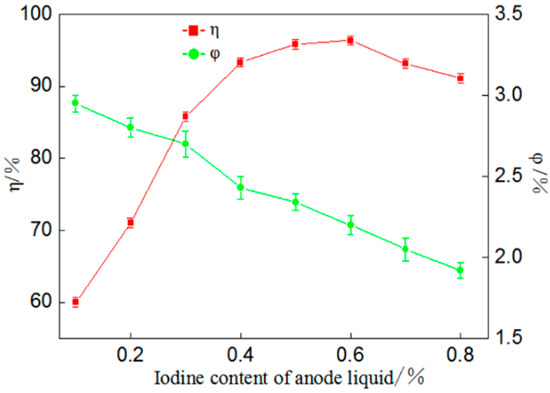
Figure 2.
Influence of mass fraction of iodine in anolyte on percentage of gold deposition (η) and coulombic efficiency (φ).
According to Figure 2, when the mass fraction of iodine in anolyte is from around 0.1% to around 0.6%, the percentage of gold deposition increases gradually, while when it is 0.1%, the percentage is merely 60.02%. This is because when the I2 amount is small in anolyte, the corresponding I− amount is also insufficient, producing a small coulombic flow into the cathode area and resulting in a slow redox reaction. When the mass fraction of iodine is 0.6%, the percentage of gold deposition reaches a maximum of 96.38%; if the mass fraction continues to increase, the percentage of gold deposition decreases gradually because when the iodine concentration of anode iodine is too high, the rate of I− and I3− in the cathode flowing into the anode area is reduced, causing gold dissolution in a catholyte-circular reaction of deposition and slowing down the gold deposition [17]. In summary, it is appropriate when the mass fraction of iodine is 0.6%.
3.1.3. Influence of Anolyte n(I2):n(I−) on Percentage of Gold Deposition and Coulombic Efficiency
In order to study the influence of anolyte n(I2):n(I−) on gold deposition an experiment was carried out under the conditions of a gold concentration in catholyte of 20 mg/L, mass fraction of iodine in anolyte 0.6%, cell voltage 12 V, and an electrolysis time of 2 h. Figure 3 shows the results.
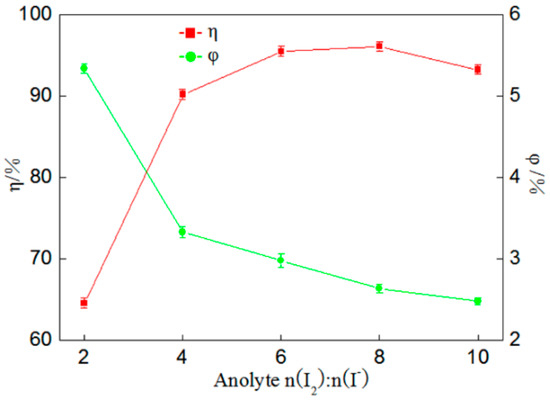
Figure 3.
Influence of anolyte n(I2):n(I−) on percentage of gold deposition (η) and coulombic efficiency (φ).
According to Figure 3, when anolyte n(I2):n(I−) is 1:2, the percentage of gold deposition is merely 64.59% because the anodic iodine solution acts as an electrolyte across the entire reaction. When there is less potassium iodide in the solution, the insufficient amount of iodine ions in anolyte after the reaction will slow down the rate of the oxidation reaction, affecting gold’s reduction deposition in the cathode area [18]. Moreover, the percentage of gold deposition continues to rise when the amount of potassium iodide is increased continuously; when n(I2):n(I−) is 1:8, the percentage of gold deposition reaches a maximum of 96.14%, but when the amount of KI is re-increased, a slight decline is found in the percentage of gold deposition. Across the entire process of gold sedimentation, the coulombic efficiency was observed to be similar to the above conclusions, with both occurring in a continuous downward trend. In other words, it is more appropriate when n(I2):n(I−) is 1:8.
3.1.4. Influence of Cell Voltage on Percentage of Gold Deposition and Coulombic Efficiency
Cell voltage was a key factor in processing gold-containing solutions by electrodeposition because it provided power for ion migration, which significantly affected the percentage of gold deposition. Hence, for the purpose of exploring the influence of cell voltage on gold deposition, other process conditions for the electrodeposition of gold needed to be the same as those mentioned above to perform the electrodeposition of gold experiment under different cell voltages. The test results are shown in Figure 4.
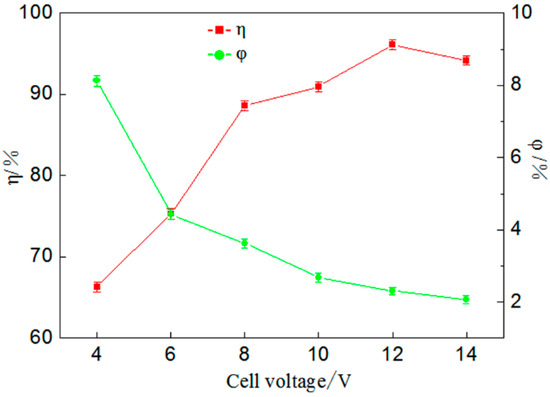
Figure 4.
Influence of cell voltage on percentage of gold deposition (η) and coulombic efficiency (φ).
Figure 4 shows that when cell voltage is enhanced from 4 V to 12 V the percentage of gold deposition increases from 66.34% to a maximum of 96.12%. If the cell voltage continues to increase, a decline trend is found for the percentage of gold deposition. During electrodeposition the reaction rate is affected by cell voltage directly but a key factor is the rate at which metal ions are transferred to cathode materials for the reduction deposition reaction. It can be concluded from the coulombic efficiency that coulombic efficiency decreases gradually with an increase in cell voltage; this occurs because the solution conducts electricity by ions and a larger voltage causes an electrical drop in the solution, reducing the conversion rate of electric energy. However, in practical applications, when a higher percentage of gold deposition is reached, it should reduce the cell voltage as much as possible, so as to reduce power loss and improve benefits.
3.1.5. Influence of Electrolysis Time on Percentage of Gold Deposition and Coulombic Efficiency
In order to study the influence of electrolysis time on gold deposition, the electrodeposition of gold was tested under the conditions of a gold concentration in catholyte of 20 mg/L, mass fraction of iodine in anolyte 0.6%, anolyte n(I2):n(I−) 1:8, and cell voltage 12 V. Figure 5 shows the results.
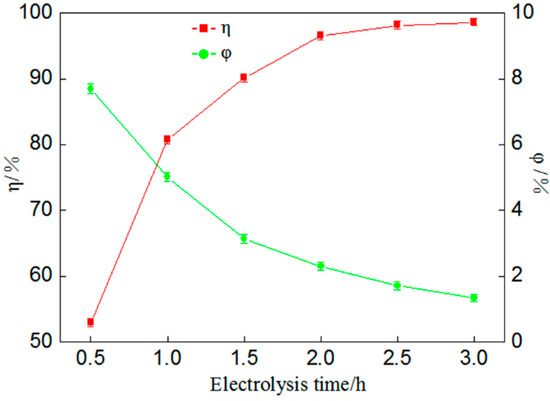
Figure 5.
Influence of electrolysis time on percentage of gold deposition (η) and coulombic efficiency (φ).
According to Figure 5, there is a negative correlation between the percentage of gold deposition and coulombic efficiency. With the increase in electrolysis time the percentage of gold deposition increases continuously, that is, the percentage of gold deposition can be improved effectively by increasing electrolysis time. However, it can be seen from the figure that the coulombic efficiency is reduced constantly because during the electrodeposition of gold, with a time increase, the hydrogen evolution reaction becomes gradually predominant and the electric energy consumed is much higher than that of gold deposition, resulting in a serious electrical energy loss. Meanwhile, it was found during the experiment that when anolyte n(I2):n(I−) was larger, the percentage of gold deposition could be enhanced by increasing electrolysis time, which made up for the lower I− concentration in the electrolyte.
3.2. Experiment of Response Surface Methodology Optimization
According to the single-factor test, the percentage of gold deposition was significantly affected by the mass fraction of iodine in anolyte, anolyte n(I2):n(I−), cell voltage, and electrolysis time. Hence, the authors of this work, in order to further analyze the significant influence of various factors and their interactions on the percentage of gold deposition, adopted a response surface methodology to optimize process conditions of electrodeposition of gold from the iodized leaching solution. The core of the experimental design was the optimal process conditions in the single-factor test, namely, a mass fraction of iodine in anolyte of 0.6%, anolyte n(I2):n(I−) 1:8, and cell voltage 12 V.
3.2.1. Experiment Design
Design-Expert 8.0.6 software was adopted to design a response surface test with three factors and three levels. An optimization experiment was carried out under the conditions of a gold concentration in catholyte of 20 mg/L and an electrolysis time of 2 h, with the percentage of gold deposition being the index. Table 1 gives the value of each factor and Table 2 provides the analytical schemes and test results of the response surface methodology.

Table 1.
Analytical factors and levels of the response surface methodology.
Table 2.
Analytical schemes and test results for the response surface methodology.
3.2.2. Regression Analysis of Response Surface Test Results
The response surface test was analyzed in accordance with the mass fraction of iodine in anolyte (A), anolyte n(I2):n(I−) (B), and cell voltage (C) listed as independent variables and the percentage of gold deposition as the response value. Table 3 gives the regression analysis results.
Table 3.
Regression analysis results.
With regard to Table 3, the p value refers to the significance of the factors’ influence, meaning the smaller the value, the more significant the influence. In this model, F = 34.98 and p < 0.0001 < 0.05, indicating that the model is extremely significant. However, there is a lack of fit when F = 4.93 and p > 0.05 and it is not significant, or, in other words, no lack of fit factors are in the experiment. Hence, the model can be used to predict realities. Within the model, AB, A2, B2, and C2 are significant influence factors, signifying that the mass fraction of iodine in anolyte, anolyte n(I2):n(I−), and cell voltage exert a significant influence on the percentage of gold deposition. Figure 6 illustrates the relationship between the predicted value and true value of the percentage of gold deposition. According to the figure most of the true values are on the predicted line and a few of them are distributed symmetrically on both sides of the predicted values with a relative error of less than 5%, implying that the model can describe the correlation between test factors and the percentage of gold deposition.
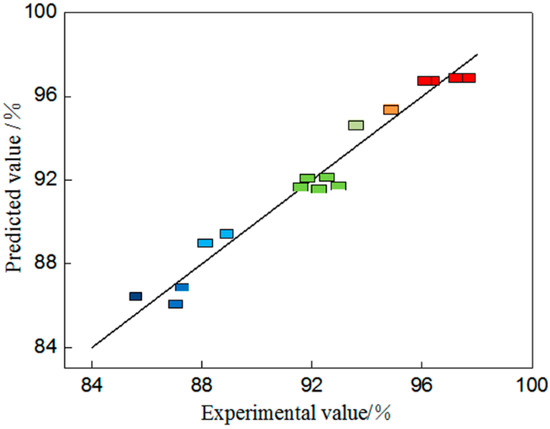
Figure 6.
Diagram of the relationship between predicted values and actual values.
The authors regressed and fit the response value of the percentage of gold deposition with all factors, obtaining the second-order regression equation Y = 95.81 − 1.13A − 1.26B + 2.52C − 1.20AB + 0.067AC − 0.42BC − 2.99A2 − 2.88B2 − 2.88C2.
According to the analysis of dependent variable variance in the regression equation model, the influences of the model’s monomial terms A (p = 0.0052), B (p = 0.0029), and C (p < 0.0001) were significant and so was that of interaction term AB (p = 0.0195); however, the influences of the interaction terms AC (p = 0.8704) and BC (p = 0.3301) were not significant and those of the quadratic terms A2 (p = 0.0001), B2 (p = 0.0001), and C2 (p = 0.0001) were extremely significant. This indicates interactions among mass fraction of iodine in anolyte, anolyte n(I2):n(I−), and cell voltage. According to the absolute values of the coefficients a = 1.13, b = 1.26, and c = 2.52, the principal effect relationship of factors could be concluded as cell voltage > anolyte n(I2):n(I−) > mass fraction of iodine in anolyte.
Figure 7 shows the response surfaces and contour maps of the percentage of gold deposition, through which the influence of interaction of each pair of factors on the gold deposition rate is displayed visually. The higher the response surface slope, the more significant the interaction, and vice versa. The outline of the contour map can visually reflect the degree of interaction between each pair of factors, with not significant interactions represented by a circular shape and significant interactions by an oval shape [19]. There exists an obvious interaction for every two factors out of three, ranging from significant to un-conspicuous, e.g., AB > BC > AC. Additionally, the percentage of gold deposition changes in a trend of initial increase and then decrease with increase in mass fraction of iodine in anolyte and cell voltage and decrease in anolyte n(I2):n(I−). Furthermore, the three-dimensional response surface is similar to a parabolic pattern and shows that the percentage of gold deposition reaches its maximum value around the apex. The maximum point can be found from the model, that is, the change rule of test results is consistent with that of the single-factor test results.
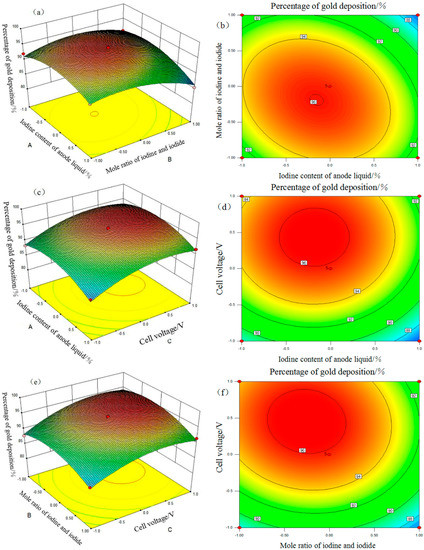
Figure 7.
Response surface and contour map for percentage of gold deposition. (a) AB response surface, (b) AB contour map, (c) AC response surface, (d) AC contour map, (e) BC response surface, and (f) BC contour map.
3.2.3. Condition Optimization of Response Surface and Verification Experiment
In order to verify that the model equation was feasible, the authors optimized the optimal test conditions of response surface for the experiment. The test results are given in Table 4. The predicated optimal process conditions for the model were mass fraction of iodine in anolyte 0.59%, anolyte n(I2):n(I−) 1:7.55, and cell voltage 12.91 V. It was predicted that the percentage of gold deposition could reach 97.76% under such conditions. Out of consideration for easy operation, the process conditions were corrected to those of mass fraction of iodine in anolyte 0.59%, anolyte n(I2):n(I−) 1:7.5, and cell voltage 12.9 V. Under these conditions, the percentages of gold deposition were 97.41%, 97.35%, and 97.53%, respectively, which were very close to the predicted values, following three verification experiments, with an average value of 97.43%. In the end, it proved feasible that the response surface optimization simulated electrodeposition of gold process conditions from the iodized leaching solution.
Table 4.
Verification results of response surface optimization.
3.3. Electrodeposition of Gold in Actual Iodine Leaching Solution
The main components and contents of the iodized gold solution were analyzed (Table 5) and the leaching solution was filtered. Based on the above test results, the process conditions were summarized as mass fraction of iodine in the anolyte 0.6%, anolyte n(I2): n(I−) 1:8, and cell voltage 12 V; Figure 8 refers to the gold deposition effect in the actual iodine leaching solution.
Table 5.
Changes in the content of main metals.
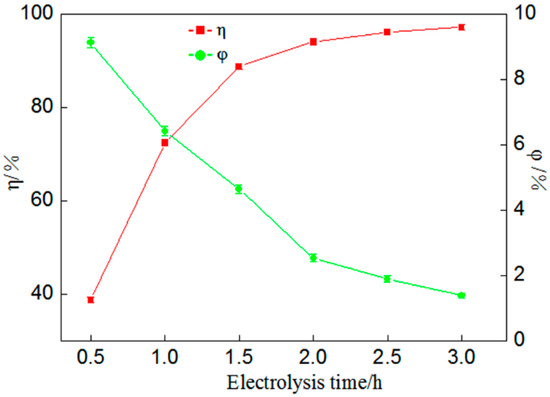
Figure 8.
Effect of actual iodine leaching solution electrodeposition of gold (percentage of gold deposition η, coulombic efficiency φ).
Figure 8 shows that after electrolysis for 2 h the percentage of gold deposition and coulombic efficiency were 94.02% and 2.53%, respectively. Compared with the simulated test, the difference in percentage of gold deposition effect was slightly lower but it could still reach over 94%, proving that it was feasible to recover gold from the actual iodine leaching solution by the method of electrodeposition. However, there were still problems of low coulombic efficiency, mainly for two reasons. Firstly, as can be seen from Figure 8, coulombic efficiency and gold deposition rate were basically negatively correlated. With the increase in electrolysis time, coulombic efficiency decreased continuously. With the continuous reaction, the gold concentration in the solution gradually decreased and the hydrogen evolution reaction gradually occupied the main position. The electric energy consumed was much higher than that used for gold deposition, resulting in severe electric energy loss. Secondly, the self-developed electrolyzer device has a problem regarding large resistance, mainly due to the large resistance between the power source and the connecting material of the two poles. The solutions to the above two causes of low coulombic efficiency are firstly to find or prepare a cathode material that can inhibit hydrogen evolution without affecting gold deposition, such as modified carbon fiber materials, and secondly to optimize the design of the electrolyzer to avoid or reduce the use of connection materials with excessive resistance.
3.4. Analysis of Electrodeposited Au Free Surface Microstructure
SEM was used to observe the gold deposition layer on the cathode plate after 2 h of electrolysis (as discussed in Section 3.3), as shown in Figure 9. It can be seen that the Au on the cathode board has granular solid adhesion and that the sediment surface is not smooth; at the same time, there are some irregularly shaped holes and circular holes and by the edge of the sediments can be seen the mode of production for irregular granular grain accumulation. It can also be observed that obvious growth dendrites exist on the side wall of holes formed at the boundary of the triangle grain and that there are many cracks of different sizes on the free surface of the deposit layer; in other words, the Au deposit layer is far from compact.
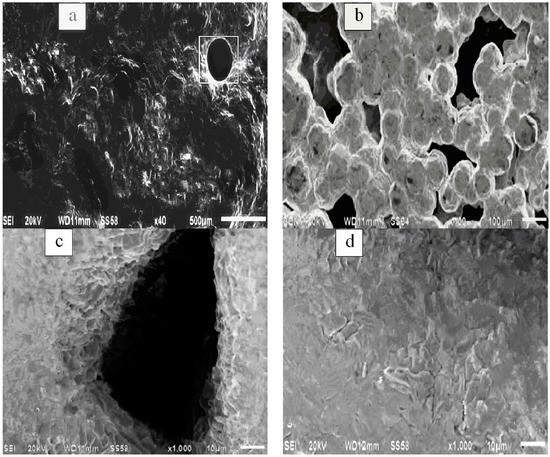
Figure 9.
Surface microtopography of Au sediments. (a) 40-fold topography, (b) edge of sample, (c) hole, and (d) cracks.
The free surface of Au deposition is not smooth; this may have been caused by irregular crystal nucleus formation and lattice growth of Au atoms on the cathode plate due to coulombic instability during the reaction [20]. In addition, there are round pores and holes on the free surface of the sedimentary layer which were mainly caused by gas introduction and an excessive hydrogen evolution reaction on the cathode plate. Meanwhile, during the reduction and crystallization of Au atoms, gaps at the triangle grain boundary were gradually wrapped in the deposition, thus forming holes. The original dendrites were also retained in the hole wall. Cracks on the surface of the sedimentary layer can be attributed to the interaction between expansion and compaction stress caused by the decrease in surface energy due to Au lattice agglomeration [21].
3.5. Kinetic Analysis of Electrodeposition Reaction
The pseudo first-order reaction kinetics model and the second-order reaction kinetics model are commonly used models for simulation analysis of solid-liquid systems, as shown in Equations (8) and (9), respectively.
where qe and qt are the gold deposit amount (mg) at equilibrium time and t time, respectively; t is the deposition time (min); and and are the deposition rates (min−1).
The above two kinetic equations were adopted for data fitting, as shown in Figure 10. Table 6 outlines the fitting parameters of the two models.
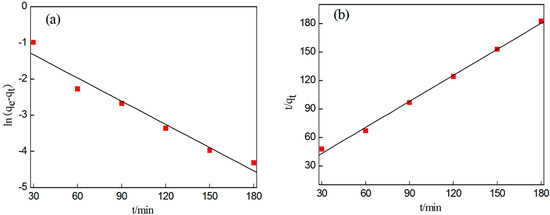
Figure 10.
Fitting of kinetic models. (a) First-order kinetic model. (b) Second-order kinetic model.
Table 6.
Fitting parameters of kinetic models (qe: the gold deposit amount (mg) at equilibrium time; k1: the deposition rate of model (a); k2: the deposition rate of model (b); R2: correlation coefficient).
According to Figure 10a,b, the data points of the first-order kinetic model are not distributed evenly, meaning the fitting effect is not ideal, while for the second-order kinetic model the points are distributed evenly, producing a good fitting effect.
Table 6 shows that the correlation coefficient of the pseudo first-order kinetic model R2 = 0.949 is smaller than that of the pseudo second-order kinetic model R2 = 0.995; this is because all factors affecting the percentage of gold deposition are included in the pseudo second-order reaction kinetic model, which can better describe gold deposition during electrodeposition.
4. Conclusions
In this paper, the electrodeposition method was used to deposit gold from an iodized leaching solution. The conclusions which have been drawn are given below.
(1) According to the single-factor condition test, there is gold concentration in catholyte from around 10 to around 30 mg/L, mass fraction of iodine in anolyte from around 0.4% to around 0.7%, anolyte n(I2):n(I−) from around 1:6 to around 1:8, cell voltage from around 10 to around 14 V, and electrolysis time from around 2 to around 3 h.
(2) A principal effect relationship of three factors was obtained by a response surface method as follows: cell voltage > anolyte n(I2):n(I−) > mass fraction of iodine in anolyte. The optimal process conditions were found to be gold concentration in catholyte 20 mg/L, mass fraction of iodine in anolyte 0.59%, anolyte n(I2):n(I−) 1:7.5, cell voltage 12.9 V, and electrolysis time 2 h. The actual value of the percentage of gold deposition was 97.43%, a figure which is very close to the predicted value of the model of 97.76%.
(3) The electrodeposition method was used to deposit gold from the actual iodized leaching solution. The percentages of gold deposition and coulombic efficiency were 94.02% and 2.53%, respectively, which prove to be feasible in practical applications. This method has the advantages of a high percentage of gold deposition, simple operation, and green environment protection; its disadvantage is the low coulombic effect in the reaction process.
(4) The surface of the Au deposit is relatively loose and rough, with pores, holes, and cracks. The deposit is formed by irregular accumulation of granular grains.
(5) According to the kinetic models, the electrodeposition of gold reaction conforms to the second-order kinetic model, which had a correlation coefficient of 0.995 and can better describe gold deposition during electrodeposition.
Author Contributions
Conceptualization, Q.M. and G.L.; data curation, Q.M., G.L., H.K., and H.W.; formal analysis, Q.M. and X.Y.; investigation, G.L. and D.X.; software, H.K.; supervision, X.Y.; writing—original draft, Q.M.; writing-review and editing, Q.M. All authors have read and agreed to the published version of the manuscript.
Funding
This work was jointly supported by the National Natural Science Foundation of China (51674110).
Conflicts of Interest
The authors declare that there is no conflict of interest.
References
- Xia, W.H.; Bao, S.C.; Ying, L.S.; Feng, F.P.; Guo, S.Y.; Liang, L.; Qing, X.W. Study on gold concentrate leaching by iodine-iodide. Int. J. Min. Met. Mater. 2013, 4, 323–328. [Google Scholar] [CrossRef]
- Dan, C.; Wu, Z.N.; Xiao, W.P.; Hui, Z.D.; Jia, X.Y. Copper Recovery from Artificial Bioleaching Lixivium of Waste Printed Circuit Boards. Environ. Sci. 2014, 4, 1391–1398. [Google Scholar] [CrossRef]
- Tong, M.W.; Kun, G.L.; Fang, D.; Long, C. Situations of Leaching and Replacement of Gold in Acidic Thiourea Solution. Hydrometall. China 2017, 4, 257–261. [Google Scholar] [CrossRef]
- Mooki, B.; Hyunju, L.; Sookyung, K.; Kyoungkeun, Y. Destruction of Cyanide and Removal of Copper from Waste Printed Circuit Boards Leach Solution Using Electro-Generated Hypochlorite Followed by Magnetite Adsorption. Metals 2019, 9, 963. [Google Scholar] [CrossRef]
- Peng, Z.; Gang, L.Q.; Yang, L.Z.; Qing, Z.G.; Ying, C.Z.; Juan, G.W. Removal of impurities from scandium solutions by ion exchange. J. Cent. South Univ. 2018, 12, 2953–2961. [Google Scholar] [CrossRef]
- Jun, C.M.; Xiu, H.J.; Oladele, A.O.; Ming, Z.N.; Min, W.Y. Comparative study on copper leaching from waste printed circuit boards by typical ionic liquid acids. Waste Manag. 2015, 7, 142–147. [Google Scholar] [CrossRef]
- Yakornov, S.A.; Naumov, K.D.; Lobanov, V.G.; Kozlov, P.A.; Zelyakh, D.; Krutikov, I.M.; Skopin, D.Y.; Ivakin, D.A. Use of Electrolytic Zinc Powder for Cementation of Gold from Cyanide Solutions. Metallurgist 2018, 9, 456–463. [Google Scholar] [CrossRef]
- Aliprandi, A.; Fausto, A.; Quarenghi, M.; Modestino, S.; Randelli, P.; Sardanelli, F. One-shot CT and MR arthrography of the shoulder with a mixture of iodinated and paramagnetic contrast agents using arthroscopy as a gold standard. Radiol. Med. 2006, 1, 53–60. [Google Scholar] [CrossRef] [PubMed]
- Hilson, G.; Monhemius, A.J. Alternatives to cyanide in the gold mining industry: What prospects for the future. J. Clean. Prod. 2006, 14, 1158–1167. [Google Scholar] [CrossRef]
- Syed, S. Recovery of gold from secondary sources—A review. Hydrometallurgy 2012, 3, 30–51. [Google Scholar] [CrossRef]
- Chun, L.G.; Feng, J.S.; Ping, W.H. Study on extraction of Gold from leaching solution and method of iodine Regeneration during iodized leaching of Gold. Min. Metall. Eng. 2006, 3, 42–47. [Google Scholar]
- Qu, X.; Hui, C.D.; Liang, C.; Hong, H.M. Electrodepositing gold of iodine leaching solution from waste printed circuit board. Chin. J. Nonferrous Met. 2009, 6, 1130–1135. [Google Scholar] [CrossRef]
- Sahin, M.; Akcil, A.; Erust, C.; Altynbek, S.; Ganhan, C.S.; Tuncuk, A. A Potential Alternative for Precious Metal Recovery from E-waste:Iodine Leaching. Sep. Sci. Technol. 2015, 16, 1520–5754. [Google Scholar] [CrossRef]
- Aziz, D.; Shafaei, S.Z.; Nnaparast, M.; Abdollahi, H. Modeling and optimization of low-grade Mn bearing ore leaching using response surface methodology and central composite rotatable design. Trans. Nonferrous Met. Soc. China 2012, 9, 2298. [Google Scholar] [CrossRef]
- Bing, Q.Y. Experimental Design and Data Processing; China University of Science and Technology Press: Hefei, China, 2008. [Google Scholar]
- Iadhav, U.; Su, C.; Cheng, H.H. Leaching of metals from large pieces of printed circuit boards using citric acid and hydrogen peroxide. Environ. Sci. Pollut. Res. Int. 2016, 23, 24384–24392. [Google Scholar] [CrossRef]
- Xia, P.Z. Study on the Leaching of Gold by Iodization; East China University of Technology: Shanghai, China, 2012. [Google Scholar]
- Behnamfard, A.; Salarirad, M.M.; Veglio, F. Process development for recovery of copper and precious metals from waste printed circuit boards with emphasize on palladium and gold leaching and precipitation. Waste Manag. 2013, 11, 2354–2363. [Google Scholar] [CrossRef] [PubMed]
- Lucas, G.O.; Anderson, P.P.; Pedro, P.B.; Joao, R.F.; Sebastiao, C.C.; Paulo, H.S.; Ma, Z.; Yang, H. Response surface methodology for advanced manufacturing technology optimization: Theoretical fundamentals, practical guidelines, and survey literature review. Int. J. Adv. Manuf. Technol. 2015, 7, 2391–2397. [Google Scholar] [CrossRef]
- Xia, W.; Ming, W.S.; Honh, L.; Jie, M.X.; Chang, L.A.; Ting, L. Study on Microstructure and texture of Electrolytic High Pure Gold. Adv. Chin. J. Rare Met. 2019, 11, 230–237. [Google Scholar] [CrossRef]
- Hao, C.K.; Shouh, C.J.; Wen, L.T.; Tsung, L.P. Engineering surface lattice resonance of elliptical gold nanodisk array for enhanced strain sensing. Opt. Express 2018, 2, 33215–33225. [Google Scholar] [CrossRef]
© 2019 by the authors. Licensee MDPI, Basel, Switzerland. This article is an open access article distributed under the terms and conditions of the Creative Commons Attribution (CC BY) license (http://creativecommons.org/licenses/by/4.0/).