Abstract
This work investigated crystallographic textures and the features of a flow localization band in a forged Ti6242S billet. The flow localization band experienced a large strain and grains within it were elongated under shear stress. The main macrotextural components were made up of (110)/<100>, <0002>/axial direction, and a static recrystallization texture (110)/(302), which can be explained by motion of a prismatic <a> slip system and a newly proposed method of projection. Finally, three types of macrozone, each with a sharp defined texture were observed and subsequently, it was demonstrated that the formation of macrozones was only connected with parameters of thermomechanical processing and was independent of variants selection.
1. Introduction
Titanium and titanium alloys are crucial aeronautical materials, which are widely used in jet engine and aircraft skin construction because of their high weight-to-strength ratio and excellent mechanical properties, such as resistance to corrosion, creep properties and fracture toughness [1,2,3]. Among these alloys, the near-α titanium alloys, for instance, Ti6242S, Ti60, IMI834 and Ti1100, are usually applied as the high-temperature parts of a jet engine [2,4,5,6,7]. In these high-temperature titanium alloys 6% Al is added to act as an α stabilizing element. When near-α titanium alloys experience load in the temperature range of 550–650 °C, Ti3Al particles, which are effective barriers of dislocation glide and climb, are precipitated, and thus improving the fracture toughness and creep properties significantly [2]. In general, the mechanical properties of titanium alloys are determined by microstructure and crystallographic texture [8]. In order to obtain desirable microstructure, the hot-working processes of titanium and its alloys usually contain forging above β-transus, thermomechanical processing (TMP) within α+β phase field temperature and a finally reasonable heat treatment [3,9,10]. Generally speaking, excellent mechanical properties can be attained if titanium alloys possess uniformly fine microstructure and random texture. However, it is difficult, despite many efforts to optimize the process window, to obtain a homogeneous microstructure and random texture [11,12]. Over the years, heterogeneous microstructure with regions of aligned αp grains with near-crystallographic orientation were easily found in bulk billets or disks of near-α titanium alloys [3,9,13,14]. These regions, named macrozones, serve as the fatigue crack initiation sites and may strongly reduce the fatigue lifetime of near-α titanium alloys [13]. Meanwhile, various studies of flow localization bands development in titanium alloys during forging have been performed [15,16,17]. However, the specific characteristics these features have not been characterized using electron back scatter diffraction (EBSD).
Because of the strong anisotropy of HCP structure, the mechanical properties of titanium alloys are significantly impacted by texture. Previous research has shown that if the c-axis of texture is parallel to the loading direction, the strength could be improved. Opposite results can be obtained when c-axis of texture is parallel to the loading direction [4,18,19]. Consequently a deep understanding of texture variation across cross sections of titanium alloys is crucial to the designers of these materials.
In the current study, the flow localization band and texture characterizations of a Ti6242S billet were analyzed carefully by optical microscopy (OM), X-ray diffractometry (XRD) and EBSD technology. Combined with the TMP, we provide insights necessary for a deeper understanding about the microstructure and texture evolution during forging.
2. Experimental Procedure
2.1. The Received Material
The material in this study was received as a Φ250 × 60 mm billet of Ti6242S provided by the Northwest Institute for Nonferrous Metal Research (Xi’an, China). The cast was performed by three vacuum arc melting method. Then it was cogged at 1180 °C. After cogging, initial forging operations took place above β-transus (βT) to break up the coarse ingot structure. In order to refine prior β grains, and further obtain finer α phase lamellar by β→α, the material was forged seven times above βT. The second forging took place within α+β phase field. The material was forged six times so that homogeneous microstructure could form, the forging temperature below βT of 50 °C was selected; the details of the forging process are displayed in Figure 1. It is worth noting that the alloy went through three upsetting and three drawing for each time it is forged, and after each pass, the sample was cooled to room temperature and then forging repeatedly. In the final pass of forging, the billet must be kept rotating around the axis. The βT of this alloy was determined to be 1009 ± 10 °C by means of the metallographic method.
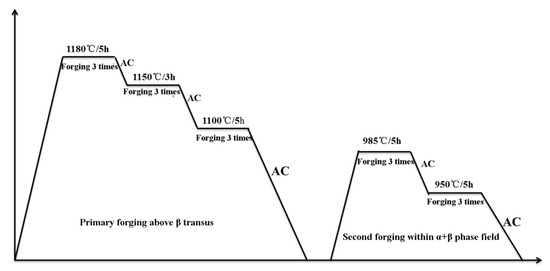
Figure 1.
The details of the forging process of the Ti6242S alloy used in this study. The main parameters included temperature, soaking time, and cooling process. AC, air cooling.
2.2. Measurement of Microstructure and Macrotexture
A sample 65 mm away from the center of a transverse cross section was cut off in this billet. The three-dimensional size was 20 mm × 10 mm × 10 mm. The sample was polished using standard metallographic methods until it became a mirror. The polished surface was then etched by a mixture of nitric acid, hydrofluoric acid and water with the proportion of (HNO3):(HF):(H2O) = 1:3:20 for 30 s. Microstructure was examined by OM. After examination, the sample was re-polished to eliminate the corrosion layer leaved by reagent, if present. Then, texture was measured using a Bruker D8 (Bruker AXS GmbH, Karlsruhe, Germany) advanced X-Ray Diffractometer (XRD) with Cu target. Five pole figures, (0002), (100), (101), (110), (102) were obtained. The texture analysis was carried out on TEXEval 2.5 software (Bruker AXS GmbH, Karlsruhe, Germany) [20].
2.3. EBSD Tests
In order to further investigate feature of microstructure and microtexture. The EBSD tests were carried on MAIA3 high-resolution field emission scanning electron microscopy (FE-SEM) with an EBSD detector (TESCAN, Shanghai, China). The scanning area was conducted by step size of 2.17 µm. HKL Channel 5 software (Oxford company, Abingdon-on-Thames, UK) was used to post-process the data collected by EBSD (see: http://www.51haocai.cn/product-624.html). The EBSD test sample was mechanically polished until no scracthes were present. Then, the stress layer of sample surface was removed by ion-etching equipment, so that high-quality diffraction pattern of backscattered electron could be attained.
3. Results
3.1. Characterization of Microstructure
The metallographic results are shown in Figure 2. It can be seen that the microstructures are mainly composed of primary equiaxed primary α grains (αp) and lath-shaped β-transformed structures (αs). The αs laths formed colonies and were separated by thinner β phases, as is demonstrated in Figure 2a. Meanwhile, the flow localization band, which can be attributed to the low thermal conductivity of titanium alloys and higher strain rate during forging, formed inside the Ti6242S alloy, as shown in Figure 2b [21]. Compared with other regions, the αp grains were significantly elongated under highly concentrated shear deformation.
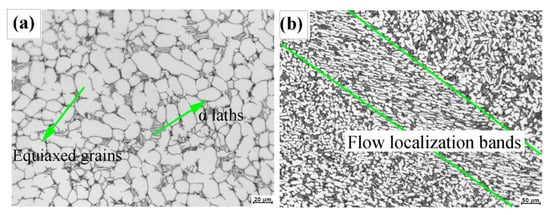
Figure 2.
Microstructural characteristics of the Ti6242S alloy billet: (a) 500 times magnification, αp and αs phases indicated by green arrows; (b) 200 times magnification; the flow localization band (boxed by two green lines).
3.2. Crystallographic Orientation Distribution
3.2.1. Results of XRD
The macrotexture results measured by XRD are displayed in Figure 3. For α-Ti, texture was characterized by {0002} and {110} pole figures. Three texture components (A, B, C) were observed. The A component lay in RD1 (an arbitrary perpendicular radial directions of the billet) with maximum intensity of 1.99 times of the random texture; its Miller index was (110)/<100>. Texture B indicated that the c-axis was parallel to ED (the elongated axis) and has the maximum intensity of 1.88 times that of random texture, its Miller index is <0002>//ED. Components of both A and B are classical B/T type textures in rolling titanium alloys [3,19]. But beyond them, a weak texture component C come into being and lay in the 45° direction relative to RD1 and RD2 (the latter the radial directions that is perpendicular to RD1) with a maximum intensity of 1.34 times of random texture, the Miller index is (110)[302]. The results show that the main texture components obtained by XRD are similar to the B/T type texture of rolling titanium alloys plates.
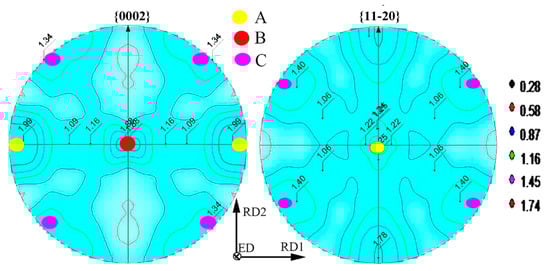
Figure 3.
The results of texture component measured by XRD, RD1 and RD2 indicate the two arbitrary perpendicular radial directions; ED is the longitudinal axis of the billet.
3.2.2. Results of EBSD
Figure 4 shows the inverse pole figure (IPF), band contrast (BC) maps and pole figures of the billet measured by EBSD. Ten sub-regions can be separated according to color distribution of IPF map. Besides region 5, in which the crystallographic orientation of equixaial grains had dispersed alignment, all of the other regions were covered by similar color, the so-called macrozones in titanium alloys. These regions show a sharp texture with the c-axis of the αp grains aligned to a specific direction with respect to RD1–RD2 except regions 6, 8 and 10, which were covered by green and have their <110>//ED. The aligning directions vary from one macrozone to another randomly. Grains within regions 2 and 3 were elongated significantly and they are interpreted as the flow localization band. The result of microtexture in the whole scanning area demonstrates that the c-axis is oriented at about 30° from the RD1–RD2 plane.
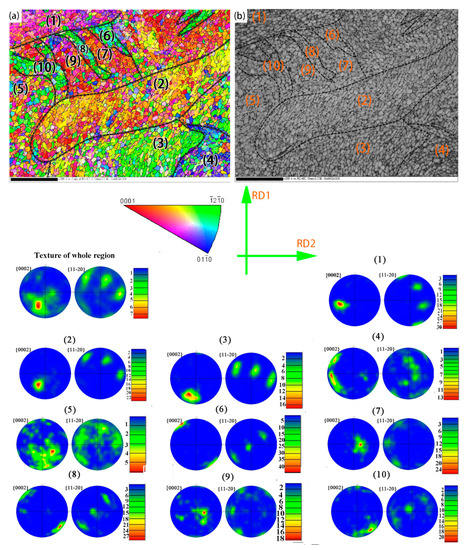
Figure 4.
The characterization of the Ti6242S billet characterized by EBSD: (a) IPF and (b) BC maps of the RD1–RD2 plane in cross section. The maps can be divided into ten sub-regions (1–10). The corresponding pole figure of the whole scanning region is displayed below the IPF maps. Pole figures of subregions 1–10 are displayed below. The triangular color key corresponds to the IPF map. The coordinate system indicates the two arbitrary perpendicular radial directions (RD1 and RD2) in all maps and pole figures.
4. Analysis and Discussion
In present work, the processing stages of the Ti6242S titanium alloy contained hot-working in β and α+β phase field temperature respectively. After forging above βT temperature, lamellar αp grains were generated by β→α, then the forging processes within α+β phase fields temperature were performed to break up the αp laths. Dynamic recrystallization (DRX) occurred at the same time, which induced the formation of equiaxed αp grains. Generally, αp grains in transverse cross section reflect the projection of αp grains in longitudinal section, which have a strong tendency to contain the minor axis of αp grains. Hence, most of αp grains in transverse cross section were equiaxially shaped. Davies [9] also came to the same conclusion. The αs laths are from the β→α transformation after cooling.
During forging in two phase field temperatures, the αp colonies were broken up and DRX occurred under stress. Thus the αp laths transformed into equixaial αp grains. In the present work, it was observed that macrozones formed during the process; Gey and Prakash reported that for bimodal titanium alloys, the development of macrozones was related to the TMP and αs variants selection during β→α phase transformation [22,23]. However, the Ti6242S billet was forged in low α/β temperature in the present work, so the volume fraction of αs laths formed by β→α after cooling can be ignored, as demonstrated in Figure 2. Hence, macrozone formation was only connected with parameters of TMP and was independent of variant selection. During forging in α/β, the primary αp grains developed sharp local texture heterogeneities under the motion of the slip system. Gey further concluded that αp laths belonging to same colony deformed similarly and the DRX had no obvious effect on the orientation of αp laths during forging [22,24]. Therefore, the macrozones formed, and their size may be associated with the prior β grains [23,24].
In addition, a flow localization band appeared, which implies that local metal flow concentrated on this area [21,25]. Its presence within the billet was further elaborated by EBSD. Regions of 2 and 3 of Figure 4 were identified as flow localization bands; it can be seen that overall, the c-axis of the majority of α grains were aligned to one direction (about 30°from RD1 to RD2) in this region. In order to further explore the characterization of the flow localization band, kernel average misorientation (KAM) was used to investigate the geometric dislocation densities (GNDs) which could represent local strain of different areas, as is seen in Figure 5. The GND density of all 10 regions have been calculated by ρGND = [26], where ρGND is the GND density at the point of interest; Δθi represents the local misorientation; μ is the unit length of the point (100 nm); b is the Burger’s vector. The calculated GND results of all regions are listed in Table 1. The flow localization bands, especially region 2, possess higher local misorientation level, as the geometric dislocation densities (GNDs) within it are larger compared with other regions. Therefore, the localization flow bands experienced larger strain during forging. Because of the poor thermal conductivity of titanium alloys, the heat generated by deformation inside titanium alloys cannot be released quickly under the high strain rates and thus the energy becomes concentrated in a region. As a result, the thermal softening effect along the shear direction becomes concentrated within a narrow area by adiabatic temperature rise, making shear deformation focus on this region and forming flow localization band [21,25].
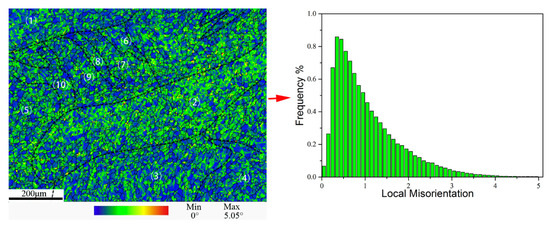
Figure 5.
Kernel average misorientation (KAM) figure of scanning area and the local misorientation distribution map.

Table 1.
The calculated GNDs of ten subregions of (1–10) obtained by EBSD.
After the initial β forging, a lamellar αp microstructure formed by β→α transformation. Since the cooling process obeys Burger’s orientation relationship (BOR), the main misorientations between neighboring α colonies should be focused on nearby 10°, 60° and 90° [13,27]. Furthermore, the material experienced deformation in the α+β phase field, which disrupted the BOR among α plates, and many low angle boundaries (LABs) appeared in deformed grains, as is seen in Figure 6. It can be observed that the LABs are mainly situated inside α grains. It is also particularly interesting to find that the LABs within flow localization band have larger density, which suggests that the flow localization band is filled with deformable grains.
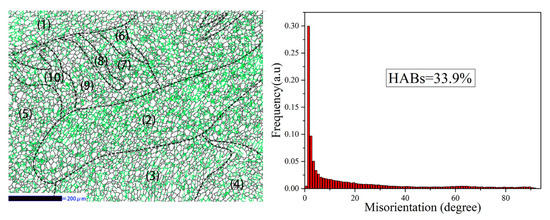
Figure 6.
Distribution of grain boundary misorientation in the Ti6242S billet; green lines represent the low angle boundaries (LABs) (0–15°) but the high angle boundaries (HABs) (>15°) were indicated by black lines. The right map shows the statistical distribution of misorientation among grain boundaries.
Generally, owing to the larger scanning area (about 7 mm × 7 mm) and deeper penetration depth of X-ray compared with backscattered electrons, the texture results obtained by XRD tests have greater statistical significance. By comparison, EBSD is more suitable for measurement of microtexture. The orientation evolution is strongly connected with the movement of the slip system during deformation. For the α-Ti structure, the c/a ratio is about 1.587, which is less than the c/a ratio of idea HCP, accordingly, the prismatic <a> slip governed the deformation during forging [13,28,29]. For the transverse cross section, it should be noted that during production of the billet, metal must flow along with the direction of the ED, and meanwhile the billet was rotated during forging, thus the transverse cross section accepted strain from many directions. However, regardless of how the billet was loaded, the plastic deformation was completed by movement of the slip system during forging. Figure 7 shows the corresponding in-grain misorientation axis analysis with the misorientation in the range of 1–7° within the EBSD scanned area, and the Schmid factor distribution of prismatic and basal <a> slip are also displayed. It can be seen that <0001> pole has the maximum density and the value of Schmid factors of the prismatic <a> slip system was concentrated in the range of 0.38–0.48, which implies that the prismatic <a> slip was more favorable to the development of texture and, also led to the increase of misorientation between adjacent grains.
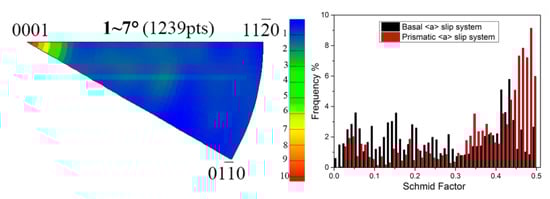
Figure 7.
The corresponding in-grain misorientation axis analysis with misorientations in the range of 5–10° obtained by EBSD and the Schmid factor distribution of prismatic <a> and basal <a> slip.
It is not surprising that the (110)/<100> texture formed through motion of prismatic <a> slip system. However, <0002>/ED was also developed in the billet, which cannot be interpreted by the motion of the prismatic <a> slip system. Here, a new method was proposed to solve the problem. In actual production of the billet, metal must flow along ED. Thus, most of α grains were pushed along ED under the motion of the prismatic <a> slip system; meanwhile, the hard-oriented grains hold perpendicular to the ED. The method of projecting, as is seen in Figure 8, when the grains along longitudinal axis are projected onto the transverse cross section, hard-oriented grains correspond to the prismatic plane, whereas α grains arranged along the ED are projected to basal plane. Hence, projecting those of α grains that paralleled to ED into cross section, a texture of <0001>//ED was formed. It is also deduced that the equiaxed α grains have their texture because grains arranged along ED are more easily dynamically recrystallized. In fact, the spheroidizing process has a little effect on the crystal orientation of a same colony, thus by projecting, the c-axis of α grains are perpendicular to ED. Similarly, by projecting the hard-oriented α grains onto the plane of cross section, a (110)/<100> texture was obtained. Thus, the texture of A and B formed in this work can be explained by motion of prismatic <a> slip system and the projecting method. The C component was reported as the static recrystallization (SRX) texture component by Peng Lin [8]. It is unsurprising that the billet requires several hours to cool to room temperature after forging and hence, the SRX occurs. During slow cooling, some recrystallized nuclei, which have special crystallographic orientation with the deformation texture grew preferentially, and developed into SRX texture.
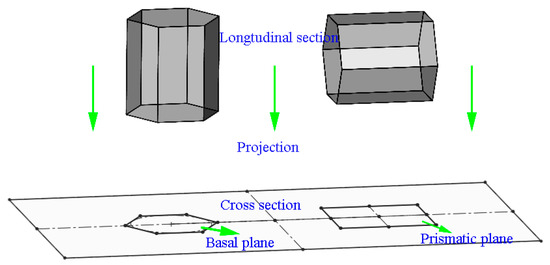
Figure 8.
Sketch map of the projection.
5. Conclusions
OM, XRD and EBSD were used to characterize the flow localization band and texture in a Ti6242S alloys billet after forging at the β single phase and α+β phase field temperature. With careful analysis, the following can be concluded:
- (1)
- The microstructures of this billet are mainly composed of primary equiaxed αp grains and secondary αs colonies. Using EBSD we found that the flow localization band underwent larger strain and contained a larger number of low-angle GBs. The grains within flow localization band were elongated significantly under shear stress.
- (2)
- Three types of macrozone, with sharply defined local texture were formed within the materials and the macrozone formation was only connected with parameters of TMP and was not related to variant selection.
- (3)
- The main texture components of the Ti6242 alloys are (110)/<100> and <0002>/ED in the billet. A weak static recrystallization texture component (110)[302] was also formed.
Author Contributions
G.Z. designed and supervised the project. B.T. performed experiments and analyzed the data. Q.Z. interpreted data and wrote the paper. X.M. assessed the outcomes. R.D. searched literature and processed the figures. All authors have read and agreed to the published version of the manuscript.
Funding
This work was financially supported by the National Key Research and Development Program of China (No. 2016YFB0701303).
Conflicts of Interest
The authors declare no conflict of interest. The funders had no role in the design of the study; in the collection, analyses, or interpretation of data; in the writing of the manuscript, or in the decision to publish the results”.
References
- Leyens, C.; Peters, M. Titanium and Titanium Alloys; Wiley Oline Library: Hoboken, NJ, USA, 2003. [Google Scholar]
- Lütjering, G.; Williams, C. Titanium; Springer: Berlin/Heidelberg, Germany, 2003. [Google Scholar]
- Warwick, J.; Texture, L. Microstructure and Deformation Mechanisms in Titanium Alloys. Ph.D. Thesis, Imperial College London, London, UK, 2001. [Google Scholar]
- Li, W.; Chen, Z.; Liu, J.; Wang, Q.; Sui, G. Effect of texture on anisotropy at 600 °C in a near-α titanium alloy Ti60. Mater. Sci. Eng. A 2017, 688, 322–329. [Google Scholar] [CrossRef]
- Rezaee, M.; Zarei-Hanzaki, A.; Ghambari, M.; Dastranjy Nezhadfar, P.; Ghasemi, E. Flow Characterization of a Duplex near α Ti6242 Alloy through Interrelation of Microstructural Evolution, 3D Activation Energy Map, and Processing Map. Adv. Eng. Mater. 2016, 18, 1075–1085. [Google Scholar] [CrossRef]
- Wisbey, A.; Kearns, M.W.; Partridge, P.G.; Bowen, A.W. Superplastic deformation and postformed mechanical properties of high temperature titanium alloy IMI 834. Mater. Sci. Technol. 1993, 7, 987–993. [Google Scholar] [CrossRef]
- Dalgaard, E.W.; Anjara, P.G.; Holipour, J.J.; Onas, J.J. Evolution of microstructure, microtexture and mechanical properties of linear friction welded IMI834. J. Metall. Mater. Sci. 2012, 51, 266–276. [Google Scholar]
- Lin, P.; Feng, A.; Yuan, S.; Li, G.; Shen, J. Microstructure and texture evolution of a near-a titanium alloy during hotdeformation. Mater. Sci. Eng. A 2013, 563, 16–20. [Google Scholar] [CrossRef]
- Davies, P.S. An Investigation of Microstructure and Texture Evolution in the Near-a Titanium Alloy Timetal® 834. Ph.D. Thesis, University of Sheffield, Sheffield, UK, 2009. [Google Scholar]
- Ma, F.; Lu, W.; Qin, J.; Zhang, D. Microstructure evolution of near-titanium alloys during thermomechanical processing. Mater. Sci. Eng. A 2006, 416, 59–65. [Google Scholar] [CrossRef]
- Mironov, S.; Murzinova, M.; Zherebtsov, S.; Salishchev, G.A. Microstructure evolution during warm working of Ti–6Al–4V with. Acta Mater. 2009, 57, 2470–2481. [Google Scholar] [CrossRef]
- Bieler, T.R.; Semiatin, S.L. The origins of heterogeneous deformation during primary hot working of Ti–6Al–4V. Int. J. Plast. 2002, 18, 1165–1189. [Google Scholar] [CrossRef]
- Zhao, Z.B.; Wang, Q.J.; Liu, J.R.; Yang, R. Characterizations of microstructure and crystallographic orientation in a near-a titanium alloy billet. J. Alloys Compd. 2017, 712, 179–184. [Google Scholar] [CrossRef]
- Nair, S.B. Effect of Thermomechanical Processing on Microstructure and Microtexture Evolution in Titanium Alloys. Ph.D. Thesis, Indian Institute of Science Bangalore, Bangalore, India, 2016. [Google Scholar]
- Seshacharyulu, T.; Medeiros, S.C.; Frazier, W.G.; Prasad, Y.V.R.K. Unstable flow during supratransus working of Ti–6Al–4V. Mater. Lett. 2001, 47, 133–139. [Google Scholar] [CrossRef]
- Fan, J.K.; Kou, H.C.; Lai, M.J.; Tang, B.; Chang, H.; Li, J.S. Characterization of hot deformation behavior of a new near beta titanium alloy: Ti-7333. Mater. Des. 2013, 49, 945–952. [Google Scholar] [CrossRef]
- Li, A.B.; Huang, L.J.; Meng, Q.Y.; Geng, L.; Cui, X.P. Hot working of Ti–6Al–3Mo–2Zr–0.3Si alloy with lamellar α+β starting structure using processing map. Mater. Des. 2009, 30, 1625–1631. [Google Scholar] [CrossRef]
- Zhao, Z.B.; Wang, Q.J.; Liu, J.R.; Yang, R. The Evolution of Parent β Texture and Its Effect on the αVariant Selection During Hot Working in Ti60 Alloy. Metal Mater. Trans. A 2018, 49, 4937–4946. [Google Scholar] [CrossRef]
- Tjering, G.L. Influence of processing on microstructure and mechanical properties of (α+β) titanium alloys. Mater. Sci. Eng. A 1998, 243, 32–45. [Google Scholar] [CrossRef]
- User Manual of TEXEval 2.5 Software; Bruker AXS GmbH: Karlsruhe, Germany, 2016.
- Huang, L.J.; Geng, L.; Li, A.B.; Cui, X.P.; Li, H.Z.; Wang, G.S. Characteristics of hot compression behavior of Ti–6.5Al–3.5Mo–1.5Zr–0.3Si alloy with an equiaxed microstructure. Mater. Sci. Eng. A 2009, 505, 134–143. [Google Scholar] [CrossRef]
- Gey, N.; Bocher, P.; Uta, E.; Germain, L.; Humbert, M. Texture and microtexture variatilons in a near-a titanium forged disk of bimodal microstructure. Acta Mater. 2012, 60, 2647–2655. [Google Scholar] [CrossRef]
- Prakash, D.G.L.; Honniball, P.; Rugg, D.; Withers, P.J.; da Fonseca, J.Q.; Preuss, M. The effect of β phase on microstructure and texture evolution during thermomechanical processing of α + β Ti alloy. Acta Mater. 2013, 61, 3200–3213. [Google Scholar] [CrossRef]
- Germain, L.; Gey, N.; Humbert, M.; Jahazi Bocher, P. Texture heterogeneities induced by subtransus processing of near α titanium alloys. Acta Mater. 2008, 56, 4298–4308. [Google Scholar] [CrossRef]
- Zeng, W.D.; Zhou, Y.; Zhou, J.; Yu, H.Q.; Zhang, X.M.; Xu, B. Recent development of processing map theory. RARE Met. Mater. Eng. 2006, 35, 673–677. [Google Scholar]
- Yan, Z.; Wang, D.; He, X.; Wang, W.; Zhang, H.; Dong, P.; Li, C.; Li, Y.; Zhou, J.; Liu, Z.; et al. Deformation behaviors and cyclic strength assessment of AZ31B magnesium alloy based on steady ratcheting effect. Mater. Sci. Eng. A 2018, 723, 212–220. [Google Scholar] [CrossRef]
- Zhao, Z.B.; Wang, Q.J.; Hu, Q.M.; Liu, J.R.; Yu, B.B.; Yang, R. Effect of β (110) texture intensity on α-variant selection and microstructure morphology during β→α phase transformation in near α titanium alloy. Acta Mater. 2017, 126, 372–382. [Google Scholar] [CrossRef]
- Xu, S.; Toth, L.S.; Schuman, C.; Lecomte, J.-S.; Barnett, M.R. Dislocation mediated variant selection for secondary twinning in compression of pure titanium. Acta Mater. 2017, 124, 59–70. [Google Scholar] [CrossRef]
- Fitzner, A.; Prakash, D.G.L.; da Fonseca, J.Q.; Thomas, M.; Zhang, S.-Y.; Kelleher, J.; Manuel, P.; Preuss, M. The effect of aluminium on twinning in binary alphatitanium. Acta Mater. 2016, 103, 341–351. [Google Scholar] [CrossRef]
© 2020 by the authors. Licensee MDPI, Basel, Switzerland. This article is an open access article distributed under the terms and conditions of the Creative Commons Attribution (CC BY) license (http://creativecommons.org/licenses/by/4.0/).