Article

Group Environment Questionnaire (GEQ): Validation in Mexican University Athletes

by
Faviola Corvera-Velarde
*,
Abril Cantú-Berrueto
,
Francisco Javier Mendoza-Farias
and
Jeanette M. López-Walle
Facultad de Organización Deportiva, Universidad Autónoma de Nuevo León, San Nicolás de los Garza 66455, Nuevo León, Mexico
*
Author to whom correspondence should be addressed.
Societies 2025, 15(9), 259; https://doi.org/10.3390/soc15090259
Submission received: 25 June 2025 / Revised: 28 August 2025 / Accepted: 12 September 2025 / Published: 16 September 2025
(This article belongs to the Special Issue Innovative and Multidisciplinary Approaches to Healthcare)

Abstract

From the psychology of sport, the impact of group cohesion on sports performance has been studied extensively; therefore, it is considered important to measure this variable to design interventions that improve collective work to achieve goals together. This study adapted and validated the Group Environment Questionnaire (GEQ) for Mexican university athletes. In a cross-sectional instrumental design, 226 athletes from various team sports completed the scale. Internal consistency statistics and confirmatory factor analyses Goodness-of-Fit Index (GFI), Comparative Fit Index (CFI), and Root Mean Square Error of Approximation (RMSEA) evaluated psychometrics. After removing three items with weak loadings, three structural models were tested as follows: (a) unidimensional, (b) task vs. social cohesion, and (c) attraction vs. integration. The unidimensional model showed the best fit (χ2 = 177.33; GFI = 0.90; CFI = 0.92; RMSEA = 0.07) and high reliability, indicating that cohesion can be treated as a single overarching construct. Task items exhibited higher consistency than social items. In conclusion, the adapted version of the GEQ is a useful tool for the evaluation of cohesion in Mexican university sports, although it is recommended to improve social items and expand its application in different disciplines and competitive levels.

1. Introduction

One of the topics widely debated in the literature is the cohesion of sports teams, since performance and team environment depend directly on it. According to the definition of cohesion, it is a “dynamic process that is reflected in the tendency for a group to stick together and remain united in the pursuit of its instrumental objectives and/or for the satisfaction of member affective needs” [1]. Carron et al. [2] proposed two main dimensions within the theory of task cohesion, which aims at the achievement of collective objectives and social cohesion, focusing on the emotional bonds between team members.
The conceptual model developed by Carron [3] differentiated between Group Integration and Attraction Individual Group. The first refers to how each member perceives the team as an entity, while the second is defined as the degree of desire of one to participate in the tasks and relationships of the team. These dimensions are categorized into social and task perspectives according to the integration and attraction of the group, which gives rise to four subdimensions: Group Integration-Task (GI-T), Group Integration-Social (GI-S), Individual Attraction to the Group-Task (ATG-T), and Individual Attraction to the Group-Social (ATG-S).
Teams with high cohesion tend to manifest better performance, as their members work together effectively to achieve common goals [4,5,6]. Communication is an important factor in this process, as it can help increase cohesion and therefore improve collective performance [7,8]; in addition, cohesion can also be affected by the individual, the group, and psychosocial factors [4,5]. Studies have found that cohesion influences team effectiveness; however, its impact may be conditioned by the quality of communication between team members [7,8]. Empathy among teammates turns out to be a determinant for cohesion, indicating that interpersonal relationships are key to developing a cohesive situation [7,8,9].
The Group Environment Questionnaire (GEQ; Carron et al. [10] was the original instrument developed to assess group cohesion in sport. In Spanish-speaking contexts, the instrument was translated and adapted as the Team Environment Questionnaire (Cuestionario de Ambiente de Equipo; CAE) [11]. In this manuscript, we use the name GEQ to refer to the original instrument and clarify that the term CAE corresponds to the Spanish adaptation that served as the basis for the present validation with Mexican athletes.
Various international validations have reported differences in factorial structure and reliability indices, highlighting the importance of considering cultural and contextual factors. For example, studies in Brazil [12,13], Italy [14], New Zealand [15], Spain [16], and China [17] have provided comparative psychometric evidence. These findings confirm that while the GEQ is robust, some scales, particularly social cohesion, show weaker psychometric performance depending on context. Table 1 summarizes these international adaptations, including country, sample, factorial structure, and reliability.
The CAE has also been applied in several sport contexts. For instance, Piasecki et al. [18] found significant effects of the GEQ on social cohesion in female basketball players, while other studies demonstrated associations between cohesion, collective efficacy, and performance [19,20,21]. However, some research also indicated that certain initiation practices can negatively affect group cohesion [22,23].
Despite its extended use internationally, no scientific publications have examined the CAE in Mexican university athletes. Therefore, it is necessary to investigate the psychometric properties of the CAE in this population to confirm its reliability and vitality. This will provide a useful and culturally adapted tool for Mexican sport psychology, allowing for the design of interventions aimed at strengthening team cohesion. Consequently, the main objective of this study was to present the psychometric properties of the CAE in Mexican university athletes.

2. Materials and Methods

2.1. Design

Following the classification system proposed by Ato et al. [24], the present study is framed in an instrumental research design. This design is justified by the analysis of the psychometric properties of a questionnaire of psychological measures. This is a descriptive and cross-sectional study, since data collection was carried out at a single time.

2.2. Participants

The study sample was non-probabilistic for convenience. A total of 226 male and female university athletes over 18 years of age participated, with a mean age of 20.1 (SD = 2.44). The participants practiced different team sports such as basketball, baseball, American football, football soccer, soccer, cheerleading, softball, and indoor volleyball.

2.3. Instruments

The CAE consists of 18 items distributed in four main scales: Individual Attraction to the Group in the Task (ATG-T), which is made up of four items, and an example of an item is “The team does not offer me too many opportunities to improve my personal performance”; Individual Attraction to the Group in the Social (ATG-S), which is made up of five items, and an example of an item is “For me, the team is one of the most important social groups to which I belong”; Group Integration-Task (GI-T) which is made up of five items, and an example of an item is “If any member of the team has problems in an exercise (training) we are all willing to help him”; and Group Social-Integration (GI-S), which is made up of four items, for example, “Teammates rarely go out together”.
Each item is assessed using a nine-point Likert scale, with options ranging from (1) “Strongly Disagree” to (9) “Strongly Agree.” The interpretation of the results corresponds to the fact that a higher numerical score reflects a higher degree of positive team environment. However, items 1, 2, 3, 4, 6, 7, 8, 11, 13, 14, 17, and 18 are written in reverse, so a lower score indicates a higher degree of team environment in these items. A total of 4 items out of the 18 of the questionnaires were adapted and the only change in all four was the word “components” for “members” and “crew” for “friends”, for example, the original item 11, “Team members prefer to be distracted with their team than to go out together”, was modified to “Teammates prefer to be distracted by their friends than by teammates”.

2.4. Procedure

Mainly, the authors who performed the validation of the instrument in Spanish were contacted to obtain their authorization for the validation in Spanish and to obtain the original test and the way to process the data. The approval of the Research Ethics Committee of the Faculty of Sports Organization (FOD) of the Autonomous University of Nuevo Leon (UANL) was granted, with registration REPRIN-FOD-153.
For the collection of the sample, the consent of different organizations of the Faculties of the UANL, such as the Faculty of Sports Organization, the Faculty of Psychology, the Faculty of Public Accounting and Administration, and the Faculty of Mechanical and Electrical Engineering, was requested for the application of the instrument in their various representative sports teams. After obtaining acceptance and authorization from the coaches of each team, visits were scheduled during the days and times established in their training.
The athletes were notified of the objective of this study and the nature of the questionnaire. Participants were informed that they were free to leave the questionnaire at any time if they were unwilling to participate, without this having any impact on them. They were provided with a QR code that allowed them to complete the online instrument through the Question Pro platform, once their doubts were resolved and their willingness to participate was confirmed.

2.5. Data Analysis

Two databases were used for data analysis: SPSS (Statistical Package for the Social Sciences) version 25 and JASP (Jeffreys’s Amazing Statistics Program) version 0.18.3 [Computer software]. First, descriptive analyses of all the variables of the questionnaire were carried out to obtain the mean and standard deviation, thus allowing us to understand the general distribution of the answers and detect possible outliers. The Shapiro–Wilk test statistic used to assess the normality of the distribution of responses for each item was used, as well as the p-value associated with the same test for the normality of the distribution.
The internal consistency of the questionnaire was evaluated using Cronbach’s alpha coefficient, used in each of the questionnaire scales as well as in all the items, to determine the homogeneity of the scales and their reliability. A Confirmatory Factor Analysis (CFA) was then performed using the Maximum Likelihood (ML) estimation method and evaluating several fit indices, including the Goodness of Fit Index (GFI), the Comparative Fit Index (CFI), Incremental Fit Index (IFI), Bentler–Bonett Normative Fit Index (NFI), Standardized Mean Square Residual (SRMR) and the Square Root of Mean Square Error of Approximation (RMSEA). As for the reference values, CFI and IFI values > 0.95 and RMSEA < 0.06 are considered indicators of an excellent fit [25], CFI and IFI values > 0.90 and RMSEA < 0.06 are considered acceptable [26]; for GFI values, a cut-off point greater than or equal to 0.93 is recommended, and the NFI value is considered 0.95 as the best fit, as well as <0.06 for SRMR [27].

3. Results

3.1. Descriptive Analysis

Descriptive statistics of the 18 items of the Team Environment Questionnaire (CAE) are presented in Table 2. The means ranged from M = 3.98 (item 9) to M = 6.96 (item 10); with standard deviations reflecting a moderate dispersion. Standard deviations indicate a moderate and uniform dispersion between items. The Shapiro–Wilk test was statistically significant (p < 0.001), validating the normality of the results. Internal consistency was different between the scales: Group-Task Attraction showed the highest reliability (ω = 0.81), followed by Group-Social Attraction (ω = 0.65); in contrast, Group-Social Integration (ω = 0.42) and, above all, Group-Task Integration (ω = 0.22).

3.2. Internal Consistency by Factors

For the evaluation of the reliability of the Equipment Environment Questionnaire (CAE), the Omega coefficient (ω) and the internal consistency coefficients of Cronbach’s alpha (α) were calculated, thus providing a robust estimate of the internal consistency of the questionnaire. In the analysis process, three items from different scales were eliminated to improve overall reliability. The excluded items were the following: item 5, which belongs to the ATGS scale “Some of my best friends are on the team”; item 10, which belongs to the GIT scale “The team stays together with the intention of achieving the proposed performance objectives”; and item 15, which belongs to the GIS scale “Teammates would like to spend more time together outside of the season”.
The results obtained from the reliability indices after the elimination of these items (see Table 3) show that the Individual Attraction to the Task (ATG-T) scale has the highest reliability values, with ω = 0.80 and α = 0.80. This scale is followed by the Integration-Task (GIT), which shows ω = 0.73 and α = 0.71. On the other hand, the Individual Attraction to the Task scale in its social dimension (ATG-S) reports values of ω = 0.71 and α = 0.61. In contrast, the Degree of Integration-Social (GI-S) scale shows the lowest internal consistency indices, with ω = 0.52 and α = 0.50. These results suggest that the ATG-T, ATG-S, and GI-T scales have an adequate level of reliability, indicating a high degree of homogeneity between their items.

3.3. Confirmatory Factor Analysis

The different fit indices of the models are shown in Table 4. From the comparison of the indices, we observed that the one-dimensional model (a) presented an efficient fit and with a better fit (χ2 = 177.33, df = 84, p < 0.01; CFI = 0.92; RMSEA = 0.07), followed by the bidimensional task/social model (χ2 = 330.18, df = 118, p < 0.01; CFI = 0.84; RMSEA = 0.08). The attraction/integration model obtained the least favorable values (χ2 = 382.12, df = 134, p < 0.01; CFI = 0.82; RMSEA = 0.09).
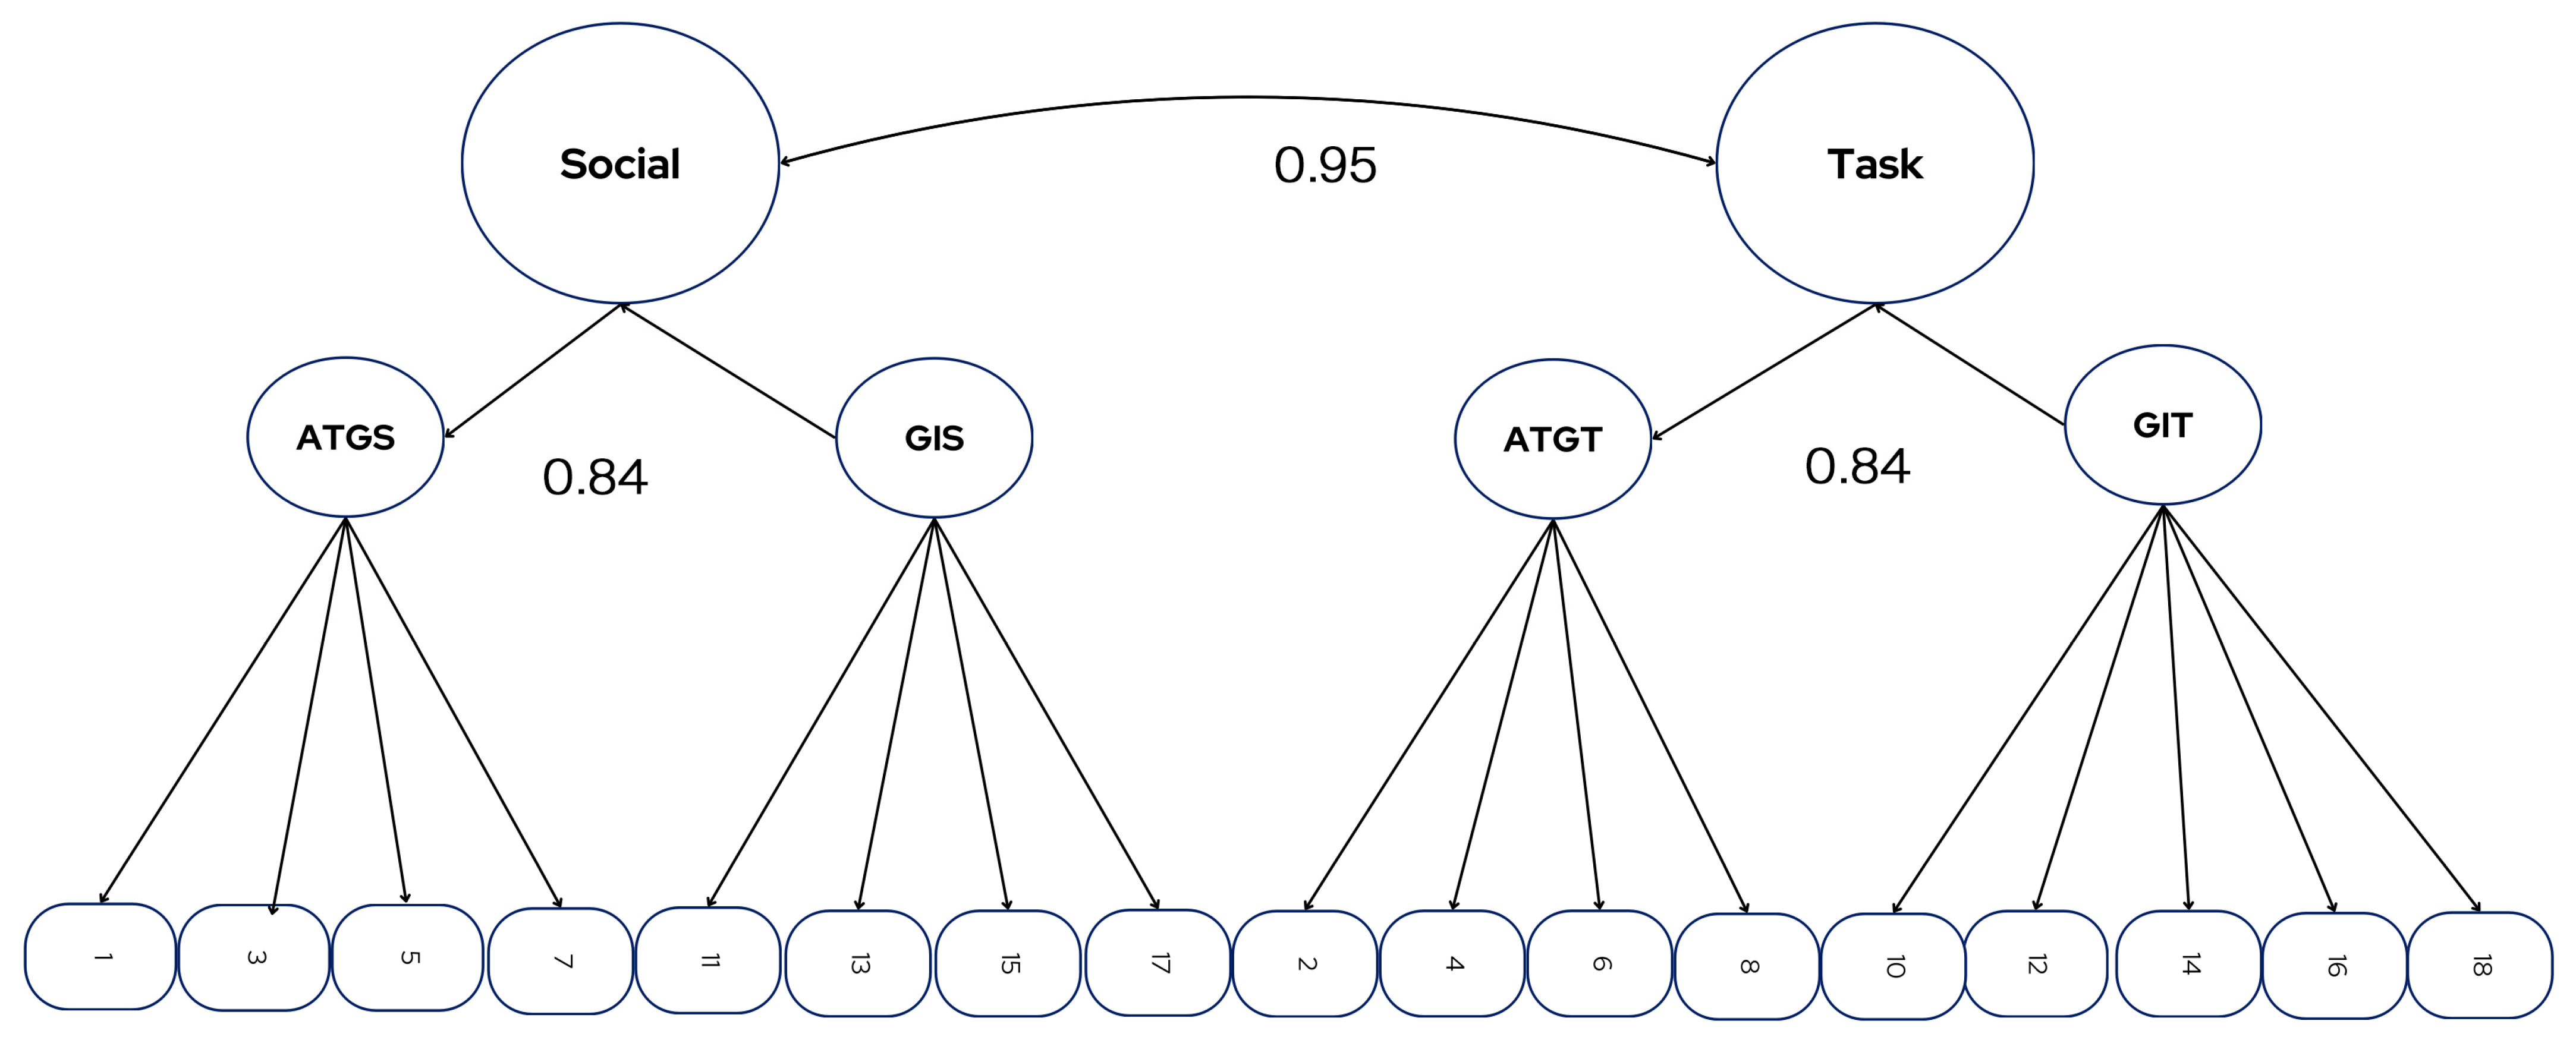
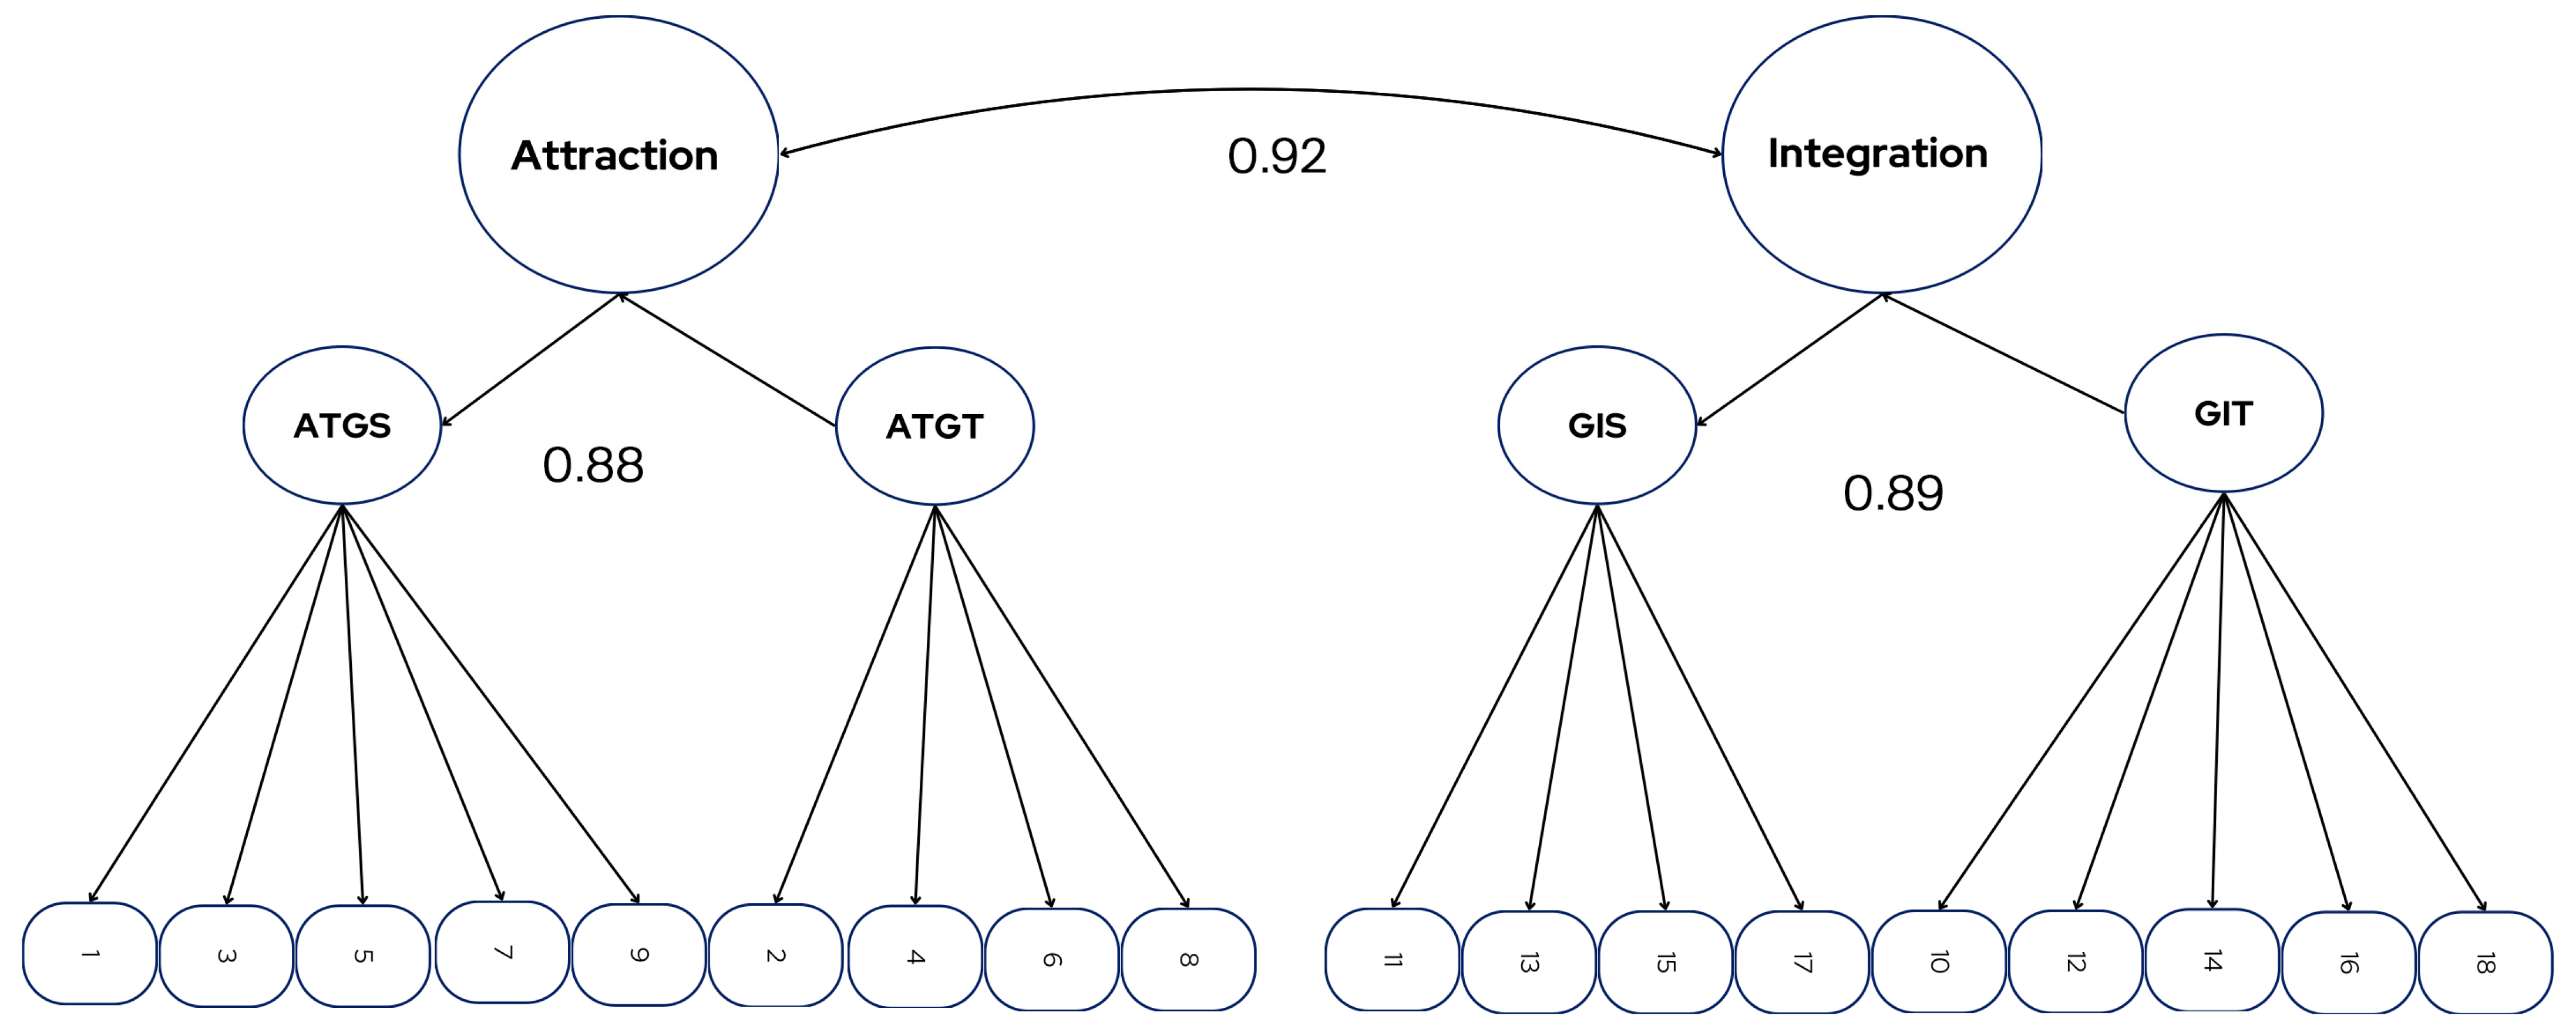
The latent structure of the CAE was examined by contrasting three theoretical models of cohesion: (a) a one-dimensional model that posits the existence of a general factor (Figure 1) by eliminating three items (5, 10, and 15) with a good correlation of 0.89 between their scales; (b) a two-dimensional social/task model (Figure 2) where item 9 “For me, the team is one of the most important social groups to which I belong” is eliminated, showing correlation between factors of 0.95; and (c) two-dimensional attraction/integration model maintaining the total of the 18 items (Figure 3), yielding a correlation value of 0.91. Although the three models evaluated presented acceptable indices, the high similarity between the factors supports the choice of the one-dimensional model, especially in contexts of psychological 213 intervention.
Confirmatory Factor Analysis (CFA) showed that the one-dimensional model presented a better fit compared to the four- and two-factor solutions. After the elimination of items 5, 10, and 15, the adjustment indices improved (CFI = 0.92; RMSEA = 0.07; SRMR = 0.05). Although these values are considered acceptable, they are at the lower limit of what is recommended and do not reach excellent levels.
Regarding internal consistency, the coefficients ranged from ω = 0.52 to ω = 0.81. The Group-Social Integration (GI-S) scale was the one that showed the lowest reliability (ω = 0.52; α = 0.50), while the other dimensions presented moderate to adequate values.

3.4. Bivariate Correlations Between Partial Scales

The bivariate correlations between the scales of the group cohesion model are shown in Table 5; the results show that all correlations were statistically significant (p < 0.001), indicating substantial relationships between the dimensions evaluated. The highest magnitude relationship between ATG-T and ATG-S is observed (r = 0.66, ** p < 0.001), and within the task, the relationship between ATG-T and GI-T reached r = 0.19 (* p < 0.01), while the association between the two social scales—ATG-S and GI-S—was r = 0.38 (** p < 0.001). Finally, GI-T and GI-S showed a moderate coefficient of r = 0.20 (p < 0.05).

4. Discussion

The objective of this study was to present the psychometric properties of the CAE for the adaptation and validation of the instrument to Mexican university athletes, so it was proposed, in the first place, to examine the psychometric properties through the application of the questionnaire in this population and then the evaluation of the adjustment indices. In the initial factor analysis, three items were identified that did not fit the model, which affected the validity of the model. Items 5, 10, and 15 presented low factor loads and poor individual reliability, so they were eliminated, respecting the theoretical structure of the model, following the elimination criteria. The elimination was based on factor loads below the recommended threshold of 0.50, which compromises the validity of the item [28]. As a result, an adjusted version was obtained, increasing its validity without compromising the representation of group cohesion in the evaluated population.
The finding of low reliability in the GI-S scale coincides with reports in other cultural contexts, but in the case of Mexican university athletes, it can be explained by different factors: (1) cultural issues, since social activities within the teams are not always perceived as central to the university sports experience; (2) possible nuances of translation or adaptation in the wording of the items; and (3) characteristics of the sample, composed mainly of athletes from collective disciplines, where the emphasis on the task tends to predominate over social aspects. These results are consistent with what has been found in previous adaptations, where the dimension of social cohesion has shown psychometric weaknesses in different cultural contexts, such as in Brazil [13] and China [17]. These findings suggest the need to review and more accurately adapt reagents of this scale in future research.
The one-dimensional model presented acceptable but not excellent fit indices (CFI = 0.92; RMSEA = 0.07), which requires interpreting it with caution. However, there are grounds to sustain this choice in this context. First, previous validations have also reported difficulties in achieving optimal indices with the original four-factor solution, in addition to pointing out high correlations between the dimensions that question their independence [12,16]. Secondly, from an applied perspective, the reduction to a global measure allows for a simpler and more efficient tool for sports psychology, especially in intervention scenarios where time and resources are limited. Therefore, although the one-dimensional model does not completely resolve the theoretical debate, it represents a viable and significant alternative for the evaluation of cohesion in Mexican university athletes.
Finally, it is useful to distinguish between theoretical and practical implications. Theoretically, the results contribute to the debate on whether cohesion should be conceived as a multidimensional or global construct. Although the original model proposes four factors [1], the evidence obtained suggests that a one-dimensional representation may be valid in certain cultural contexts [12,13,16,17]. In practice, from the perspective of psychology applied to sport, the one-dimensional model is advantageous in allowing rapid diagnoses and simple comparisons between teams, which has been pointed out as a key utility in sports intervention contexts [29,30]. This is especially useful in brief interventions, where a global indicator of cohesion is required to facilitate decision-making by psychologists and coaches.

5. Conclusions

The validation of the CAE in Mexican university athletes is an important first step for the evaluation of group cohesion in the sports context. This instrument allows for a quantitative measurement of task cohesion and social cohesion, offering indicators that can be complemented with qualitative information derived from the direct experience of athletes. In this way, it is possible to generate a comprehensive analysis of the dynamics that influence the collective performance and effectiveness of teams.
A few potential limitations should be considered when interpreting the present study’s findings. The research relied on convenience sampling from a single university (UANL), which restricts the generalization of the findings. Furthermore, the sample was composed mainly of athletes from team sports and had an unbalanced gender distribution, factors that may have influenced both the factorial structure and the reliability indices obtained.
Based on these findings, future research should focus on refining the wording of the items of the Group Integration-Social (GI-S) scale through cultural and linguistic adaptations, as well as on incorporating qualitative methodologies (focus groups or cognitive interviews) that allow for a more accurate capture of the perception of social cohesion in Mexican teams [13,17]. It is also necessary to conduct multi-group analyses to examine measurement invariance by gender, sport type (individual vs. team), and competitive level, to evaluate the robustness of the unidimensional model in different contexts [14,15].
Considering future studies, it is recommended to incorporate longitudinal designs to analyze how cohesion evolves throughout a sports season and how it is related to variables such as motivation, performance, and collective efficacy [29]. Expanding the adaptation of the CAE to other populations and sports disciplines in Mexico will strengthen its applicability and consolidate its use as a valuable tool for both research and applied intervention in sport psychology.

Author Contributions

Conceptualization, F.C.-V.; methodology, F.C.-V. and A.C.-B.; software, F.C.-V., A.C.-B. and J.M.L.-W.; validation, F.C.-V., A.C.-B. and J.M.L.-W.; formal analysis, F.C.-V. and A.C.-B.; investigation, F.C.-V. and A.C.-B.; data curation, F.C.-V.; writing—original draft preparation, F.C.-V.; writing—review and editing, F.C.-V. and A.C.-B.; supervision, A.C.-B., F.J.M.-F. and J.M.L.-W.; project administration, F.C.-V. and A.C.-B.; funding acquisition, F.C.-V., A.C.-B., F.J.M.-F. and J.M.L.-W. All authors have read and agreed to the published version of the manuscript.

Funding

This research was possible thanks to the financial support granted by the Secretaría de Ciencia, Humanidades, Tecnología e Innovación (SECIHTI) through Becas de Posgrado y Apoyos a la Calidad of the SECIHTI.

Institutional Review Board Statement

The study was conducted according to the guidelines of the Declaration of Helsinki and approved by the Ethics Committee of Faculty of Sports Organization (FOD) of the Autonomous University of Nuevo León (protocol code REPRIN-FOD-153; approval date: 23 February 2024).

Informed Consent Statement

Informed consent was obtained from all subjects involved in the study.

Data Availability Statement

The data presented in this study are available on request from the corresponding author due to ethical reasons.

Conflicts of Interest

The authors declare no conflicts of interest.

Abbreviations

The following abbreviations are used in this manuscript:
GIGroup Integration
ATGIndividual Attraction to the Group
ATG-TIndividual Attraction to the Group-Task
ATG-SIndividual Attraction to the Group-Social
GI-SGroup Integration-Social
GI-TGroup Integration-Task

References

  1. Carron, A.V.; Widmeyer, W.N.; Brawley, L.R. The Measurement of Cohesion in Sports Teams: The Group Environment Questionnaire. Can. J. Sport. Sci. 1989, 14, 55–59. [Google Scholar]
  2. Carron, A.V.; Eys, M.A. Group Dynamics in Sport, 4th ed.; Fitness Information Technology: Morgantown, WV, USA, 2012. [Google Scholar]
  3. Carron, A.V. Cohesiveness in Sport Groups: Interpretations and Considerations. J. Sport Psychol. 1982, 4, 123–128. [Google Scholar] [CrossRef]
  4. Rapisarda, B.A. The impact of emotional intelligence on work team cohesiveness and performance. Int. J. Organ. Anal. 2002, 10, 363–379. [Google Scholar] [CrossRef]
  5. Gu, S.; Xue, L. Relationships among sports group cohesion, psychological collectivism, mental toughness and athlete engagement in Chinese team sports athletes. Int. J. Environ. Res. Public Health 2022, 19, 4987. [Google Scholar] [CrossRef]
  6. Høigaard, R.; Säfvenbom, R.; Tønnessen, F.E. The relationship between group cohesion, group norms, and perceived social loafing in soccer teams. Small Group Res. 2006, 37, 217–232. [Google Scholar] [CrossRef]
  7. Bedir, D.; Agduman, F.; Bedir, F.; Erhan, S.E. The mediator role of communication skill in the relationship between empathy, team cohesion, and competition performance in curlers. Front. Psychol. 2023, 14, 1115402. [Google Scholar] [CrossRef]
  8. Kim, S.; Magnusen, M.J.; Andrew, D.P.S. Divided we fall: Examining the relationship between horizontal communication and team commitment via team cohesion. Int. J. Sports Sci. Coach. 2016, 11, 625–636. [Google Scholar] [CrossRef]
  9. Budnik-Przybylska, D.; Kaźmierczak, M.; Karasiewicz, K.; Bertollo, M. Spotlight on the link between imagery and empathy in sport. Sport Sci. Health 2021, 17, 243–252. [Google Scholar] [CrossRef]
  10. Carron, A.V.; Widmeyer, W.N.; Brawley, L.R. The development of an instrument to assess cohesion in sport teams: The Group Environment Questionnaire. J. Sport Psychol. 1985, 7, 244–266. [Google Scholar] [CrossRef]
  11. Iturbide, L.; Elosúa, P.; Yanes, F. Medida de la cohesión en equipos deportivos: Adaptación al español del Group Environment Questionnaire. Psicothema 2010, 22, 482–488. [Google Scholar] [PubMed]
  12. Nascimento Junior, J.R.A.D.; Vieira, L.F.; Rosado, A.F.B.; Serpa, S. Validação do Questionário de Ambiente de Grupo (GEQ) para alíngua portuguesa. Mot. Rev. Educ. Física 2012, 18, 770–782. [Google Scholar]
  13. Nascimento Junior, J.R.A.; Contreira, A.R.; Moreira, C.R.; Pizzo, G.C.; Ribeiro, V.T.; Vieira, L.F. Psychometric properties of the Group Environment Questionnaire (GEQ) for the high-performance soccer and futsal context. Rev. Educ. Física/UEM 2016, 27, e2742. [Google Scholar]
  14. Steca, P.; Pala, A.N.; Greco, A.; Monzani, D.; D’Addario, M. A Psychometric Evaluation of the Group Environment Questionnairein a Sample of Professional Basketball and Soccer Players. Percept. Mot. Ski. 2013, 116, 262–271. [Google Scholar] [CrossRef] [PubMed]
  15. Whitton, S.M.; Fletcher, R.B. The Group Environment Questionnaire: A multilevel confirmatory factor analysis. Small Group Res. 2014, 45, 68–88. [Google Scholar] [CrossRef]
  16. Leo, F.; González-Ponce, I.; Sánchez-Oliva, D.; Pulido, J.; García-Calvo, T. Adaptation and validation in Spanish of the Group Environment Questionnaire with professional football players. Psicothema 2015, 27, 261–268. [Google Scholar] [CrossRef]
  17. Ji, P.; Zhou, S.; Wang, R.; Fan, H.; Wang, Y. Subjective exercise experience and group cohesion among Chinese participating in square dance: A moderated mediation model of years of participation and gender. Int. J. Environ. Res. Public. Health. 2022, 19, 12978. [Google Scholar] [CrossRef]
  18. Piasecki, P.A.; Loughead, T.; Paradis, K.F.; Munroe-Chandler, K.J. Using a personal-disclosure mutual-sharing approach to deliver a team-based mindfulness meditation program to enhance cohesion. Sport Psychol. 2021, 35, 22–29. [Google Scholar] [CrossRef]
  19. Martínez-Santos, R.; Ciruelos, O. Collective efficacy, cohesion, and performance in Spanish amateur female basketball. Rev. Psicol. Deporte 2013, 22, 235–238. [Google Scholar]
  20. González, I.; Sánchez, D.; Amado, D.; Pulido, J.J.; López, J.M.; Leo, F.M. Análisis de la cohesión, la eficacia colectiva y el rendimiento en equipos femeninos de fútbol. Apunt. Educ. Fís. Deporte 2013, 114, 65–71. [Google Scholar] [CrossRef][Green Version]
  21. Bohórquez Gómez-Millán, M.R.; Delgado Vega, P.; Fernández Gavira, J. Rendimientos deportivos auto y heteropercibidos y cohesión grupal: Un estudio exploratorio. Retos Nuevas Tend. Educ. Física Deporte Recreación 2017, 31, 103–106. [Google Scholar][Green Version]
  22. Lafferty, M.E.; Wakefield, C.; Brown, H. “We do it for the team”—Student-athletes’ initiation practices and their impact on group cohesion. Int. J. Sport Exerc. Psychol. 2015, 15, 438–446. [Google Scholar] [CrossRef]
  23. Checa, I.; Gómez-Millán, M.R. Medidas psicométricas de la cohesión en equipos de trabajo universitarios. Retos Nuevas Tend. Educ. Física Deporte Recreación 2020, 37, 108–114. [Google Scholar]
  24. Ato, M.; López, J.J.; Benavente, A. Un sistema de clasificación de los diseños de investigación en psicología deportiva. An. Psicol. 2013, 29, 1038–1059. [Google Scholar] [CrossRef]
  25. Bentler, P.M. On tests and indices for evaluating structural models. Pers. Individ. Differ. 2007, 42, 825–829. [Google Scholar] [CrossRef]
  26. Marsh, H.W.; Hau, K.T.; Wen, Z. In search of golden rules: Comment on hypothesis-testing approaches to setting cutoff values for fit indexes and dangers in overgeneralizing Hu and Bentler (1999) findings. Struct. Equ. Model. 2004, 11, 320–341. [Google Scholar] [CrossRef]
  27. Cho, G.; Hwang, H.; Sarstedt, M.; Ringle, C.M. Cutoff criteria for overall model fit indexes in generalized structured component analysis. J. Mark. Anal. 2020, 8, 189–202. [Google Scholar] [CrossRef]
  28. Lloret-Segura, S.; Ferreres-Traver, A.; Hernández-Baeza, A.; Tomás-Marco, I. El análisis factorial exploratorio de los ítems: Una guía práctica, revisada y actualizada. An. Psicol. 2014, 30, 1151–1169. [Google Scholar] [CrossRef]
  29. Eys, M.; Loughead, T.; Bray, S.; Carron, A. Development of a Cohesion Questionnaire for Youth: The Youth Sport Environment Questionnaire. J. Sport Exerc. Psychol. 2009, 31, 390–408. [Google Scholar] [CrossRef]
  30. Vieira, J.L.; Rodrigues, G.T.; de Souza, V.F.M.; Catabriga, L.M.; Kravchychyn, C.; Donato, F.C.; Marção, L.L.; Ferreira, L. Impacto das estratégias de coping e do ambiente de grupo no desempenho de atletas amadores em competição de voleibol. Retos Nuevas Tend. Educ. Física Deporte Recreación 2024, 61, 878–884. [Google Scholar]
Figure 1. One-dimensional model.
Societies 15 00259 g001
Figure 2. Two-dimensional social/task model.
Societies 15 00259 g002
Figure 3. Two-dimensional attraction/integration model.
Societies 15 00259 g003
Table 1. Psychometric studies and adaptations of the GEQ.
Country/RegionAuthors/YearSampleFactorial SolutionReliability (α)
BrazilNascimento Junior et al., 2012 [12]501 athletes 4-factor model, item adjustmentsα 0.76–0.80
ItalySteca et al., 2013 [14]517 male professionals (basketball and soccer)4-factor structure, with one modified item α 0.37–0.76
New ZealandWhitton and Fletcher, 2014 [15]519 semi-elite and elite teams4 factor model; with one modified item α 0.58–0.91
SpainLeo et al., 2015 [16]Professional football players4-factor model; partial supportα 0.60–0.82
BrazilNascimento Junior et al., 2016 [13]441 soccer players4 factors, with 16 modified itemsα 0.75–0.85
ChinaGu and Xue, 2022 [5] 326 active Chinese athletes4 factors, with 15 itemsα 0.71–0.87
Table 2. Descriptive analysis of the CAE items.
ScalesMDTToKS-Wp
ATG-S
ω = 0.65
16.832.67−1.07−0.10.77<0.001
36.472.94−0.70−0.740.78<0.001
55.823.08−0.36−1.410.83<0.001
76.322.91−0.68−0.940.81<0.001
93.982.660.44−1.010.88<0.001
ATG-T
ω = 0.81
26.052.82−0.58−0.970.85<0.001
45.293.09−0.12−1.470.85<0.001
65.932.86−0.47−1.110.86<0.001
85.892.95−0.46−1.190.85<0.001
GI-S
ω = 0.42
115.352.18−0.09−0.460.94<0.001
134.452.640.23−1.050.91<0.001
155.562.24−0.12−0.530.93<0.001
175.602.64−0.25−1.010.91<0.001
GI-T
ω = 0.22
106.962.25−0.93−0.030.83<0.001
125.852.77−0.38−1.130.88<0.001
144.492.44−0.16−0.800.93<0.001
166.782.69−0.99−0.290.78<0.001
185.622.59−0.28−0.920.91<0.001
Note. AGT-S: Attraction Group-Social; AGT-T: Attraction Group-Task; GI-T: Group Integration-Task; GI-S: Group Integration-Social.
Table 3. Internal consistency by factors.
ScaleωαM
ATG-T0.800.8023.17
ATG-S0.710.6023.61
GI-T0.730.7123.66
GI-S0.520.5015.42
Note. AG-T = Attraction Group-Social; AGT-T = Attraction Group-Task; GI-T = Group Integration-Task; GI-S = Group Integration-Social.
Table 4. Values of fit indexes of the models of GEQ.
Modelsχ2GlpGFIRMSEACFIIFINFISRMR
Unidimensional177.3384<0.010.900.070.920.920.870.05
Homework/Social330.18118<0.010.960.080.840.840.780.08
Attraction/Integration382.12134<0.010.950.090.820.820.750.07
Note. GFI = Goodness of Fit Index; RMSEA = Root Mean Square Approximation Error; CFI = Comparative Fit Index; IFI = Incremental Adjustment Index; NFI = Normalized Fit Index; SRMR = Standardized Average Quadratic Residual.
Table 5. Bivariate correlations between partial scales.
ScalesATG-TATG-SGI-T
ATG-T-
ATG-S0.66 ***-
GI-T0.19 **0.23 **-
GI-S0.38 **0.38 ***0.20 *
Note. ATG-T = Attraction to the Group-Task; ATG-S = Attraction to the Group-Social; GI-T = Group Integration-Task; GI-S = Group Integration-Social. * p < 0.05, ** p < 0.01, *** p < 0.001.
Disclaimer/Publisher’s Note: The statements, opinions and data contained in all publications are solely those of the individual author(s) and contributor(s) and not of MDPI and/or the editor(s). MDPI and/or the editor(s) disclaim responsibility for any injury to people or property resulting from any ideas, methods, instructions or products referred to in the content.