Abstract
Background: Health problems can be an impediment during aging to political participation (PP), including voting. Furthermore, factors such as income, education, and level of physical activity (PA) also influence the PP of older adults. We examined whether income, education, and PA mediated the relationship between self-rated health (SRH) and PP in voters and non-voters aged 50 and over from 20 European countries. Methods: Data were taken from the European Social Survey. We included 14,701 individuals (64.63 ± 9.69 years), of which 52.5% were women. Results: Multivariate analyses suggested that increased SRH, income, education, and PA scores represented greater odds for intensifying PP in voters and non-voters. Mediation analyses showed that income, education, and PA partially mediated the association between SRH and PP among voters. Among non-voters, income was not a significant mediator of the association between SRH and PP. The largest mediated proportion occurred in the SRH → PA → PP path of voters at 35.34% and non-voters at 36.38%. The direct effect of SRH on the PP was verified only among voters. Conclusions: The findings contribute to a better understanding of the PP of individuals aged 50 and over and may contribute to planning strategies to increase PP in Europe.
1. Introduction
The relationship between health and politics is well-known [1,2]. However, its influence has been underestimated [3]. Poor health can limit a range of activities, such as studying, working and socializing, which consequently creates barriers to accumulating positive life experiences. In turn, poor health also reduces the likelihood of an individual’s involvement in civil society [4]. Previous studies have reported that, regardless of sex or age group, voter turnout among individuals with poor health and disabilities was significantly lower than among those in good health [5,6]. Voter turnout is linked to political participation (PP), which is a fundamental behavior for establishing democracy [7,8].
PP is multifactorial, formed by a series of political behaviors such as demonstrations, boycotts, guerrillas, protests, and extreme actions such as suicide [9]. Moreover, PP also includes volunteer work, participation in party rallies and flash mobs, signing petitions, and using campaign stickers or stamps [10]. In the political context, health status is important because debilitated individuals tend to have greater difficulty protesting, contacting elected officials, or even making financial donations [5,6]. In the older population, low political engagement is more evident than in young people and adults [11]. This is due to factors such as a higher number of comorbidities [12], as well as functional and cognitive limitations [4], responsible for disabilities [13].
Furthermore, factors that are fundamental to an adequate state of health, such as years of education and financial resources, when scarce, can limit citizens’ participation in democratic processes [3,14]. On the other hand, the higher the educational level, the higher the PP [15]. A recent review of voting highlighted the role of years of education and income as factors that promote PP, even reflecting on election results [16]. Formal education helps individuals understand how politics works, as well as strengthening awareness of the need for and power of voting [17]. A study of the Finnish older population showed that income mediated some of the effects of social class on voting [14]. In this sense, especially in old age, when income tends to decline with retirement [18], household income is a recognized indicator of financial health, as it includes not only personal income but also spouse’s income, state benefits, and investment funds [19]. When household income is adequate, this allows older adults to make extra investments benefiting health care and well-being [20], including sports and leisure activities [21].
Over the years, different investigations have been conducted to better understand the potential relationship between health and PP [22,23,24]. These relationships have commonly been operationalized through self-rated health (SRH) and functional capacity [11]. Since the 1950s, SRH has been the most widely used health indicator in sociology of medicine to collect information on personal well-being. The SRH spectrum encompasses the biological, mental, functional, and spiritual dimensions of health. Furthermore, SRH is able to summarize the coefficient of sadness, satisfaction, mood, pain, and fatigue [25], helping us to understand the compensatory affective mechanisms of self-esteem [26]. In old age, SRH is an effective measure to detect possible discomfort problems triggered by age-related chronic diseases [27]. A previous study demonstrated a strong association between socioeconomic inequalities (e.g., education, income) and low SRH [28].
It is worth noting that, although individuals after the age of 50 have generally completed their formal education (e.g., school and university), the process of lifelong learning (e.g., development of new skills) is continuous. Moreover, lifelong learning is an essential factor for consolidating the process of lifelong education [29]. From this perspective, a low perception of health (SRH) can also limit older individuals from interacting socially, creating barriers to gaining essential experiences for lifelong learning. When it comes to aging, health plays an important role in household income both in the period preceding exit from the labor market and for pensions during retirement [30]. In turn, poor physical or mental health results in higher expenses for doctors, exams, and medications, which consequently negatively impacts household income. A cross-national study conducted with data from 16 European countries (SHARE) to examine whether relationships between health and wealth indicated the importance of subjective health for wealth accumulation, highlighting that the time factor (e.g., belonging to an older population) was a determining factor in increasing income [31].
Studies have revealed associations between low SRH scores and low voting rates [17,22]. A low SRH is an indicator of vulnerability, as it is related to an increased risk of disease, which consequently affects well-being and quality of life [32]. A recognized strategy capable of increasing SRH levels, as well as controlling comorbidities, reducing or combating deficiencies associated with physical, mental and cognitive frailty (vulnerability) consists of increasing levels of physical activity (PA) [33]. On the other hand, it is also known that SRH can increase PA levels, especially in older adults. This is due to a self-regulatory process, more specifically “subjective energy availability”, Cardini and Freund [34] described this as the perceived potential to pursue the completion of one or more goals. The subjective energy availability is essential for older adults to feel motivated to expend energy. Therefore, the greater the perception of SRH, the greater the self-efficacy for effort. From this perspective, subjective energy availability is especially important in the domain of PA, including regular physical activity [35]. Studies have shown that moderate to vigorous levels of PA have enhanced overall health during aging [36,37,38]. Moreover, adequate levels of PA have been attested as one of the main keys to implementing healthy aging [39].
According to the recommendations of the World Health Organization [40], for individuals aged 64 and over to maintain adequate levels of health, it is important to perform at least 150 to 300 min of moderate-intensity aerobic PA or at least 75 to 150 min of vigorous-intensity aerobic PA per week. In addition, an equivalent weekly mix of moderate- to vigorous-intensity activities has been advised. When it comes to the health of the older population, it is important to consider that in addition to age, the interrelationship between education, employment, and socioeconomic status considerably influence the adoption of active or inactive physical behavior [41]. Thus, PA and PP share variables that can promote or reduce both.
In recent decades, studies have developed empirical models to understand the profile of voters and non-voters. Focusing on electoral participation in European countries, trends were observed based on age and gender differences [42,43]. The findings identified significant variation between countries, a prevalence of male voters, and that interest in politics decreases after the age of 75 [44]. Research with European citizens has also sought to understand the relationship between PP and health [14,22], multimorbidities [6], intellectual disabilities [45], genetic problems [46], social inequalities [47], including Internet use [48]. However, there are still gaps in knowledge about associations of health status with PP during aging [6].
According to Mattila et al. [22], poor health suppressed turnout, which was partially mediated by social connection. Based on these findings, it is possible to assume that with adequate levels of PA, an older individual can maintain and expand a social network, which, in turn, can promote electoral participation. To our knowledge, no study has explored associations between PA and PP of voters and non-voters in a national election in Europe. Thus, the present study examined the mediating role of income, education and PA in the relationship between SRH and PP of European voters and non-voters aged 50 and over.
2. Materials and Methods
2.1. Study Data and Sample
The data in the present study are from the 7th round of the European Social Survey (ESS). The ESS consists of a biennial survey among countries that began in 2002 and aimed to track and decipher changes in attitudes in Europe in relation to numerous institutions and policy areas. Detailed information on the ESS procedures can be found in the survey protocol, including the International Statistical Institute’s Statement of Professional Ethics (https://www.europeansocialsurvey.org/about-ess accessed on 20 March 2025). For the analysis, we selected the full Round 7 (year 2014/2015), which focused on the themes “Immigration, Social inequalities in health”. Our interest in this survey is because it was the only one to include questions covering the physical behavior of the interviewees. The Round 7 dataset comprised 40,185 individuals from 21 countries, interviewed in private households.
The countries that integrated the survey were the following: Austria, Belgium, Czech Republic, Denmark, Estonia, Finland, France, Germany, Hungary, Ireland, Israel, Lithuania, the Netherlands, Norway, Poland, Portugal, Slovenia, Spain, Sweden, Switzerland, and the United Kingdom. Survey information was collected through face-to-face interviews using a questionnaire that included sociodemographic and socioeconomic questions, immigration, citizenship, medication use, health perception, and PA level. We excluded citizens of Israel because it is not considered a European country (n = 2.562). We only included citizens aged 50 or older (n = 18,889; 50 to 114 years). Respondents with missing data, as well as respondents who refused to answer or were unsure about the following information, were also excluded: whether they voted or not (n = 652), level of PA (n = 441), health status (n = 41), years of education (n = 334), sex (n = 22), age (n = 22), household income (n = 2.468), and political engagement (n = 208). Finally, 14,701 individuals were analyzed (Figure 1).
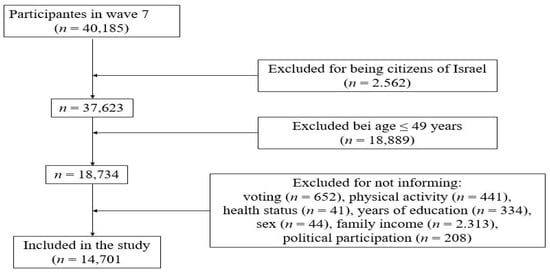
Figure 1.
Study flowchart.
2.2. Sociodemographic Characteristics
Based on previous studies [49], we considered four sociodemographic markers from the ESS questionnaire for study purposes: sex, age, education, and household income. Sex was assumed as a binary variable (1 = men, 2 = women), while age was considered as a metric variable.
2.2.1. Education
Regarding education, the question asked was, “About how many years of education have you completed, whether full-time or part-time? Please report these in full-time equivalents and include compulsory years of schooling”.
2.2.2. Household Income
In the ESS dataset, the question about income was worded as follows: “If you add up your income from all sources, which letter describes your household’s total net income?”. The options were presented to participants in twelve categories (e.g., from lowest to highest). Experts from each country estimated and created the deciles to capture better variations in the economic power of citizens residing in different countries [19]. Thus, the population was divided into 10 equal groups based on their income, from the lowest 10% (first decile) to the highest 10% (tenth decile). This technique is used to analyze income distribution, presenting household income across different segments of the population. To reduce the degree of variation and collinearity of the analyses, we computed the household income in five categories from a lower to higher income: 1 = 1 to 2 deciles, 2 = 3 to 4, 3 = 5 to 6, 4 = 7 to 8, and 5 = 9 to 10 deciles.
2.3. Physical Activity
PA was operationalized based on the following question from the ESS questionnaire: “On how many of the last 7 days did you walk quickly, do sports or other PA for 30 min or longer?”. We computed the total number of days (scalar variable) for the analyses. A higher scale score meant a better PA level.
2.4. Self-Rated Health
The SRH was operationalized by the following question: “How is your health in general?” with ordinal response categories ‘very good’, ‘good’, ‘fair’, ‘bad’, ‘very bad’. For mediation analyses, health responses were inversely recoded into five categories: (1) very bad, (2) bad, (3) fair, (4) good, (5) very good. Consequently, a metric variable was used. Thus, 1 was the lowest value and 5 the highest. For descriptive analyses, we used three classifications through the following composition: (1) bad (very bad and bad), (2) fair, and (3) good (good and very good).
2.5. Vote
Respondents’ voting intentions and PP were operationalized in the questionnaire by the following question: “Some people don’t vote these days for one reason or another. Did you vote in the last national election in [country] in [year]?”.
2.6. Political Participation
Citizens’ PP in political matters (i.e., participatory activities) was composed of a set of seven questions from the ESS questionnaire: Have you contacted a politician, government, or local government official?; Have you worked in a political party or action group?; Have you worked in another organization or association?; Have you worn or displayed a campaign badge/sticker?; Have you signed a petition?; Have you participated in a legal public demonstration?; Have you boycotted certain products? The PP variable (scale: yes/no) was operationalized by adding the seven questions, creating a total score. The information presented was related to the last national election of the analyzed period.
2.7. Covariates
Variables related to PA and health that could generate barriers to participation in elections were considered confounding factors. Thus, we chose age and sex because they are factors that can influence populations’ lifestyle and health habits [50], increasing the risk of diseases. Another covariate included was chronic degenerative diseases measured through self-report of medical diagnosis by a doctor. Moreover, we include the issue of having or not having disabilities. Previous studies have shown that citizens with physical disability tend to have a lower voter registration and voting rate. Compared to healthy citizens, individuals with a disability (i.e., mobility, vision, hearing) are more likely to not attend public places, have less contact with government officials and not be interested in the quality of public services offered [51].
2.8. Statistical Analyses
Descriptive statistics were calculated, and continuous variables are presented as mean (M) and standard deviation (SD), while categorical variables are presented as frequency and percentage. Statistical differences between citizens who voted and those who did not vote in the last election were determined using the Chi-square test (categorical variables) and Student's t-test (metric variables). In the second step, we ran a Pearson correlation matrix for descriptive purposes to observe the strength and direction of the association between the study variables. The correlation coefficients were interpreted as follows: 0.1 = small, 0.3 = medium, and ≥0.5 = large [52]. In the third step, for further descriptive purposes, we performed a multivariate analysis [53] to verify the association between SRH, income, education, and PA (independent variables) with PP (dependent variable). The procedure was carried out by including all independent variables simultaneously in the regression model. Two models were tested: Model 1 unadjusted and Model 2 adjusted for confounding factors (i.e., sex, age, chronic diseases, disabilities [mobility, vision, hearing]). Finally, a Parallel and Serial Mediation analysis [54] was performed to address the study’s main objective. Income (M1) and years of education (M2) mediators were included, serially preceded by the third mediator, which was PA (M3). A complete mediation was considered if the association size between the independent variable (SRH) and the dependent variable (PP) did not remain significant, which would be pointed out when the confidence interval included the value of zero [55]. On the other hand, a partial mediation was considered if the relationship observed between the independent variable (SRH) and the dependent variable (PP) became weaker after the inclusion of the mediators income, education, and PA (M1, M2, M3). Preceding the mediation analysis, the assumptions of multiple regression were verified [56].
Data analysis was performed using IBM SPSS Statistics version 22 (SPSS Inc., an IBM Company, Chicago, IL, USA). When statistical tests were applied, the significance level was set at ᾳ < 0.05. The model of trajectories was composed of nine direct effects. Our model included two parallel mediators (M1 and M2), preceded by a third mediator (M3). The nine coefficients (Figure 2) were calculated using least squares regression analyses. X’s direct and indirect effects on Y were estimated using four equations (one for each of the three mediators) and one for the consequent final Y, of the three mediators), and one for the final consequent Y, as follows:
M1 = i M1 + a1X + e M1
M2 = i M2 + a2X + d21 M1 + e M2
M3 = i M3 + a3X + d31 M1 + e M3
Y = iY + c′X + b1 M1 + b2 M2 + b3 M3 + eY
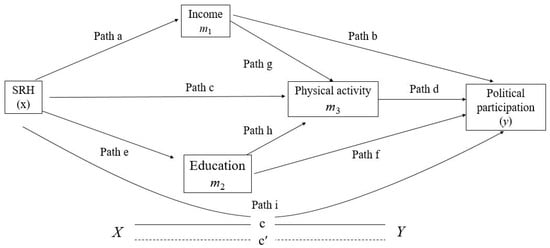
Figure 2.
Parallel model of serial mediation to determine the mediating effect of Income, Education, and Physical Activity in the association between SRH and PP. Path (a) = association between independent variable SRH (X) with Income mediator (M1), Path (b) = association between Income mediator (M1) with dependent variable PP (Y), Path (c) = association between independent variable SRH (X) with PA mediator (M3), Path (d) = association between PA mediator (M3) with dependent variable PP (Y), Path (e) = association between independent variable SRH (X) with Education mediator (M2), Path (f) = association between Education mediator (M2) with dependent variable PP (Y), Path (g) = association between Income mediator (M1) with mediator PA (M3), Path (h) = association between Education mediator (M2) with mediator PA (M3), and Path (i) represents c′ = direct effect (X − Y).
The analyses of the complete model (Figure 2) included four submodels: Model 1 and Model 2 performed the regressions of each of the parallel mediators M1 and M2 on X; Model 3 processed the regression of M3 simultaneously on X, on M1, and M2; with Model 4, regression from Y to X was performed in M1, in M2, and M3. In parallel, the complete model calculated specific indirect effects (SIE’s). The technique used for the calculations consisted of the product of the path coefficients in a sequence, namely: SIE1 = a × b, SIE2 = a × g × d, SIE3 = c × d, SIE4 = e × f, SIE5= e × h × d. Moreover, the total indirect effect was calculated, corresponding to the sum of all SIE’s = SIE1 + SIE2 + SIE3 + SIE4 + SIE5.
Mediation analyses reported the standardized (β) regression coefficients. We also calculated the proportion mediated (PM) when a significant effect was observed for an indirect mediator (95% CI did not contain zero). The calculation of the PM of the total effect was obtained by dividing the indirect effect by the total effect. The PM indicates in percentage terms how much was the change in the regression coefficients, revealing the effect of exposure on a mediated response when an intermediate variable is included in the model [57].
3. Results
3.1. Participants’ Characteristics
Table 1 presents the main characteristics of the participants and the main variables. Of the 14,701 citizens included in the study, 47.5% were men (64.63 ± 9.69 years), and 52.5% were women (65.12 ± 10.15 years). Among chronic degenerative diseases, except for high blood pressure (p > 0.050), all others showed statistically significant differences between voters and non-voters (p < 0.001). Non-voters indicated a higher prevalence of disabilities (p < 0.001). Comparatively, citizens who voted indicated higher scores in all study variables, such as household income, years of education, PA, SRH, and PP, than those who had not voted in the last election. All variables pointed to statistically significant differences.

Table 1.
Main characteristics of the sample.
3.2. Associations Between the Variables of Interest
For descriptive purposes, Table S1 (Supplementary Materials) shows results of the correlation analyses between the main study variables. Household income correlated positively, to a small extent, and significantly with PP (r = 0.07), SRH (r = 0.23), and PP (r = 0.21), and positively, to a medium extent, and significantly with education (r = 0.39). Education correlated positively, to a small extent, and significantly with PA (r = 0.13), SRH (r = 0.23), vote (r = 0.12), and PP (r = 0.28). PA correlated positively, to a small extent, and significantly with SRH (r = 0.24), and PP (r = 0.14). SRH correlated positively, to a small extent, and significantly with PP (r = 0.14).
3.3. Associations Between SRH, Income, Education, and PA with PP
For further descriptive purposes, Table S2 (Supplementary Materials) presents the results of the multivariate logistic regression. The model was statistically significant [Z(4,15038) = 461,089; p < 0.001; R2 = 0.233]. Among voters, there was a positive and significant association (p < 0.001) between all independent variables with PP (dependent variable). Thus, having high levels of SRH represented a chance of promoting PP of up to 3% (OR, 1.036; 95% CI, 0.041–0.119; p < 0.001). Higher income, education, and PA levels showed higher odds for increasing PP in approximately 10% (OR, 1.099; 95% CI, 0.086–0.126; p < 0.001), 22% (OR, 1.221; 95% CI, 0.069–0.082; p < 0.001), and 9% (OR, 1.093; 95% CI, 0.041–0.060; p < 0.001), respectively. Among non-voters, the association of SRH with PP was not significant (p = 0.062). On the other hand, we found a positive and significant association between PP and all other mediators (p < 0.001). In proportional terms, income, education, and PA indicated an odds of increasing PP by up to 7% (OR, 1.068; 95% CI, 0.020–0.079; p < 0.001), 19% (OR, 1.196; 95% CI, 0.038–0.058; p < 0.001), and 8% (OR, 1.086; 95% CI, 0.015–0.041; p < 0.001), respectively.
After adjusting for confounding factors (i.e., sex, age, chronic diseases, disability), the model remained significant [Z(4,15038) = 461,089; p < 0.001, R2 = 0.214]. Voters indicated a positive and significant association between PP and all independent variables (p < 0.001). In proportional terms, higher SRH, income, education, and PA scores indicated a greater chance to increase PP by up to 5% (OR, 1.053; 95% CI, 0.074–0.159; p < 0.001), 9% (OR, 1.087; 95% CI, 0.041–0.059; p < 0.001), 21% (OR, 1.214; 95% CI, 0.073–0.114; p < 0.001), and 9% (OR, 1.092; 95% CI, 0.067–0.080; p < 0.001), respectively. Among non-voters, after controlling for covariates (i.e., age, sex, chronic diseases, disability), positive and significant associations between PP and all independent variables were found (p ≤ 0.050). Thus, the higher the SRH, income, education, and PA score, the greater the odds of increasing PP by up to 5% (OR, 1.047; 95% CI, 0.003–0.110; p < 0.038), 5% (OR, 1.057; 95% CI, 0.011–0.071; p = 0.007), 19% (OR, 1.194; 95% CI, 0.037–0.058; p < 0.001), and 8% (OR, 1.079; 95% CI, 0.013–0.039; p < 0.001), respectively.
3.4. Serial and Parallel Mediation Analysis for Citizens Who Voted (n = 12,227)
The total effect of the model (x–y) showed a significant positive association between SRH and PP [F(3,122) = 139,91, p < 0.001, R2 = 0.33). Therefore, the three variables proved to mediate the relationship between SRH and PP (Figure 3). According to Model 1 controlled for covariates (i.e., age, sex, chronic diseases, disability), SRH was positively and significantly associated with income (β = 0.33, t (122) = 19,035, p < 0.001). Income was associated negatively and significantly with PA (β = –0.06, t (122) = −2. 988, p = 0.027). In model 2 controlled for covariates (i.e., age, sex, chronic diseases, disability), SRH was associated positively and significantly with education (β = 1.09, t (122) = 19,694, p < 0.001), and education was associated positively and significantly with PA (β = 0.05, t (122) = 7.382, p < 0.001). In model 3, also controlled for covariates (i.e., age, sex, chronic diseases, disability), with the simultaneous inclusion of income and education, PA was positively and significantly associated with SRH (β = 0.87, t (122) = 23.530, p < 0.001). In turn, model 4 controlled for covariates (i.e., age, sex, chronic diseases, disability) indicated a positive and significant association of PP with the three mediators: income (β = 0.09, t (122) = 8.849, p < 0.001), education (β = 0.07, t (122) = 22.291, p < 0.001), and PA (β = 0.05, t (122) = 10.378, p < 0.001). Finally, the direct effect of the model (x − y) was positive and significant (β = 0.07, t (122) = 3.552, p < 0.004).
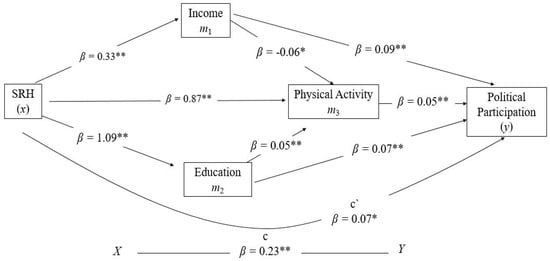
Figure 3.
Serial model of mediation for voters. * p < 0.020, ** p < 0.001.
The analysis of 10,000 bootstrap samples showed that all indirect effect pathways, except for the SIE 2 path (a × g × d), indicated positive and significant results (Table 2). The proportion of the total effect that SRH had on PP mediated by the three mediators was up to 68.64%. Regarding the proportions mediated by income, education, and PA, they explained the variance of the association between SRH and PP at approximately 13.53%, 35.34%, and 19.08%, respectively.
Table 2.
Bootstrap results for indirect effect between self-rated health and political participation mediated by income, years of education, and physical activity among citizens who voted (n = 12,227).
3.5. Serial and Parallel Mediation Analysis for Non-Voting Citizens (n = 2.447)
The total effect of the model (x − y) showed a significant positive association between SRH and PP [F(3.247) = 25,570, p < 0.001, R2 = 0.30) (Figure 4). In model 1 controlled for covariates (i.e., age, sex, chronic diseases, disability), SRH was associated positively and significantly with income (β = 0.24, t (247) = 7.420, p < 0.001). On the other hand, income was not associated with PA (β = 0.01, t (122) = 0.062, p = 0.950). In model 2, also controlled for covariates (i.e., age, sex, chronic diseases, disability), SRH was positively and significantly associated with education (β = 0.86, t (247) = 8.905, p < 0.001), and education was associated positively and significantly with PA (β = 0.06, t (122) = 3.862, p = 0.001). In model 3, controlled for covariates (i.e., age, sex, chronic diseases, disability), with the simultaneous inclusion of income and education, PA was associated positively and significantly with SRH (β = 0.71, t (247) = 9.474, p < 0.001). In model 4, controlled for covariates (i.e., age, sex, chronic diseases, disability), income showed no significant association with PP (β = 0.04, t (247) = 2.725, p = 0.065). On the other hand, education was positively and significantly associated with PP (β = 0.05, t (247) = 8.776, p < 0.001) and PA was associated positively and significantly with PP (β = 0.03, t (247) = 4.028, p < 0.001). Finally, the direct effect of the model (x − y) was not significant (β = 0.04, t (247) = 1.521, p = 0.128). The proportion of the total effect that SRH had on PP mediated by the three mediators was up to 64.64%.
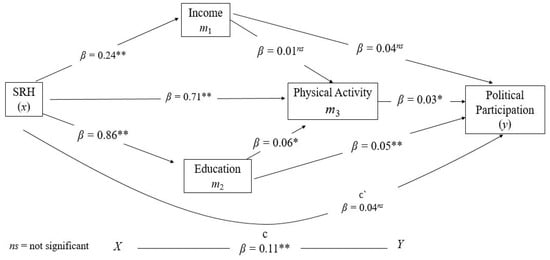
Figure 4.
Serial model of mediation for non-voters. * p < 0.020, ** p < 0.001.
The analysis based on 10,000 bootstrap samples indicated that, except for the SIE 2 path (a × g × d), all other indirect effect pathways showed positive and significant results (Table 3). Regarding the proportion mediated, the variables income, education and PA explained the variance of the association between SRH and PP at approximately 1.10%, 36.38%, and 17.54%, respectively.
Table 3.
The relationship between self-rated health and political participation is mediated by income, education years, and physical activity among non-voting citizens (n = 2.474).
4. Discussion
This study examined whether income, education, and PA mediated the relationship between SRH and PP of voters and non-voters aged 50 years and over from 20 European countries. The results revealed small, negative, and significant correlations between income, education, PA, SRH, and PP with age and sex. The inverse relationship was higher among men. In turn, income, education, PA, SRH, vote, and PP correlated slightly [58], positively, and significantly, suggesting the ability to enhance each other. Income and education are indicators of social class and can intersect with health, reducing or increasing PP [14]. Income is also associated with years of education [59], which can influence an individual’s political interest and engagement [16]. Thus, the lower the social class, the greater the tendency for the individual to achieve fewer years of schooling, followed by a greater likelihood of health problems and consequent low PP.
Adjusted and unadjusted models of our analyses suggested that increased SRH, income, education, and PA scores represented higher odds of PP intensification among voters and non-voters. These results were in agreement with findings of a previous study [15], as well as current research [60], which indicated a positive association between PP, education, and income. The analyses also confirmed that improved self-rated health could increase PP [3]. According to mediation models, among voters, the relationship between SRH and PP was partially mediated by education and income, suggesting that higher education levels indicate willingness and commitment to civic issues [61]. One possible explanation is that knowledge increases interest in democratic political processes [43]. Furthermore, increased income can prevent the establishment of a circle of vulnerabilities, such as educational level, which affects self-care, generates health inequalities, and consequently depresses PP. Among non-voters, education mediated also partially the relationship between SRH and PP. On the other hand, income was not a significant mediator of this relationship, suggesting that for this group, financial resources had no implications for PP. Thus, it is assumed that these citizens presented a series of underlying factors greater than income that prevented them from exercising PP.
In this study, voters and non-voters indicated significant differences in household income. A previous study conducted in Europe [62] showed that income inequalities generate unequal social and health policies for populations. In turn, egalitarian social policies, as a form of public redistribution and a consequence of active political participation, are a potential instrument for reducing income and health inequalities. Notably, among voters, household income was negatively associated with PA. This finding is interesting because, comparatively, voters had a PA score about 20.3% higher than non-voters. The result suggested further investigation, as it signaled that a higher income favored physical inactivity [20]. A current study has shown that the global burden associated with physical inactivity is greatest in high-income and middle-income countries [63]. Among non-voters, unlike voters, income was not a significant mediator of PA, indicating that financial status was not a prerequisite for maintaining or increasing PA. In both groups, education was positively associated with PA, suggesting that individuals with higher education tend to be more aware of and motivated to invest leisure time in becoming or remaining physically active [64]. A recent meta-analysis showed that higher levels of education were associated with 1.30 greater participation in leisure-time physical activities [65], which is an important contributor to total PA.
Finally, we found only a direct association between SRH and PP among voters. Therefore, several underlying factors may have influenced the political behavior of these citizens. The literature highlights that PP is an activity that requires action [66]. Thus, it is common for older individuals to feel limited from actively participating in political decisions [67]. Possible reasons for this behavior are the set of psychobiological changes linked to the natural aging process [68], responsible for a gradual loss of physical independence and cognitive autonomy. Consequently, as individuals age, subjective energy availability tends to decrease [35]. Therefore, as physical and cognitive health barriers accumulate, mental barriers emerge, leading older adults to perceive less energy available to increase their PA levels, which is uncommon compared to younger individuals [34]. Finally, another interesting result of this study was the largest proportion mediated that occurred in the SRH → PA → PP path: 35.34% for voters and 36.38% for non-voters. The findings shed light on the potential role that physically active behavior may play in PP in Europeans aged 50.
Strengths, Limitations and Future Directions
Among the strengths of this study is the representativeness of a large sample of middle-aged to older citizens residing in 20 European countries. Second, the findings revealed, in terms of percentages, the roles that income, education, and PA played in mediating the relationship between SRH and PP, differentiated between voters and non-voters. Third, we controlled the analyses for potential confounding factors associated with the main variables of interest. Finally, the information provided by this study can support specific actions to promote PP among European citizens aged 50 and over. On the other hand, the study has limitations. First, we used data from individuals with different characteristics, such as ethnic origin, religion, and employment. All these factors may have caused variance in the analyses [22,60]. Second, cross-sectional data limit interpretations of a causal association. Third, the data come from self-reported information provided, which may have led to bias. Fourth, self-reported PA was not categorized into levels or measured objectively. Fifth, the set of socioeconomic inequalities of the 20 countries included were not controlled for in the analyses. Socioeconomic resources shape citizens’ experiences in their political system, which influences trust in democracy and the effectiveness of politicians and parties [69]. Sixth, the social support variable was also not included in the analyses. Social support reflects the totality of help and assistance received or exchanged through social relationships and interpersonal transactions, which is fundamental to an individual’s physical and mental health [70]. Seventh, our analyses did not consider bidirectional associations in the pathway from SRH to PA. The literature highlighted that PA can both influence health factors and be influenced by a series of other variables [39]. Eighth, it is important to highlight that the present study specifically examined the population aged 50 or older at a specific time point, describing SRH as an aspect of subjective health. SRH is strongly associated with an individual’s subjective energy availability, which is essential for older adults to feel motivated to perform energy-demanding activities [34]. Therefore, the greater the perception of SRH, the greater the self-efficacy for effort, including the implementation of education and lifelong learning [29], as well as the accumulation of wealth in the periods preceding and during retirement [31]. Among the guidelines for future investigations, we first recommend carrying out projects with a prospective design, as it favors establishing prevalence and identifying causal associations between the variables studied. Second, it is suggested that our analyses be expanded with a focus on regions of the European continent. Third, cognitive deficits and mental illnesses have been associated with lower electoral participation [51,71]. Consequently, the loss of autonomy impacts the processing of information about party proposals and names of political candidates [9]. Thus, additional research is needed to examine the impact of cognition and mental problems on PP. Fourth, considering the largest proportion mediated by this study (SRH → PA → PP path), we suggest further exploration of the relationships between active and inactive physical behavior with PP and voter turnout. Finally, studies could focus in more detail on the characteristics of non-voters to create strategies that motivate these citizens to exercise their right to vote and participate in democratic processes in their nations.
5. Conclusions
We provide insights into the mechanisms that may explain the relationship between SRH and PP. Among non-voters, unlike education and PA, income was not a significant mediator of the relationship between SRH and PP. Furthermore, SRH was not associated with PP. Education and PA were significant mediators of the relationship between SRH and PP among voters, while income was negatively associated with education. In turn, SRH and PP were significantly associated. Our findings may contribute to a better understanding of the interrelationship between SRH and PP in European citizens aged 50 and older. Based on the results, policymakers can invest in education and promotion of PA levels, which consequently may increase or maintain the PP of voters, as well as increase the likelihood that non-voters will engage politically. In turn, investment in economic policies may feed back into the mechanisms underlying health, well-being, and quality of life, benefiting the political commitment of older adults. At the same time, when investments are perceived by the population, this can bring greater confidence in the work of politicians and governance, generating new votes.
Supplementary Materials
The following supporting information can be downloaded at: https://www.mdpi.com/article/10.3390/soc15100281/s1, Table S1: Correlation coefficients between the studied variables; Table S2: Multivariate analysis results for the association between self-rated health, income, education, and physical activity with political participation.
Author Contributions
Conceptualization, M.d.M.N. and A.I.; methodology, M.d.M.N. and A.I.; software, M.d.M.N. and A.M.; validation, M.d.M.N., É.R.G., A.M. and A.I.; formal analysis, M.d.M.N.; investigation, M.d.M.N. and A.I.; resources, A.M.; data curation, M.d.M.N. and A.M.; writing—original draft preparation, M.d.M.N. and A.I.; writing—review and editing, A.M. and É.R.G.; visualization, M.d.M.N., A.M., É.R.G. and A.I.; supervision, A.M., É.R.G. and A.I.; project administration, M.d.M.N., A.M., É.R.G. and A.I. All authors have read and agreed to the published version of the manuscript.
Funding
This research received no external funding.
Institutional Review Board Statement
Not applicable. Detailed information on ESS procedures is available in the survey protocol, including the International Statistical Institute Statement of Professional Ethics (https://www.europeansocialsurvey.org/about-ess accessed on 20 March 2025).
Informed Consent Statement
Informed consent was obtained from all subjects involved in this study.
Data Availability Statement
The datasets analyzed in the current study are available in the ESS repository: https://www.europeansocialsurvey.org/data-portal (accessed on 20 March 2025).
Conflicts of Interest
The authors declare no conflicts of interest.
References
- Dawes, D.E.; Amador, C.M.; Dunlap, N.J. The Political Determinants of Health: A Global Panacea for Health Inequities. In Oxford Research Encyclopedia of Global Public Health; Oxford University Press: Oxford, UK, 2022; pp. 1–21. ISBN 9780190632366. [Google Scholar]
- Mattila, M. Health and Disability Gaps in Political Engagement: A Short Review. In Wellbeing: Alternative Policy Perspectives; LSE Press: London, UK, 2022; Volume 2, pp. 167–184. [Google Scholar]
- Kavanagh Nolan, M.; Menon, A. Health as a Driver of Political Participation and Preferences and Political Actors. Implications for Policy-Makers and Political Actors. Policy Brief 67. European Observatory on Health Systems and Policies; WHO-World Health Organization: Copenhagen, Denmark, 2024. [Google Scholar]
- Bao, H.; Cao, J.; Chen, M.; Chen, M.; Chen, W.; Chen, X.; Chen, Y.; Chen, Y.; Chen, Y.; Chen, Z.; et al. Biomarkers of aging. Sci. China Life Sci. 2023, 66, 893–1066. [Google Scholar] [CrossRef]
- Couture, J.; Breux, S. The differentiated effects of health on political participation. Eur. J. Public Health 2017, 27, ckw245. [Google Scholar] [CrossRef] [PubMed][Green Version]
- Kirbiš, A.; Mattila, M.; Rapeli, L. Physical health conditions and political participation in Europe: The moderating effects of age. Comp. Eur. Politics 2024, 22, 212–242. [Google Scholar] [CrossRef]
- Zittel, T. Participatory Democracy and Political Participation? Zittel, T., Fuchs, D., Eds.; Routledge: Abingdon, UK, 2006; ISBN 9781134194711. [Google Scholar]
- van Deth, J.W. What Is Political Participation? In Oxford Research Encyclopedia of Politics; Oxford University Press: Oxford, UK, 2016; ISBN 9780190228637. [Google Scholar]
- Burden, B.C.; Fletcher, J.M.; Herd, P.; Jones, B.M.; Moynihan, D.P. How Different Forms of Health Matter to Political Participation. J. Politics 2017, 79, 166–178. [Google Scholar] [CrossRef]
- Ekman, J.; Amnå, E. Political participation and civic engagement: Towards a new typology. Hum. Aff. 2012, 22, 283–300. [Google Scholar] [CrossRef]
- Mattila, M.; Rapeli, L.; Wass, H.; Söderlund, P. Health and Political Engagement; Routledge: London, UK, 2017; ISBN 9781315561691. [Google Scholar]
- Maresova, P.; Javanmardi, E.; Barakovic, S.; Barakovic Husic, J.; Tomsone, S.; Krejcar, O.; Kuca, K. Consequences of chronic diseases and other limitations associated with old age—A scoping review. BMC Public Health 2019, 19, 1431. [Google Scholar] [CrossRef]
- Bleijenberg, N.; Zuithoff, N.P.A.; Smith, A.K.; de Wit, N.J.; Schuurmans, M.J. Disability in the individual ADL, IADL, and mobility among older adults: A prospective cohort study. J. Nutr. Health Aging 2017, 21, 897–903. [Google Scholar] [CrossRef]
- Lahtinen, H.; Mattila, M.; Wass, H.; Martikainen, P. Explaining Social Class Inequality in Voter Turnout: The Contribution of Income and Health. Scand. Political Stud. 2017, 40, 388–410. [Google Scholar] [CrossRef]
- Mayer, A.K. Does Education Increase Political Participation? J. Politics 2011, 73, 633–645. [Google Scholar] [CrossRef]
- Brown, C.L.; Raza, D.; Pinto, A.D. Voting, health and interventions in healthcare settings: A scoping review. Public Health Rev. 2020, 41, 16. [Google Scholar] [CrossRef]
- Goerres, A. Why are Older People More Likely to Vote? The Impact of Ageing on Electoral. Br. J. Politics Int. Relat. 2007, 9, 90–121. [Google Scholar] [CrossRef]
- Samuel, L.J.; Wright, R.; Granbom, M.; Taylor, J.L.; Hupp, C.; Lavigne, L.; Szanton, S.L. Community-dwelling older adults who are low-income and disabled weathering financial challenges. Geriatr. Nurs. 2021, 42, 901–907. [Google Scholar] [CrossRef]
- Donnelly, M.J.; Pop-Eleches, G. Income Measures in Cross-National Surveys: Problems and Solutions. Political Sci. Res. Methods 2018, 6, 355–363. [Google Scholar] [CrossRef]
- Allen, L.; Williams, J.; Townsend, N.; Mikkelsen, B.; Roberts, N.; Foster, C.; Wickramasinghe, K. Socioeconomic status and non-communicable disease behavioural risk factors in low-income and lower-middle-income countries: A systematic review. Lancet Glob. Health 2017, 5, e277–e289. [Google Scholar] [CrossRef]
- Katzmarzyk, P.T.; Friedenreich, C.; Shiroma, E.J.; Lee, I.-M. Physical inactivity and non-communicable disease burden in low-income, middle-income and high-income countries. Br. J. Sports Med. 2022, 56, 101–106. [Google Scholar] [CrossRef]
- Mattila, M.; Söderlund, P.; Wass, H.; Rapeli, L. Healthy voting: The effect of self-reported health on turnout in 30 countries. Elect. Stud. 2013, 32, 886–891. [Google Scholar] [CrossRef]
- Gollust, S.E.; Rahn, W.M. The Bodies Politic: Chronic Health Conditions and Voter Turnout in the 2008 Election. J. Health Politics Policy Law 2015, 40, 1115–1155. [Google Scholar] [CrossRef] [PubMed]
- Gagné, T.; Schoon, I.; Sacker, A. Health and voting over the course of adulthood: Evidence from two British birth cohorts. SSM—Popul. Health 2020, 10, 100531. [Google Scholar] [CrossRef] [PubMed]
- Harris, R.; Ullman, R.; Griffiths, P. Self-assessment of health and social care needs by older people. Rev. Clin. Gerontol. 2006, 16, 301–312. [Google Scholar] [CrossRef]
- Borim, F.S.A.; Neri, A.L.; Francisco, P.M.S.B.; Barros, M.B.d.A. Dimensions of self-rated health in older adults. Rev. Saúde Pública 2014, 48, 714–722. [Google Scholar] [CrossRef]
- Han, K.-M.; Ko, Y.-H.; Yoon, H.-K.; Han, C.; Ham, B.-J.; Kim, Y.-K. Relationship of depression, chronic disease, self-rated health, and gender with health care utilization among community-living elderly. J. Affect. Disord. 2018, 241, 402–410. [Google Scholar] [CrossRef]
- Blakely, T.A.; Kennedy, B.P.; Kawachi, I. Socioeconomic inequality in voting participation and self-rated health. Am. J. Public Health 2001, 91, 99–104. [Google Scholar] [CrossRef]
- Billett, S. Distinguishing lifelong learning from lifelong education. J. Adult Learn. Knowl. Innov. 2018, 2, 1–7. [Google Scholar] [CrossRef]
- Rad, E.H.; Rashidian, A.; Arab, M.; Souri, A. Comparison the effects of poor health and low income on early retirement: A systematic review and meta-analysis. Ind. Health 2017, 55, 306–313. [Google Scholar] [CrossRef]
- Semyonov, M.; Lewin-epstein, N.; Maskileyson, D. Social Science & Medicine Where wealth matters more for health: The wealth e health gradient in 16 countries. Soc. Sci. Med. 2013, 81, 10–17. [Google Scholar] [CrossRef]
- Karpati, A.; Galea, S.; Awerbuch, T.; Levins, R. Variability and Vulnerability at the Ecological Level: Implications for Understanding the Social Determinants of Health. Am. J. Public Health 2002, 92, 1768–1772. [Google Scholar] [CrossRef]
- Warburton, D.E.R.; Bredin, S.S.D. Health benefits of physical activity. Curr. Opin. Cardiol. 2017, 32, 541–556. [Google Scholar] [CrossRef]
- Cardini, B.B.; Freund, A.M. More or Less Energy with Age? A Motivational Life-Span Perspective on Subjective Energy, Exhaustion, and Opportunity Costs. Psychol. Aging 2020, 35, 369–384. [Google Scholar] [CrossRef] [PubMed]
- Cheval, B.; Boisgontier, M.P.; Sieber, S.; Ihle, A.; Orsholits, D.; Forestier, C.; Sander, D.; Chalabaev, A. Cognitive functions and physical activity in aging when energy is lacking. Eur. J. Ageing 2022, 19, 533–544. [Google Scholar] [CrossRef] [PubMed]
- O’Brien, M.W.; Kimmerly, D.S.; Mekari, S. Greater habitual moderate-to-vigorous physical activity is associated with better executive function and higher prefrontal oxygenation in older adults. GeroScience 2021, 43, 2707–2718. [Google Scholar] [CrossRef] [PubMed]
- Ramsey, K.A.; Rojer, A.G.M.; D’Andrea, L.; Otten, R.H.J.; Heymans, M.W.; Trappenburg, M.C.; Verlaan, S.; Whittaker, A.C.; Meskers, C.G.M.; Maier, A.B. The association of objectively measured physical activity and sedentary behavior with skeletal muscle strength and muscle power in older adults: A systematic review and meta-analysis. Ageing Res. Rev. 2021, 67, 101266. [Google Scholar] [CrossRef]
- Pearce, M.; Garcia, L.; Abbas, A.; Strain, T.; Schuch, F.B.; Golubic, R.; Kelly, P.; Khan, S.; Utukuri, M.; Laird, Y.; et al. Association Between Physical Activity and Risk of Depression. JAMA Psychiatry 2022, 79, 550. [Google Scholar] [CrossRef]
- Daskalopoulou, C.; Stubbs, B.; Kralj, C.; Koukounari, A.; Prince, M.; Prina, A.M. Physical activity and healthy ageing: A systematic review and meta-analysis of longitudinal cohort studies. Ageing Res. Rev. 2017, 38, 6–17. [Google Scholar] [CrossRef]
- Chaput, J.-P.; Willumsen, J.; Bull, F.; Chou, R.; Ekelund, U.; Firth, J.; Jago, R.; Ortega, F.B.; Katzmarzyk, P.T. 2020 WHO guidelines on physical activity and sedentary behaviour for children and adolescents aged 5–17 years: Summary of the evidence. Int. J. Behav. Nutr. Phys. Act. 2020, 17, 141. [Google Scholar] [CrossRef]
- Kim, Y.; Schneider, T.; Faß, E.; Lochbaum, M. Personal social capital and self-rated health among middle-aged and older adults: A cross-sectional study exploring the roles of leisure-time physical activity and socioeconomic status. BMC Public Health 2021, 21, 48. [Google Scholar] [CrossRef]
- Kostelka, F.; Blais, A.; Gidengil, E. Has the gender gap in voter turnout really disappeared? West Eur. Politics 2019, 42, 437–463. [Google Scholar] [CrossRef]
- Dassonneville, R.; Hooghe, M. Voter turnout decline and stratification: Quasi-experimental and comparative evidence of a growing educational gap. Politics 2017, 37, 184–200. [Google Scholar] [CrossRef]
- Stockemer, D.; Rapp, C. The influence of various measures of health on different types of political participation. Politics 2019, 39, 480–513. [Google Scholar] [CrossRef]
- Erdmane, A. The Right to Political Participation of Persons with Disabilities. In European Yearbook on Human Rights 2019; Intersentia: Louvain-la-Neuve, Belgium, 2019; pp. 383–404. [Google Scholar] [CrossRef]
- Aarøe, L.; Appadurai, V.; Hansen, K.M.; Schork, A.J.; Werge, T.; Mors, O.; Børglum, A.D.; Hougaard, D.M.; Nordentoft, M.; Mortensen, P.B.; et al. Genetic predictors of educational attainment and intelligence test performance predict voter turnout. Nat. Hum. Behav. 2020, 5, 281–291. [Google Scholar] [CrossRef] [PubMed]
- Sund, R.; Lahtinen, H.; Wass, H.; Mattila, M.; Martikainen, P. How voter turnout varies between different chronic conditions? A population-based register study. J. Epidemiol. Community Health 2017, 71, 475–479. [Google Scholar] [CrossRef] [PubMed]
- Gerl, K.; Marschall, S.; Wilker, N. Does the Internet Encourage Political Participation? Use of an Online Platform by Members of a German Political Party. Policy Internet 2018, 10, 87–118. [Google Scholar] [CrossRef]
- Balaj, M.; McNamara, C.L.; Eikemo, T.A.; Bambra, C. The social determinants of inequalities in self-reported health in Europe: Findings from the European social survey (2014) special module on the social determinants of health. Eur. J. Public Health 2017, 27 (Suppl. S1), 107–114. [Google Scholar] [CrossRef]
- Denton, M.; Prus, S.; Walters, V. Gender differences in health: A Canadian study of the psychosocial, structural and behavioural determinants of health. Soc. Sci. Med. 2004, 58, 2585–2600. [Google Scholar] [CrossRef]
- Matsubayashi, T.; Ueda, M. Disability and voting. Disabil. Health J. 2014, 7, 285–291. [Google Scholar] [CrossRef]
- Cohen, J. Set correlation and contingency tables. Appl. Psychol. Meas. 1988, 12, 425–434. [Google Scholar] [CrossRef]
- Aiken, L.S.; West, S.G.; Pitts, S.C. Multiple Linear Regression. In Handbook of Psychology; John Wiley & Sons, Inc.: Hoboken, NJ, USA, 2003; pp. 481–507. [Google Scholar] [CrossRef]
- Hayes, A.F. Introduction to Mediation, Moderation, and Conditional Process Analysis: A Regression-Basead Approach, 2nd ed.; Guilford Press, Ed.; Guilford Press: New York, NY, USA, 2018; Volume 7, ISBN 978146253454. [Google Scholar]
- Preacher, K.J.; Rucker, D.D.; Hayes, A.F. Addressing Moderated Mediation Hypotheses: Theory, Methods, and Prescriptions. Multivar. Behav. Res. 2007, 42, 185–227. [Google Scholar] [CrossRef]
- Uyanık, G.K.; Güler, N. A Study on Multiple Linear Regression Analysis. Procedia—Soc. Behav. Sci. 2013, 106, 234–240. [Google Scholar] [CrossRef]
- Ditlevsen, S.; Christensen, U.; Lynch, J.; Damsgaard, M.T.; Keiding, N. The Mediation Proportion. Epidemiology 2005, 16, 114–120. [Google Scholar] [CrossRef] [PubMed]
- McCabe, K.; Zhu, Y.; Bajaj, S.S.; Martin, A.F. Increasing Voter Participation Through Health Care–Based Voter Registration. JAMA Health Forum 2024, 5, e241563. [Google Scholar] [CrossRef] [PubMed]
- Lynch, S.M. Explaining Life Course and Cohort Variation in the Relationship between Education and Health: The Role of Income. J. Health Soc. Behav. 2006, 47, 324–338. [Google Scholar] [CrossRef]
- McGuire, C.M.; Gollust, S.E.; De Marco, M.; Durfee, T.; Wolfson, J.; Caspi, C.E. Equity at the Ballot Box: Health as a Resource for Political Participation Among Low-Income Workers in Two United States Cities. Front. Political Sci. 2021, 2, 601323. [Google Scholar] [CrossRef] [PubMed]
- Jeroense, T.; Spierings, N. Political participation profiles. West Eur. Politics 2023, 46, 1–23. [Google Scholar] [CrossRef]
- Jutz, R. The role of income inequality and social policies on income-related health inequalities in Europe. Int. J. Equity Health 2015, 14, 117. [Google Scholar] [CrossRef] [PubMed]
- Katzmarzyk, P.T.; Ross, R.; Blair, S.N.; Després, J.-P. Should we target increased physical activity or less sedentary behavior in the battle against cardiovascular disease risk development? Atherosclerosis 2020, 311, 107–115. [Google Scholar] [CrossRef]
- Gray, P.M.; Murphy, M.H.; Gallagher, A.M.; Simpson, E.E.A. Motives and Barriers to Physical Activity Among Older Adults of Different Socioeconomic Status. J. Aging Phys. Act. 2016, 24, 419–429. [Google Scholar] [CrossRef]
- Barr, A.L.; Partap, U.; Young, E.H.; Agoudavi, K.; Balde, N.; Kagaruki, G.B.; Mayige, M.T.; Longo-Mbenza, B.; Mutungi, G.; Mwalim, O.; et al. Sociodemographic inequities associated with participation in leisure-time physical activity in sub-Saharan Africa: An individual participant data meta-analysis. BMC Public Health 2020, 20, 927. [Google Scholar] [CrossRef]
- Copeland, L. Value Change and Political Action. Am. Politics Res. 2014, 42, 257–282. [Google Scholar] [CrossRef]
- Engelman, M.; Joo, W.; Fletcher, J.; Burden, B. Health, Wealth, and Voting Trajectories in Later Life. J. Gerontol. Ser. B 2022, 77, 827–837. [Google Scholar] [CrossRef]
- Hahr, J.Y. Physiology of aging. Med. Hypotheses 2019, 123, 83–85. [Google Scholar] [CrossRef]
- Ehs, T.; Zandonella, M. Different Class Citizens: Understanding the Relationship between Socio-economic Inequality and Voting Abstention. Politics Cent. Eur. 2021, 17, 525–540. [Google Scholar] [CrossRef]
- Scarapicchia, T.M.F.; Amireault, S.; Faulkner, G.; Sabiston, C.M. Social support and physical activity participation among healthy adults: A systematic review of prospective studies. Int. Rev. Sport Exerc. Psychol. 2017, 10, 50–83. [Google Scholar] [CrossRef]
- Schur, L.; Shields, T.; Kruse, D.; Schriner, K. Enabling Democracy: Disability and Voter Turnout. Polit. Res. Q. 2002, 55, 167–190. [Google Scholar] [CrossRef]
Disclaimer/Publisher’s Note: The statements, opinions and data contained in all publications are solely those of the individual author(s) and contributor(s) and not of MDPI and/or the editor(s). MDPI and/or the editor(s) disclaim responsibility for any injury to people or property resulting from any ideas, methods, instructions or products referred to in the content. |
© 2025 by the authors. Licensee MDPI, Basel, Switzerland. This article is an open access article distributed under the terms and conditions of the Creative Commons Attribution (CC BY) license (https://creativecommons.org/licenses/by/4.0/).