Abstract
Background: University students may be vulnerable to food insecurity (FI) due to limited financial resources, lower purchasing power, and increasing housing and food costs. This study aimed to assess the prevalence and severity of FI and its associated factors among university students attending a public Portuguese university. Methods: A cross-sectional survey was designed, and data were collected using a self-reported online questionnaire validated for the Portuguese population. The study population included students from all levels of study and the assessments were conducted during the winter semester (December 2021 to February 2022). Chi-square tests were used to determine the associations between FI and sociodemographic variables. Bivariate logistic regression was further used to assess factors associated with FI. Results: From the 284 participants, 17.3% of students were classified as food insecure, consisting of 14.1% with mild FI, 2.1% with moderate FI, and 1.1% with severe FI. FI was significantly associated with nationality (p = 0.028) and the number of unemployed household members (p = 0.001). In comparison to Portuguese students, students of other nationalities were 4.1 times more likely to be food insecure (OR = 4.089, 95% CI:1.057–15.821, p = 0.041). Students in households with a higher number of members (OR = 2.537, 95% CI:1.231–5.230, p = 0.012) and a higher number of unemployed members (OR = 3.192, 95% CI:1.681–6.059, p < 0.001) were also 2.5 and 3.1 times more likely, respectively, to be food insecure. Conclusions: This study provides an insight into the FI levels of university students in a Portuguese university. Further future studies are needed to use objective measures of food insecurity (availability, access, and utilization of food) and explore interventions addressing food insecurity in this population.
1. Introduction
The concepts of food security (FS) has evolved over the last few decades, and even though the Right to Food has been recognized in the United Nations Declaration of Human Rights since 1948 [1], the term FS was only first originated in the mid-1970s during the World Food Conference (1974). Nowadays, the widely accepted definition promulgated by the Food and Agriculture Organization is that “food security exists when all people, at all times, have physical, social and economic access to sufficient, safe and nutritious food which meets their dietary needs and food preferences for an active and healthy life” [1,2]. Food insecurity (FI) exists whenever the availability of nutritionally adequate and safe foods or the ability to acquire acceptable foods in socially acceptable ways is limited or uncertain [3].
The sustainable development goals (SDGs) are a set of globally agreed objectives to end poverty, protect all that makes the planet habitable, and ensure that all people enjoy peace and prosperity [4]. The second SDG of the United Nations is to “end hunger, achieve food security and improved nutrition and promote sustainable agriculture”. Projections now show that, despite some progress, the world is not on track to achieve the second SDG until 2030, and the FS and nutritional status of the most vulnerable population groups are likely to deteriorate further due to the health and socioeconomic impacts of the coronavirus pandemic (COVID-19) [5].
The 2021/2022 academic year has been one of deep and interlocking crises provoked by COVID-19. A study conducted by the Directorate-General of Health aimed to find out about the eating habits of the Portuguese population in a context of social containment due to the COVID-19 pandemic. The changes in food consumption caused by confinement are essentially related to the increase in the number of meals eaten at home during the confinement phase, greatly reducing the use of pre-prepared meals (40.7%) or take-aways (43.8%), increasing the consumption of sweet snacks (30.9%), but also increasing the consumption of fruit (29.7%) and vegetables (21%). The most unfavorable changes in eating behavior occurred more often in younger respondents, males, those with more financial difficulties, and those at risk of FI [6].
University students may be more vulnerable to FI due to limited financial resources, lower purchasing power, and increasing housing and food costs [7]. Coping with major changes in life for the first time, such as being away from home, can make first-year students more susceptible to FI [8]. These students may also not have the food literacy and resources required for healthy food preparation [9]. Many studies suggest that university students can experience FI at greater rates than the general population [10,11,12,13].
Experiencing FI can increase the risk of chronic diseases such as obesity, hypertension, cardiovascular diseases, and diabetes and may be associated with FI in adulthood. Poor mental health and academic performance, including high rates of depression and anxiety and decreased ability to focus, are also associated [7,14].
In the last few years, due to the global financial crisis, FI even received attention in high-income countries due to the increasing trend toward poverty and more prominent indicators of social inequality [15]. The economic crisis resulted in increased taxes, unemployment rates, and salary cuts, which has made FI become a major concern of European organizations, including the Portuguese Government [16].
A previous study in 2011–2014 coordinated by the Portuguese Directorate-General for Health aimed to evaluate and monitor the situation surrounding FI in a sample of Portuguese households, and the percentage of households reporting FI varied between 48.5% and 50.7%. This historic time was particularly sensitive as Portugal was under the effects of a deep economic crisis and required external economic and financial assistance [17]. Subsequently, in 2015–2016, nationally representative data revealed that 10.1% of Portuguese households experienced FI [18]. More recently, a study that aimed to assess the eating and physical activity behaviors of Portuguese citizens living in social confinement one year after the beginning of the COVID-19 pandemic showed that the risk of being food insecure has risen to 33.2%, and 8% of individuals were recognized as facing economic difficulties in accessing food [19].
A systematic review of FI among students in higher education in the United States (US) found that the average prevalence of FI was 43.5%, with the lowest prevalence in universities studied being 21% and the highest being 58.8% [20]. Another systematic review including international studies showed that 42.0% of the university students were food insecure, with the prevalence of low and very low FS being 18.1% and 22.4%, respectively [21]. A study conducted in New Hampshire (US) reported an FI prevalence of 25% among university students [22]. However, the literature still has very scarce information regarding FI levels among university students in European countries, and no data were found in relation to Portuguese university students either before or during the COVID-19 pandemic.
This study aimed to assess the prevalence and severity of FI and its associated factors among university students attending a public university, contributing to the available knowledge regarding the wider context of FI and supporting the implementation of interventions addressing food insecurity in this population during and after the COVID-19 pandemic.
2. Materials and Methods
2.1. Study Design
This cross-sectional survey was designed to examine FI and its associated factors among university students in a northern public Portuguese university. Data were collected as part of the “Charter for Healthy and Sustainable Food at the University” [23] project, which is part of the university’s strategic plan that aims to support the pursuit of the United Nations’ 2030 Agenda [24]. Data were collected using a self-reported questionnaire which was posted online through Google® Forms. The study population included students from all levels of study (bachelor, master, and PhD, n = 7674). Assessments were conducted during the winter semester between December 2021 and February 2022.
2.2. Participant Recruitment and Enrolment
The questionnaire link was distributed by a variety of mechanisms to widely reach students. Subject recruitment occurred through advertising via e-mail, social media, and online announcements using the university’s systems. The e-mail was sent to all students and contained the link to the questionnaire, as well as information about the study. The same information was included in the online announcement using the university’s systems during the application period, which is a platform that students need to access almost every day. In addition, course directors were contacted and asked to collaborate in the dissemination of the study to their students during classes. The questionnaires were also shared on the university’s Facebook® and Instagram® pages, as well as on the social media pages of student organizations. A QR code was also generated and distributed while students were queueing in the canteen to provide easy access to the questionnaire. Similar recruitment and dissemination processes have previously been used in other FI prevalence studies [25].
2.3. Questionnaire
The applied questionnaire was adapted from a psychometric scale that was adapted and validated for the Portuguese population from the Brazilian Food Insecurity Scale, which was adapted from the US Household Food Security Survey Module [26,27]. The questionnaire had three parts: socioeconomic and demographic characterization; the food insecurity scale; and other additional questions.
The first part of the questionnaire included questions related to socioeconomic characteristics and student and household demographics. This initial part of the questionnaire also included data indicating the nutritional status (weight and height) of the subject and issues related to household food consumption and behavior. Body mass index (BMI) was calculated as weight (kg) divided by height (m2), and participants were classified according to World Health Organization BMI reference values, i.e., underweight, normal weight, overweight, and obesity [28].
In the second part, the methodology used to assess FI was a scale [26,29] composed of 14 closed-ended questions (yes or no) referring to the last 3 months. In this scale, 8 items are related to the adult members of the household and 6 (question 9 to 14) to households with children. The household’s FS was classified in 4 different categories: Food Security (household members have regular and permanent access to quality food in sufficient quantity without compromising access to other essential needs), Mild FI (household members report concern or uncertainty about access to food in the future or regarding inadequate food quality resulting from strategies that aim not to compromise the amount of food), Moderate FI (household members report a reduction in the quantity of food among adults or disruption in eating patterns resulting from a lack of food among adults), and Severe FI (household members report a reduction in the quantity of food among children or disruption in eating patterns resulting from a lack of food among children; hungry—when someone stays a whole day without eating due to not having enough money to buy food) [29].
The final score results from the sum of the affirmative answers and different cutting points were used (Table 1).

Table 1.
Household classification according to Food Security categories.
In addition to the FI scale, five additional questions were included referring to the student’s perception of changes in dietary patterns.
2.4. Ethics
This study was approved by the ethics committee of Trás-os-Montes e Alto Douro University and all the participants provided informed consent prior to completing the assessment procedures.
2.5. Statistical Analysis
Sample size was calculated a priori for binary logistic regression. To obtain a power sample ≥ 80%, a medium effect size (f2 = 0.15), and α = 0.05, we had to enroll 224 subjects. Descriptive analysis was undertaken using IBM SPSS Statistics for Windows (version 27) to investigate the prevalence of FI and to summarize sociodemographic characteristics. A Pearson’s chi-square test was used to determine the associations between FI and sociodemographic variables. Bivariate logistic regression was further used to assess factors associated with FI. Results were expressed as odds ratios with 95% confidence intervals (CIs). A p-value of <0.05 was considered statistically significant.
3. Results
A total of 284 students participated in the study. Figure 1 represents the FS status of the students by level, showing that 82.7% (n = 235) of the students were food secure and that the remaining students were classified as food insecure (17.3%).
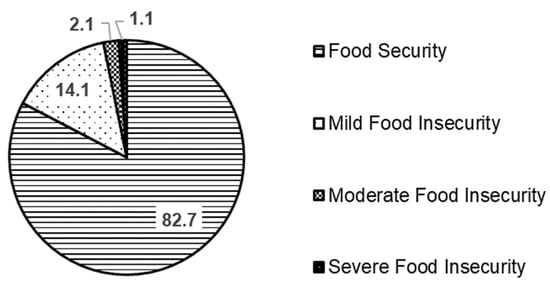
Figure 1.
Prevalence of food security by category (%).
The most affirmatively answered question related to the concern that food in the household might run out before there was enough money to buy more (13.4%). In the 3 months before answering the questionnaire, 7.0% of the students also reported that household members had had to eat food that they still had at home because they had run out of money. There were no affirmative responses regarding the questions related to children/adolescents in the household skipping meals or being hungry because of a lack of money (Table 2).
Table 2.
Percentage of affirmative answers provided by students for the food insecurity questions.
Most of the participants were female (80.3%) and above 18 years old (82.4%). Our results show that most of the students were Portuguese nationals (96.8%) who lived in the north of Portugal (90.8%). Additionally, responses demonstrated that a great number of students were unemployed (91.5%) or were undergraduates (76.8%). More than three quarters (77.5%) reported themselves to be in the normal BMI range (18.50–24.99 Kg/m2). About 43.0% of households included 4 members, 89.1% did not include members over the age of 65, and around 68% had children or adolescents. Around 19.7% of the students reported having at least one household member that was unemployed. Most of the households had 2 or fewer members contributing toward family income (90.8%) (Table 3).
Table 3.
Socioeconomic and demographic characterization of the participants.
The prevalence of FI was greater among those who identified as having another nationality besides Portuguese (44.4% vs. 16.4%, p = 0.028) and was also greater among students with a higher number of unemployed household members (p < 0.001). Indeed, the prevalence of FI was more than 3 times higher in households that had 2 or more unemployed members (38.9%) compared to those that did not have any unemployed members (12.4%).
In comparison o students with Portuguese nationality, students of other nationalities were 4.1 times more likely to be food insecure (OR = 4.089, 95% CI:1.057–15.821, p = 0.041). Students with a higher number of household members (OR = 2.537, 95% CI:1.231–5.230, p = 0.012) and students with a higher number of unemployed household members (OR = 3.192, 95% CI:1.681–6.059, p < 0.001) were also 2.5 and 3.2 times more likely, respectively, to be food insecure. Results show overweight students are more likely to have FI; however, this association was not statistically significant (Table 4).
Table 4.
Binary logistic regression results of food insecurity status in relation to sociodemographic and student characteristics (n = 284).
Around 7.4% of the students reported changes in essential food consumption in their household due to economic difficulties. The main changes in households due to economic difficulties were eating out less (22.9%) and obtaining food through their own production or from family members or others (9.8%). The most pointed reasons for not always having the types of food they wanted or needed were the lack of money and the availability of good quality food (7.0%) (Table 5).
Table 5.
Student perceptions of changes in dietary patterns in the last 3 months.
4. Discussion
Few studies in middle- and high-income countries have documented the FS status of university students [20,22,30] and, to the best of our knowledge, this is the first study to document FI and its associated factors among university students in Portugal.
FI can limit individual’s physical and mental ability, but also represent social and economic burden [31]. The present study revealed that FI is highly prevalent (affecting 17.3% of the students), which means that one in six university students is food insecure. This prevalence of FI was higher than what was found in nationally representative data from 2015/2016 (10% FI in Portuguese households) [18]. These results were founded in other previous reports from different countries suggesting that university students experience FI at greater rates than the general population [10,11,12,13]. A potential explanation could be the limited financial resources, lower purchasing power, and increasing housing and food costs among university students [7], as well as poor food literacy, a lack of budgeting skills, and limited resources for healthy food preparation [9].
However, the FI prevalence found in university students is lower than the values that were found in the Portuguese population during the COVID-19 pandemic [19]. Other studies that evaluated changes in food security status among college students during the COVID-19 pandemic found that the pandemic led to changes in food security among university students; some students experienced an increase in FI and others a decrease, with this evolution associated with a variety of characteristics, such as changes in housing and employment status [11,32,33,34]. Our results also indicate that university students mostly expressed concern or uncertainty regarding access to food in the future or changes in food type, with few compromises needing to be made in relation to the amount of food consumed (Mild FI was 14.1%).
The prevalence of FI levels among university students in our study is lower and less severe than other studies involving different countries (ranging from 42.0 to 43.5%) [20,21]. These differences could be explained by the differences between higher education systems and university models, by substantial financial barriers and an increased reliance on borrowed money, and by the influence of a country’s socioeconomic status (including Gross Domestic Product (GDP), poverty ratios, unemployment rates, and inflation levels).
Differences in FS status based on demographic and socioeconomic factors were found. To be of a non-native nationality was a greater risk factor for FI, and the ERASMUS+ program (the European Union’s program that offers mobility opportunities) could be related to the presence of non-Portuguese respondents in the sample studied [35]. The literature presents a considerable change in priorities in terms of consumption behaviors when students are at home versus when they are taking part in mobility programs. When at home, quality is stated as the most important criteria (45.5%), and price closely follows (44.4%). However, when students are taking part in mobility programs, price emerges as the most important criterion (59.6%), leaving quality behind as the second most important factor (32.7%). The increasing importance of price as a criterion for buying products is possibly connected to limited financial resources during participation in mobility programs. Associations between students in mobility programs and FI should be further investigated [35].
Another factor associated with FI was having a higher number of unemployed members in the household, which is consistent with previous research linking unemployment and household FI, especially during the COVID-19 pandemic [34,36]. It is widely acknowledged that job loss or unemployment is one of the most important risk factors for household FI. Unemployment mainly affects household food consumption through negative income shock and income volatility. Previous studies show that FI rate is associated with unemployment rate, and households with no adults employed are more likely to experience FI [37].
In this study, students with a higher number of household members were more likely to have FI, which is consistent with previous findings [38]. Usually, a large family size puts an extra burden on food consumption and members are more likely to experience FI in contrast to members of households with a small family size. However, if other household members can contribute toward total household income, this reduces the adverse consequences of FI [39].
No association was found between FI and an increased risk of being overweight or obese, as with previous studies [40,41]. However, some studies did find evidence for this association [16,34], which has come to be known as the “hunger-obesity paradox”; food insecure subjects are at greater risk of developing obesity, challenging the traditional thinking that obesity is only associated with excessive food consumption [34].
High rates of FI among university students should be a concern given the risk of inadequate food availability [30]. Besides the economic difficulties in accessing food, respondents to this questionnaire reported the availability of good quality and desired foods as one of the main reasons for not always having the types of food they want or need. Inadequate availability of good quality food may have a negative impact on their nutritional status and academic performance [7,14]. Therefore, addressing FI among university students should be a major focus of stakeholders and policy makers in order to improve the educational attainment and social security of these students upon their graduation [30].
Universities, as role models of education and sustainability, must address FI questions and promote solutions to overcome this issue. Nowadays, the common strategy adopted to support food insecure students is the implementation of food pantries or food vouchers [42]. Another simple and low-cost approach that addresses FI and food waste is using an electronic learning management system to connect university students with good quality excess food that remains after catered events [43]. Some authors argue that universities should not only adopt measures that allow for a health-promoting environment with nutritional good quality food at affordable prices, but also create initiatives that are able to provide students with knowledge and skills, namely food and financial literacy [41,42]. Further, there is a need for strategies which ensure adequate support is provided to students for factors such as housing and healthcare, which extend beyond the responsibility of universities to other institutions, such as governments [44].
The present study suggests that university students appear to be a particularly vulnerable group at risk of FI, and that FI status appears to be related to their socioeconomic and demographic attributes. Given the scarcity of data, especially among European countries, further representative investigation of university students’ FI, health and social outcomes, and strategy responses is needed.
To better understand the impact of FI on university campuses, future research should consider and improve upon the current study’s limitations. As described, this study only included a single northern public university with a small sample size and relied on student self-reports of FS questions and the use of self-reported weight and height [45]. Additionally, FI identification is based on individual self-perception. Despite these limitations, the study provides a significant contribution to understanding FS levels among Portuguese university students.
5. Conclusions
The present study in a Portuguese public university shows that the prevalence of FI was high (17.3%). Foreign nationality, a higher number of household members, and a higher number of unemployed household members were associated with higher odds of being food insecure. In the future, higher education institutions should implement systematic screening for FI and implement policies and programmatic initiatives to prevent it, while also promoting a healthier university experience. Future research can be conducted in other universities, use objective measures of FI (availability, access, and utilization of food), and explore interventions addressing food insecurity in this population.
Supplementary Materials
The following supporting information can be downloaded at: https://www.mdpi.com/article/10.3390/soc12060174/s1. The supplementary document contains the questionaire used in our study.
Author Contributions
Conceptualization, C.G. and J.A.; methodology, C.G.; software, B.M., C.G. and J.A.; validation, C.G., I.R. and J.A.; investigation, B.M. and C.G.; resources, C.G., I.R. and J.A.; data curation, C.G. and J.A.; writing—original draft preparation, B.M. and C.G.; writing—review and editing, B.M., J.A, I.R., C.R. and C.G.; supervision, C.G.; project administration, C.G.; funding acquisition, J.A, I.R., C.R. and C.G. All authors have read and agreed to the published version of the manuscript.
Funding
The CECAV is supported by FCT/UIDB/CVT/00772/2020. The CITAB is supported by FCT/UIDB/04033/2020.
Institutional Review Board Statement
The study was conducted in accordance with the Declaration of Helsinki, and approved by the Ethics Committee of Universidade de Trás-os-Montes e Alto Douro (protocol code Doc5-CE-UTAD-2021).
Informed Consent Statement
Informed consent was obtained from all subjects involved in the study.
Data Availability Statement
The data presented in this study are available on request from the corresponding author. The questionaire used for the study is available in the Supplementary Materials.
Conflicts of Interest
The authors declare no conflict of interest.
References
- FAO. Policy Brief: Food Security; FAO Agriculture and Development Economics Division: Rome, Italy, 2006; Volume 2. [Google Scholar]
- Dutta, H.; Saikia, A.A. Food security: A review on its definition, levels and evolution. Asian J. Multidimens. Res. (AJMR) 2018, 7, 111–122. [Google Scholar]
- Anderson, S.A. Core indicators of nutritional state for difficult-to-sample populations. J. Nutr. 1990, 120, 1555–1600. [Google Scholar] [CrossRef] [PubMed]
- Morton, S.; Pencheon, D.; Bickler, G. The sustainable development goals provide an important framework for addressing dangerous climate change and achieving wider public health benefits. Public Health 2019, 174, 65–68. [Google Scholar] [CrossRef]
- World Health Organization. The State of Food Security and Nutrition in the World 2021: Transforming Food Systems for Food Security, Improved Nutrition and Affordable Healthy Diets for All; Food & Agriculture Org.: Rome, Italy, 2021; Volume 2021. [Google Scholar]
- Direção Geral da Saúde. REACT-COVID—Inquérito Sobre Alimentação e Atividade Física em Contexto de Contenção Social; Direção Geral da Saúde: Lisbon, Portugal, 2020. [Google Scholar]
- El Zein, A.; Shelnutt, K.P.; Colby, S.; Vilaro, M.J.; Zhou, W.; Greene, G.; Olfert, M.D.; Riggsbee, K.; Morrell, J.S.; Mathews, A.E. Prevalence and correlates of food insecurity among US college students: A multi-institutional study. BMC Public Health 2019, 19, 660. [Google Scholar] [CrossRef] [PubMed]
- Pancer, S.M.; Hunsberger, B.; Pratt, M.W.; Alisat, S. Cognitive complexity of expectations and adjustment to university in the first year. J. Adolesc. Res. 2000, 15, 38–57. [Google Scholar] [CrossRef]
- Clifford, D.; Anderson, J.; Auld, G.; Champ, J. Good Grubbin’: Impact of a TV cooking show for college students living off campus. J. Nutr. Educ. Behav. 2009, 41, 194–200. [Google Scholar] [CrossRef]
- Abbey, E.L.; Brown, M.; Karpinski, C. Prevalence of Food Insecurity in the General College Population and Student-Athletes: A Review of the Literature. Curr. Nutr. Rep. 2022, 11, 185–205. [Google Scholar] [CrossRef]
- Davitt, E.D.; Heer, M.M.; Winham, D.M.; Knoblauch, S.T.; Shelley, M.C. Effects of COVID-19 on university student food security. Nutrients 2021, 13, 1932. [Google Scholar] [CrossRef]
- DeBate, R.; Himmelgreen, D.; Gupton, J.; Heuer, J.N. Food insecurity, well-being, and academic success among college students: Implications for post COVID-19 pandemic programming. Ecol. Food Nutr. 2021, 60, 564–579. [Google Scholar] [CrossRef]
- Nikolaus, C.J.; Ellison, B.; Nickols-Richardson, S.M. Are estimates of food insecurity among college students accurate? Comparison of assessment protocols. PLoS ONE 2019, 14, e0215161. [Google Scholar] [CrossRef]
- Leung, C.W.; Insolera, N.; Cohen, A.J.; Wolfson, J.A. The Long-Term Effect of Food Insecurity during College on Future Food Insecurity. Am. J. Prev. Med. 2021, 61, 923–926. [Google Scholar] [CrossRef] [PubMed]
- Gregório, M.J.; Graça, P.; Costa, A.; Nogueira, P.J. Time and regional perspectives of food insecurity during the economic crisis in Portugal, 2011–2013. Saúde Soc. 2014, 23, 1127–1141. [Google Scholar] [CrossRef]
- Correia, C.C.; Santos, A.B.; Camolas, J. O paradoxo insegurança alimentar e obesidade: Uma revisão da realidade portuguesa e dos mecanismos associados. Acta Port. Nutr. 2018, 13, 14–21. [Google Scholar] [CrossRef][Green Version]
- Gregório, M.J.; Graça, P.; Santos, A.C.; Gomes, S.; Portugal, A.C.; Nogueira, P.J. Relatório INFOFAMÍLIA 2011–2014; Gomes, S., Ed.; Direção-Geral da Saúde: Lisbon, Portugal, 2017. [Google Scholar]
- Lopes, C.; Torres, D.; Oliveira, A.; Severo, M.; Alarcão, V.; Guiomar, S.; Mota, J.; Teixeira, P.; Rodrigues, S.; Lobato, L. Inquérito Alimentar Nacional e de Atividade Física IAN-AF 2015–2016: Relatório de Resultados; Universidade do Porto: Porto, Portugal, 2017. [Google Scholar]
- Silva, M.N.; Gregório, M.J.; Santos, R.; Marques, A.; Rodrigues, B.; Godinho, C.; Silva, C.S.; Mendes, R.; Graça, P.; Arriaga, M. Towards an In-Depth Understanding of Physical Activity and Eating Behaviours during COVID-19 Social Confinement: A Combined Approach from a Portuguese National Survey. Nutrients 2021, 13, 2685. [Google Scholar] [CrossRef]
- Nazmi, A.; Martinez, S.; Byrd, A.; Robinson, D.; Bianco, S.; Maguire, J.; Crutchfield, R.M.; Condron, K.; Ritchie, L. A systematic review of food insecurity among US students in higher education. J. Hunger Environ. Nutr. 2019, 14, 725–740. [Google Scholar] [CrossRef]
- Bruening, M.; Argo, K.; Payne-Sturges, D.; Laska, M.N. The struggle is real: A systematic review of food insecurity on postsecondary education campuses. J. Acad. Nutr. Diet. 2017, 117, 1767–1791. [Google Scholar] [CrossRef]
- Davidson, A.; Morrell, J. Food insecurity prevalence among university students in New Hampshire. J. Hunger Environ. Nutr. 2020, 15, 118–127. [Google Scholar] [CrossRef]
- Gonçalves, C.; Alves, E.; Marques, B.; Saraiva, C.; Azevedo, J. Carta para a alimentação saudável da Universidade de Tras-os-Montes e Alto Douro. In Campus y Ciudadanías Saludables: Estudios Para Una Promoción Integral de la Salud en la Región Iberoamericana; Universidad de Burgos: Burgos, Spain, 2020; pp. 221–231. [Google Scholar]
- Desa, U. Transforming Our World: The 2030 Agenda for Sustainable Development; United Nations: New York, NY, USA, 2016; Available online: https://wedocs.unep.org/20.500.11822/11125 (accessed on 10 September 2022).
- Aguiar, A.; Maia, I.; Pinto, M.; Duarte, R. Food Insecurity in Portugal during the COVID-19 Pandemic: Prevalence and Associated Sociodemographic Characteristics. Port. J. Public Health 2022, 40, 35–42. [Google Scholar] [CrossRef]
- Gregório, M.J.; Graça, P.; Nogueira, P.J.; Gomes, S.; Santos, C.A.; Boavida, J. Proposta Metodológica Para a Avaliação da Insegurança Alimentar em Portugal; Revista Nutrícias 21: 4-11; 2014; Available online: https://repositorio.ul.pt/bitstream/10451/17617/1/proposta.pdf (accessed on 10 September 2022).
- Gregório, M.; Nogueira, P.; Graça, P. The First Validation of the Household Food Insecurity Scale in a Sample of the Portuguese Population. Desigualdades Sociais No Acesso a Uma Alimentação Saudável: Um Estudo na População Portuguesa. Ph.D. Thesis, Faculty of Nutrition and Food Sciences of University of Porto, Porto, Portugal, 2014. [Google Scholar]
- WHO. Anthropometric reference data for International use: Recommendations from a WHO Expert Committee. Am. J. Clin. Nutr. 1996, 64, 650–658. [Google Scholar]
- Pérez-Escamilla, R.; Segall-Corrêa, A.M.; Kurdian Maranha, L.; Sampaio, M.d.F.A.; Marín-León, L.; Panigassi, G. An adapted version of the US Department of Agriculture Food Insecurity module is a valid tool for assessing household food insecurity in Campinas, Brazil. J. Nutr. 2004, 134, 1923–1928. [Google Scholar] [CrossRef]
- Ukegbu, P.; Nwofia, B.; Ndudiri, U.; Uwakwe, N.; Uwaegbute, A. Food insecurity and associated factors among university students. Food Nutr. Bull. 2019, 40, 271–281. [Google Scholar] [CrossRef] [PubMed]
- Hughes, R.; Serebryanikova, I.; Donaldson, K.; Leveritt, M. Student food insecurity: The skeleton in the university closet. Nutr. Diet. 2011, 68, 27–32. [Google Scholar] [CrossRef]
- Soldavini, J.; Andrew, H.; Berner, M. Characteristics associated with changes in food security status among college students during the COVID-19 pandemic. Transl. Behav. Med. 2021, 11, 295–304. [Google Scholar] [CrossRef] [PubMed]
- Mialki, K.; House, L.A.; Mathews, A.E.; Shelnutt, K.P. COVID-19 and college students: Food security status before and after the onset of a pandemic. Nutrients 2021, 13, 628. [Google Scholar] [CrossRef]
- Owens, M.R.; Brito-Silva, F.; Kirkland, T.; Moore, C.E.; Davis, K.E.; Patterson, M.A.; Miketinas, D.C.; Tucker, W.J. Prevalence and social determinants of food insecurity among college students during the COVID-19 pandemic. Nutrients 2020, 12, 2515. [Google Scholar] [CrossRef] [PubMed]
- Erasmus, G. Research on the Habits of Erasmus Students: Consumer, Daily Life, and Travel Habits of Erasmus Students from the Perspective of Their Environmental Attitudes and Beliefs; Green Erasmus Partnership: Brussels, Belgium, 2020. [Google Scholar]
- Coleman-Jensen, A.; McFall, W.; Nord, M. Food Insecurity in Households with Children: Prevalence, Severity, and Household Characteristics, 2010–2011; United States Department of Agriculture: Washington, DC, USA, 2013. [Google Scholar]
- Maia, I.; Monjardino, T.; Frias, B.; Canhão, H.; Cunha Branco, J.; Lucas, R.; Santos, A.C. Food Insecurity in Portugal Among Middle- and Older-Aged Adults at a Time of Economic Crisis Recovery: Prevalence and Determinants. Food Nutr. Bull. 2019, 40, 504–513. [Google Scholar] [CrossRef]
- Zhou, D.; Shah, T.; Ali, S.; Ahmad, W.; Din, I.U.; Ilyas, A. Factors affecting household food security in rural northern hinterland of Pakistan. J. Saudi Soc. Agric. Sci. 2019, 18, 201–210. [Google Scholar]
- Drammeh, W.; Hamid, N.A.; Rohana, A. Determinants of household food insecurity and its association with child malnutrition in Sub-Saharan Africa: A review of the literature. Curr. Res. Nutr. Food Sci. J. 2019, 7, 610–623. [Google Scholar] [CrossRef]
- Bruening, M.; Brennhofer, S.; Van Woerden, I.; Todd, M.; Laska, M. Factors related to the high rates of food insecurity among diverse, urban college freshmen. J. Acad. Nutr. Diet. 2016, 116, 1450–1457. [Google Scholar] [CrossRef]
- Gallegos, D.; Ramsey, R.; Ong, K.W. Food insecurity: Is it an issue among tertiary students? High. Educ. 2014, 67, 497–510. [Google Scholar] [CrossRef]
- Bruening, M.; Van Woerden, I.; Todd, M.; Laska, M.N. Hungry to learn: The prevalence and effects of food insecurity on health behaviors and outcomes over time among a diverse sample of university freshmen. Int. J. Behav. Nutr. Phys. Act. 2018, 15, 9. [Google Scholar] [CrossRef] [PubMed]
- Frank, L.B. “Free food on campus!”: Using instructional technology to reduce university food waste and student food insecurity. J. Am. Coll. Health 2022, 70, 1959–1963. [Google Scholar] [CrossRef] [PubMed]
- Whatnall, M.C.; Hutchesson, M.J.; Patterson, A.J. Predictors of food insecurity among Australian university students: A cross-sectional study. Int. J. Environ. Res. Public Health 2020, 17, 60. [Google Scholar] [CrossRef] [PubMed]
- Burke, M.A.; Carman, K.G. You can be too thin (but not too tall): Social desirability bias in self-reports of weight and height. Econ. Hum. Biol. 2017, 27, 198–222. [Google Scholar] [CrossRef] [PubMed]

Publisher’s Note: MDPI stays neutral with regard to jurisdictional claims in published maps and institutional affiliations. |
© 2022 by the authors. Licensee MDPI, Basel, Switzerland. This article is an open access article distributed under the terms and conditions of the Creative Commons Attribution (CC BY) license (https://creativecommons.org/licenses/by/4.0/).