Article

Incorporating Survey Perceptions of Public Safety and Security Variables in Crime Rate Analyses for the Visegrád Group (V4) Countries of Central Europe

Department for Regional Sciences and Public Policy, Széchenyi István University, 9026 Gyor, Hungary
*
Author to whom correspondence should be addressed.
Societies 2022, 12(6), 156; https://doi.org/10.3390/soc12060156
Submission received: 18 September 2022 / Revised: 12 October 2022 / Accepted: 17 October 2022 / Published: 3 November 2022

Abstract

:
Public governance has evolved in terms of safety and security management, incorporating digital innovation and smart-analytics-based tools to visualize abundant data collections. Urban safety and security are vital social problems that have many branches to be solved, simplified, and improved. Currently, we can see that data-driven insights have often been incorporated into planning, forecasting, and fighting such challenges. The literature has extensively indicated several aspects of solving urban safety problems, i.e., social, technological, administrative, urban, and societal. We have a keen interest in the data analysis and smart analytics options that can be deployed to enhance the presentation, promotional analysis, planning, forecasting, and fighting of these problems. For this, we chose to focus on crime statistics and public surveys regarding victimization and perceptions of crime. As we found through a review, many studies have indicated the vitality of crime rates but not public perceptions in decision-making and planning regarding security. There is always a need for the integration of widespread data insights into unified analyses. This study aimed to answer (1) how effectively we can utilize the crime rates and statistics, and incorporate community perceptions and (2) how promising these two ways of seeing the same phenomena are. For the data analysis, we chose four neighboring countries in Central Europe. We selected CECs, i.e., Hungary, Poland, Czech Republic, and Slovakia, known collectively as the Visegrád Group or V4. The data resources were administrative police statistics and ESS (European Social Survey) statistical datasets. The choice of this region helped us reduce variability in regional dynamics, regime changes, and social control practices.

1. Introduction

With the introduction of the technological element, we have seen trends (both in academic research and governance practice) in smart city innovation. In the area of data, we argue that data-based learning systems and AI (artificial intelligence) enhance the vitality of data in practicing smart governance. This phenomenon is generally referred to as digitalization. In particular, the area of crime statistics has great potential for us to learn and adapt smart governance in the domain of public safety and security. Literature reviews have indicated many potential gaps and methods of developing data-based presentations, including spatial mapping, which adds social context to raw criminal statistics. This data integration potentially bridges personal, cultural, domestic, and regional genres of social contexts.
Several studies have adapted different methodologies in this regard, including interdisciplinary and transdisciplinary approaches. These include spatial and cognitive mapping based on computing algorithms. All these models make efficient use of datasets to present and predict data-based insights and projections, making use of criminal statistics, which may serve as an extension for this study. Though this article discusses the management domain in public safety and security administration, we interlinked descriptions of the crime statistics of the target countries (from the police and criminal administrative portals) with those from the survey data from the ESS (European Statistical Survey) on selected UNODC crime and victimization survey variables. This approach of descriptive analysis provided a solid foundation for adapting contemporary methodologies for extending contemporary methods of problem-solving [1] and decision-making.
We also propose using contemporary Python libraries integrated in SPSS and QGIS for spatial data mapping on crime statistics and perceptions of the citizens about their fear of crime, as in [2,3]. Python has several advantages such as easy English-like syntax, open-source availability, and the integration of the results with web portals, which can provide an extension of this study. For this purpose, we intended to apply this approach in selected Central European Countries (CECs): Hungary, Poland, the Czech Republic, and Slovakia, known collectively as the Visegrád Group or V4 (a cultural and political alliance). Above all, we can use the results as part of methodological extensions in several crime indexes and/or smart cities’ indexes among the safety and security indicators [4].
Events in the past such as September 11, along with the advent of crime policies by Western democracies, have made crime and public safety and security important matters in politics and public administration. Certain factors are important to consider when adapting policy in crime control. As seen in the literature, there are concerns in postmodernism about human rights (whereby we are concerned with privacy in a more focused way); in addition, the economic crises have given rise to many conditions that allow for the increase in crime, leading to lost economic safety and stability. As [5] argued, this crisis, as a violation of the basic human right of economic sustainability, is more interesting to study in underdeveloped and underprivileged regions around the globe, where many are more vulnerable. However, there might be a balance in the human rights issue, as there is the possibility that these rights can be violated in crises as well as in the realm of control—specifically, becoming more politicized, authoritarian, and correctional, such as prisons and sentences/punishments. In policy and administrative decision-making matters, we need to emphasize the importance of balancing surveillance, crime control, and respecting privacy in the public domain [6]. For instance, in the area of CCTV (closed-circuit television) monitoring, it definitely depends on how much the public values and trusts the police in that area concerning the data being processed for the purpose of their safety while, at the same time, not breaching personal privacy values. In addition, the phenomena vary among cultures and regions. This is where public perception counts the most: as feedback to initiate a cognitive change in the public safety and security administrative systems and policies.
Additionally, accounting for the impact of crime rates on and perceptions of risk by citizens contributes to effective decision-making and problem-solving related to urban management. In turn, this leads to an improved quality of life for the citizens [7], whereby we can interface the data-based findings with smart governance, which is currently a topic of much debate. These finding can be applied practically to more evidence-based, collaborative, and citizen-centric decision- and policymaking [8]. When the citizens’ survey perceptions are taken into account in addition to raw crime statistics [1], this not only provides an in-depth understanding of the objective statistics but also gives a glimpse into how the community approaches the ground realities regarding safety and security measures in a subjective manner.
We present a literature review based on the particular problem explained above and elaborate how the literature defines the concepts and offers ways to address the indicated problems. This is followed by the methodology of the study and the research questions. Following that, different research approaches are analyzed for studying the research question, and possible solutions in the literature are discussed. The methodological considerations are discussed as well. Lastly, the conclusion summarizes and analyzes the literature, and presents a framework considering the research and its challenges.

2. Literature Review

2.1. Criminal Statistics and Public Perceptions: Data, Mapping, and Analytics

In a research report, it has been put forward that dissemination of information about crime plays an important role in building the perceptions about the fear of crime. Disseminating positive information maintains a positive perception and vice versa, provided that the authenticity and integrity of information are maintained. This information should be keenly focused on in addition to security programs [2]. The study referenced in [9] also seconds the need for reliability, validity, and generalizability for tackling the sampling bias and the generalizability in the place-based measures of fear of crime, suggesting the use of statistical and computational modeling. Furthermore, as suggested by the idea that “repeatedly asking about fear might increase/cause fear” [9] (p. 1), it is important to maintain discussions around the ethical implications of such methodologies. The authors of [10] stated that there is a still need for full elucidation of the complex nexus of perceptions and reality on the topic of crime genre in the context of safety and security. Over the last decade, several contributions have used GIS (Geographical Information System) methodology to explore this connection.
The authors of [11] maintained that citizens’ perspectives are necessary and important in terms of the rightfulness and acceptance of smart city initiatives. Beginning with the concept of the safety–privacy trade-off, authors have repeatedly argued for the necessity of research into citizens’ perspectives on smart urban safety and have criticized how the intricacies of human aspects have been disregarded in using technology-based solutions. This idea also generates a sense of ownership by the public, as they are a central cause and beneficiary of such interventions. The authors of [12] quoted some interviews with security and departmental experts to summarize the facts and to elaborate the security arrangements that account for the population in comparisons of metropolitan areas, crime trends, and local institutional arrangements. Such observational participation helps researchers describe how local policies are implemented and working on the ground in reality.
The study referenced in [13] (p. 95) in a geographically defined research area in Montreal, Canada, approached one-fourth of the local security provisioning entities and derived their results through discussions and identification via a mixed methodology to assess the relationships of security provision across organizational nodes and networks. The innovation, policy, and community implications are major relevant pillars of smart cities, as stated by [14], and widely cover the latest aspects of technology in security provisions. Several aspects vary from region to region, such as which advanced measures are being taken, and how the other urban factors are playing with community perceptions and behaviors.
Research has also looked into the significant factors in studies on criminal statistics and fear of crime. The authors of [15], while exploring and comparing sketch maps and perceived fear of crime, found no significance for the size of the metropolis and the gender of the residents. On the other hand, the number of spots marked safe or unsafe and the number of registered crimes significantly impacted such perceptions. Spicer et al. [14] (p. 1) (2014), on the other hand, studied variations “in perception differences between males and females, business owners and employees and those who have been victims of property crime versus personal crime”. Moreover, Ref. [16] presented the evidence of a reduction in fear of crime as a result of policing initiatives in the results of a quasi-experiment-based study. The study referenced in [17] discussed the importance of the size of the unit of analysis (referred to as area polygons in the literature) and the accuracy of geo-coding techniques, which have been also discussed alongside some optimization techniques in [18], as variations were also observed in street sizes. The authors of [19] used neuroimaging to create maps of subjective feelings based on the Neuro-Synth meta-analysis database of several feelings attached to bodily sensations, which is particular to neuroimaging research. Kounadi et al. [20] (2020) recently reviewed several studies on spatial crime forecasting based on transdisciplinary research focused on predictive analytics.
The authors of [21] made use of the mental mapping approach to compare the perceptions of crime and safety among residents and police officers. In mental maps, individuals form an overall impression of the urban environment, referred to as an urban image. According to [22], the urban image has designative, appraisal, and prescriptive elements. The terms “mental map” and “cognitive map” are conceptual metaphors that describe a collection of methods for assessing perceptions of urban environments. Risk Terrain Mapping (RTM) is emerging as an effective approach for predicting hotspots of crime and the underlying factors, as coined by [23]. Dugato et al. [24] (2018) stated that, “Moreover, comparative studies also verify that RTM is equally, if not sometimes more, effective and reliable in crime forecasting than other methods based on hot spots analysis”. Malik [25] (2014) presented visual analytics as support for proactive decision-making and resource allocation based on algorithms such as the “seasonal trend decomposition based on LOESS” (STL) method and the kernel density estimation technique, making use of criminal, traffic, and civil (CTC) incident datasets. The authors of [18] used the predictive accuracy index (PAI) as a method to apply and optimize predictive analytical models of crime. Recently, fear of crime and surveillance have been discussed more and more in political as well as technological discourses when it comes to monitoring and control. The authors of [26] (p. 179) coined the term “surveillance society” in reference to spatial analyses and dynamics in discussions of crime as a socially varying phenomenon. The media play an important role in constructing the narrative of the events it highlights in pursuit of gaining viewership and ratings, as fear of crime and criminality are used in the political agenda of party politics. In this regard, Poland, the Czech Republic, and Hungary, including other CEECs, have seen a smooth transition, with certain factors being compromised, such as social welfare, employment, and relative stability.

2.2. Urban Security Management: Social Control Policies and Strategies

Urban security risk management matrices have been proposed to prioritize and align the strategies regarding an emergency event and a systematic model for decision-making. The authors of [27] (p. 57), in the scenario of September 11, stressed the importance of decision-making, readiness, and investments into emergency response systems as vital ways to fight terrorism and security hazards through diverse voluntary or instinctive actions (Little, 2004). The literature has also depicted urban security as a component in urban livability by identifying the underlying key assessment indicators, such as social and transport security, handling emergencies, disaster recovery, and building response capacity. Moreover, several indicators have been identified for measuring “urban security, such as crime rate … traffic safety … and emergency shelters” [28] (p. 3).
The regime changes in the CEU and V4 countries started around WWII and occurred in different phases, resulting in a diverse capitalist market-oriented model of democratic state organization, as seen in recent times. Over the initial years of this process, the criminal legislation was transformed completely [29]. Sentencing and correction facility (prisons) rates have been higher in V4 countries except for Slovakia in comparison with other former Yugoslavia and current CEE countries (Slovenia, Croatia Serbia, and BaH (Bosnia and Herzegovina)). Since the 1990s, CEECs have observed economic and administrative (in terms of political systems) changes.
Mostly, these changes were influenced by external experts, which also raised questions regarding the collaboration of local and external experts in the transition. The authors of [30] observed that the crime statistics in CEECs were a “very volatile phenomenon”, as every country varied. These points again emphasize the need to review penal codes and policy papers to understand this volatility and non-uniformity in the crime rates. This would make important contributions to explanations of how a state deals with crime and crises. No reference was found in the in literature that explained how the regime changes addressed or affected these anomalies (volatility and non-uniformity). In this perspective, the resources may be assessed as a factor for evaluating this problem, such as correctional facilities or prisoners per 100,000 of population. The two poles of policy making are very well described as “One leading towards greater use of repressive apparatus in fighting crime, and the other advocating the use of this apparatus as a last resort, as ultima ratio societatis” [30] (pp. 29–32).
Furthermore, [31] studied and presented the impact of unemployment on crime in several countries in Europe, making use of crime data and showing an important underlying characteristic of the rise in crime in certain studied countries. The study referenced in [32] also indicated an opportunity for smart city governance measurement processes. According to [33], in a bigger territorial context, it is indeed methodological chaos to analyze criminological studies. Different penal and justice systems, and different capacities in law enforcement are key areas that need to be taken into consideration in comparative studies across territories. Official criminal statistics, the homicide statistics of WHO, and official victimization surveys are vital sources of data in this regard. UNODC’s ICCS (International Classification of Crime for Statistical Purposes, United Nations Office on Drugs and Crime) is indeed vital as a methodological tool in the statistical classification of crimes. This research took this as a starting point to compare the study countries in an attempt to fill the gaps in comparative studies in this realm. Additionally, in this context, the literature has discussed several aspects of social control and the influence of regime changes on the inhabitants and the systems in terms of media, surveillance, and journalism in terms of social control theories as an explanation.

2.3. Smart Safety and Security Governance in the Digital Age

It is no wonder that the global village’s networks can be credited to digitalization as a major intervention for transformation in all fields of life. Specifically, in current research on smart cities, artificial intelligence and analytics are secondary tools supporting digitalization, even being used widely enough to be taught in academia and discussed in research as fields of study. Countries have evolved ways to incorporate digital innovation and tools in industry, healthcare, public governance, entertainment, education, traveling, logistics, agriculture, banking, and other sectors with the desire to be smart. In an industrial context, the challenges of digitalization have been discussed, such as digital disruption as a standard for firms with digitalization [34].
Digitalization has made different areas of life easier, ranging from the abovementioned broader levels to personal and domestic levels. Widely, digitization and digitalization refer to information system management areas, and have spread into other areas of research. Digital innovation combines digital and physical or social systems, creating a digital ecosystem, which is necessary for thriving digitalization [34]. The authors of [35] (p. 275) presented digital innovation as ‘‘the carrying out of new combinations of digital and physical components to produce novel products’’. The authors of [36] (p. 224) and [37] (p. 330) referred to IT and technology as being the primary aspect of creating new products, services, and business processes based on digital disruption, driving the digital transformation of society. The study referenced in [38] reflected on the sociotechnical aspects of digitalization in multifaceted social and institutional contexts, using digitization competencies, tools, and techniques.
The authors of [14] argued that digital technology represents a methodological way to identify the benefits (as impacts) of safe city innovations, such as improved public safety. It also promotes stronger ties between law enforcement agencies and the community. The authors also supported the elements of integrated solutions, such as video and data analytics as effective solutions, giving security officials stronger tools for outreach and coordination. Digital technology also enhances accountability and controls the use of force by the police (e.g., in the case of police body cameras). Integrated police command centers are the prime sources and hubs of data analytics in centrally deployed data centers. Such technological resources can help in the collection of evidence for street crimes and other heinous acts to trace the criminals and hotspots. The authors of [39] used vulnerability based on prior victimization and repetitions of burglary events to identify crime hotspots. This mechanism ultimately helps to deploy security provisions as a measure of control and improve public safety. On the other hand, we can see social experiments in the literature regarding technology-aided surveillance in the police force and public behavior regarding police body cameras [40].
The authors of [41] identified “management and organization, technology, governance, policy context, people and communities, economy, built infrastructure, and natural environment” in the literature as the main pillars of a smart city’s structure, and revealing the gaps in transdisciplinary research opportunities in this context. In this area, smartness, sustainability, and resilience have been discussed as the salient features in the literature to transform this smartness into decision-making and problem-solving for communities. The authors of [42] coined the term cross-fertilization to indicate the collaborative initiatives in smart urban planning.
The study referenced in [7] emphasized smart governance based on the intelligent use of ICT (information and communication technology) in problem-solving and decision-making, striving towards an improved quality of life. Furthermore, [7] discussed the participatory evolution of citizens in smart governance through ICT, which has been focused on in this study in the context of smart safety and security involving community perceptions. Research on such smart governance interventions leads to evidence-based and collaborative citizen-centric decision- and policymaking. In the context of city development strategies, this study considered the smart city rankings, the dimension we have focused on among the various dimensions with research gaps in terms of innovation and tests. Ranking entities regarding certain dimensions enhances the competitive emergence of the participating cities or countries for planning regarding these dimensions so they can rise in the rankings [4].

3. Research Questions

3.1. Main Objectives

The main objectives of this research included, firstly, studying and exploring the relationships between community perceptions of crime and the crimes recorded in Visegrád Group V4 countries. Secondly, we aimed to identify and build a common understanding regarding crime analyses segregated by data streams (perception surveys and crime statistics). This study aimed to propose collaborative and informed decision-making approach for urban security management. The research questions of this study, followed by the hypotheses, are described below.

3.2. Research Questions

How do the communities in V4 countries perceive the factors of crime victimization and safety, i.e., trust in the police, fear of crime, victimization, governance, compliance, and awareness? Is there a relationship between perceptions and recorded crime?
What do the crime statistics tell us? How can making sense of the crime statistics help us in informed decision-making.

3.3. Hypotheses

There is a relationship between perceptions of crime victimization and safety and statistics on the recorded crime rates. The disparity in the crime rate across countries makes sense of the variations in community perceptions of crime and victimization.

4. Methodology

4.1. Data Analysis and Analyzed Questionnaire

We selected the ESS community survey for the factors of perceived victimization and safety, i.e., fear of crime, victimization, governance, compliance, and awareness, for the V4 group among the CECs and related these to recorded crimes to see if there is a link between the research variables, or at least if they are positively correlated. These variables were selected in line with the UNODC’s (https://www.unodc.org/unodc/index.html, accessed on 9 October 2022) (United Nations Office on Drugs and Crime, Vienna, Austria) victimization surveys and reports. We have presented the crime data in terms of population (as incidents of crime per 100,000 population units or inhabitants). We obtained the descriptive statistics of the perceptions revealed by the survey and the crime rates to compare them in V4 countries, focusing on trust in the police, fear of crime, victimization, governance, compliance, and awareness. This helped us analyze the different perceptions of the public in the Czech Republic, Hungary, Poland, and Slovakia. Furthermore, we analyzed the trend in crime rates from 2013 to 2019 and analyzed the data trends in terms of social control, crime control, emerging surveillance technologies, and the socio-political and administrative factors discussed in the literature [43,44]. Very positive correlations were found among the survey items and the recent crimes and offences in 2019 (the year of the survey and crimes recorded in the same year). The tools used were SPSS v26 and MS Office Excel v16.
The data collection process complied with the ethical framework of the ESS (https://www.europeansocialsurvey.org/about/ethics.html, accessed on 9 October 2022). Furthermore, the research data acquired as part of the secondary data for this research were compliant with the research standards of Szechenyi Istvan Egyetem, University of Gyor (Gyor, Hungary) and the Societies journal. There was no breach of compliance regarding bias, the anonymity of participants, and consent in the data. of public data resources are cited as indicated by the online resources, and fairness in quoting and citing the resources has been maintained throughout this study. Furthermore, there was no intention to cause potential harm and disregard in the presentation of the results.

4.2. Ethical Aspect of Study

The ESS primarily maintains and covers a range of social sciences variables on the cross-national level for European countries (https://www.europeansocialsurvey.org/methodology/ess_methodology/source_questionnaire/, accessed on 9 October 2022). This helps researchers to create subsets of variables in the specific domains of their research. Countries of analysis can also be selected. In this research, we adopted a subset of the larger database of questionnaires from ESS based on the variables discussed in next paragraph. We did not address the gender, age, and educational levels of the survey participants to mitigate the complexity of the analysis. However, in general, the units per 100,000 people for crime rates and percentages of the population were used for the variables of the perception survey.

4.3. Definition of Variables

Fear of crime indicates the tendency of how much one feels prone to crime. Victimization means having been a direct victim of a crime such as theft, burglary, or assault. The governance variable gauges the strength of the government and the rule of law. The compliance variable indicates the willingness of and adoption of rules by the community. The awareness variable deals with being aware of the personal and public safety standards and the demand for it. The specific questionnaire items related to each of the perception variables are listed in Table 1.

5. Results

For answering the first research question, we correlated the five selected variables in the domain of public safety and security based on the UNODC’s recommendations and guidelines, i.e., respondent or household member being victim of burglary/assault in the last 5 years, trust in the police, importance of living in secure and safe surroundings, gender, importance of doing as told and following rules, a feeling of safety when walking alone in the local area after dark, and the importance of a government that is strong and ensures safety. When these variables were correlated with the crime offence counts of the surveyed countries, we found significant relationships, as shown in Table 1. Spearman’s rho correlations were used, as they are suitable for correlations of ordinal data and nonparametric numeric data.
The correlation matrix was based on the idea that victimization, the government’s role in implementing safety measures, the importance of having safe and secure surroundings, and following the community social rules are crucial in an assessment of the sense of safety (as part of social wellbeing) within the community. Furthermore, the response measures might indicate a subjectively strong preference towards the perceptions, correlated with the crime counts in a particular country. So far, this study is in the data insight and analysis phase, and some initial understandings are presented here. A methodological problem is often present in surveys of perceptions regarding the fear of crime, as this depends on one’s own views, experiences and observations, and the level of awareness regarding the situational statistics and regional dynamics. The authors of [45] presented a more detailed analysis of the fear of crime and the victimization indicators with relation to the demographic and socioeconomic characteristics of individuals. It also considered whether the respondent personally or his/her acquaintances had ever been a victim of crime. The survey instrument, the recent state of affairs in any region, and regional dynamics also greatly contribute to the perceptions of the survey respondents.

Crime Rates and Safety Perceptions: A Spatiotemporal Analysis of V4 Countries (2013–2019)

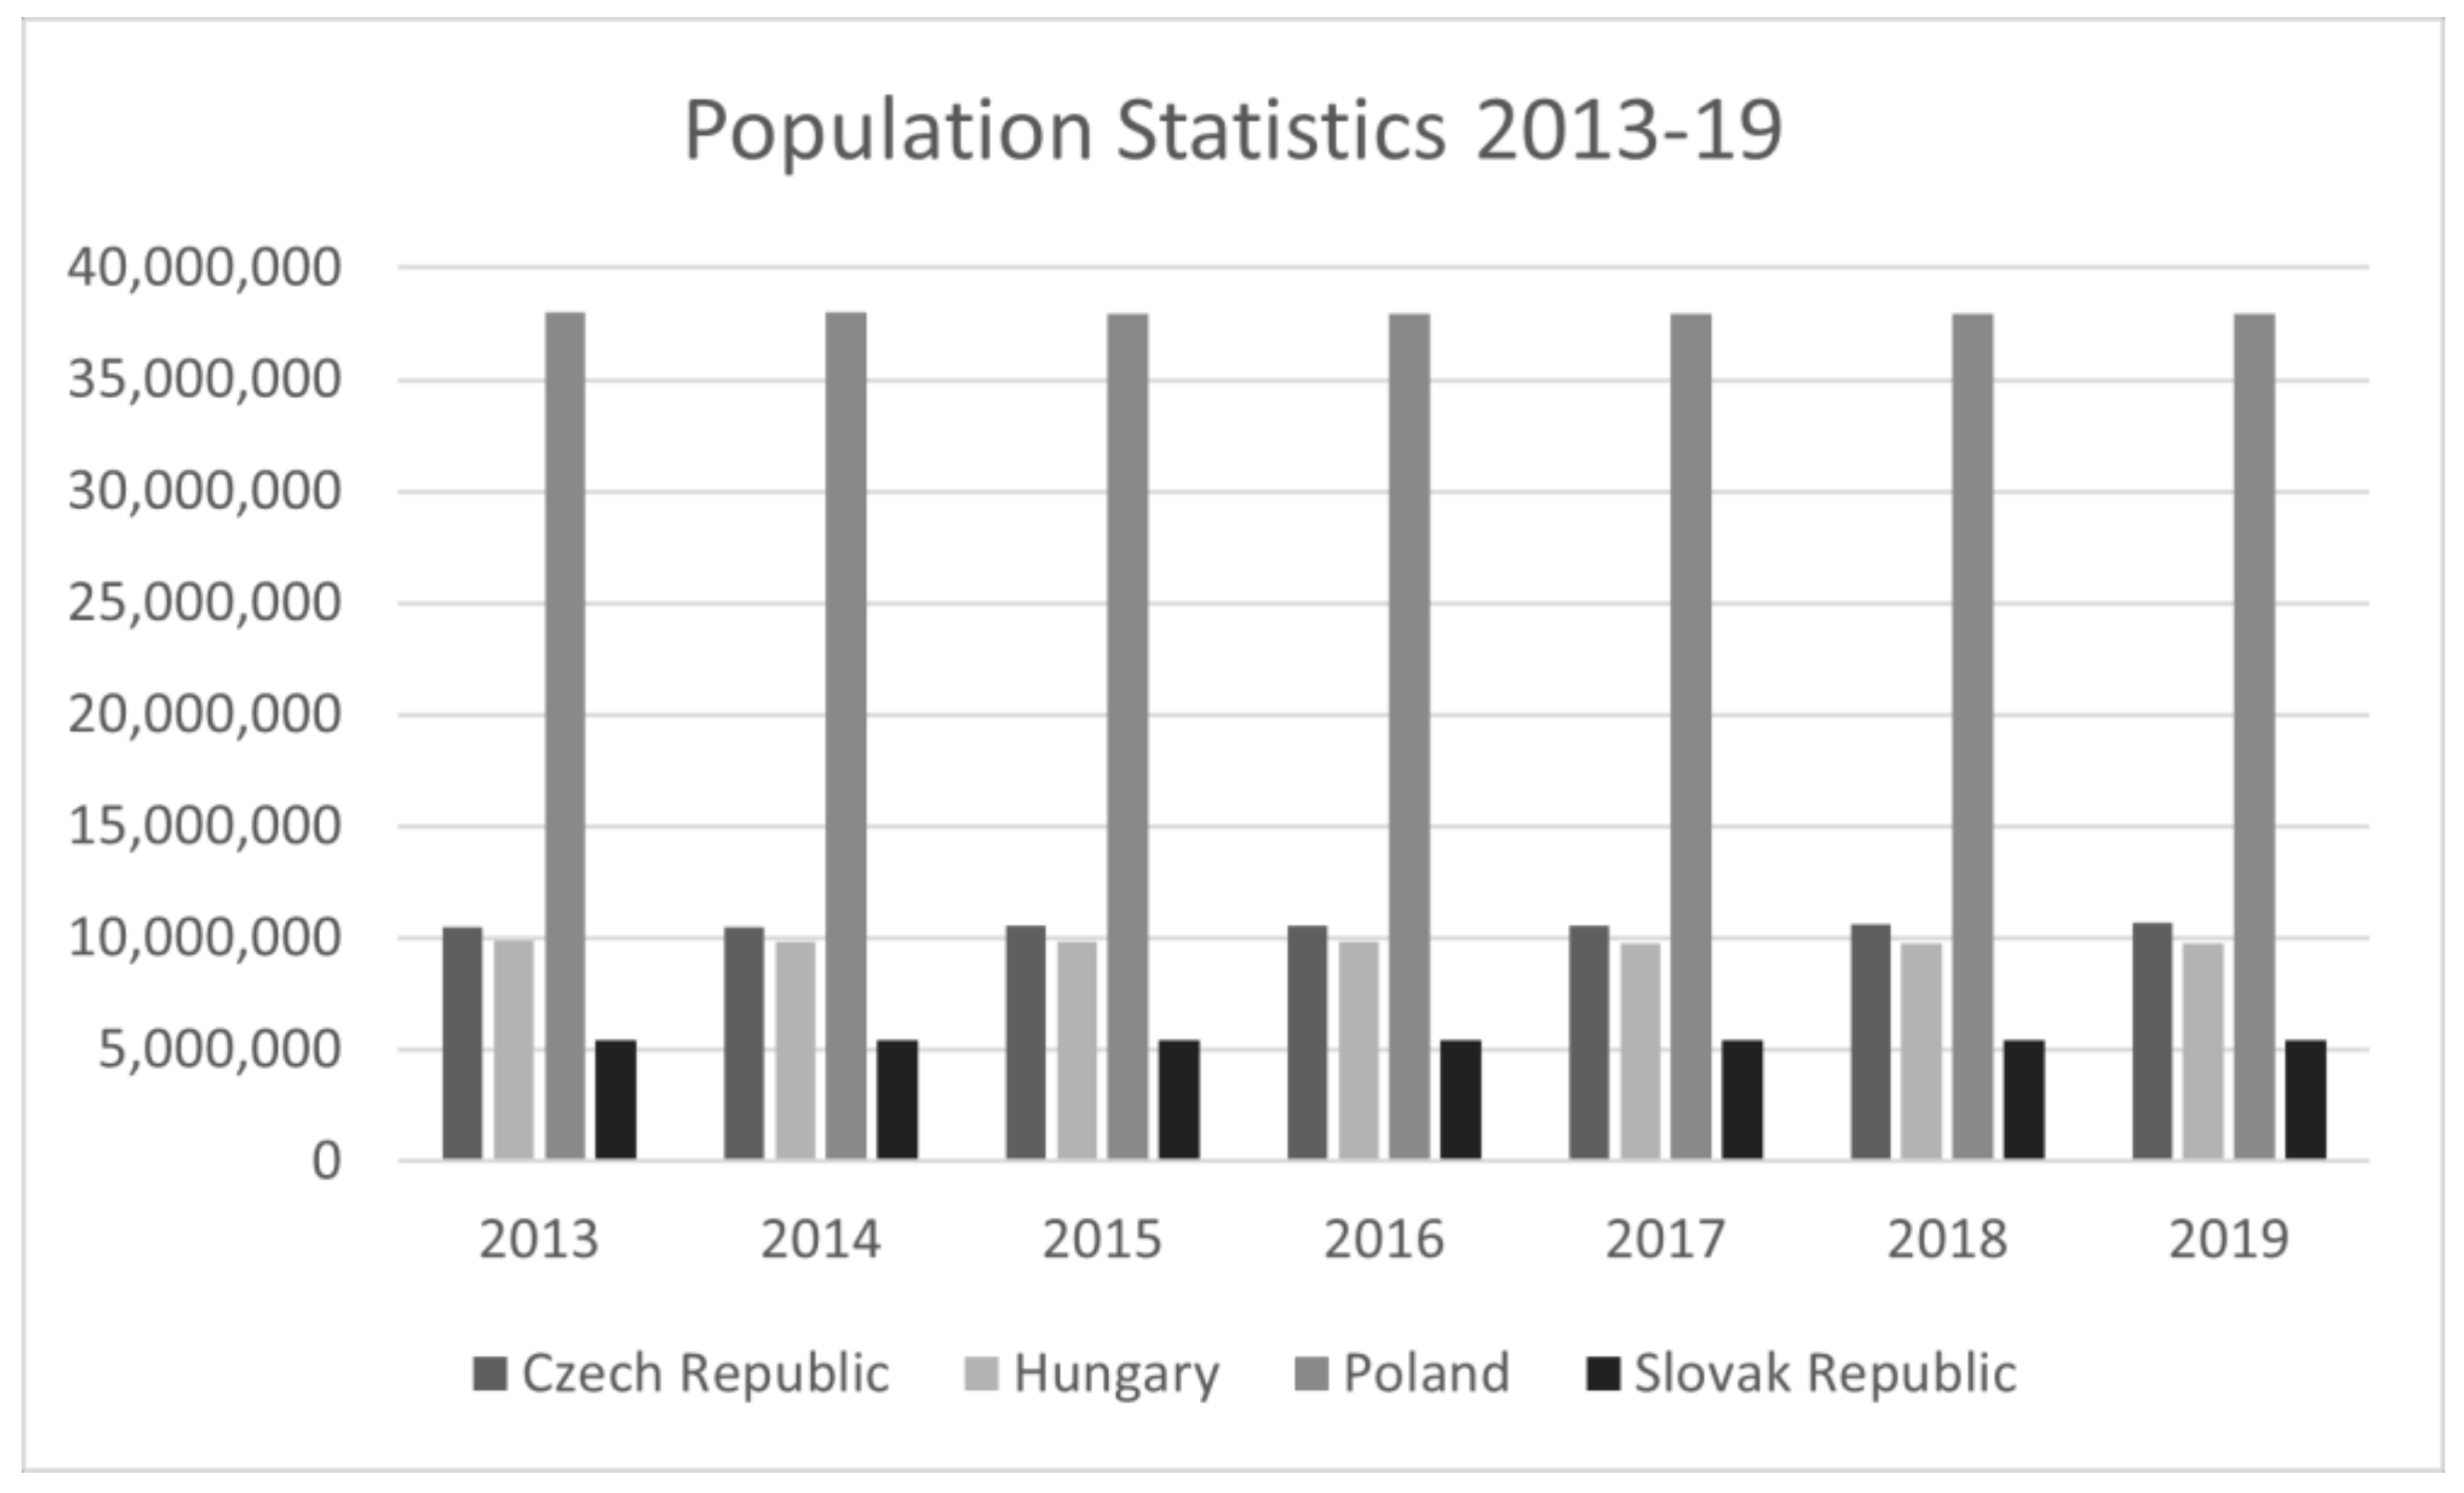
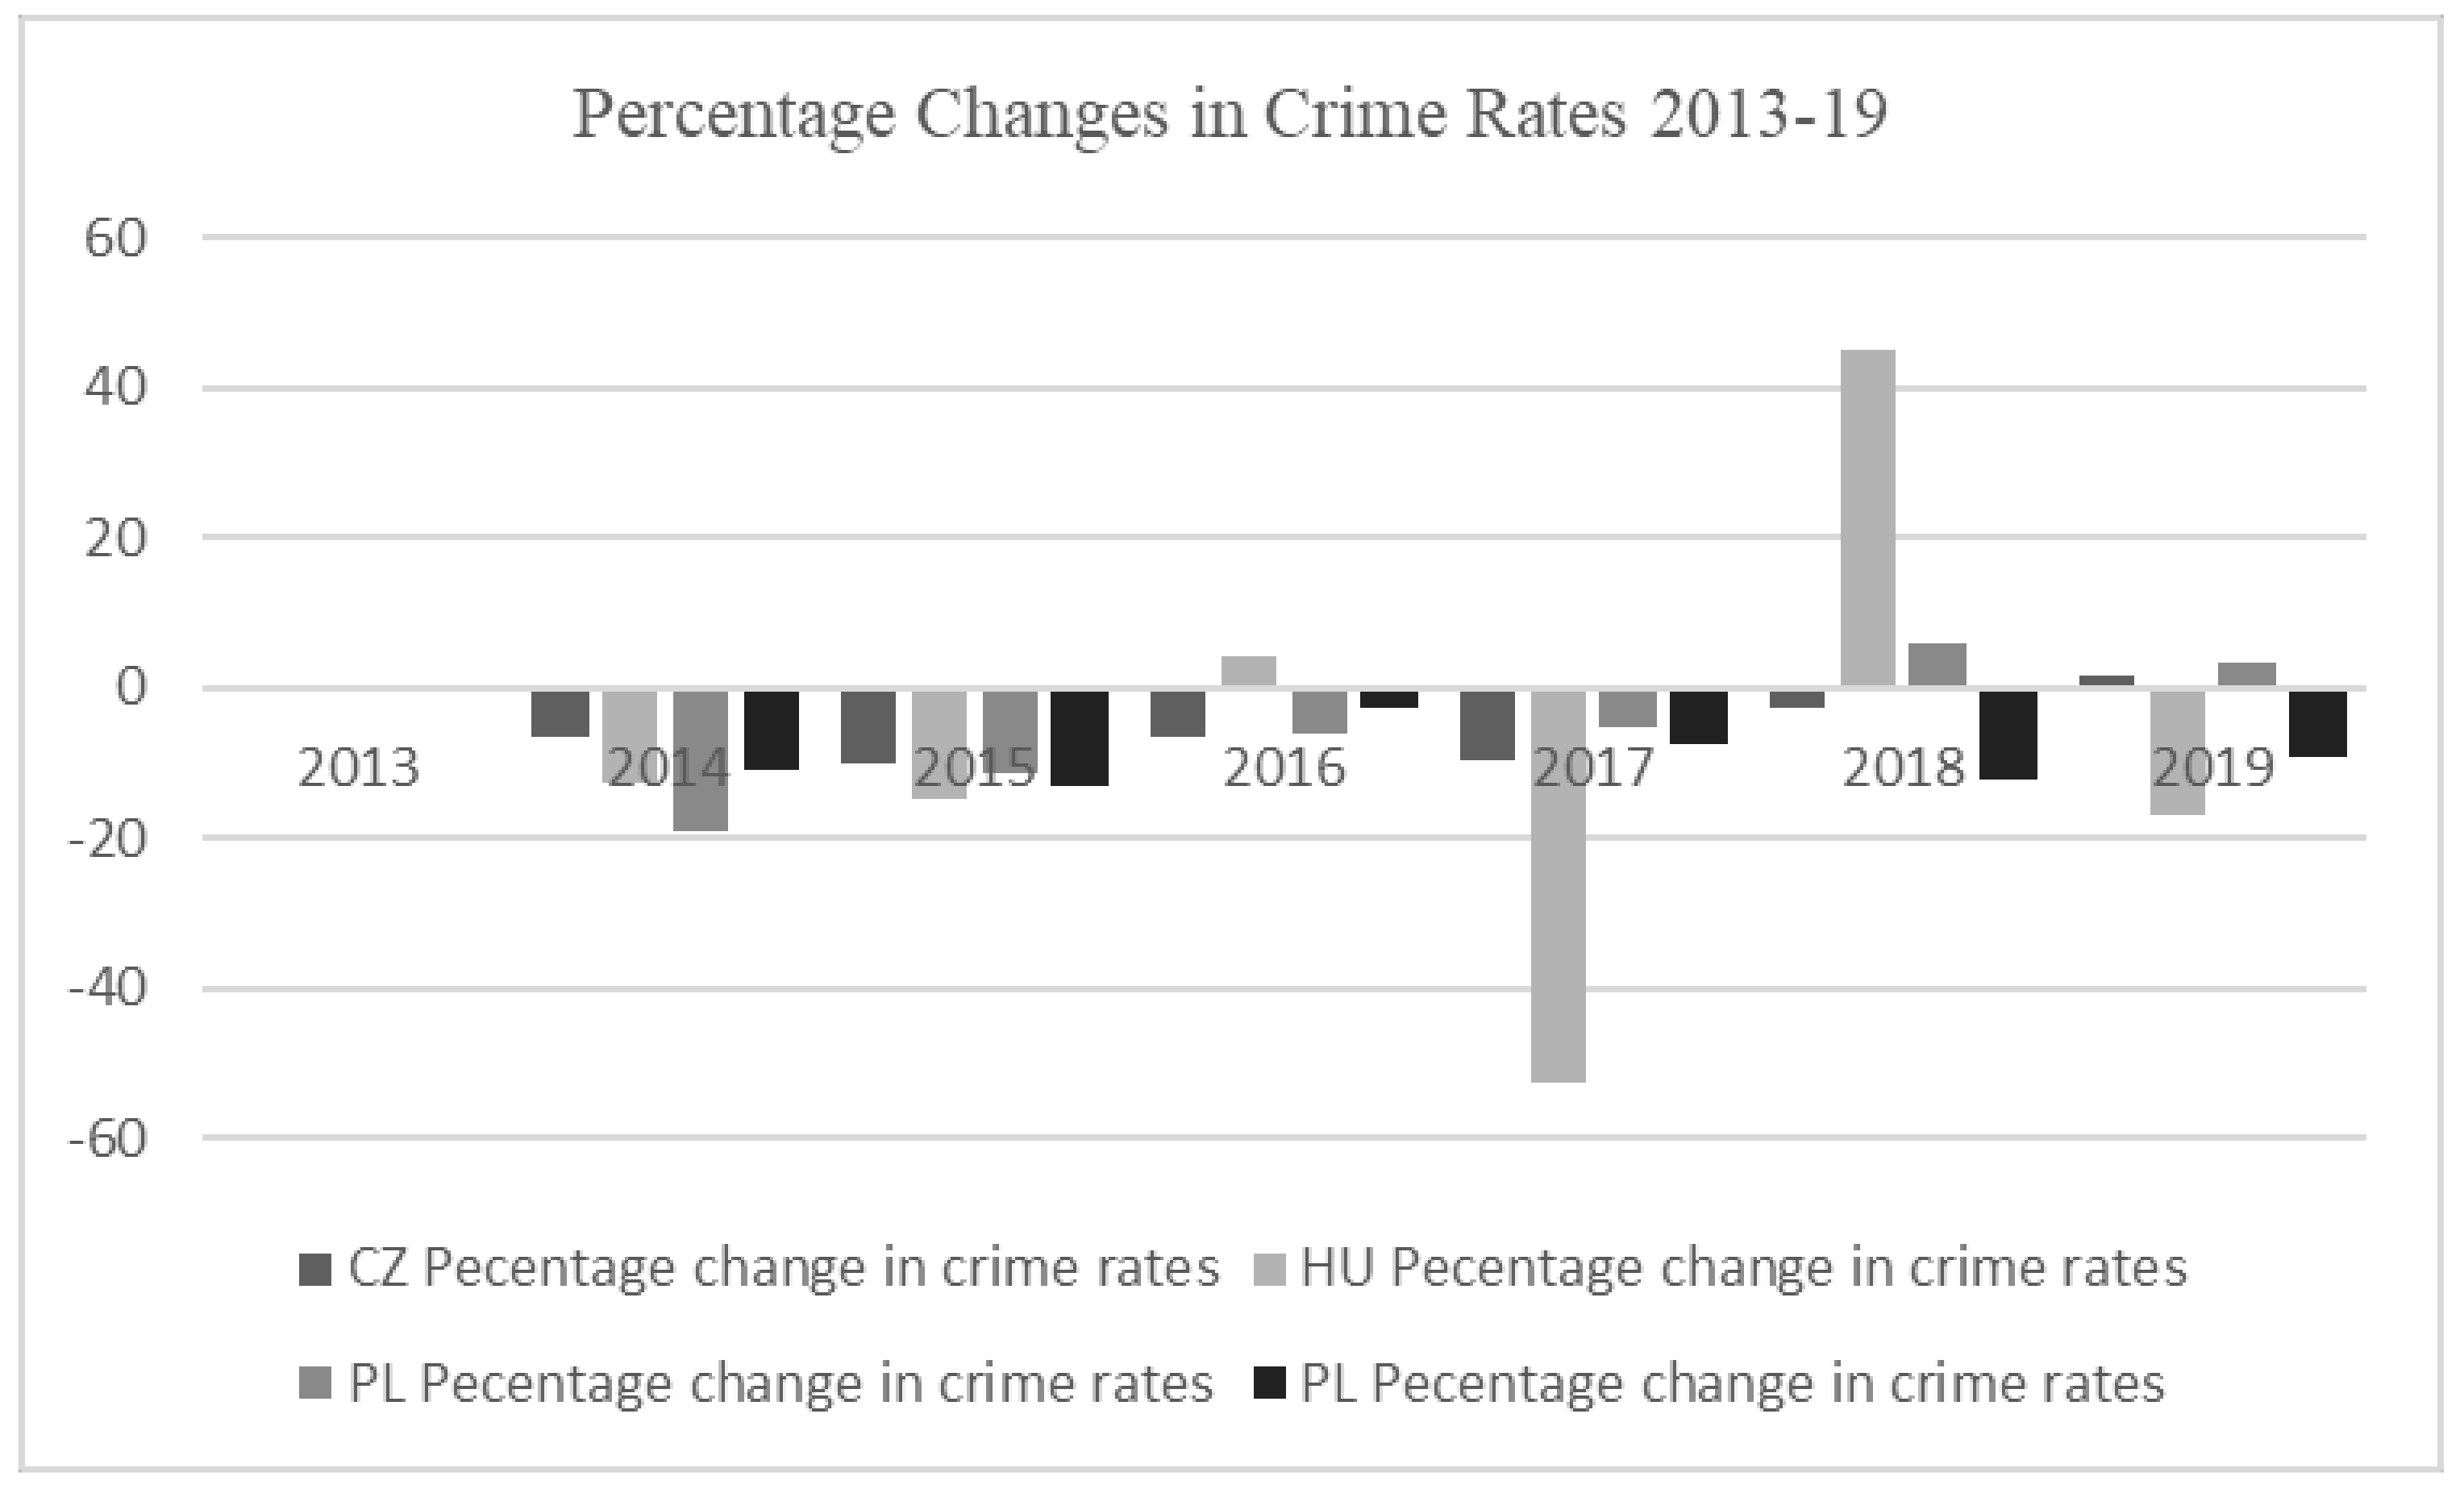
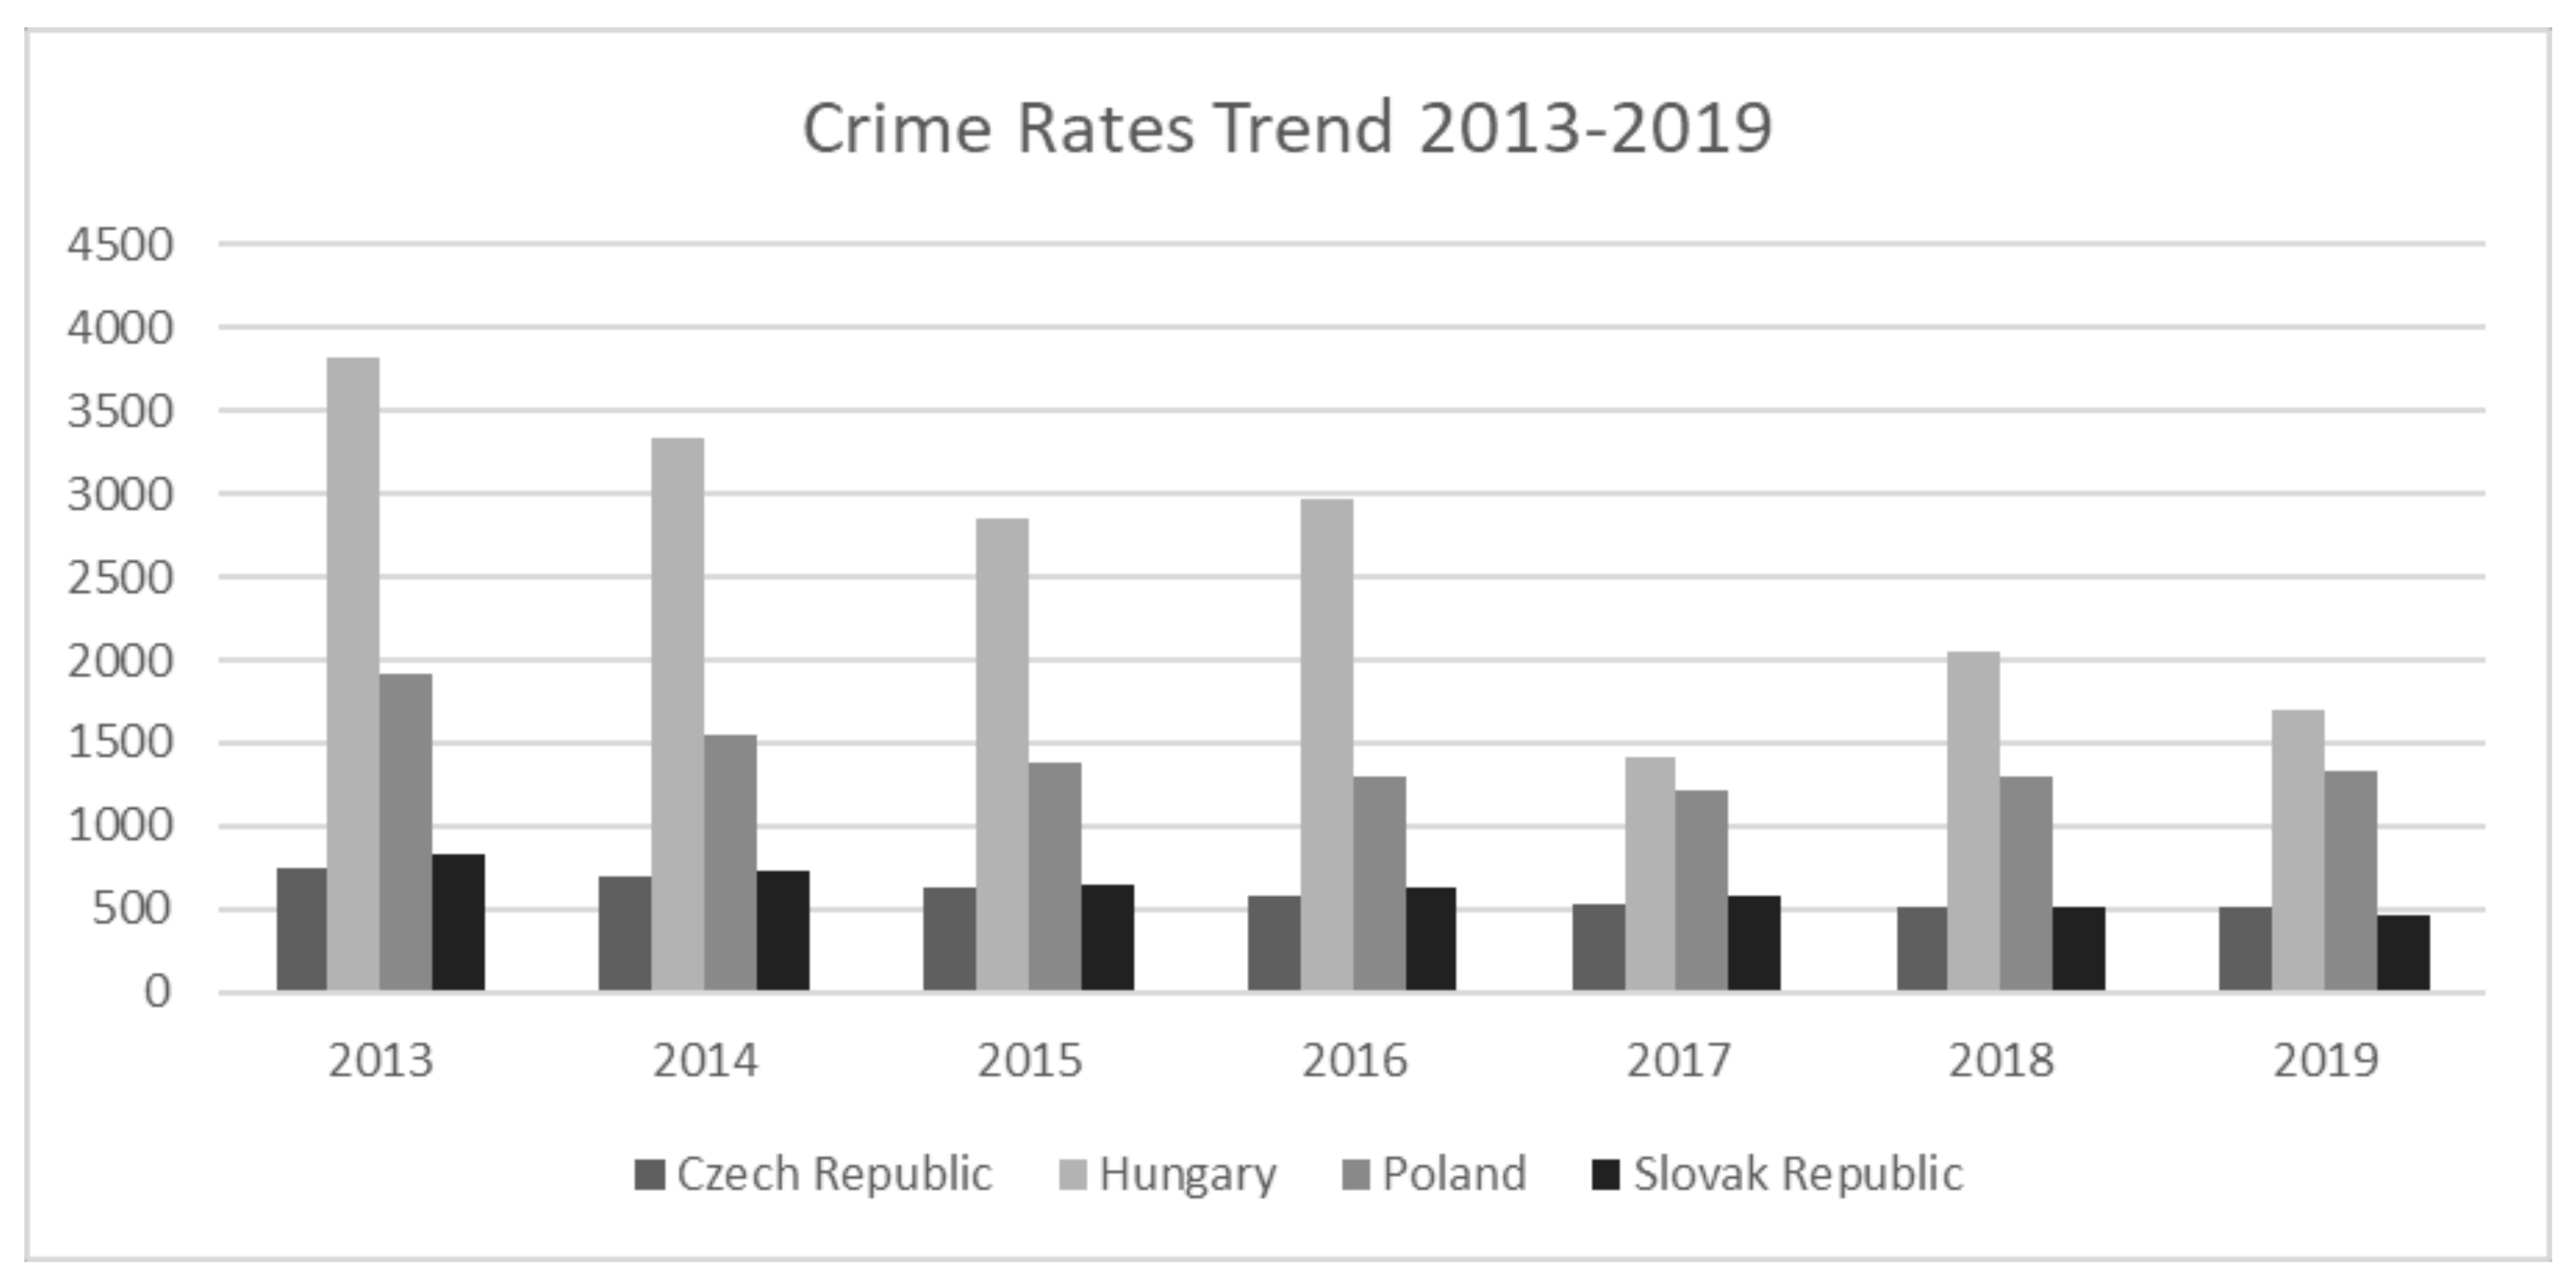
Trust in the police, fear of crime, victimization, governance, compliance, awareness, and a helpful attitude account for the CECs’ public safety perceptions, awareness, and need. Figure 1 shows the changes in each country’s population as a percentage, i.e., ((Value2 − Value1)/Value1) × 100 = percentage change, for 2013–2019, whereas Figure 2 shows the trends of the crime rate per 100,000 population ((Crime count/Population) × 100,000) for the Czech Republic (source: [46] (PL), [47] (CZ), Hungary ([48]) (HU), Poland ([49,50]) (PL), and Slovakia (SL) [51,52], based on data from the World Bank and the administrative portals of the regional police. Hereafter, we use these short terms for the different countries interchangeably.
The changes in the population, as percentages, are very minimal across countries. The maximum yearly changes in the population in case of Slovakia and the Czech Republic were 0.15% and 0.4%, respectively. For Hungary and Poland, we observed negative changes in the population, ranging from −0.3 to 0.05% and from −0.08% to −0.02%, respectively, for the years 2013–2019 (Figure 1 and Figure 2). This minimal change in the population is depicted as a very flat trend in Figure 2. These population changes have introduced new social challenges linked to immigration and diversity. Though both of these phenomena are described as valuable for economic growth, they have also been criticized. The study referenced in [53] discussed crimmigration (a unified term used for crime control and immigration control), emphasizing a discussion of the impacts of immigration on inclusion and exclusion within European countries and how immigration reshapes border and crime control practices and policies as influenced by both the immigrants and the local authorities.
In the case of the crime rate for 2013–2019, we observed a somewhat declining trend in all four countries, especially in the case of Slovakia, which showed no fluctuation in the decline. However, Hungary and Poland in 2017 and 2018 showed a slight dip (as can be seen with the negative change of up to 60%) and rise (as can be seen with the negative change of up to 40%) in criminal offences, respectively, showing an overall decline through the years 2013–2019 (Figure 3). Furthermore, Poland recorded the most offences, whereas Slovakia had the least after the Czech Republic and Hungary. Table 2 presents the data on incidents of crime, population, and the calculated crime rates (the sources are given in Table 2.
As we can see across the years, the decline from 77,976 in 2013 to 55,594 in 2019 supports the fact that, though there has been an inevitable increase in the population in these countries to a certain degree, crime control policies, improved surveillance, and policing have resulted in a reduction in criminal offences. For instance, according to Statista [51], the EU increased the border management and control budget to EUR543 million from EUR460 million in the preceding year. With increased challenges to the management of security, governments need to deploy resources to nullify factors such as unemployment and crime, as many studies in the literature have suggested. The crime trend of the Czech Republic is summarized in Table 2, where criminal offences showed a decreasing trend from 2013 to 2019, supporting the statements made above (Figure 4).
As we can see for the number of criminal offences across the years, a decline from 742 per 100,000 inhabitants in 2013 to 520 in 2019 was observed in case of the Czech Republic, with the exception of an anomaly observed in 2018. Similarly, for Poland, a decline was observed across 2013–2017, with a slight rise in the last two years of the period (2018–2019) in Table 2. However, Slovakia observed a constant controlled decline in criminal offences throughout the years 2013–2019 (Figure 4).
Next, we looked at the criminal offences in these countries by the categories recorded in statistical and police resources. We managed to obtain detailed categorical data for all the countries except for Poland. The Hungarian categorization was detailed enough to exceed the limit of length and scope of the study, so the major categories will be mentioned, namely those that counted most towards the overall count of offences in Hungary during 2013–2019. This time range was also selected to consider all countries and categories uniformly. However, this was the most available time period for the target countries.
The crime counts of Hungary, Poland, and the Slovak Republic are tabulated in Table 3. As already mentioned, for Poland, an exhaustive list of categories could not be obtained from official resources. For Hungary, the data files were too large to state all the categories of crime; however, the major crime categories included fraud, theft, criminal mischief, forgery, defacement, harassment, and assault and battery (causing personal harm to someone). These offences had the greatest shares within the total count mentioned in Table 3. For Slovakia, the list of major offence categories included personal and property crimes. For Poland, the recorded crimes are those reported while the detected crimes are those which have been resolved by the authorities, whereas others are unsolvable, i.e., disputed offenses that cannot be penalized, that have been pre-resolved among the parties or outside a lawsuit, or those on a stay from courts. Table 3 shows that the major offences in the Czech Republic are fraud, traffic violations, and other miscellaneous crimes (often include hate crimes, street crimes, etc.) Heinous crimes are low in number but create the fear of crime in community, mostly because of direct bodily harm (for instance, robbery, murder, and sexual abuses).
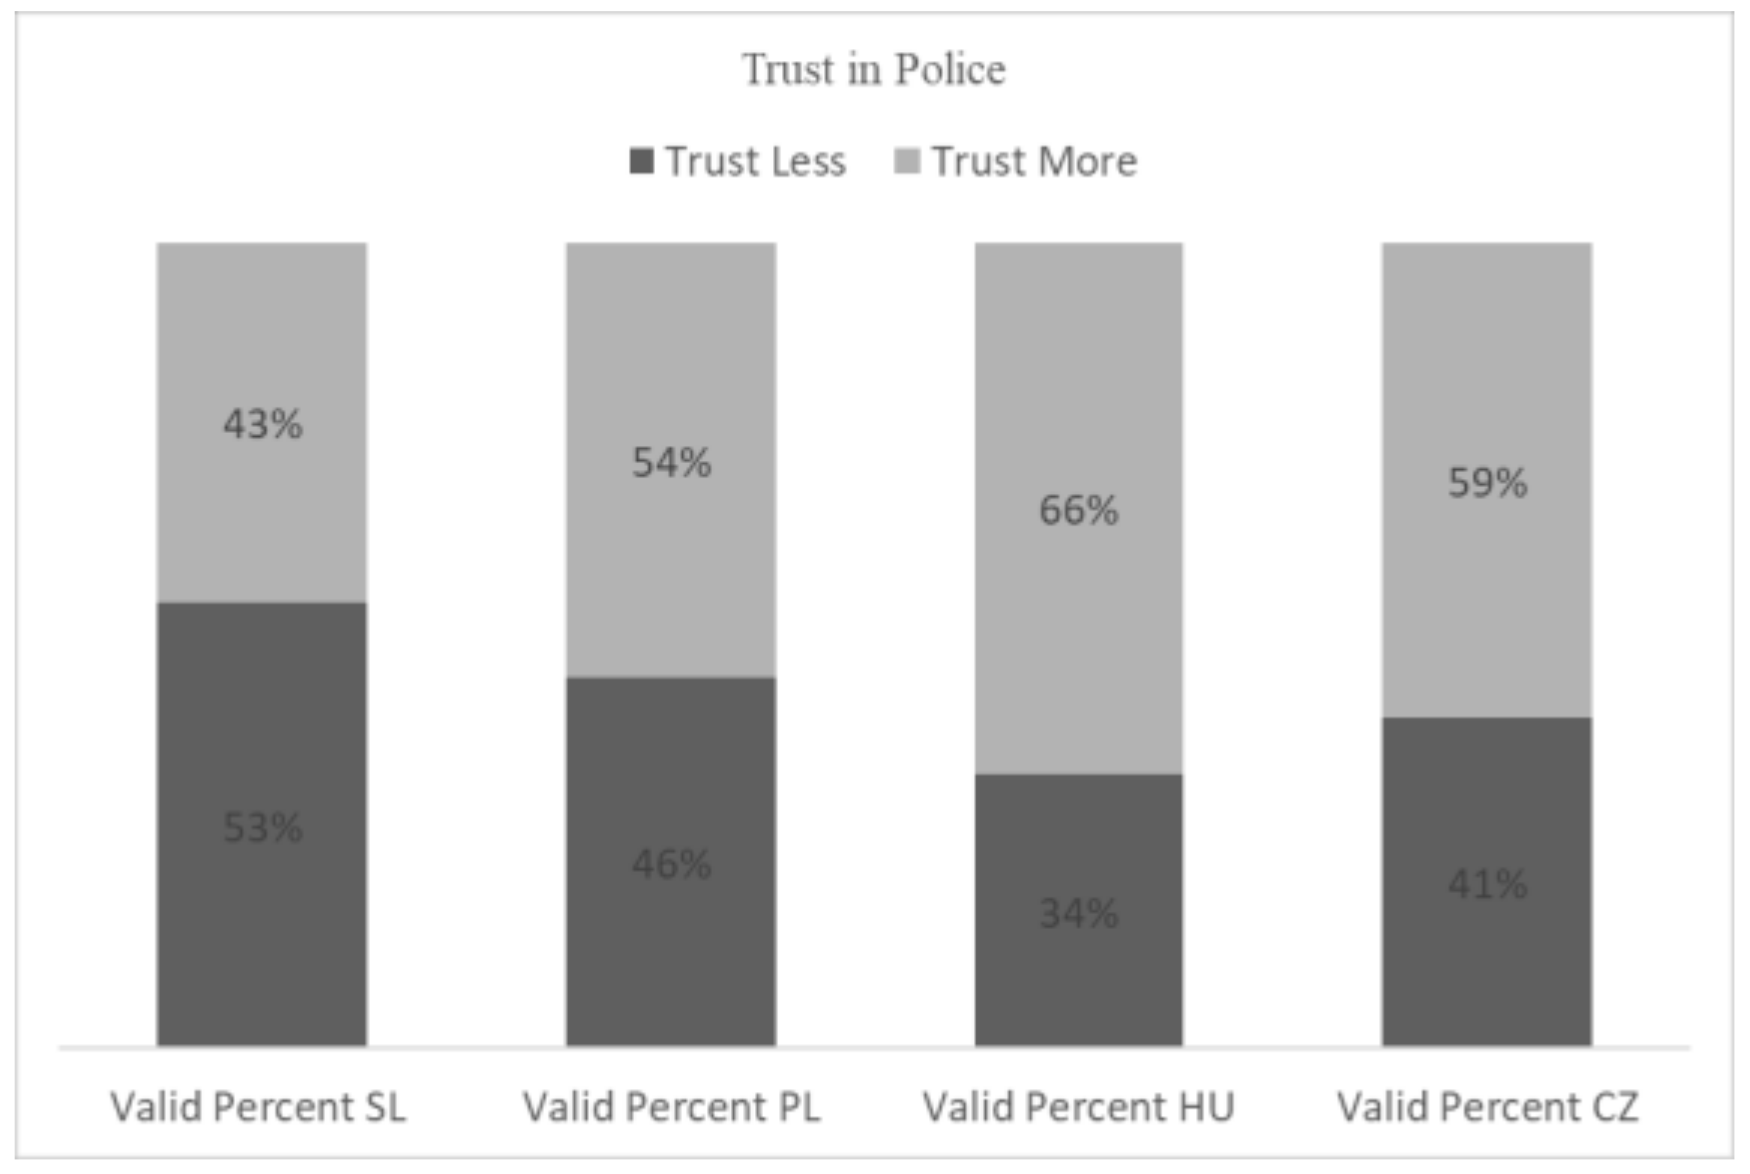
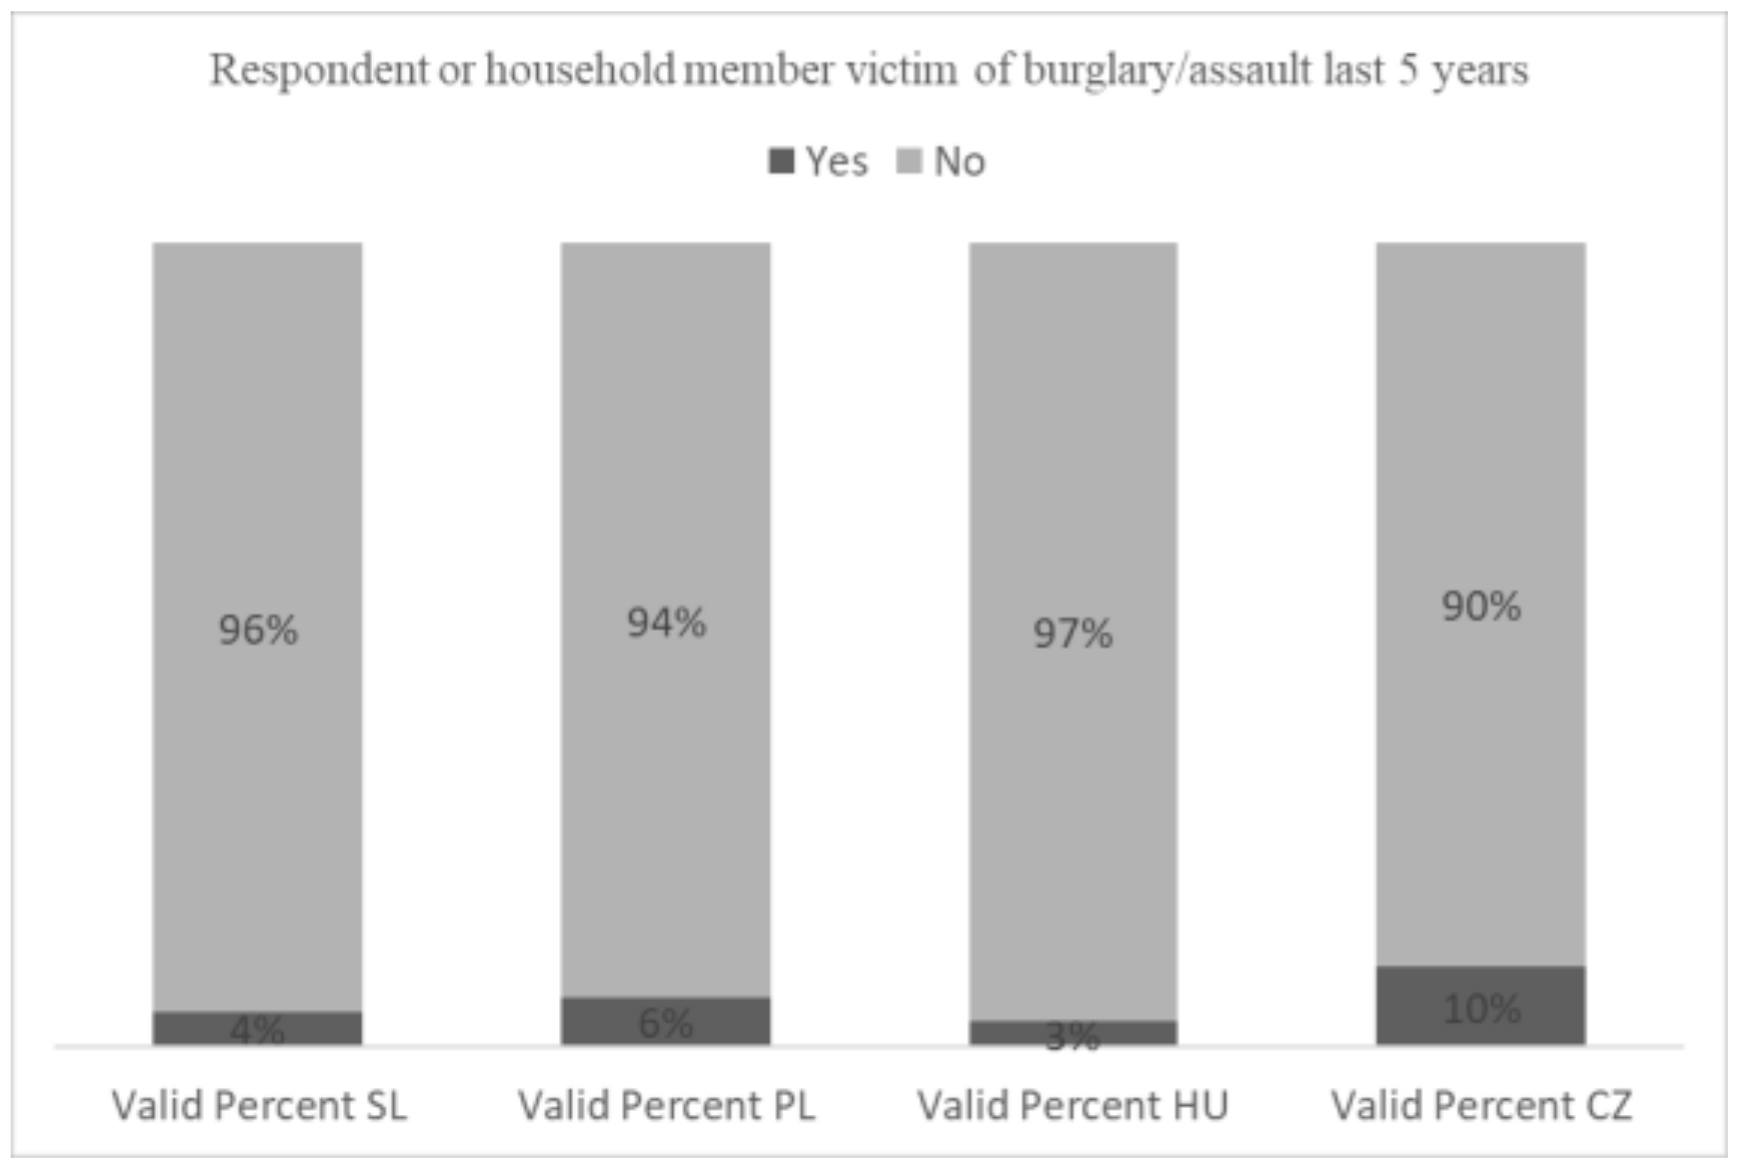
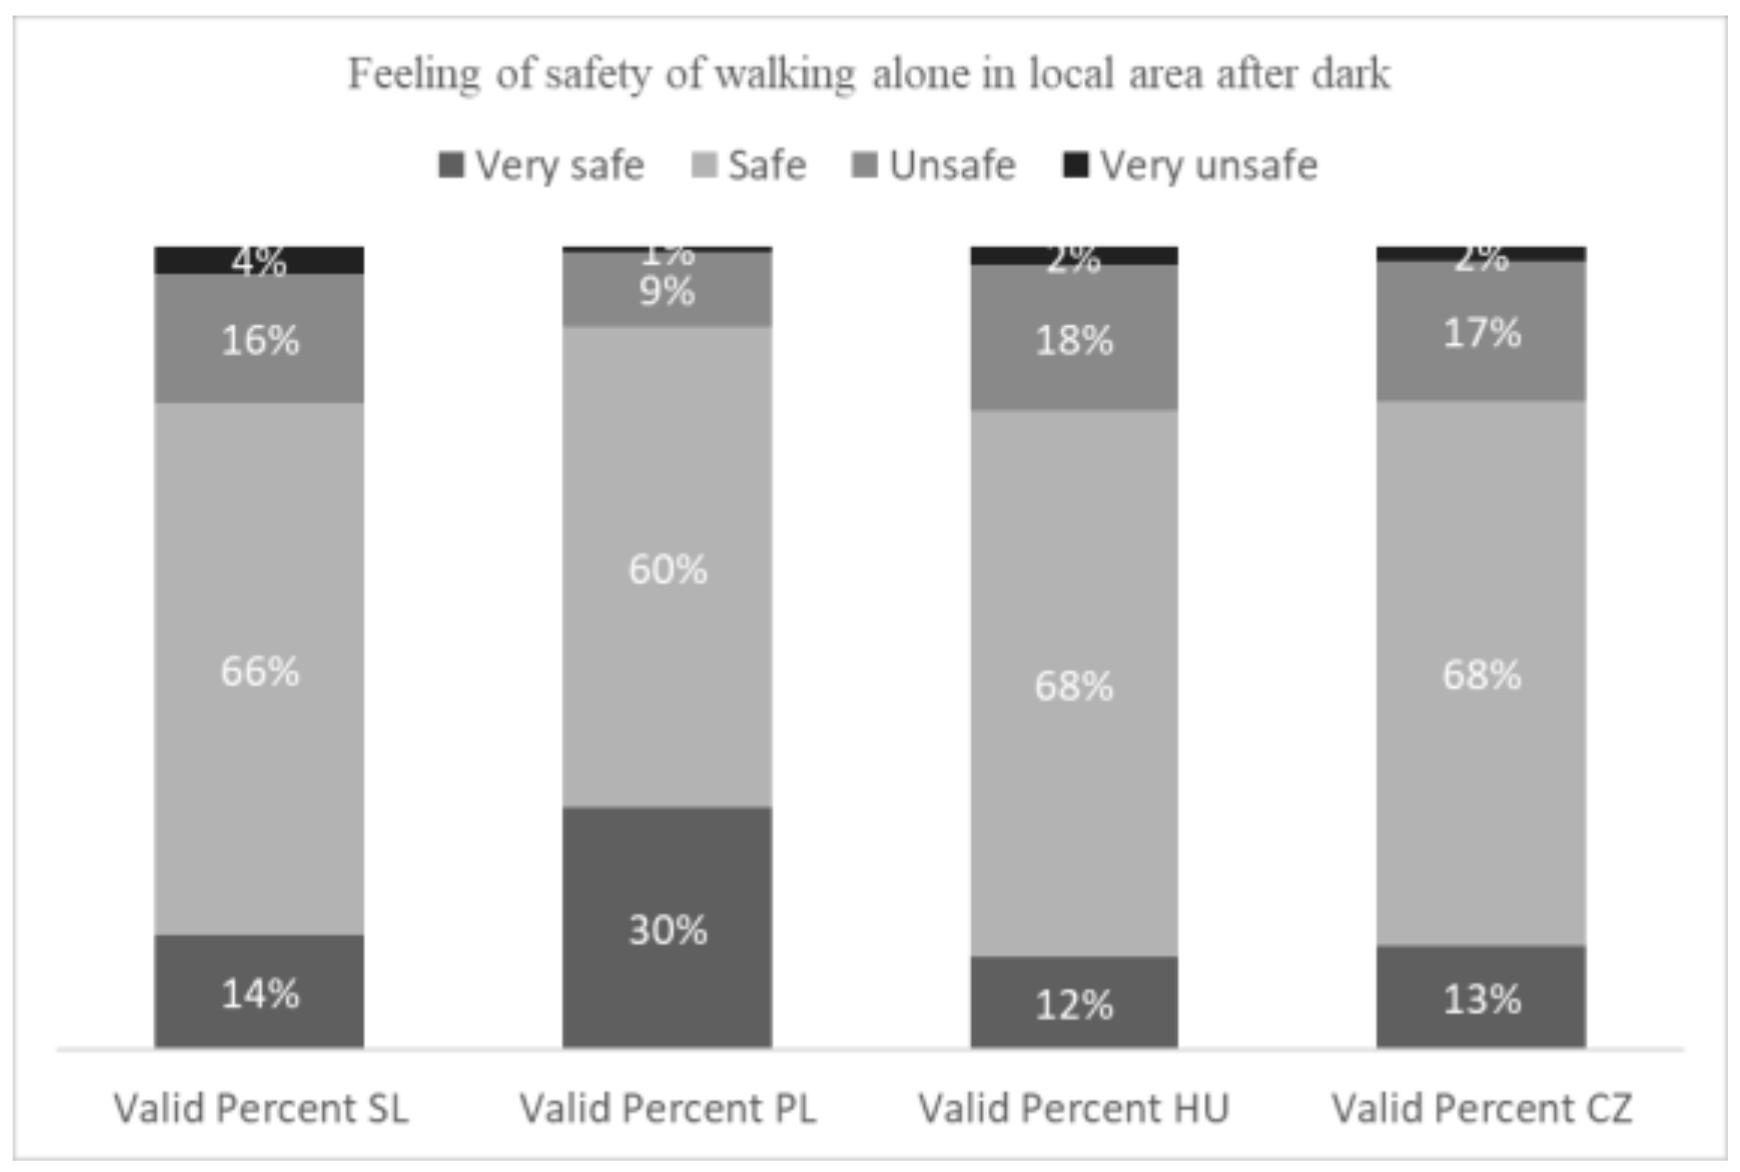
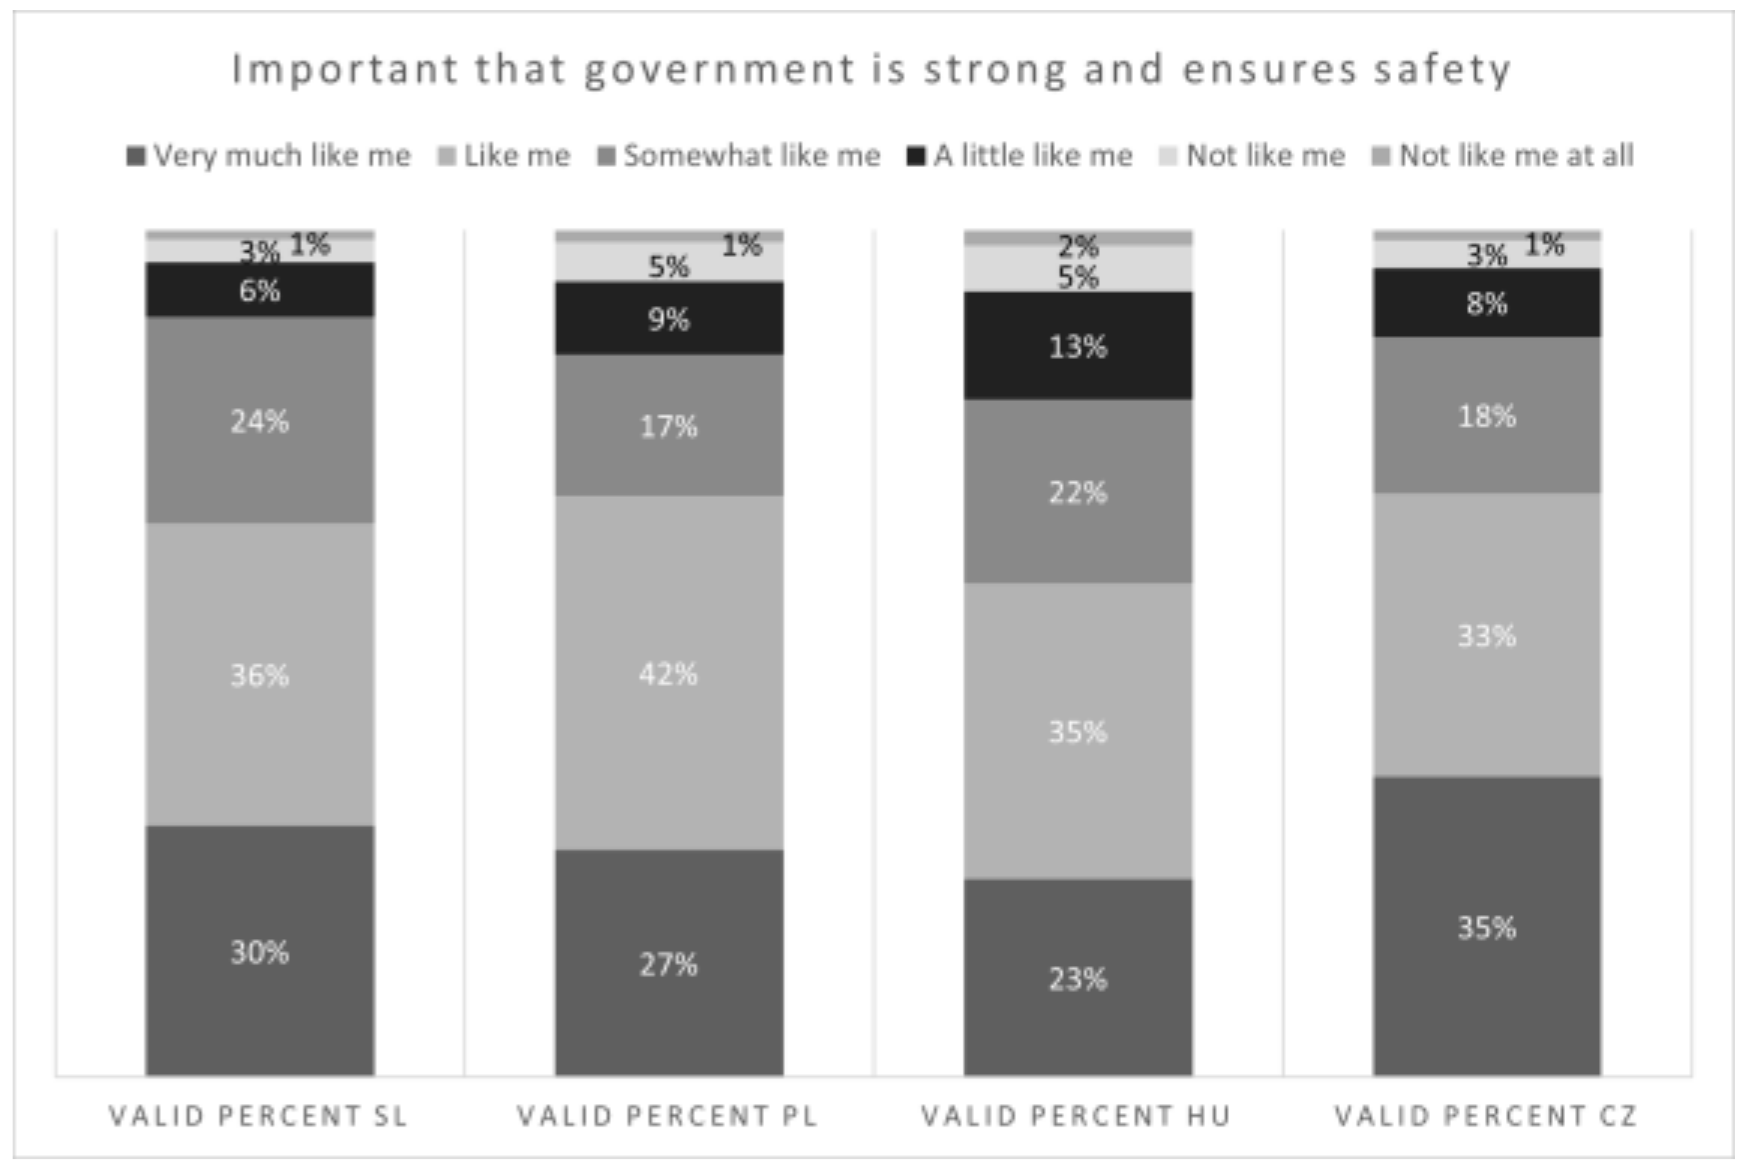
This section presents comparative analyses of public perceptions and attitudes among V4 countries. We observed the how the variables of perceptions of public safety and security varied among the target countries. As a matter of fact, the level of fear of crime in society is similar across all Central and Eastern European countries. ([47] (pp. 135–136), as cited in [30]). Figure 2, Figure 3, Figure 4, Figure 5, Figure 6, Figure 7, Figure 8, Figure 9 and Figure 10 were based on survey data from the ESS datasets available at: [54]. In our case, frequency plots were deemed to be unsuitable for discussion because of the varying number of responses in each country (Hungary: 1661, Poland: 1500, Slovakia: 1083, Czech Republic: 2398). We used only valid percentages for analyses of the responses, excluding missing answers and answers with “do not know” to assess the public perceptions of and attitudes towards safety and security. Henceforth, we adopted the percentage plots for comparing the trends of responses against each variable of the study. Figure 5, Figure 6, Figure 7, Figure 8, Figure 9 and Figure 10 shows the variables for each country in the analysis as percentage plots, giving the percentages of responses to a certain question compared across countries. We can see in Figure 4 that for all countries, the responses are more favorable for “trust in the police” except in the Slovak Republic. The percentage of respondents with high trust was, in order, Hungary, 66%; the Czech Republic, 59%; Poland, 54%; and the Slovak Republic had the least, i.e., 43% (Figure 5). All V4 countries had less than 10% of respondents who stated that a household member had faced victimization in the last five years: Hungary with 3%, Slovakia with 4%, Poland with 6%, and the Czech Republic with 10% (Figure 6). Furthermore, in the case of feeling safe after dark, the responses were flat and even across most countries Poland, which had the most responses indicating a complete sense of safety (i.e., 30%) in comparison with other countries (Figure 7).
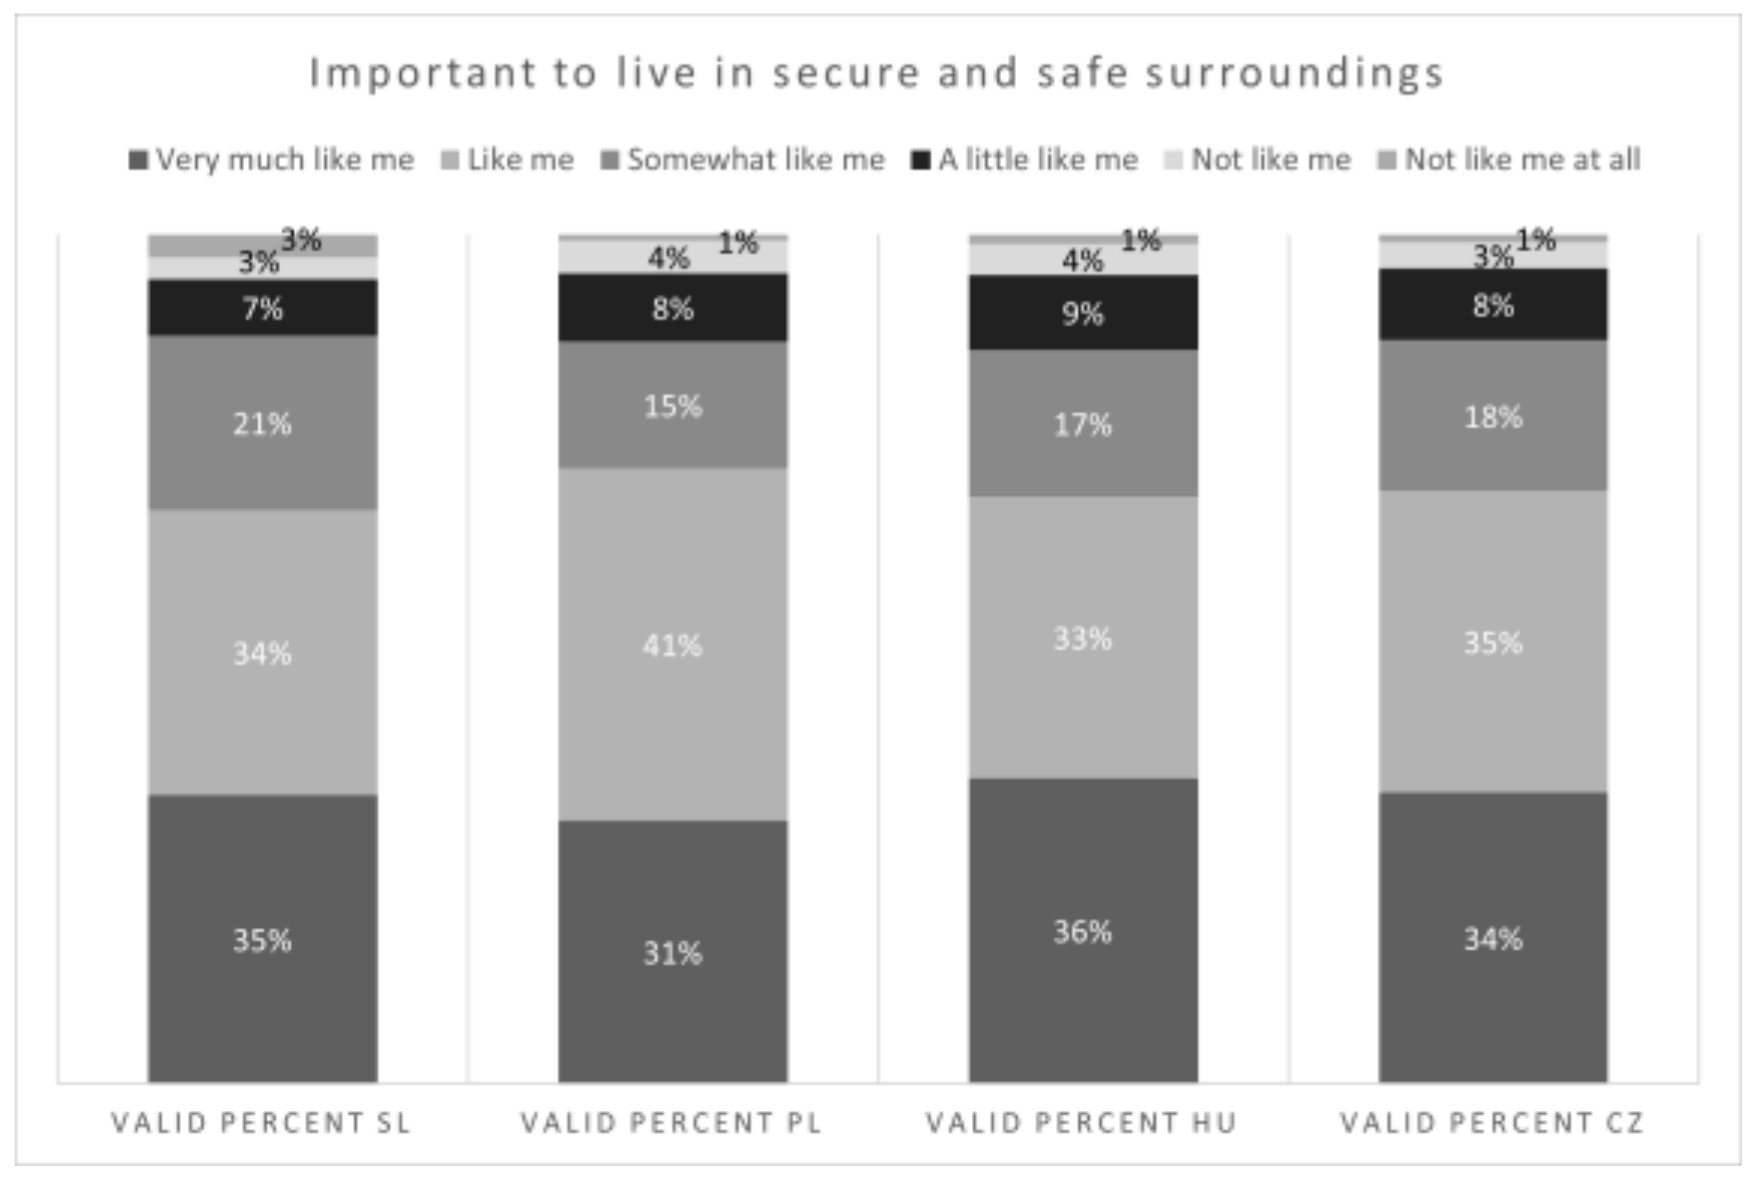
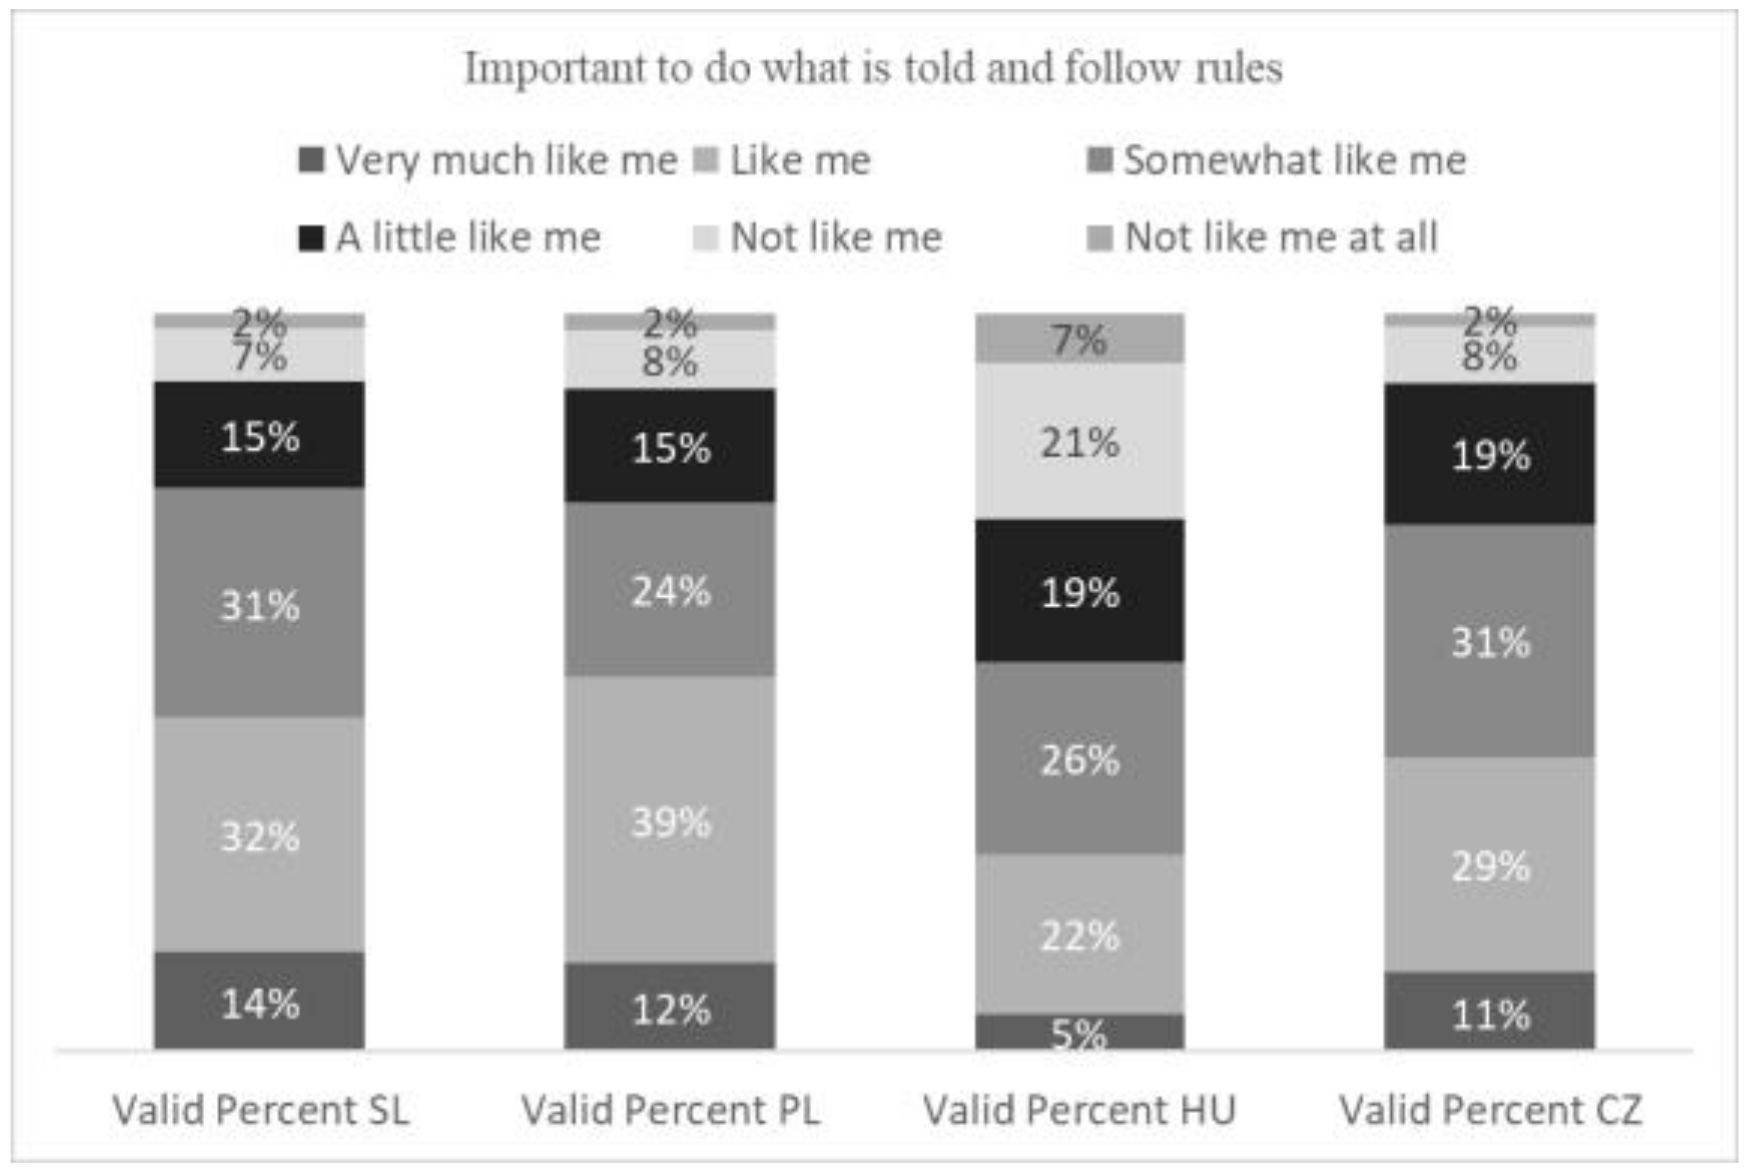
Residents of all the four countries were very much aware of importance of living in safe and secure surroundings, i.e., more than 70% think it is important or very important to live in a safe and secure environment (Figure 8). The same was found regarding the frequency and percentage of respondents (70% for all countries) who think it is the role of the government to ensure the safety of the public (Figure 10). The public is also aware of following the rules (Figure 9).

6. Discussion and Conclusions

This study suggested a multi-contextual view of crime. Furthermore, it discussed the implications and perceptions of crimes, as well as attitudes in the community regarding the fear of crime, victimization, governance, compliance, and awareness. We have indicated that there is a correlation between the perception variables and actual recorded crimes for the V4 Central European countries. We have presented the results in a statistical and graphical form to show what and how data make meanings for the audience. These findings present how analyses of crime make use of an area of keen importance in security, governance, and policymaking based on changing trends and the varying attitudes of the public. This study could motivate researchers in this domain to incorporate more persuasive data analysis (e.g., heat maps and relational analyses) in case-based studies rather than using simple descriptive statistics, specifically in areas with underdeveloped security provisions and data sharing methodologies, along with the discussed limitations. Moreover, this study has made the research more contemporary, insightful, and interpretable for the audience. By including the contribution of data-based insights and their integration into smart security provisions, the study can be extended into research into the indexing and visionary governance of cities.
There were very positive responses by the public regarding trust in the police, fear of crime, victimization, governance, compliance, and awareness, as we discussed in the results. This demands, however, that governance and administrative areas should be improved consistently to maintain law and order. In the last decade, many technology-aided services and products in the realm of safety and security have been implemented by governments to achieve social control in areas where crime flourishes. The crime rates and statistics have shown a promising trend in V4 countries over the period of 2013–2019. The limitations in this research are mainly the complexity of the data and the process of cleaning data from big survey datasets and resources.
This study compared the variables of victimization and perceptions of safety with those of recorded crime. The perceptions regarding trust in the police, fear of crime, victimization, governance, compliance, and awareness were found to be related to the crime rates across the four countries. For instance, higher recorded crime rates instill more fear of crime in the community. In countries where the recorded crime rates are low, perceptions are more positive about the fear of crime and victimization. As implied by these outcomes, we can argue that recorded crime statistics provide a sense of the surroundings in a certain region. In turn, this shapes the public’s perceptions of this, as our cross-country data analysis suggests.
We focused specifically on the Visegrád Four (V4) or European Quartet countries (The Czech Republic, Hungary, Poland, and Slovakia) in Central Europe. The authors of [55] mentioned that during the recent fast-paced transitions in the Central European countries, where there was already a crisis in the administrative area, with changes in systems and at the institutional levels caused severe disparity and social conflicts because of not so firm or newly adapted democratic systems of addressing such social disturbances. Such deprivation actually urged the CEE states to build a system of policies in the area of crime, making it a central problem of interest and giving it political importance.
For the media, sensationalism increases popularity and ratings, and sometimes, crime reporting is used for this. Regulation of the media is necessarily governed but not politicized. However, the positive aspects of the crime reporting include the urgency of following up sensitive crimes and the pressure that builds up on law agencies regarding the checks and balances in the eyes of public, and accountability and transparency of the procedures are ensured in this way [56]. This study made use of publicly available and ethically administered databases for social problems in society, and we can also refer to some related studies on cross-country and cross-time analyses of relevant human values based on ESS datasets [57,58].
The results and perceptions are quite promising, as we have reported many aspects justifying the congruency between the decline in crime rates and positive perceptions by the communities regarding the fear of crime and victimization [30]. One of them is surveillance and control. The post-socialist economic, political, and social changes in CEECs overlapped with the advanced technological revolution in the early 2000s until the present, which are ever more pervasive, needful, and disruptive in every walk of life. In accordance with this, technologically enhanced surveillance practices (TESPs) have been mentioned as a vital framework in the literature in terms of contemporary crime control practices and strategies. Here, we can mention privatization for the provision of security structures and agencies due to their great importance in implementing contemporary surveillance strategies, especially where the government cannot keep up with the pace of technology-driven surveillance in terms of social control policies and strategies. However, there are some counterfactors to consider while studying the research questions. One of these is that TESPs are very much criticized in terms of the tradeoff with freedom in terms of personal privacy, justice and fairness of the court system ([59] as cited in [30] (p. 67)).
This study further recommends identifying and exemplifying situations where we can apply smart data analytics. We recommend and propose heat maps based on multi-layered perceptions and crime rate statistics using data and geographical informatics tools. The recommended tools are SPSS (using Python libraries for the baseline statistics) and QGIS geographical heat maps. However, the use of such tools requires the computing capability for presenting spatiotemporal analyses in a more sophisticated way, for which researchers might collaborate to extend the findings in a transdisciplinary way. Some studies have reviewed the statistical data on perceptions and crime. This study also recommends looking for relevant spatiotemporal data and contemporary methods as discussed in the literature review section.

Author Contributions

Conceptualization, U.G., P.T and D.F.; methodology, P.T.; software, U.G.; validation, U.G., P.T. and D.F.; formal analysis, U.G.; investigation, U.G. and P.T.; resources, U.G., P.T. and D.F.; data curation, U.G., P.T. and D.F.; writing—original draft preparation, U.G.; writing—review and editing, U.G., P.T. and D.F.; visualization, U.G. and P.T.; supervision, P.T. and D.F.; project administration, D.F.; funding acquisition, D.F. All authors have read and agreed to the published version of the manuscript.

Funding

This research was funded by Széchenyi István University, 9026 Győr, Egyetem Square 1, under Publication Grant Application Reference Number 046PTP2022 as part of university publication support program regarding the coverage of APC. Furthermore, university affiliation and publication platforms shall support indexing of this article in bibliographic profiles and records.

Institutional Review Board Statement

Not applicable.

Informed Consent Statement

Not applicable.

Data Availability Statement

Data are contained within the article as indicated in the analyses (refer to sources as mentioned for the tables and figures, where relevant). Furthermore, data available in a publicly accessible repository that does not issue DOIs are also used as publicly available datasets and statistical records were analysed in this study. These data can be found in references [8,47,48,49,50,51,52,53,54,60,61,62,63].

Conflicts of Interest

The authors declare no conflict of interest.

References

  1. Hipp, J.R. Assessing crime as a problem: The relationship between residents’ perception of crime and official crime rates over 25 years. Crime Delinq. 2013, 59, 616–648. [Google Scholar] [CrossRef]
  2. Ardanaz, M. Mind the Gap: Bridging Perception and Reality with Crime Information; American Development Bank: Washington, DC, USA, 2013. [Google Scholar]
  3. Spicer, V.; Song, J.; Brantingham, P. Bridging the perceptual gap: Variations in crime perception of businesses at the neighborhood level. Secur. Inform. 2014, 3, 819. [Google Scholar] [CrossRef] [Green Version]
  4. Ghani, U.; Toth, P.; David, F. A Comparative Review On Public Safety And Security Indicator(S) Gaps In Smart Cities’ Indexes. In Proceedings of the 12th IEEE International Conference on Cognitive Infocommunications (CogInfoCom), Online, 23–25 September 2021; pp. 621–630, ISBN 978-1-6654-2494-3. [Google Scholar]
  5. Judt, T. Ill Fares the Land; Penguin: London, UK, 2011. [Google Scholar]
  6. Goold, B.J. Privacy rights and public spaces: CCTV and the problem of the “unobservable observer”. Crim. Justice Ethics 2002, 21, 21–27. [Google Scholar] [CrossRef]
  7. Pereira, G.V.; Parycek, P.; Falco, E.; Kleinhans, R. Smart governance in the context of smart cities: A literature review. Inf. Polity 2018, 23, 143–162. [Google Scholar] [CrossRef] [Green Version]
  8. Alonso, F.; Useche, S.; Faus, M.; Esteban, C. Does Urban Security Modulate Transportation Choices and Travel Behavior of Citizens? A National Study in the Dominican Republic. Front. Sustain. Cities 2020, 2, 42. [Google Scholar] [CrossRef]
  9. Solymosi, R.; Buil-Gil, D.; Vozmediano, L.; Guedes, I.S. Towards a Place-based Measure of Fear of Crime: A Systematic Review of App-based and Crowdsourcing Approaches. Environ. Behav. 2020, 53, 1013–1044. [Google Scholar] [CrossRef]
  10. Curtis, J. Integrating Sketch Maps with GIS to Explore Fear of Crime in the Urban Environment: A Review of the Past and Prospects for the Future. Cartogr. Geogr. Inf. Sci. 2012, 39, 175–186. [Google Scholar] [CrossRef]
  11. Butot, V.; Bayerl, P.S.; Jacobs, G.; de Haan, F. Citizen repertoires of smart urban safety: Perspectives from Rotterdam, the Netherlands. Technol. Forecast. Soc. Change 2020, 158, 120164. [Google Scholar] [CrossRef]
  12. Tulumello, S. The multiscalar nature of urban security and public safety: Crime prevention from local policy to policing in Lisbon (Portugal) and Memphis (the United States). Urban Aff. Rev. 2018, 54, 1134–1169. [Google Scholar] [CrossRef] [Green Version]
  13. Dupont, B.; Wood, J. Urban security, from nodes to networks: On the value of connecting disciplines. Can. J. Law Soc. Rev. Can. Droit Société 2007, 22, 95–112. [Google Scholar] [CrossRef]
  14. West, D.M.; Bernstein, D. Benefits and Best Practices of Safe City Innovation; Center for Technology Innovation at Brookings: Washington, DC, USA, 2017. [Google Scholar]
  15. Jakobi, Á.; Pődör, A. GIS-Based Statistical Analysis of Detecting Fear of Crime with Digital Sketch Maps: A Hungarian Multicity Study. ISPRS Int. J. Geo-Inf. 2020, 9, 229. [Google Scholar] [CrossRef] [Green Version]
  16. Bennett, T. The effectiveness of a police-initiated fear-reducing strategy. Br. J. Criminol. 1991, 31, 1–14. [Google Scholar] [CrossRef]
  17. Vozmediano, L.; Azanza, M.; Villamane, M. Desarrollando y Probando Una App Para Analizar La Influencia de La Se-guridad Percibida En La Movilidad a Pie: Un Trabajo Multidisciplinary Con Profesorado y Alumnado de Psicología e Ingeniería. Educ. Base Para Los Objet. Desarro. Sosten. Grupo 2017, 4, 13. [Google Scholar]
  18. Mohler, G.; Porter, M.D. Rotational Grid, PAI-Maximizing Crime Forecasts. Statistical Analysis and Data Mining. ASA Data Sci. J. 2018, 11, 227–236. [Google Scholar]
  19. Nummenmaa, L.; Hari, R.; Hietanen, J.K.; Glerean, E. Maps of subjective feelings. Proc. Natl. Acad. Sci. USA 2018, 115, 9198–9203. [Google Scholar] [CrossRef] [Green Version]
  20. Kounadi, O.; Ristea, A.; Araujo, A.; Leitner, M. A systematic review on spatial crime forecasting. Crime Sci. 2020, 9, 7. [Google Scholar] [CrossRef]
  21. Lopez, N.; Lukinbeal, C. Comparing Police and Residents’ Perceptions of Crime in a Phoenix Neighborhood using Mental Maps in GIS. Yearb. Assoc. Pac. Coast Geogr. 2010, 72, 33–55. [Google Scholar] [CrossRef]
  22. Pocock, D.; Ray, H. (Eds.) Images of the urban environment. In Images of the Urban Environment; Columbia University Press: New York, NY, USA, 1978. [Google Scholar]
  23. Kennedy, L.W.; Caplan, J.M.; Piza, E. Risk clusters, hotspots, and spatial intelligence: Risk terrain modeling as an algorithm for police resource allocation strategies. J. Quant. Criminol. 2011, 27, 339–362. [Google Scholar] [CrossRef] [Green Version]
  24. Dugato, M.; Favarin, S.; Bosisio, A. Isolating Target And Neighbourhood Vulnerabilities In Crime Forecasting. Eur. J. Crim. Policy Res. 2018, 24, 393–415. [Google Scholar] [CrossRef]
  25. Malik, A.; Maciejewski, R.; Towers, S.; McCullough, S.; Ebert, D.S. Proactive Spatiotemporal Resource Allocation and Predictive Visual Analytics for Community Policing and Law Enforcement. IEEE Trans. Vis. Comput. Graph. 2014, 20, 1863–1872. [Google Scholar] [CrossRef] [Green Version]
  26. Wood, D.M. The ‘Surveillance Society’ Questions of History, Place and Culture. Eur. J. Criminol. 2009, 6, 179–194. [Google Scholar] [CrossRef]
  27. Little, R.G. Holistic strategy for urban security. J. Infrastruct. Syst. 2004, 10, 52–59. [Google Scholar] [CrossRef]
  28. Zhan, D.; Kwan, M.P.; Zhang, W.; Fan, J.; Yu, J.; Dang, Y. Assessment and determi-nants of satisfaction with urban livability in China. Cities 2018, 79, 92–101. [Google Scholar] [CrossRef]
  29. Jackson, J.; Bradford, B.; Hough, M.; Kuha, J.; Stares, S.; Widdop, S.; Fitzgerald, R.; Yordanova, M.; Galev, T. Developing European indicators of trust in justice. Eur. J. Criminol. 2011, 8, 267–285. [Google Scholar] [CrossRef]
  30. Šelih, A. Crime and crime control in transition countries. In Crime and Transition in Central and Eastern Europe; Springer: New York, NY, USA, 2012; pp. 3–34. [Google Scholar]
  31. Altindag, D.T. Crime and unemployment: Evidence from Europe. Int. Rev. Law Econ. 2012, 32, 145–157. [Google Scholar] [CrossRef] [Green Version]
  32. Castelnovo, W.; Misuraca, G.; Savoldelli, A. Smart Cities Governance: The Need for a Holistic Approach to Assessing Urban Participatory Policy Making. Soc. Sci. Comput. Rev. 2016, 34, 724–739. [Google Scholar] [CrossRef]
  33. GruszczyŃska, B. Crime in Central and Eastern European Countries in the Enlarged Europe. Eur. J. Crim. Policy Res. 2004, 10, 123–136. [Google Scholar] [CrossRef]
  34. Skog, D.A.; Henrik, W.; Johan, S. Digital disruption. Bus. Inf. Syst. Eng. 2018, 60, 431–437. [Google Scholar] [CrossRef] [Green Version]
  35. Yoo, Y.; Henfridsson, O.; Lyytinen, K. Research commentary—The new organizing logic of digital innovation: An agenda for information systems research. Inf. Syst. Res. 2010, 21, 724–735. [Google Scholar] [CrossRef]
  36. Nambisan, S.; Lyytinen, K.; Majchrzak, A.; Song, M. Digital Innovation Management: Reinventing innovation management research in a digital world. MIS Q. 2017, 41, 223–238. [Google Scholar] [CrossRef]
  37. Fichman, R.G.; Dos Santos, B.L.; Zheng, Z. Digital innovation as a fundamental and powerful concept in the information systems curriculum. MIS Q. 2014, 38, 329-A15. [Google Scholar] [CrossRef] [Green Version]
  38. Tilson, D.; Lyytinen, K.; Sørensen, C. Research commentary—Digital infrastructures: The missing IS research agenda. Inf. Syst. Res. 2010, 21, 748–759. [Google Scholar] [CrossRef]
  39. Johnson, S.D.; Bowers, K.J. The Burglary as Clue to the Future: The Beginnings of Prospective Hot-Spotting. Eur. J. Criminol. 2004, 1, 237–255. [Google Scholar] [CrossRef]
  40. Ariel, B.; Sutherland, A.; Henstock, D.; Young, J.; Drover, P.; Sykes, J.; Megicks, S.; Henderson, R. Report: Increases in police use of force in the presence of body-worn cameras are driven by officer discretion: A protocol-based subgroup analysis of ten randomized experiments. J. Exp. Criminol. 2016, 12, 453–463. [Google Scholar] [CrossRef] [Green Version]
  41. Chourabi, H.; Nam, T.; Walker, S.; Gil-Garcia, J.R.; Mellouli, S.; Nahon, K.; Pardo, T.A.; Scholl, H.J. Understanding Smart Cities: An Integrative Framework. In Proceedings of the 2012 45th Hawaii International Conference on System Sciences, Maui, HI, USA, 4–7 January 2012. [Google Scholar]
  42. Makhoul, N. From Sustainable to Resilient and Smart Cities. In IABSE Reports; International Association for Bridge and Structural Engineering (IABSE): Zurich, Switzerland, 2015. [Google Scholar]
  43. Gil, D.B.; Moretti, A.; Shlomo, N.; Medina, J. Worry about crime in Europe: A model-based small area estimation from the European Social Survey. Eur. J. Criminol. 2019, 18, 274–298. [Google Scholar] [CrossRef] [Green Version]
  44. Gray, E.; Jackson, J.; Farrall, S. Reassessing the Fear of Crime. Eur. J. Criminol. 2008, 5, 363–380. [Google Scholar] [CrossRef] [Green Version]
  45. Tseloni, A.; Zarafonitou, C. Fear of Crime and Victimization: A Multivariate Multilevel Analysis of Competing Measurements. Eur. J. Criminol. 2008, 5, 387–409. [Google Scholar] [CrossRef] [Green Version]
  46. Kury, H. Postawy Punitywne i Ich Znaczenie Punitive Attitudes and Their Meaning. In Mit Represyjności Albo o Znaczeniu Prewencji Kryminalnej; Czapska, J., Kury, H., Eds.; Zakamycze: Krakow, Poland, 2002. [Google Scholar]
  47. Public Database VDB. n.d. Czso.Cz. Available online: https://vdb.czso.cz/vdbvo2/faces/en/index.jsf?page=vystup- (accessed on 9 October 2022).
  48. BSR. n.d. Bsr.Bm.Hu. Available online: https://bsr.bm.hu/Document (accessed on 9 October 2022).
  49. Polska Policja. n.d. “Statystyka”. Statystyka. Available online: http://statystyka.policja.pl/ (accessed on 31 October 2022).
  50. Poland: Recorded and Detected Crimes 2021. n.d. Statista. Available online: http://www.statista.com/statistics/1120240/poland-recorded-and-detected-crimes/ (accessed on 9 October 2022).
  51. Annual Budget of Frontex in the EU 2005–2021. n.d. Statista. Available online: https://www.statista.com/statistics/973052/annual-budget-frontex-eu/ (accessed on 31 October 2022).
  52. N.d. Statistics.Sk. Available online: https://statdat.statistics.sk (accessed on 9 October 2022).
  53. Van der Woude, M.; Barker, V.; Van Der Leun, J. Crimmigration in Europe. Eur. J. Criminol. 2017, 14, 3–6. [Google Scholar] [CrossRef] [Green Version]
  54. N.d. Europeansocialsurvey.org. Available online: https://www.europeansocialsurvey.org/ (accessed on 9 October 2022).
  55. Levay, M. Social Exclusion: A Prosperous Term in Contemporary Criminology; Social Exclusion and Crime in Central and Eastern Europe. Ann. U. Sci. Bp. Rolando Eotvos Nomin. 2006, 47, 119. [Google Scholar]
  56. Bronowska, K.; Sławik, K. Przestępczość a środki masowego przekazu. Problemy Współczesnej Kryminalistyki 2003, 6, 257–273. [Google Scholar]
  57. Moore, S.C. The value of reducing fear: An analysis using the European Social Survey. Appl. Econ. 2006, 38, 115–117. [Google Scholar] [CrossRef]
  58. Davidov, E. A Cross-Country and Cross-Time Comparison of the Human Values Measurements with the Second Round of the European Social Survey. Surv. Res. Methods 2008, 2, 33–46. [Google Scholar] [CrossRef]
  59. Leman-Langlois, S. Introduction: Technocrime. In Technocrime: Technology, Crime and Social Control; Leman-Langlois, S., Ed.; Willan Publishing: Cullompton, UK, 2008; pp. 1–13. [Google Scholar]
  60. Hungarian Central Statistical Office. n.d. Ksh.Hu. Available online: https://www.ksh.hu/justice (accessed on 9 October 2022).
  61. n.d. Europa.Eu. Available online: https://ec.europa.eu/eurostat/databrowser/view/crim_off_cat$DV_348/default/table?la (accessed on 9 October 2022).
  62. Polizeiliche Kriminalstatistik (PKS). n.d. Bundeskriminalamt. Available online: https://bundeskriminalamt.at/501/ (accessed on 9 October 2022).
  63. World Development Indicators; World Bank Publications: Washington, DC, USA, 2008.
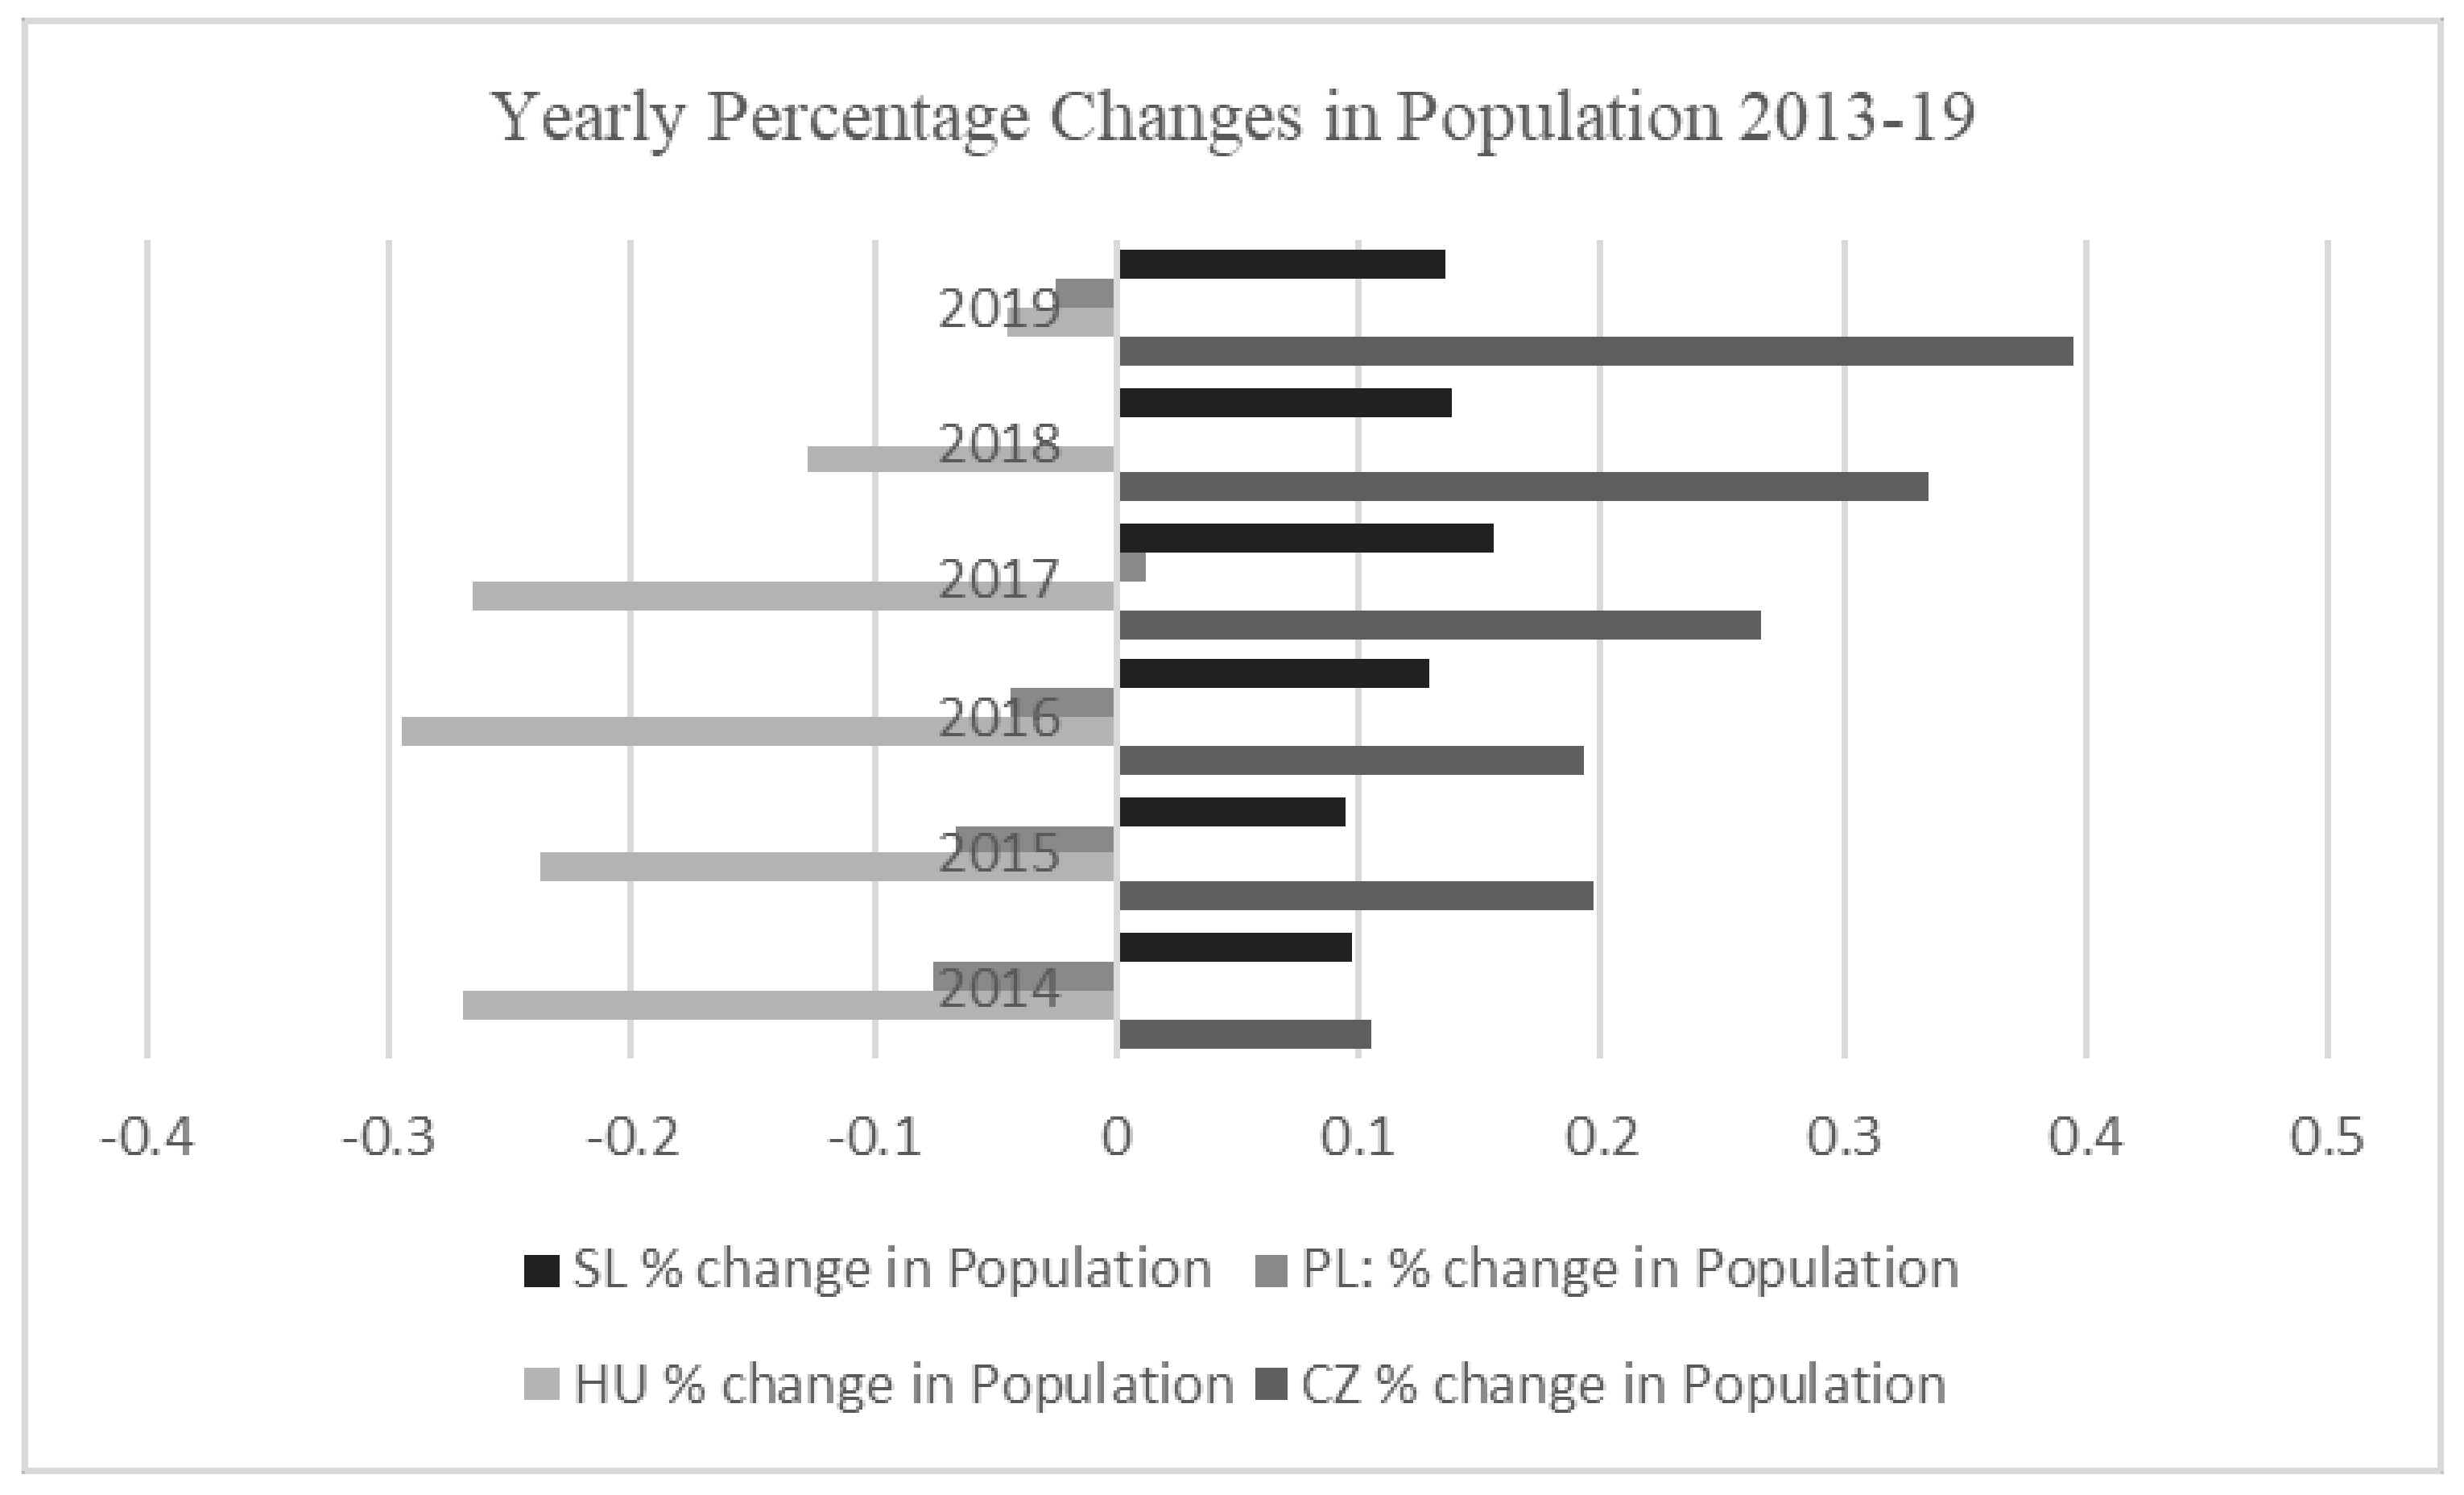
Figure 1. Changes in the population of V4 countries, as a percentage, for 2013–2019. Source: https://data.worldbank.org/indicator/SP.POP.TOTL (accessed on 9 October 2022).
Societies 12 00156 g001
Figure 2. Population data for the Czech Republic, Hungary, Poland, and Slovakia, 2013–2019.
Societies 12 00156 g002
Figure 3. Changes in the crime rate of V4 countries (per 100,000 population) for 2013–2019. Source: See Table 2.
Societies 12 00156 g003
Figure 4. Crime rates for the Czech Republic, Hungary, Poland, and Slovakia, 2013–2019.
Societies 12 00156 g004
Figure 5. Responses regarding trust in the police.
Societies 12 00156 g005
Figure 6. Responses regarding whether a household member has been a victim of a crime.
Societies 12 00156 g006
Figure 7. Responses regarding feeling safe walking in the dark alone.
Societies 12 00156 g007
Figure 8. Responses for the importance of living in safe and secure surroundings.
Societies 12 00156 g008
Figure 9. Responses regarding the importance of following rules.
Societies 12 00156 g009
Figure 10. The governments’ role in ensuring safety.
Societies 12 00156 g010
Table 1. Correlation analysis of study variables and crime rates.
Spearman’s Rho CorrelationsCR19
Spearman’s rhoCR19Correlation coefficient1.000
Sig. (two-tailed)0.0
N6642
Trust in the policeCorrelation coefficient0.068 **
Sig. (two-tailed)0.000
N6569
Respondent’s sequence number in cumulative datasetCorrelation coefficient0.107 **
Sig. (two-tailed)0.000
N6642
Respondent or household member was a victim of burglary/assault in the last 5 yearsCorrelation coefficient0.031 *
Sig. (two-tailed)0.013
N6615
Feeling of safety when walking alone in the local area after darkCorrelation coefficient−0.133 **
Sig. (two-tailed)0.000
N6563
Importance of living in secure and safe surroundingsCorrelation coefficient0.009
Sig. (two-tailed)0.484
N6526
Importance of doing as told and following rulesCorrelation coefficient0.045 **
Sig. (two-tailed)0.000
N6467
Importance of a government that is strong and ensures safetyCorrelation coefficient0.056 **
Sig. (two-tailed)0.000
N6490
* Correlation is significant at the 0.01 level (two-tailed); ** correlation is significant at the 0.05 level (two-tailed).
Table 2. Crime statistics, population data, and crime rates for the Czech Republic, Hungary, Poland, and Slovakia.
Crime Count2013201420152016201720182019
Czech Republic77,97672,82565,56961,42355,70554,44855,594
Hungary377,829329,575280,113290,779138,199199,830165,648
Poland727,700589,100522,500490,300463,900491,700507,200
Slovak Republic44,75339,93834,78033,82231,28627,56825,123
Population 12013201420152016201720182019
Czech Republic10,514,27210,525,34710,546,05910,566,33210,594,43810,629,92810,671,870
Hungary9,893,0829,866,4689,843,0289,814,0239,787,9669,775,5649,771,141
Poland38,040,19638,011,73537,986,41237,970,08737,974,82637,974,75037,965,475
Slovak Republic5,413,3935,418,6495,423,8015,430,7985,439,2325,446,77154,54,147
Crime Rates2013201420152016201720182019
Czech Republic741.6205691.9012621.7394581.3086525.7948512.2142520.9396
Hungary3819.1233340.3542845.8012962.8931411.9282044.1791695.278
Poland1912.9761549.7851375.4921291.281221.5991294.8081335.951
Slovak Republic826.7089737.0472641.2477622.7814575.1915506.1347460.622
Table 3. Crime statistics on the major offences committed in the Czech Republic (Source: Statistical metainformation system [49] Hungary (https://bsr.bm.hu/Document, Bűncselekményi adatok databases, accessed on 20 December 2012 [49]; the translation of each Hungarian crime type was automatically translated by Deepl.com, accessed on 9 October 2022), Poland ([50]), and the Slovak Republic (https://www.statdat.statistics.sk, accessed on 9 October 2022 [52]) for 2013–2019.
Czech Republic
Year2013201420152016201720182019
Illegal production and possession of narcotics, psychotropic
substances, and poisons; spreading of addiction
2522285427082833283728683103
Evasion of alimony payments11,154980381607339606352495272
Cruelty to a person sharing the dwelling or house291285252255252235226
Murder12113211296759974
Bodily harm, brawling4528297128702993278028222738
Robbery138811061007908775763764
Rape and sexual abuse535529515593557580600
Theft, embezzlement, fraud25,05223,03218,84716,81915,39814,36414,162
Traffic offences16,90316,71516,05518,69813,84014,33715,935
Other offences50,46048,51645,77043,16538,93939,06840,727
Total crime77,97672,82565,56961,42355,70554,44855,594
Poland
Year2013201420152016201720182019
Recorded crimes727,700589,100522,500490,300463,900491,700507,200
Detected crimes406,900317,800275,500272,700281,000319,200332,800
Hungary
Year2013201420152016201720182019
Grand total377,829329,575280,113290,779138,199199,830165,648
Slovak Republic
Year2013201420152016201720182019
Crimes of violence6003563756866382613257815540
Murder78724860806776
Robbery836680539526469475410
Battery2017195518621632161815991526
Rape91878782969997
Property crimes38,75034,30129,09427,44025,15421,78719,583
Burglary11,167942768626260572045293695
Motor vehicle theft2431229719321671152413391042
Total44,75339,93834,78033,82231,28627,56825,123
Publisher’s Note: MDPI stays neutral with regard to jurisdictional claims in published maps and institutional affiliations.