The Social Justice Impact of the Transit-Oriented Development


Abstract
:1. Introduction
2. Theoretical Background
2.1. Transit-Oriented Development and Gentrification
2.2. Discretionary Income and Transit-Induced Gentrification
2.3. Selection Bias in Implementation of Transit-Oriented Development
2.4. TOD’s Effect on Indispensable Expenditures
2.5. Research Gap and Research Question
- •
- Is DI lower or higher in an LRTOD area than a comparable area without LRTOD?
- •
- Is the difference in DI following the introduction of LRTOD greater for a lower-income household than for a middle-income household?
- •
- How does the systematic difference in the implementation of TODs affect estimating its impact on DI?
3. Research Framework
3.1. Data
3.2. Methodology
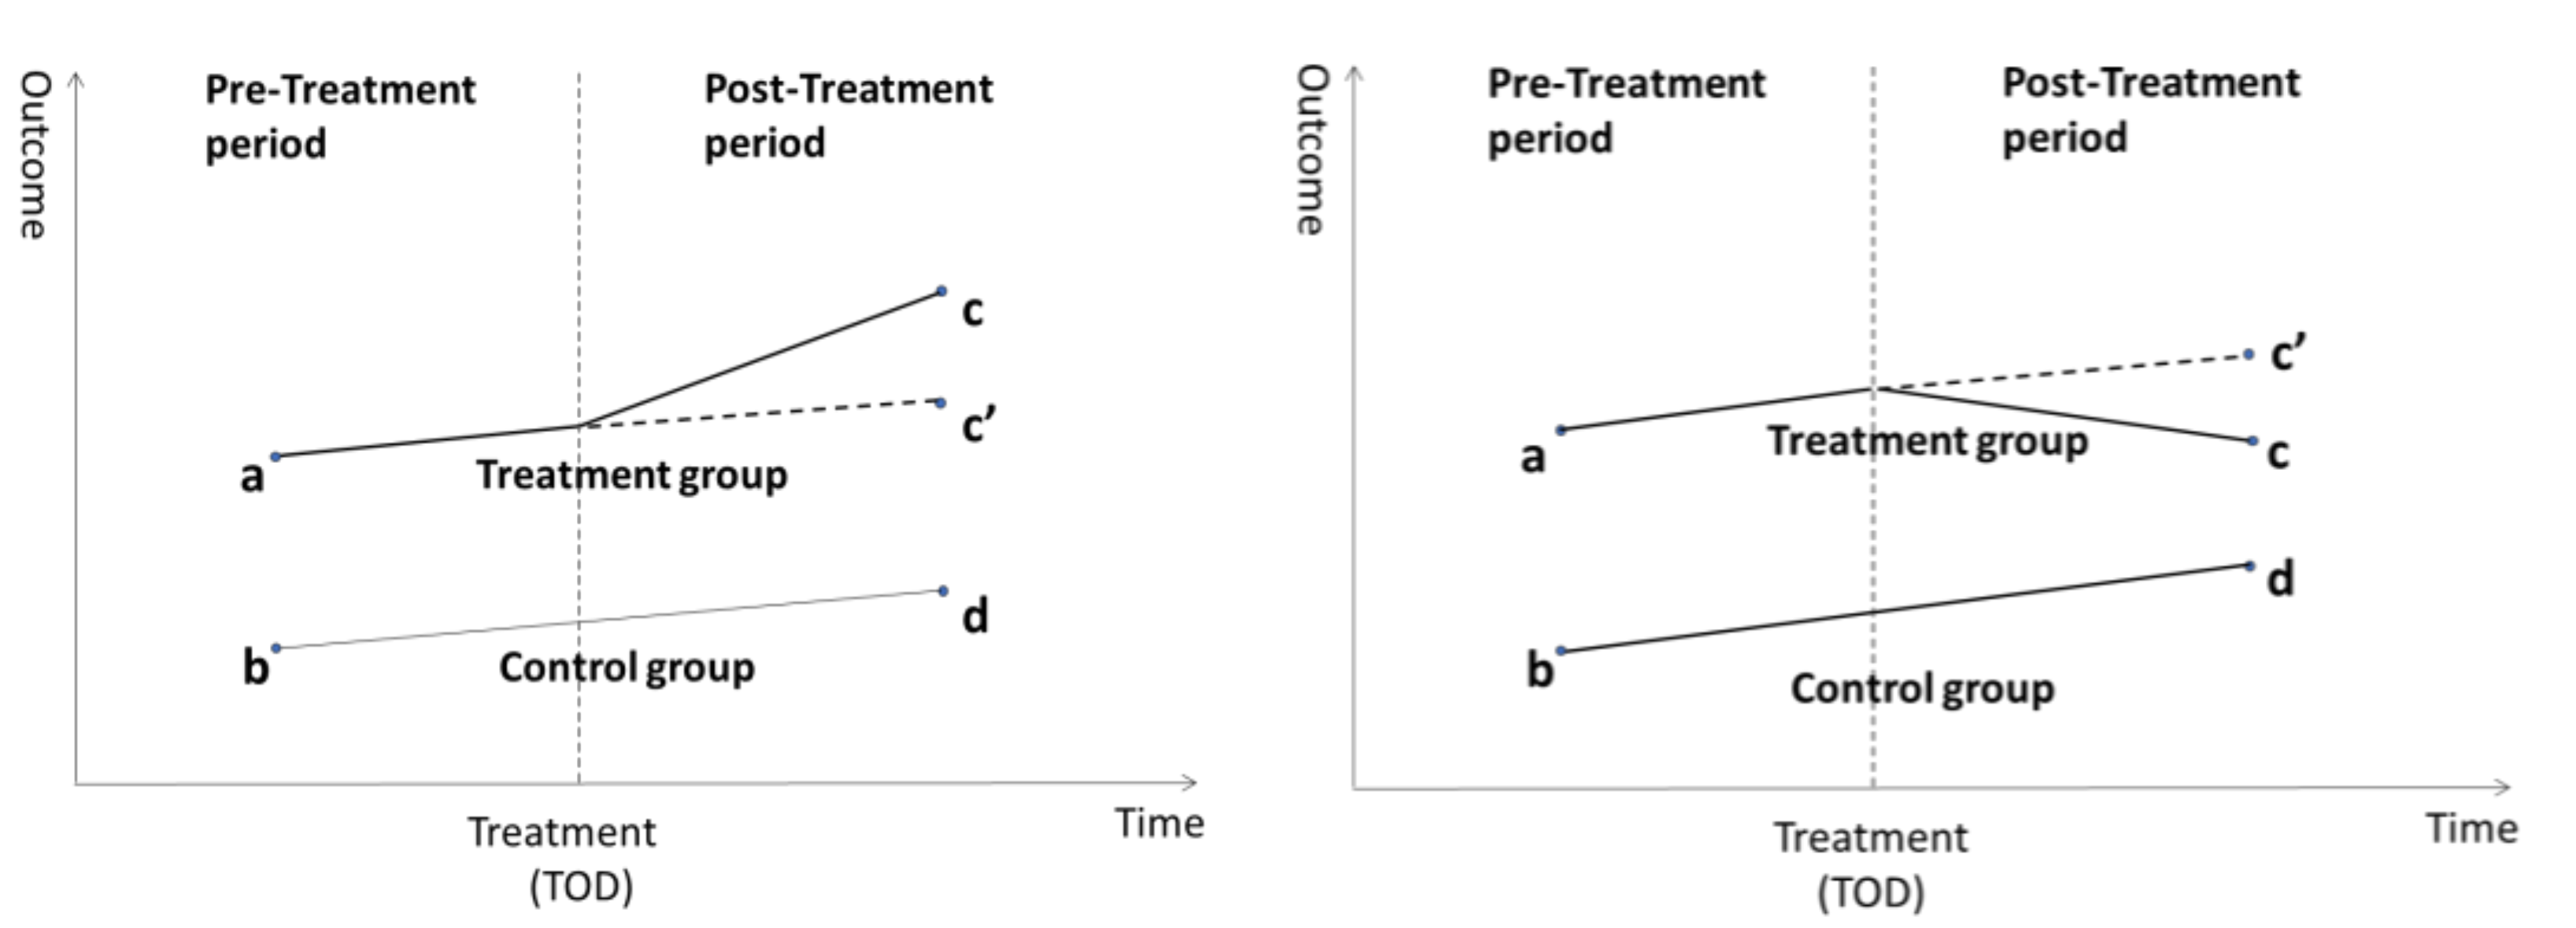
3.2.1. Difference-in-Difference Regression
3.2.2. Selection Bias in TOD’s Location
3.2.3. Conditional Difference-in-Difference with Propensity Score Matching
4. Results
4.1. Control Neighborhood Selection Using Propensity Score Matching
4.2. Discretionary Income Model Outcomes
5. Conclusions
Author Contributions
Funding
Data Availability Statement
Acknowledgments
Conflicts of Interest
Appendix A. The Outcomes of Propensity Score Matching

| Summary of Balance for All data | |||||||
|---|---|---|---|---|---|---|---|
| Variable | Means Treated | Means Control | SD Control | Mean Diff | eQQ Med | eQQ Mean | eQQ Max |
| Distance | 0.549 | 0.011 | 0.059 | 0.538 | 0.634 | 0.513 | 0.87 |
| Total population (2000) | 1400.4 | 1397.747 | 640.88 | 2.653 | 118 | 262.9 | 2787 |
| Population density | 0.002 | 0.002 | 0.001 | 0 | 0 | 0 | 0.005 |
| Race: White (2000, %) | 0.624 | 0.769 | 0.182 | −0.145 | 0.163 | 0.154 | 0.246 |
| Median year of building (2000) | 46.7 | 20.768 | 11.636 | 25.932 | 26 | 25.3 | 33 |
| Poverty ratio (2000) | 0.359 | 0.118 | 0.135 | 0.241 | 0.281 | 0.301 | 2.171 |
| Commuting Worker (2000, %) | 0.334 | 0.46 | 0.171 | −0.126 | 0.148 | 0.266 | 4.351 |
| Urban population (2000, %) | 1 | 0.968 | 0.137 | 0.032 | 0 | 0.049 | 1 |
| Summary of Balance for matched data | |||||||
| Variable | Means Treated | Means Control | SD Control | Mean Diff | eQQ Med | eQQ Mean | eQQ Max |
| Distance | 0.549 | 0.085 | 0.148 | 0.464 | 0.593 | 0.455 | 0.704 |
| Total population (2000) | 1400.4 | 1523.573 | 536.286 | −123.173 | 120.5 | 151.5 | 681 |
| Population density | 0.002 | 0.002 | 0.001 | 0 | 0 | 0 | 0.002 |
| Race: White (2000, %) | 0.624 | 0.666 | 0.195 | −0.042 | 0.065 | 0.063 | 0.125 |
| Median year of building (2000) | 46.7 | 39.153 | 6.206 | 7.547 | 7 | 7.667 | 17 |
| Poverty ratio (2000) | 0.359 | 0.233 | 0.147 | 0.126 | 0.14 | 0.123 | 0.238 |
| Commuting Worker (2000, %) | 0.334 | 0.365 | 0.097 | −0.031 | 0.047 | 0.05 | 0.112 |
| Urban population (2000, %) | 1 | 1 | 0 | 0 | 0 | 0 | 0 |
| Percent Balance Improvement | |||||||
| Variable | Mean Diff. | eQQ Med | eQQ Mean | eQQ Max | |||
| Distance | 13.654 | 6.413 | 11.275 | 19.024 | |||
| Total population (2000) | −4542.88 | −2.119 | 42.374 | 75.565 | |||
| Population density | −386.31 | −57.281 | 16.585 | 61.24 | |||
| Race: White (2000, %) | 71.163 | 60.296 | 59.103 | 48.982 | |||
| Median year of building (2000) | 70.898 | 73.077 | 69.697 | 48.485 | |||
| Poverty ratio (2000) | 47.619 | 50.321 | 59.02 | 89.046 | |||
| Commuting Worker (2000, %) | 75.563 | 67.925 | 81.329 | 97.423 | |||
| Urban population (2000, %) | 100 | 0 | 100 | 100 | |||
| Sample sizes | All | Matched | Unmatched | Discarded | |||
| Control | 1186 | 150 | 1036 | 0 | |||
| Treated | 30 | 30 | 0 | 0 | |||
Appendix B. Propensity Score Matching Algorithm
- Specify and estimate a logit model to obtain the propensity score . Logistic regression allows to be a linear function of X, meaning the probability of being assigned as a treatment group (living in TOD neighborhoods) is associated with the predictors X.where means being assigned as treatment group otherwise 0. Odds of being treatment groups can be defined as:Log odds can be reparametrized by a linear predictor, which is central to the logistic regression:Finally, the propensity score for a household, the probability of being a treatment group is the following:
- Restrict the sample to common support: delete all observations on treated groups with probabilities larger than maximum and smaller than the minimum in the potential control group as well as observations on a treated group with covariates used in the PSM model.
- Choose one observation from the treatment groups and eliminate it in the pool.
- Calculate the distance (difference) of propensity scores between the chosen observation and all observation in a control group.
- Select the observation with minimum distance.
- Repeat 1–5 for all observations in the treatment group.
- Finally, we have the matched observations between treatment and control groups.
References
- United States Government Accountability Office. Affordable Housing in Transit-Oriented Development: Key Practices Could Enhance Recent Collaboration Efforts between DOT-FTA and HUD; Government Accountability Office: Washington, DC, USA, 2009. [Google Scholar]
- Cervero, R.; Arrington, G.B. Effects of TOD on Housing, Parking, and Travel. Transit. Coop. Res. Progr. 2008. [Google Scholar] [CrossRef]
- Cervero, R.; Ferrell, C.; Murphy, S. Transit-Oriented Development and Joint Development in the United States: A Literature Review. Res. Results Dig. 2002, 1–144. [Google Scholar] [CrossRef]
- Jamme, H.T.; Rodriguez, J.; Bahl, D.; Banerjee, T. A Twenty-Five-Year Biography of the TOD Concept: From Design to Policy, Planning, and Implementation. J. Plan. Educ. Res. 2019, 39, 409–428. [Google Scholar] [CrossRef]
- Cervero, R. Effects of Light and Commuter Rail Transit on Land Prices: Experiences in San Diego County. J. Transp. Res. Forum 2004, 43, 121–138. [Google Scholar] [CrossRef]
- Dong, H. Rail-transit-induced gentrification and the affordability paradox of TOD. J. Transp. Geogr. 2017, 63, 1–10. [Google Scholar] [CrossRef]
- Weinberger, R. Light Rail Proximity: Benefit or Detriment in the Case of Santa Clara County, California? Transp. Res. Rec. J. Transp. Res. Board 2001, 1747, 104–113. [Google Scholar] [CrossRef]
- Cao, X.; Porter-Nelson, D. Real estate development in anticipation of the Green Line light rail transit in St. Paul. Transp. Policy 2016, 51, 24–32. [Google Scholar] [CrossRef] [Green Version]
- Nelson, A.C.; Eskic, D.; Hamidi, S.; Petheram, S.J.; Ewing, R.; Liu, J.H. Office Rent Premiums with Respect to Light Rail Transit Stations. Transp. Res. Rec. J. Transp. Res. Board 2015, 2500, 110–115. [Google Scholar] [CrossRef]
- Pilgram, C.A.; West, S.E. Fading premiums: The effect of light rail on residential property values in Minneapolis, Minnesota. Reg. Sci. Urban Econ. 2018, 69, 1–10. [Google Scholar] [CrossRef]
- Grube-Cavers, A.; Patterson, Z. Urban rapid rail transit and gentrification in Canadian urban centres: A survival analysis approach. Urban Stud. 2015, 52, 178–194. [Google Scholar] [CrossRef]
- Werner, C.M.; Brown, B.B.; Tribby, C.P.; Tharp, D.; Flick, K.; Miller, H.J.; Smith, K.R.; Jensen, W. Evaluating the attractiveness of a new light rail extension: Testing simple change and displacement change hypotheses. Transp. Policy 2016, 45, 15–23. [Google Scholar] [CrossRef] [PubMed] [Green Version]
- Downs, A. Smart Growth: Why We Discuss It more than We Do It. J. Am. Plan. Assoc. 2005, 71, 367–378. [Google Scholar] [CrossRef]
- Renne, J.L.; Ewing, R. Transit-Oriented Development: An Examination of America’s Transit Precincts in 2000 & 2010; UNOTI Publications: New Orleans, LA, USA, 2013. [Google Scholar]
- Nasri, A.; Zhang, L. The analysis of transit-oriented development (TOD) in Washington, D.C. and Baltimore metropolitan areas. Transp. Policy 2014, 32, 172–179. [Google Scholar] [CrossRef]
- U.S. Department of Transportation. Transit Oriented Development (TOD) Lessons Learned: FTA’s Listening Sessions; Office of Policy and Performance Management Federal Transit Administration: Washington, DC, USA, 2005. [Google Scholar]
- Holmes, J.; Van Hemert, J. Transit Oriented Development Research Monologue Series: Transit Oriented Development; Rocky Mountain Land Use Institute: Denver, CO, USA, 2008. [Google Scholar]
- Carlton, I. Transit Planners’ Transit-Oriented Development-Related Practices and Theories. J. Plan. Educ. Res. 2019, 39, 508–519. [Google Scholar] [CrossRef]
- Harrison, P.; Rubin, M.; Appelbaum, A.; Dittgen, R. Corridors of Freedom: Analyzing Johannesburg’s Ambitious Inclusionary Transit-Oriented Development. J. Plan. Educ. Res. 2019, 39, 456–468. [Google Scholar] [CrossRef]
- Paulhiac Scherrer, F. Assessing Transit-Oriented Development Implementation in Canadian Cities: An Urban Project Approach. J. Plan. Educ. Res. 2019, 39, 469–481. [Google Scholar] [CrossRef]
- Chatman, D.G.; Xu, R.; Park, J.; Spevack, A. Does Transit-Oriented Gentrification Increase Driving? J. Plan. Educ. Res. 2019, 39, 482–495. [Google Scholar] [CrossRef]
- Haller, C.R. Sustainability and Sustainable Development. Top. Environ. Rhetor. 2018, 9255, 213–233. [Google Scholar] [CrossRef]
- Cervero, R.; Arrington, G.B. Effects of TOD on Housing, Parking, and Travel; The National Academies Press: Washington, DC, USA, 2016; ISBN 9780309117487. [Google Scholar]
- Baker, D.M.; Kim, S. What remains? The influence of light rail transit on discretionary income. J. Transp. Geogr. 2020, 85, 13. [Google Scholar] [CrossRef]
- Gandelman, N.; Serebrisky, T.; Suárez-Alemán, A. Household spending on transport in Latin America and the Caribbean: A dimension of transport affordability in the region. J. Transp. Geogr. 2019, 79, 102482. [Google Scholar] [CrossRef]
- Farris, J.T. The barriers to using urban infill development to achieve smart growth. Hous. Policy Debate 2001, 12, 1–30. [Google Scholar] [CrossRef]
- Hess, D.; Lombardi, P. Policy Support for and Barriers to Transit-Oriented Development in the Inner City: Literature Review. Transp. Res. Rec. 2004, 1887, 26–33. [Google Scholar] [CrossRef] [Green Version]
- Nasri, A.; Carrion, C.; Zhang, L.; Baghaei, B. Using propensity score matching technique to address self-selection in transit-oriented development (TOD) areas. Transportation 2018, 47, 359–371. [Google Scholar] [CrossRef]
- Cervero, R.; Murphy, S.; Goguts, N.; Tsai, Y.-H. Transit-Oriented Development in the United States: Experiences, Challenges, and Prospects; Transportation Research Board: Washington, DC, USA, 2004. [Google Scholar]
- Renne, J.L.; Tolford, T.; Hamidi, S.; Ewing, R. The Cost and Affordability Paradox of Transit-Oriented Development: A Comparison of Housing and Transportation Costs Across Transit-Oriented Development, Hybrid and Transit-Adjacent Development Station Typologies. Hous. Policy Debate 2016, 26, 819–834. [Google Scholar] [CrossRef]
- O’Guinn, T.C.; Wells, W.D. Subjective Discretionary Income. Mark. Res. 1989, 1, 32–42. [Google Scholar]
- Rossiter, J.R. Spending Power and the Subjective Discretionary Income (SDI) Scale. Adv. Consum. Res. 1995, 22, 236–241. [Google Scholar]
- Renne, J.L.; Appleyard, B. Twenty-Five Years in the Making: TOD as a New Name for an Enduring Concept. J. Plan. Educ. Res. 2019, 39, 402–408. [Google Scholar] [CrossRef] [Green Version]
- Sung, H.; Oh, J.T. Transit-oriented development in a high-density city: Identifying its association with transit ridership in Seoul, Korea. Cities 2011, 28, 70–82. [Google Scholar] [CrossRef]
- Jacobson, J.; Forsyth, A. Seven American TODs: Good practices for urban design in Transit-Oriented Development projects. J. Transp. Land Use 2008, 2, 51–88. [Google Scholar] [CrossRef] [Green Version]
- Pollack, S.; Bluestone, B.; Billingham, C. Maintaining Diversity in America’s Transit-Rich Neighborhoods: Tools for Equitable Neighborhood Change; Dukakis Center for Urban and Regional Policy: Boston, MA, USA, 2010; pp. 1–68. [Google Scholar]
- Calthorpe, P. The Next American Metropolis: Ecology, Community and the American Dream. Princeton; Princeton Architectural Press: New York, NY, USA, 1993. [Google Scholar]
- Dittmar, H.; Poticha, S. Defining Transit-Oriented Development: The New Regional Building Block; Island Press: Washington, DC, USA; Covelo, CA, USA; London, UK, 2004. [Google Scholar]
- Atkinson-Palombo, C.; Kuby, M.J. The geography of advance transit-oriented development in metropolitan Phoenix, Arizona, 2000–2007. J. Transp. Geogr. 2011, 19, 189–199. [Google Scholar] [CrossRef]
- Lipman, B.J. A Heavy Load: The Combined Housing and Transportation Burdens of Working Families; Center Hous. Policy: Washington, DC, USA, 2006. [Google Scholar]
- Mattingly, K.; Morrissey, J. Housing and transport expenditure: Socio-spatial indicators of affordability in Auckland. Cities 2014, 38, 69–83. [Google Scholar] [CrossRef]
- Venter, C. Transport expenditure and affordability: The cost of being mobile. Dev. S. Afr. 2011, 28, 121–140. [Google Scholar] [CrossRef]
- Stone, M.E. What is housing affordability? The case for the residual income approach. Hous. Policy Debate 2006, 17, 151–184. [Google Scholar] [CrossRef] [Green Version]
- Bardaka, E.; Delgado, M.S.; Florax, R.J.G.M. Causal identification of transit-induced gentrification and spatial spillover effects: The case of the Denver light rail. J. Transp. Geogr. 2018, 71, 15–31. [Google Scholar] [CrossRef]
- Bartholomew, K.; Ewing, R. Hedonic price effects of pedestrian- and transit-oriented development. J. Plan. Lit. 2011, 26, 18–34. [Google Scholar] [CrossRef]
- Dong, H. If You Build Rail Transit in Suburbs, Will Development Come? J. Am. Plan. Assoc. 2016, 82, 316–326. [Google Scholar] [CrossRef]
- Blundell, R.; Costa Dias, M. Evaluation Methods for Non-Experimental Data. Fisc. Stud. 2010, 21, 427–468. [Google Scholar] [CrossRef]
- Heckman, J.J.; Ichimura, H.; Todd, P. Matching As An Econometric Evaluation Estimator. Rev. Econ. Stud. 1998, 65, 261–294. [Google Scholar] [CrossRef]
- Jones, A.M.; Rice, N. Econometric Evaluation of Health Policies. In HEDG Health Economics and Data Group; Oxford University Press: Oxford, UK, 2009; Volume 9, pp. 1–41. [Google Scholar]
- Rosenbaum, P.R.; Rubin, D.B. The Central Role of the Propensity Score in Observational Studies for Causal Effects The central role of the propensity score in observational studies for causal effects. Biometrika 1983, 70, 41–55. [Google Scholar] [CrossRef]
- Angrist, J.D.; Pischke, J.-S. Mostly Harmless Econometrics: An Empiricist’s Companion. Quant. Financ. 2016, 16, 1009–1013. [Google Scholar] [CrossRef]
- Ho, D.E.; King, G.; Stuart, E.A.; Imai, K. MatchIt: Nonparametric Preprocessing for Parametric Causal Inference. J. Stat. Softw. 2011, 42, 1–28. [Google Scholar] [CrossRef] [Green Version]
- Wang, R.; Ye, L.; Chen, L. The impact of high-speed rail on housing prices: Evidence from China’s prefecture-level cities. Sustainability 2019, 11, 3681. [Google Scholar] [CrossRef] [Green Version]
- Levinson, D. Identifying Winners and Losers in Transportation. Transp. Res. Rec. 2002, 1812, 179–185. [Google Scholar] [CrossRef] [Green Version]
- Fan, Y.; Guthrie, A. Winners or Losers. Transp. Res. Rec. J. Transp. Res. Board 2012, 2276, 89–100. [Google Scholar] [CrossRef]
- Franklin, J.P. Role of Context in Equity Effects of Congestion Pricing. Transp. Res. Rec. J. Transp. Res. Board 2012, 29–37. [Google Scholar] [CrossRef]
- Lechner, M. Training the East German Labour Force; Springer: Heidelberg, Germany, 2012; ISBN 978-3-7908-1091-2. [Google Scholar]
- Aerts, K.; Schmidt, T. Two for the price of one?. Additionality effects of R&D subsidies: A comparison between Flanders and Germany. Res. Policy 2008, 37, 806–822. [Google Scholar] [CrossRef]
| 1 | Only LAI version 2 is based on a census block group |
| 2 | Core-based statistical area. |
| 3 | TAD, and HYBRID developments are short for Transit-Adjacent Development, and hybrid development, whose development and travel behavior do not apply to the TOD principles. |


| Household Profile | Income Ratio to the Median Household Income (MHHI) for a Given CBSA2 | Household Size | Number of Commuters |
|---|---|---|---|
| Median-Income Family | 100% of MHHI | 4 | 2 |
| Very Low-Income Individual | National poverty line | 1 | 1 |
| Working Individual | 50% of MHHI | 1 | 1 |
| Single Professional | 135% of MHHI | 1 | 1 |
| Retired Couple | 80% of MHHI | 2 | 0 |
| Single-Parent Family | 50% of MHHI | 3 | 1 |
| Moderate-Income Family | 80% of MHHI | 3 | 1 |
| Dual-Professional Family | 150% of MHHI | 4 | 2 |
| Variable | Description | Source |
|---|---|---|
| Expenditure | ||
| Discretionary Income | Household Income—Transportation Cost—Residential Cost for each type of households | LAI |
| Household Income | A household income for each type of households | LAI |
| Transportation Cost | A transportation cost for each type of households | LAI |
| Residential Cost of SP | A residential cost for each type of households | LAI |
| Neighborhood Characteristics | ||
| TOD neighborhood | 1 if a census block group is a TOD neighborhood, otherwise 0 | Renne and Ewing (2013) |
| Total population (2000) | Total population in a census block group in 2000 | Census |
| Commuting Worker (2000, %) | A percentage of commuting worker to total population | Census |
| Median year of building (2000) | Median year of the buildings built in a census block group in 2000 | Census |
| Urban or Suburban (2000) | A binary variable. 1 if a census block group is an urban area in 2000, otherwise 0. | Census |
| Poverty ratio (2000) | Population for whom poverty status is determined/total population in 2000 | Census |
| Race: White (2000, %) | A percentage of White population in a census block group in 2000 | Census |
| Urban population (2000, %) | A percentage of urban population in a census block group in 2000 | Census |
| Variable | Means of All Data | Means of Matched Data | ||
|---|---|---|---|---|
| TOD | Non-TOD | TOD | Non-TOD | |
| Total population (2000) | 1400.4 | 1397.747 | 1400.4 | 1523.573 |
| Population density (2000) | 0.002 | 0.002 | 0.002 | 0.002 |
| Race: White (2000, %) | 0.624 | 0.769 | 0.624 | 0.666 |
| Median year of building (2000) | 46.7 | 20.768 | 46.7 | 39.153 |
| Poverty ratio (2000) | 0.359 | 0.118 | 0.359 | 0.233 |
| Commuting Worker (2000, %) | 0.334 | 0.46 | 0.334 | 0.365 |
| Urban population (2000, %) | 1 | 0.968 | 1 | 1 |
| Dependent Variable: Discretionary Income | ||||||||
|---|---|---|---|---|---|---|---|---|
| Using All Areas | Using PSM-Matched Areas | |||||||
| (1) | (2) | (3) | (4) | (5) | (6) | (7) | (8) | |
| TOD neighborhood | 4041.32 *** | 4041.32 *** | 4217.62 *** | 2555.65 * | 2555.65 *** | 2815.61 *** | ||
| (1240.43) | (334.85) | (947.30) | (1336.38) | (252.50) | (715.53) | |||
| Very Low-Income Individual | −30,529.40 *** | −30,529.40 *** | −30,513.40 *** | −30,625.70 *** | −30,625.70 *** | −30,517.80 *** | ||
| (209.14) | (207.60) | (210.25) | (389.51) | (376.41) | (413.11) | |||
| Working Individual | −17,176.70 *** | −17,176.70 *** | −17,154.70 *** | −17,389.10 *** | −17,389.10 *** | −17,257.60 *** | ||
| (209.14) | (207.60) | (210.25) | (389.51) | (376.41) | (413.11) | |||
| Single Professional | 22,954.00 *** | 22,954.00 *** | 22,950.20 *** | 23,303.40 *** | 23,303.40 *** | 23,343.90 *** | ||
| (209.14) | (207.60) | (210.25) | (389.51) | (376.41) | (413.11) | |||
| Retired Couple | −3891.48 *** | −3891.48 *** | −3887.30 *** | −4008.52 *** | −4008.52 *** | −3998.80 *** | ||
| (209.14) | (207.60) | (210.25) | (389.51) | (376.41) | (413.11) | |||
| Single-Parent Family | −20,583.00 *** | −20,583.00 *** | −20,567.80 *** | −20,840.50 *** | −20,840.50 *** | −20,772.10 *** | ||
| (209.14) | (207.60) | (210.25) | (389.51) | (376.41) | (413.11) | |||
| Moderate-Income Family | −7481.73 *** | −7481.73 *** | −7476.35 *** | −7543.22 *** | −7,543.22 *** | −7512.90 *** | ||
| (209.14) | (207.60) | (210.25) | (389.51) | (376.41) | (413.11) | |||
| Dual-Professional Family | 23,643.70 *** | 23,643.70 *** | 23,619.50 *** | 24,396.50 *** | 24,396.50 *** | 24,354.70 *** | ||
| (209.14) | (207.60) | (210.25) | (389.51) | (376.41) | (413.11) | |||
| Very Low-Income Individual TOD | −651.60 | −647.17 | ||||||
| (1339.68) | (1011.92) | |||||||
| Working Individual TOD | −891.94 | −789.05 | ||||||
| (1339.68) | (1011.92) | |||||||
| Single Professional TOD | 150.40 | −243.28 | ||||||
| (1339.68) | (1011.92) | |||||||
| Retired Couple TOD | −169.79 | −58.29 | ||||||
| (1339.68) | (1011.92) | |||||||
| Single-Parent Family TOD | −614.95 | −410.70 | ||||||
| (1339.68) | (1011.92) | |||||||
| Moderate-Income Family TOD | −218.50 | −181.96 | ||||||
| (1339.68) | (1011.92) | |||||||
| Dual-Professional Family TOD | 986.00 | 250.79 | ||||||
| (1339.68) | (1011.92) | |||||||
| Constant | 21,353.30 *** | 25,586.00 *** | 25,486.40 *** | 25,482.10 *** | 22,839.00 *** | 27,353.40 *** | 26,927.40 *** | 26,884.10 *** |
| (194.67) | (147.88) | (147.03) | (148.67) | (545.58) | (275.43) | (269.47) | (292.12) | |
| Observations | 9744 | 9744 | 9744 | 9744 | 1440 | 1440 | 1440 | 1440 |
| R2 | 0.001 | 0.93 | 0.93 | 0.93 | 0.003 | 0.96 | 0.96 | 0.96 |
| Adjusted R2 | 0.001 | 0.93 | 0.93 | 0.93 | 0.002 | 0.96 | 0.96 | 0.96 |
| Residual SE | 18,978.60 (df = 9742) | 5161.06 (df = 9736) | 5123.14 (df = 9735) | 5124.27 (df = 9728) | 18,899.30 (df = 1438) | 3695.25 (df = 1432) | 3570.94 (df = 1431) | 3577.67 (df = 1424) |
| F Statistic | 10.61 *** (df = 1; 9742) | 17,448.70 *** (df = 7; 9736) | 15,512.70 *** (df = 8; 9735) | 8269.97 *** (df = 15; 9728) | 3.66 * (df = 1; 1438) | 5182.68 *** (df = 7; 1432) | 4868.89 *** (df = 8; 1431) | 2587.08 *** (df = 15; 1424) |
| Household Profile | Income Ratio to the Median Household Income (MHHI) for a Given CBSA | The Rank of Discretionary Income Based on Model (6) |
|---|---|---|
| Dual-Professional Family | 150% of MHHI | 1 |
| Single Professional | 135% of MHHI | 2 |
| Median-Income Family | MHHI | 3 |
| Retired Couple | 80% of MHHI | 4 |
| Moderate-Income Family | 80% of MHHI | 5 |
| Working Individual | 50% of MHHI | 6 |
| Single-Parent Family | 50% of MHHI | 7 |
| Very Low-Income Individual | National poverty line | 8 |
Publisher’s Note: MDPI stays neutral with regard to jurisdictional claims in published maps and institutional affiliations |
© 2020 by the author. Licensee MDPI, Basel, Switzerland. This article is an open access article distributed under the terms and conditions of the Creative Commons Attribution (CC BY) license (http://creativecommons.org/licenses/by/4.0/).
Share and Cite
Kim, S. The Social Justice Impact of the Transit-Oriented Development. Societies 2021, 11, 1. https://doi.org/10.3390/soc11010001
Kim S. The Social Justice Impact of the Transit-Oriented Development. Societies. 2021; 11(1):1. https://doi.org/10.3390/soc11010001
Chicago/Turabian StyleKim, Seunghoon. 2021. "The Social Justice Impact of the Transit-Oriented Development" Societies 11, no. 1: 1. https://doi.org/10.3390/soc11010001
APA StyleKim, S. (2021). The Social Justice Impact of the Transit-Oriented Development. Societies, 11(1), 1. https://doi.org/10.3390/soc11010001