Abstract
Flexibility plays an important role in both daily life and performance in various sports. This study evaluated the intrasession and the intersession reliability of flexibility measurements, examining the effects of sport, age, and sex. The sample included 80 wrestling athletes (40 boys: 20 children/20 adolescents; 40 girls: 20 children/20 adolescents), 80 taekwondo athletes (40 boys: 20 children/20 adolescents; 40 girls: 20 children/20 adolescents), and 80 non-athletes (40 boys: 20 children/20 adolescents; 40 girls: 20 children/20 adolescents). The participants performed two assessment sessions, which included two tests (back scratch/sit and reach). The results showed high intrasession and intersession reliability for boys and girls among wrestling and taekwondo athletes (children: ICC = 0.988–0.998, SEM% = 2.31–7.44; adolescents: ICC = 0.993–0.999, SEM% = 1.13–5.19). Additionally, the results demonstrated good/high intrasession and intersession reliability for boys and girls among non-athletes (children: ICC = 0.992–0.997, SEM% = 3.40–9.98; adolescents: ICC = 0.996–0.998, SEM% = 2.81–8.94). The SEM% values were slightly higher in non-athletes vs. athletes (wrestling, taekwondo), as well as in children vs. adolescents, indicating that athletes and adolescents present better reliability than non-athletes and children, respectively. No differences in reliability were observed between boys and girls. In conclusion, the sit and reach and the back scratch are reliable tests in assessing flexibility during the developmental ages. It seems that age and engagement in sports affect the reliability of measurements.
1. Introduction
Flexibility is one of the most important components of physical fitness and plays an important role in both athletic performance and everyday life [1,2,3]. An important factor that influences flexibility is participation in different sports and physical activities [1,3]. Wrestling [4,5] and taekwondo [6,7] are two sports where flexibility plays a significant role in the effective execution of various skills that are important for performance enhancement. However, due to their intense nature, both sports show a high incidence of injury, especially at the knee and/or shoulder joints [8,9,10,11,12,13]. Furthermore, low levels of flexibility, often combined with reduced lengths of the hamstring muscles, which are frequently observed in athletes of combat sports and martial arts (e.g., wrestling and taekwondo), can cause various musculoskeletal problems, such as low back pain [14], dysfunction of the sacroiliac joint [15], hamstring injuries [16], patellofemoral pain syndrome [17], and patellar tendinopathy [18]. Additionally, the upper limbs (especially the shoulders) constitute a region of the body that also shows a significant frequency of injuries in both wrestling and taekwondo sports (with injury rates up to 25%) [12,13]. Taking all the above into account, the reliable evaluation of lower- and upper-body flexibility may be used for physical fitness monitoring and training planning, as well as for injury prevention, in young wrestling and taekwondo athletes.
In the scientific literature, there are several tests (field or laboratory) that are used to evaluate flexibility in different muscle groups of the lower and upper body [19,20]. In the present study, we selected the sit and reach test and the back scratch test (also called the zipper test or shoulder stretch test), which are widely used in developmental years (with easily accessible indicative values/norms in different age groups), convenient, simple in execution for various populations, and cost-effective (with portable equipment). Although the above tests are widely used in the scientific literature to assess flexibility in children and/or adolescent non-athletes [21,22,23,24,25,26], as well as athletes of different sports [6,7,27,28,29,30,31,32], there is limited information regarding their intrasession (among trials on the same day) and intersession (between two different days, i.e., test–retest) reliability, especially in young athletic populations. In more detail, previous studies have examined the reliability of the sit and reach test in untrained children and/or adolescents, reporting moderate to high reliability [24,25], while, in athletes, this information is more limited [27,28]. Regarding the reliability of the back scratch test, there is adequate information in healthy or illness-affected older populations [33,34,35,36], whereas, in youths, there is limited information about its reliability [26,28]. Specifically, one study in adolescent tennis players [28] and one study in untrained children and adolescents [26] showed high reliability (ICC = 0.88–0.99) for the shoulder stretch test.
To the best of our knowledge, no previous study has examined and compared the reliability of flexibility tests between young wrestlers, taekwondo athletes, and non-athletes, investigating simultaneously the effects of the sport activity, age, and sex. The reliability, however, of measurements could be influenced by different factors, such as the training status, physical fitness level, age, etc. [37,38,39,40]. Differences in mood, motivation, learning effects, ability to focus on the task, and performance levels, as well as biomechanical factors, may account for these differences in reliability [38,39]. For example, a previous study [41] in young soccer players (11–19 years old) showed different Cronbach’s alpha values among age groups, ranging from 0.72 for the sub-11 age group to 0.94 for the sub-13 age group and 0.93 for the sub-18 age group, during the modified Thomas flexibility test. It could be hypothesized that the neural maturation from childhood to adolescence (leading to changes in the ability of individuals to focus on the task) [42] could impact the overall performance level, as well as the reliability of measurements of neuromuscular performance parameters. Regarding the effect of sex on reliability, one previous study [43] that was performed in adolescents (boys and girls) and used the back-saver sit and reach test demonstrated a borderline significant sex difference in systematic bias, where girls showed slightly greater systematic bias than boys.
Other factors that could influence the reliability of measurements are the number of testing trials performed (one trial, three trials, etc.) and the different methods (average or best value) used to determine the results of measurements. Although, in flexibility tests, there is inadequate information regarding the reliability of measurements using different numbers of trials, in other physical fitness parameters (e.g., handgrip strength), there is a debate on this topic [39,44,45]. Some previous studies have reported that the mean of three trials has higher test–retest reliability than either a single trial or the best of three trials in healthy individuals [39,44], as well as in individuals with intellectual disabilities [45]. At the same time, other studies have observed that a single trial and the mean or the best of two or three trials are equally reliable in determining maximal handgrip strength [46,47,48].
Therefore, the main objective of this study was to evaluate the intrasession and intersession reliability (using various absolute and relative reliability indices) of flexibility measurements (sit and reach test, back scratch test) during the developmental years, examining and comparing the effects of the sport activity (wrestling, taekwondo, no participation in organized physical activity), age (children, adolescents), and sex (boys, girls) on the reliability values. We also examined whether the number of testing trials and the method used for the determination of performance in flexibility tests (single trial, best of three trials, or average of three trials) affected their reliability. We hypothesized that the two flexibility tests (sit and reach test back scratch test) would yield reliable measurements during the developmental years. We also hypothesized that athletes would present slightly better reliability than non-athletes, and adolescents would present slightly better reliability than children. Finally, we hypothesized that a single trial would present slightly lower test–retest reliability than the best and the average of three testing trials.
2. Materials and Methods
2.1. Participants
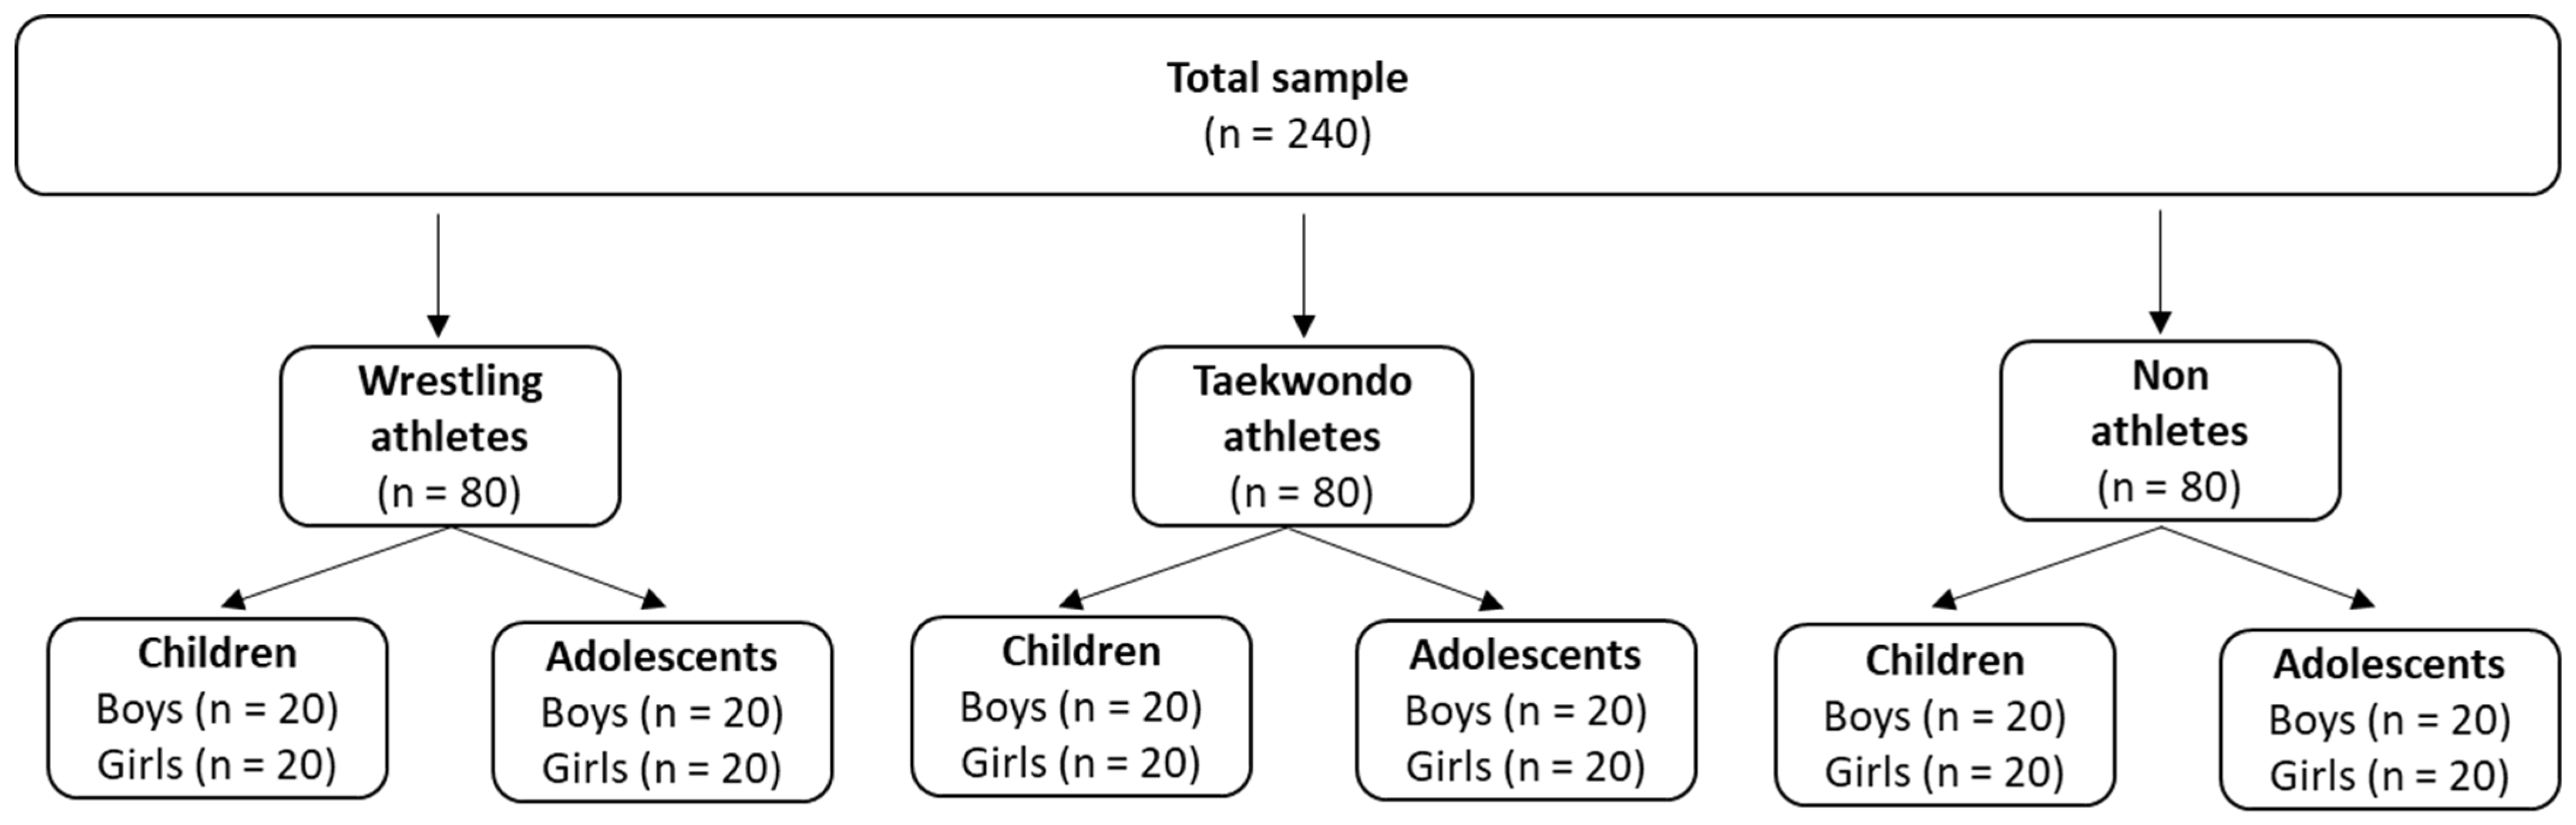
Two hundred and forty (240) children (8–10 years old) and adolescents (13–15 years old) voluntarily took part in the current research, where 80 were wrestling athletes, 80 were taekwondo athletes, and 80 were non-athletes (Figure 1). The ages and the anthropometric and training characteristics of the participants (per sport and age group) are presented in Table 1. Wrestling and taekwondo athletes had at least one year of training experience in wrestling or taekwondo and a training frequency of at least 3 times per week, while non-athletes did not systematically engage in any form of exercise. All participants were healthy, with no injuries in the upper and lower limbs for at least 6 months before the commencement of the study. The children’s and adolescents’ parents were informed about the experimental procedures and signed an informed consent form. The current research was conducted according to the Declaration of Helsinki and approved by the Ethics Committee of the University of Thessaly.
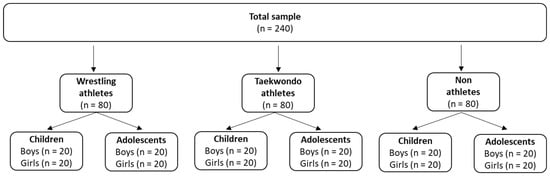
Figure 1.
Sample of the study.

Table 1.
Age and anthropometric and training characteristics of the participants per sport activity, age, and sex (mean ± standard deviation).
2.2. Measures
2.2.1. Anthropometric Characteristics
Body mass was assessed using a calibrated physician’s scale (Seca model 755, Seca, Hamburg, Germany), and body height was assessed using a telescopic height rod (Seca model 220, Seca, Hamburg, Germany), according to the recommendations of the American College of Sports Medicine [20].
2.2.2. Flexibility Tests
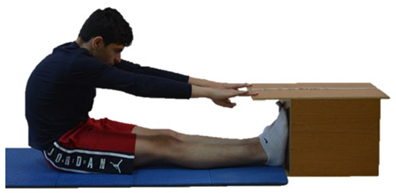
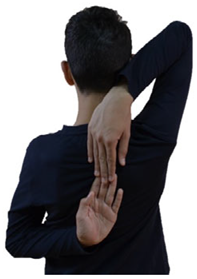
Flexibility was assessed using two widely used and recognized tests in the developmental years: (a) the sit and reach test and (b) the back scratch test (Table 2).
Table 2.
Flexibility tests.
2.3. Design and Procedures
All measurements were performed in the Training and Physical Conditioning Lab of the Department of Physical Education and Sport Sciences of the University of Thessaly by the same investigator. The main investigator of the present research was a physical education teacher and scientific team member of the Training and Physical Conditioning Lab of the DPESS of the University of Thessaly, with extensive experience in the testing and evaluation of physical performance (flexibility, strength, coordination abilities, aerobic capacity). However, it should be mentioned that, before the start of the study, the investigator performed numerous preliminary pilot measurements to familiarize themselves with the two flexibility tests used in the present study (sit and reach test, back scratch test). Furthermore, since the environmental conditions can significantly affect the results of flexibility tests, to ensure reliable and accurate test results, we maintained stable environmental conditions during all measurements (adequate lighting, temperature of 23–25 °C, humidity of 50–55%, proper ventilation, low noise levels), according to the guidelines of the American College of Sports Medicine [20]. The participants visited the laboratory three times. During the first visit, the participants were informed of and familiarized with the flexibility tests. The investigator gave standardized verbal instructions regarding the technique of each test and a visual demonstration of each test using printed photos (such as those presented in Table 2) to all participants.
Furthermore, during the first visit, basic anthropometric characteristics (body height and body mass) were assessed and the hand preference was determined. During the second and third visits, the participants performed the flexibility tests (sit and reach test, back scratch test). Both test and retest sessions were performed at the same time of the day (10:00 a.m.–12:00 p.m.) to prevent potential confounding effects of daily biorhythms. There is evidence that the time interval between test and retest sessions could affect the reliability [19]. To assess test–retest reliability in physical fitness, a time interval of 2 to 7 days is generally recommended by several investigators. This time interval balances the potential for learning/recall or fatigue effects (i.e., the first test may influence the second if the interval is too short) and the possibility of genuine changes in flexibility (if the interval is too long). Taking all the above into consideration, we used a time interval of 72 h between the test and retest. Participants were asked to follow their normal diets for two days before the study, to abstain from intense exercise activity for 24 h before the study, and to have sufficient rest the night before the study. During both the test and retest sessions, before the initiation of the main testing protocol, the participants performed a standardized 5 min warm-up protocol. During the warm-up protocol, the participants performed a 1 min static run of moderate intensity at around 60–65% of the age-predicted maximum heart rate, which was controlled using a heart rate monitor (Polar Electro, Kempele, Finland); 2 min of static and dynamic stretching of the muscles involved in the flexibility tests; and 2 preliminary submaximal trials for each test.
2.4. Statistical Analysis
The IBM SPSS Statistics v.28 software (IBM Corporation, Armonk, NY, USA) was used to analyze the data. Before the start of the study, we estimated, using the formula of Walter et al. [49], that a sample size of 20 participants per age group would be adequate for this study (power: 80%; minimum acceptable reliability ICC: 0.7; expected reliability ICC: 0.90). In the present study, the intrasession reliability (reliability among trials on the same day) and intersession reliability (reliability between the first and second testing occasions—test–retest—using different methods for the determination of flexibility, such as a single trial or the mean or the best of three testing trials) were examined, using various relative (intraclass correlation coefficient (ICC) with 95% CI) and absolute (standard error of measurement (SEM), SEM%, 95% limit of agreement (95% LOA)) reliability indices. The standard error of measurement (SEM) was calculated using the following equation: SEM = SD × (1 − ICC), where SD = the sample standard deviation and ICC = the calculated intraclass correlation coefficient [50]. The SEM was divided by the mean of the two measurements and multiplied by 100 to give a percentage value (SEM%) [39]. The LOA was calculated using the following equation: LOA = intertrial mean difference ± 1.96 SD of the intertrial difference [50]. For the ICC values, (i) <0.5 indicated poor reliability, (ii) between 0.5 and 0.75 indicated moderate reliability, (iii) between 0.75 and 0.90 indicated good reliability, and (iv) above 0.9 indicated high reliability [51]. Additionally, for the SEM values, (i) <5% indicated high reliability, (ii) >5% and <10% denoted good reliability, (iii) equal to 10% indicated moderate reliability, and (iv) >10% indicated low reliability.
A repeated-measures analysis of variance (one-way ANOVA) was used to evaluate possible differences in the flexibility tests among the three testing trials on the same day. Paired t-tests were used to determine possible differences in flexibility measurements between tests and retests. A three-way ANOVA was used to examine the effects of sport, age, and sex on anthropometric and training characteristics. Sidak’s multiple comparisons were used to locate significantly different means. The level of significance was set at p < 0.05.
3. Results
3.1. Intrasession Reliability
3.1.1. Wrestling Athletes
Boys
The repeated-measures analyses of variance showed non-significant differences among the three testing trials for the sit and reach test and back scratch test in children (p = 0.14–0.36) and adolescents (p = 0.22–0.59). The systematic bias ranged from −0.58 to +0.03 cm in children and from −0.30 to +0.15 cm in adolescent boys. The relative and absolute reliability among trials was high for children in the sit and reach test (ICC = 0.997; SEM% = 2.42) and back scratch test (ICC = 0.998; SEM% = 4.62–5.66). Furthermore, adolescents showed high relative reliability and absolute reliability in the sit and reach test (ICC = 0.998; SEM% = 1.67) and back scratch test (ICC = 0.998; SEM% = 2.57–4.10). Regarding the comparison among age groups, children demonstrated higher SEM% values (2.42–5.66%) than adolescents (1.67–4.10%) in both tests (with greater differences observed in the back scratch test), indicating that adolescents presented better reliability than children. The performance in the sit and reach and back scratch tests per trial (mean ± standard deviation), as well as the relative (ICC with 95% CI) and absolute (SEM, SEM%) reliability indices, are presented in Table 3.
Table 3.
Performance in flexibility tests per trial (mean ± standard deviation), as well as relative and absolute reliability indices, in boy wrestling athletes per age group.
Girls
The repeated-measures analyses of variance showed non-significant differences among the three trials for the sit and reach test and back scratch test in children (p = 0.15–0.94) and adolescent girls among wrestling athletes (p = 0.13–0.40). The systematic bias ranged from −0.14 to +0.25 cm in children and from −0.20 to +0.71 cm in adolescents. The relative and absolute reliability among trials was high for children in the sit and reach test (ICC = 0.988; SEM% = 2.71) and back scratch test (ICC = 0.990–0.993; SEM% = 4.66–6.73). Furthermore, adolescent girls showed high relative reliability and absolute reliability in the sit and reach test (ICC = 0.995; SEM% = 1.90) and back scratch test (ICC = 0.993–0.995; SEM% = 3.56–4.60). Concerning the comparison among age groups, children demonstrated higher SEM% values (2.71–6.73%) than adolescent girls (1.90–4.60%) in both tests (with greater differences observed in the back scratch test), indicating that adolescents presented better reliability than children. The performance in the flexibility tests per trial (mean ± standard deviation), as well as the relative (ICC with 95% CI) and absolute (SEM, SEM%) reliability indices, are presented in Table 4.
Table 4.
Performance in flexibility tests per trial (mean ± standard deviation), as well as relative and absolute reliability indices, in girl wrestling athletes per age group.
3.1.2. Taekwondo Athletes
Boys
The repeated-measures analyses of variance showed non-significant differences among the three testing trials for the sit and reach test and back scratch test in children (p = 0.20–0.58) and adolescent (p = 0.13–0.25) taekwondo athletes. The systematic bias ranged from −0.67 to +0.33 cm in children and from −0.38 to +0.37 cm in adolescent boys. The relative and absolute reliability among trials was high for children in the sit and reach test (ICC = 0.998; SEM% = 2.31) and back scratch test (ICC = 0.996–0.998; SEM% = 5.90–6.91). Additionally, adolescents showed high relative reliability and absolute reliability in the sit and reach test (ICC = 0.998; SEM% = 1.99) and back scratch test (ICC = 0.998; SEM% = 3.77–4.98). Regarding the comparison among age groups, children demonstrated higher SEM% values (2.31–6.91%) than adolescents (1.99–4.98%) in both tests (with greater differences observed in the back scratch test), indicating that adolescents presented slightly better reliability than children. The performance in the sit and reach and back scratch tests per trial (mean ± standard deviation), as well as the relative (ICC with 95% CI) and absolute (SEM, SEM%) reliability indices, for boy taekwondo athletes are presented in Table 5.
Table 5.
Performance in flexibility tests per trial (mean ± standard deviation), as well as relative and absolute reliability indices, in boy taekwondo athletes per age group.
Girls
The repeated-measures analyses of variance showed non-significant differences among the three trials in the sit and reach test and back scratch test in children (p = 0.11–0.54) and adolescent girl taekwondo athletes (p = 0.12–0.49). The systematic bias ranged from −0.14 to 0.20 cm in children and from −0.30 to +0.24 cm in adolescents. The relative and absolute reliability among trials was high for children in the sit and reach test (ICC = 0.996; SEM% = 1.77) and back scratch test (ICC = 0.997; SEM% = 4.99–7.44). Moreover, adolescent girls showed high relative reliability and absolute reliability in the sit and reach test (ICC = 0.998; SEM% = 1.13) and back scratch test (ICC = 0.996–0.998; SEM% = 3.82–5.19). Concerning the comparison among age groups, children demonstrated higher SEM% values (1.77–7.44%) than adolescent girls (1.13–5.19%) in both tests (with greater differences observed in the back scratch test), indicating that adolescents presented better reliability than children. The performance in the flexibility tests per trial (mean ± standard deviation), as well as the relative (ICC with 95% CI) and absolute (SEM, SEM%) reliability indices, in girl taekwondo athletes are presented in Table 6.
Table 6.
Performance in flexibility tests per trial (mean ± standard deviation), as well as relative and absolute reliability indices, in girl taekwondo athletes per age group.
3.1.3. Non-Athletes
Boys
The repeated-measures analyses of variance showed non-significant differences among the three testing trials in the sit and reach test and back scratch test in children (p = 0.12–0.18) and adolescent (p = 0.14–0.20) non-athletes. The systematic bias ranged from −0.45 to +0.42 cm in children and from −0.36 to +0.27 cm in adolescent boys. The relative and absolute reliability among trials was good to high for children in the sit and reach test (ICC = 0.994; SEM% = 4.55) and back scratch test (ICC = 0.992–0.997; SEM% = 8.94–9.76). Furthermore, adolescents showed good to high relative reliability and absolute reliability in the sit and reach test (ICC = 0.997; SEM% = 2.92) and back scratch test (ICC = 0.996–0.998; SEM% = 4.73–8.94). Regarding the comparison among age groups, children demonstrated higher SEM% values (4.55–9.76%) than adolescents (2.92–8.94%) in both tests, indicating that adolescents presented slightly better reliability than children. The performance in the sit and reach and back scratch tests per trial (mean ± standard deviation), as well as the relative (ICC with 95% CI) and absolute (SEM, SEM%) reliability indices, for boy non-athletes are presented in Table 7.
Table 7.
Performance in flexibility tests per trial (mean ± standard deviation), as well as relative and absolute reliability indices, in boy non-athletes per age group.
Girls
The repeated-measures analyses of variance showed non-significant differences among the three testing trials in the sit and reach test and back scratch test in children (p = 0.10–0.35) and adolescent (p = 0.15–0.40) non-athletes. The systematic bias ranged from −0.24 to +0.20 cm in children and from −0.25 to +0.24 cm in adolescent girls. The relative and absolute reliability among trials was good to high for children in the sit and reach test (ICC = 0.996; SEM% = 3.41) and back scratch test (ICC = 0.998; SEM% = 9.79–9.98). Moreover, adolescents showed good to high relative reliability and absolute reliability in the sit and reach test (ICC = 0.997; SEM% = 2.81) and back scratch test (ICC = 0.997–0.998; SEM% = 7.18–9.08). Regarding the comparison among age groups, children demonstrated higher SEM% values (3.41–9.98%) than adolescents (2.81–9.08%) in both tests, indicating that adolescents presented slightly better reliability than children. The performance in the sit and reach and back scratch tests per trial (mean ± standard deviation), as well as the relative (ICC with 95% CI) and absolute (SEM, SEM%) reliability indices, for girl non-athletes are presented in Table 8.
Table 8.
Performance in flexibility tests per trial (mean ± standard deviation), as well as relative and absolute reliability indices, in girl non-athletes per age group.
3.2. Intersession Reliability
3.2.1. Wrestling Athletes
Boys
Single trial. The test and retest sit and reach and back scratch values (mean and SD), as well as the relative and absolute reliability indices (ICC, SEM, SEM%, 95% LOA), for boy wrestling athletes (per age group) are presented in Table 9. The paired t-tests demonstrated non-significant differences between test and retest values in the sit and reach test and back scratch test in children (p = 0.16–0.45) and adolescents (p = 0.20–0.66). The systematic bias ranged from −0.07 to +0.52 cm in children and from −0.20 to +0.28 cm in adolescent boys. The relative and absolute reliability values between tests and retests were high for children in the sit and reach test (ICC = 0.997; SEM% = 2.33) and back scratch test (ICC = 0.998; SEM% = 4.34–5.61). Moreover, adolescents showed high relative reliability and absolute reliability in the sit and reach test (ICC = 0.998; SEM% = 1.64) and back scratch test (ICC = 0.998; SEM% = 2.67–4.27). Concerning the comparison among age groups, children demonstrated higher SEM% values (2.33–5.61%) than adolescents (1.64–4.27%) in both tests, indicating that adolescents presented better reliability than children.
Table 9.
Test–retest values (mean ± SD), as well as absolute and relative reliability indices, in boy wrestling athletes (per age group).
Best or mean of three testing trials. The test and retest sit and reach and back scratch values (mean and SD), as well as the relative and absolute reliability indices (ICC, SEM, SEM%, 95% LOA), for boy wrestling athletes (per age group) are presented in Table 9. The paired t-tests demonstrated non-significant differences between the test and retest values in the sit and reach test and back scratch test in children (p = 0.18–0.55) and adolescents (p = 0.30–0.70). The systematic bias ranged from −0.05 to +0.50 cm in children and from −0.20 to +0.28 cm in adolescent boys. The relative and absolute reliability values between tests and retests were high for children in the sit and reach test (ICC = 0.997; SEM% = 2.32–2.37) and back scratch test (ICC = 0.998; SEM% = 2.33–5.60). Moreover, adolescents showed high relative reliability and absolute reliability in the sit and reach test (ICC = 0.998; SEM% = 1.63–1.66) and back scratch test (ICC = 0.998–0.999; SEM% = 2.60–3.97). Regarding the comparison among age groups, children demonstrated higher SEM% values (2.32–5.60%) than adolescents (1.63–3.97%) in both tests, indicating that adolescents presented better reliability than children.
Girls
Single trial. The test and retest sit and reach and back scratch values (mean and SD), as well as the relative and absolute reliability indices (ICC, SEM, SEM%, 95% LOA), for girl wrestling athletes (per age group) are presented in Table 10. The paired t-tests demonstrated non-significant differences between the test and retest values in the sit and reach test and back scratch test in children (p = 0.15–0.36) and adolescents (p = 0.21–0.40). The systematic bias ranged from −0.4 to +0.9 cm in children and from −0.19 to +0.4 cm in adolescent girls. The relative and absolute reliability values between tests and retests were high for children in the sit and reach test (ICC = 0.989; SEM% = 2.56) and back scratch test (ICC = 0.990–0.994; SEM% = 4.40–6.25). Moreover, adolescents showed high relative reliability and absolute reliability in the sit and reach test (ICC = 0.995; SEM% = 1.79) and back scratch test (ICC = 0.994–0.996; SEM% = 3.31–4.32). Regarding the comparison among age groups, children demonstrated higher SEM% values (2.56–6.25%) than adolescents (1.79–4.32%) in both tests, indicating that adolescents presented better reliability than children.
Table 10.
Test–retest values (mean ± SD), as well as absolute and relative reliability indices, in girl wrestling athletes (per age group).
Best or mean of three testing trials. The test and retest sit and reach and back scratch values (mean and SD), as well as the relative and absolute reliability indices (ICC, SEM, SEM%, 95% LOA), for girl wrestling athletes (per age group) are presented in Table 10. The paired t-tests demonstrated non-significant differences between the test and retest values in the sit and reach test and back scratch test in children (p = 0.23–0.42) and adolescents (p = 0.35–0.75). The systematic bias ranged from −0.15 to +0.69 cm in children and from −0.30 to +0.36 cm in adolescent girls. The relative and absolute reliability values between tests and retests were high for children in the sit and reach test (ICC = 0.990; SEM% = 2.42–2.43) and back scratch test (ICC = 0.991–0.994; SEM% = 4.26–6.48). Moreover, adolescents showed high relative reliability and absolute reliability in the sit and reach test (ICC = 0.995–0.996; SEM% = 1.73–1.75) and back scratch test (ICC = 0.994–0.996; SEM% = 3.28–4.20). Regarding the comparison among age groups, children demonstrated higher SEM% values (2.42–6.48%) than adolescents (1.73–4.20%) in both tests, indicating that adolescents presented better reliability than children.
3.2.2. Taekwondo
Boys
Single trial. The test and retest sit and reach and back scratch values (mean and SD), as well as the relative and absolute reliability indices (ICC, SEM, SEM%, 95% LOA), for boy taekwondo athletes (per age group) are presented in Table 11. The paired t-tests demonstrated non-significant differences between the test and retest values in the sit and reach test and back scratch test in children (p = 0.22–0.36) and adolescents (p = 0.36–0.55). The systematic bias ranged from −0.06 to +0.53 cm in children and from −0.45 to +0.24 cm in adolescent boys. The relative and absolute reliability values between tests and retests were high for children in the sit and reach test (ICC = 0.997; SEM% = 2.67) and back scratch test (ICC = 0.997–0.998; SEM% = 4.38–6.26). Moreover, adolescents showed high relative reliability and absolute reliability in the sit and reach test (ICC = 0.998; SEM% = 1.92) and back scratch test (ICC = 0.998; SEM% = 3.69–4.62). Regarding the comparison among age groups, children demonstrated higher SEM% values (2.67–6.26%) than adolescents (1.92–4.62%) in both tests, indicating that adolescents presented better reliability than children.
Table 11.
Test–retest values (mean ± SD), as well as absolute and relative reliability indices, in boy taekwondo athletes (per age group).
Best or mean of three testing trials. The test and retest sit and reach and back scratch values (mean and SD), as well as the relative and absolute reliability indices (ICC, SEM, SEM%, 95% LOA), for boy taekwondo athletes (per age group) are presented in Table 11. The paired t-tests demonstrated non-significant differences between the test and retest values in the sit and reach test and back scratch test in children (p = 0.32–0.57) and adolescents (p = 0.51–0.73). The systematic bias ranged from −0.06 to +0.44 cm in children and from −0.10 to +0.11 cm in adolescent boys. The relative and absolute reliability values between tests and retests were high for children in the sit and reach test (ICC = 0.997; SEM% = 2.67–2.82) and back scratch test (ICC = 0.996–0.998; SEM% = 4.41–6.55). Moreover, adolescents showed high relative reliability and absolute reliability in the sit and reach test (ICC = 0.998; SEM% = 1.87–1.97) and back scratch test (ICC = 0.998; SEM% = 3.54–4.98). Regarding the comparison among age groups, children demonstrated higher SEM% values (2.67–6.55%) than adolescents (1.87–4.98%) in both tests, indicating that adolescents presented better reliability than children.
Girls
Single trial. The test and retest sit and reach and back scratch values (mean and SD), as well as the relative and absolute reliability indices (ICC, SEM, SEM%, 95% LOA), for girl taekwondo athletes (per age group) are presented in Table 12. The paired t-tests demonstrated non-significant differences between the test and retest values in the sit and reach test and back scratch test in children (p = 0.23–0.43) and adolescents (p = 0.39–0.58). The systematic bias ranged from −0.24 to +0.15 cm in children and from −0.05 to +0.37 cm in adolescent girls. The relative and absolute reliability values between tests and retests were high for children in the sit and reach test (ICC = 0.996; SEM% = 1.83) and back scratch test (ICC = 0.997; SEM% = 4.42–6.72). Moreover, adolescents showed high relative reliability and absolute reliability in the sit and reach test (ICC = 0.998; SEM% = 1.16) and back scratch test (ICC = 0.996–0.998; SEM% = 3.50–4.46). Regarding the comparison among age groups, children demonstrated higher SEM% values (1.83–6.72%) than adolescents (1.16–4.46%) in both tests, indicating that adolescents presented better reliability than children.
Table 12.
Test–retest values (mean ± SD), as well as absolute and relative reliability indices, in girl taekwondo athletes (per age group).
Best or mean of three testing trials. The test and retest sit and reach and back scratch values (mean and SD), as well as the relative and absolute reliability indices (ICC, SEM, SEM%, 95% LOA), for girl taekwondo athletes (per age group) are presented in Table 12. The paired t-tests demonstrated non-significant differences between the test and retest values in the sit and reach test and back scratch test in children (p = 0.44–0.66) and adolescents (p = 0.53–0.74). The systematic bias ranged from −0.22 to +0.13 cm in children and from −0.12 to +0.17 cm in adolescent girls. The relative and absolute reliability values between tests and retests were high for children in the sit and reach test (ICC = 0.995–0.996; SEM% = 2.03–2.09) and back scratch test (ICC = 0.996–0.998; SEM% = 4.98–6.76). Moreover, adolescents showed high relative reliability and absolute reliability in the sit and reach test (ICC = 0.997; SEM% = 1.39–1.40) and back scratch test (ICC = 0.996–0.998; SEM% = 2.71–4.97). Regarding the comparison among age groups, children demonstrated higher SEM% values (2.03–6.76%) than adolescents (1.39–4.97%) in both tests, indicating that adolescents presented better reliability than children.
3.2.3. Non-Athletes
Boys
Single trial. The test and retest sit and reach and back scratch values (mean and SD), as well as the relative and absolute reliability indices (ICC, SEM, SEM%, 95% LOA), for boy non-athletes (per age group) are presented in Table 13. The paired t-tests demonstrated non-significant differences between the test and retest values in the sit and reach test and back scratch test in children (p = 0.23–0.43) and adolescents (p = 0.36–0.57). The systematic bias ranged from −0.09 to −0.3 cm in children and from −0.06 to +0.19 cm in adolescent boys. The relative and absolute reliability values between tests and retests were good to high for children in the sit and reach test (ICC = 0.994; SEM% = 4.93) and back scratch test (ICC = 0.993–0.997; SEM% = 7.70–9.39). Moreover, adolescents showed high relative reliability and absolute reliability in the sit and reach test (ICC = 0.997; SEM% = 2.99) and back scratch test (ICC = 0.996–0.998; SEM% = 5.01–8.22). Regarding the comparison among age groups, children demonstrated higher SEM% values (4.93–9.39%) than adolescents (2.99–8.22%) in both tests, indicating that adolescents presented better reliability than children.
Table 13.
Test–retest values (mean ± SD), as well as absolute and relative reliability indices, in boy non-athletes (per age group).
Best or mean of three testing trials. The test and retest sit and reach and back scratch values (mean and SD), as well as the relative and absolute reliability indices (ICC, SEM, SEM%, 95% LOA), for boy non-athletes (per age group) are presented in Table 13. The paired t-tests demonstrated non-significant differences between the test and retest values in the sit and reach test and back scratch test in children (p = 0.37–0.59) and adolescents (p = 0.55–0.74). The systematic bias ranged from −0.10 to −0.03 cm in children and from −0.06 to +0.07 cm in adolescent boys. The relative and absolute reliability values between tests and retests were good to high for children in the sit and reach test (ICC = 0.994–0.995; SEM% = 4.23–4.56) and back scratch test (ICC = 0.995–0.997; SEM% = 7.05–9.66). Additionally, adolescents showed high relative reliability and absolute reliability in the sit and reach test (ICC = 0.997; SEM% = 2.96–2.98) and back scratch test (ICC = 0.996–0.998; SEM% = 5.00–8.67). Concerning the comparison among age groups, children demonstrated higher SEM% values (2.96–8.67%) than adolescents (2.99–8.22%) in both tests, indicating that adolescents presented better reliability than children.
Girls
Single trial. The test and retest sit and reach and back scratch values (mean and SD), as well as the relative and absolute reliability indices (ICC, SEM, SEM%, 95% LOA), for girl non-athletes (per age group) are presented in Table 14. The paired t-tests demonstrated non-significant differences between the test and retest values in the sit and reach test and back scratch test in children (p = 0.21–0.49) and adolescents (p = 0.33–0.59). The systematic bias ranged from +0.06 to +0.3 cm in children and from −0.09 to +0.5 cm in adolescent girls. The relative and absolute reliability values between tests and retests were good to high for children in the sit and reach test (ICC = 0.995; SEM% = 3.79) and back scratch test (ICC = 0.998; SEM% = 9.90–9.98). Moreover, adolescents showed good to high relative reliability and absolute reliability in the sit and reach test (ICC = 0.996; SEM% = 3.27) and back scratch test (ICC = 0.997–0.998; SEM% = 7.03–8.40). Regarding the comparison among age groups, children demonstrated higher SEM% values (3.79–9.98%) than adolescents (3.27–8.40%) in both tests, indicating that adolescents presented better reliability than children.
Table 14.
Test–retest values (mean ± SD), as well as absolute and relative reliability indices, in girl non-athletes (per age group).
Best or mean of three testing trials. The test and retest sit and reach and back scratch values (mean and SD), as well as the relative and absolute reliability indices (ICC, SEM, SEM%, 95% LOA), for girl non-athletes (per age group) are presented in Table 14. The paired t-tests demonstrated non-significant differences between the test and retest values in the sit and reach test and back scratch test in children (p = 0.40–0.69) and adolescents (p = 0.60–0.76). The systematic bias ranged from −0.05 to +0.53 cm in children and from −0.08 to +0.35 cm in adolescent girls. The relative and absolute reliability values between tests and retests were good to high for children in the sit and reach test (ICC = 0.996; SEM% = 3.40–3.41) and back scratch test (ICC = 0.998; SEM% = 9.52–9.95). Likewise, adolescents showed good to high relative reliability and absolute reliability in the sit and reach test (ICC = 0.996–0.998; SEM% = 3.19–3.24) and back scratch test (ICC = 0.997–0.998; SEM% = 7.13–8.60). Concerning the comparison among age groups, children demonstrated higher SEM% values (3.40–9.95%) than adolescents (3.19–8.60%) in both tests, indicating that adolescents presented better reliability than children.
4. Discussion
The novel aspect of this study is that it examined the effects of sport activities (wrestling, taekwondo, no participation in organized physical activity), age (children, adolescents), and sex (boys, girls) on the intrasession and intersession reliability (using various absolute and relative reliability indices) of flexibility measurements (sit and reach test, back scratch test). This study also investigated whether the number of testing trials and the method used for the determination of performance in flexibility tests (single trial, best of three trials, or average of three trials) affected their reliability. The results showed that upper- and lower-body flexibility, using the sit and reach and the back scratch tests, could be reliably assessed in boys and girls during the developmental years. It should be, however, mentioned that children displayed slightly lower intrasession and intersession reliability (higher SEM% values) compared to adolescents, irrespective of the sport activity and sex. Additionally, non-athletes exhibited slightly lower intrasession and intersession reliability (higher SEM% values) compared to taekwondo and wrestling athletes, irrespective of age and sex. Furthermore, it seems that a single trial and the best and average of three testing trials are equally reliable for flexibility measurement, irrespective of the sport, age, and sex.
Generally, the findings of the present study are in line with previous studies that have examined the reliability of the sit and reach test in untrained children and adolescents or young athletes [25,27,28], demonstrating high reliability (ICC = 0.93–0.99). Additionally, the results of the present study are consistent with previous studies that have shown good to high reliability (ICC = 0.88–0.93) for the shoulder stretch test in untrained children and adolescents [26] and high reliability (ICC = 0.99–1) in young tennis players [28]. However, it should be mentioned that different factors, such as the subjects’ characteristics and the testing protocol, may affect the reliability of measurements.
An important factor that could affect the reliability of measurements is age. In the present study, we observed higher SEM% values in children athletes and non-athletes compared to adolescent athletes and non-athletes for both flexibility tests (sit and reach test, back scratch test). In the scientific literature, there is limited information regarding the age effect on the reliability of flexibility measurements during the developmental years. Our findings are in line with a previous study [41] in young soccer players (11–19 years old) that showed different reliability values among age groups. In more detail, Díaz-Escobar et al. [41] showed that older age groups from sub-13 to sub-18 presented higher Cronbach’s alpha values of 0.80–0.94 than the younger age group, i.e., sub-11 (Cronbach’s alpha = 0.72), during the modified Thomas flexibility test. Furthermore, our findings are consistent with previous studies [38,39,52] that examined other physical fitness parameters (e.g., handgrip strength, cervical strength) and found significant age effects on reliability during the developmental years, indicating higher reliability with increasing age. For example, Svenson et al. [39] reported that handgrip strength measurements (using the best of three trials) were more reliable in a 14-year-old group (ICC = 0.96, SEM%: 5.2) than in a 10-year-old group (ICC = 0.78, SEM%: 12.5). Additionally, Gerodimos and Karatrantou [53] demonstrated that prepubertal wrestlers showed greater SEM% values than pubertal wrestlers regarding handgrip strength, and Batatolis et al. [52] showed greater SEM% values in prepubertal boys (SEM% = 5.82–8.62) compared to pubertal boys (SEM% = 3.8–5.5) regarding cervical strength measurements, indicating that pubertal boys showed slightly higher reliability than prepubertal boys. Previous studies that have observed significant age effects on the reliability of measurements mention that these differences among age groups may be attributed to different factors, such as mood, motivation, attention between testing occasions, learning effects, the maturity of the nervous system, and biomechanical factors [38,39]. It may be argued that neural maturation during the developmental years [42] (from childhood to adolescence) could impact the overall level of performance, as well as its reliability, leading to changes in the ability of individuals to focus on the task (increased cognitive control and attention in adolescents vs. children). Furthermore, participation in physical activities and sports may positively affect neural maturation. Specifically, compared to non-athletes, due to neuroplastic changes in the brain as a result of specialized training, athletes have better motor control, cognitive processing, and sensory perception [54], influencing their performance levels and, as a result, the reliability of measurements.
Additional factors that could affect the reliability of measurements are engagement in sports activities and physical fitness levels. Our study demonstrated better absolute reliability (lower SEM% values) in wrestling and taekwondo athletes (children: ICC = 0.988–0.998, SEM% = 2.31–7.44; adolescents: ICC = 0.993–0.999, SEM% = 1.13–5.19) compared to non-athletes (children: ICC = 0.992–0.997, SEM% = 3.40–9.98; adolescents: ICC = 0.996–0.998, SEM% = 2.81–8.94) for both flexibility tests (sit and reach test, back scratch test). To the best of our knowledge, in the context of the developmental years, no previous study has examined the differences in the reliability of flexibility measurements between athletes and non-athletes. However, regarding other physical fitness parameters, such as strength and power, there is adequate information with which to compare our results, using cross-parameter comparisons. Strength and power, as well as flexibility, are interconnected neuromuscular performance parameters and could potentially behave similarly in the context of test–retest reliability. Indeed, previous studies on other physical fitness parameters (i.e., strength and power) showed better reliability in trained vs. untrained participants [55], as well as between athletes and non-athletes [37,40], reinforcing our findings in the flexibility test. Previous studies that found significant differences in reliability between athletes and non-athletes mentioned that, as the process of neural adaptation occurs secondary to the training experience, the ability to engage motor fibers and the reliability of measurements are enhanced. The reliability of measurements may also be influenced by differences in performance levels. Three previous studies [25,43,56] have demonstrated that the performance level in terms of flexibility affects the reliability of measurements. Indeed, Ramirez et al. [25], in Colombian boys and girls (9–17.9 years old), indicated that the worse the performance in the sit and reach test, the worse the degree of agreement. Moreover, Ortega et al. [43] observed that adolescents who scored highly in the back-saver sit and reach test had better intertrial agreement compared with adolescents who obtained lower scores, indicating that the flexibility level can affect its reliability.
Regarding the sex effect on the reliability of measurements, in the present study, we observed no differences in reliability between boys and girls (irrespective of sport activity and age) in both the sit and reach and back scratch tests. In the same context, Luna-Villouta et al. [28] showed similar ICC values in young tennis players (14–16 years old) among boys and girls in both the sit and reach test (ICC = 1.00 in boys and ICC = 0.99 in girls) and the shoulder stretch test (ICC = 0.99 in boys and ICC = 1.00 in girls). Meanwhile, Ortega et al. [43], during the back-saver sit and reach test, found a borderline significant sex difference. In the above study of Ortega et al. [43], adolescent girls showed a greater intertrial difference (1.4 cm) than adolescent boys (−0.3 cm) in the back-saver sit and reach test.
Finally, the number of testing trials performed (i.e., one vs. three), as well as the different methods used to determine performance (average vs. best value), may potentially affect the reliability of measurements. In our study, we found that a single trial and the best or mean of three testing trials were equally reliable during flexibility measurements (sit and reach test, back scratch tests) in boys and girls, as well as in athletes and non-athletes, during the developmental years (children and adolescents). Thus, a testing protocol with one trial may be used as an equally reliable, less fatiguing, and less time-consuming protocol for the evaluation of flexibility in young healthy individuals, compared to a testing protocol with three testing trials (best or average value). Although, regarding flexibility tests, there is no information regarding the reliability of measurements when using different numbers of trials, for other physical fitness parameters (e.g., handgrip strength), there is adequate information, albeit with conflicting results. On the one hand, Mathiowetz et al. [44], Svensson et al. [39], and Karatrantou et al. [45] reported that the mean of three testing trials had higher test–retest reliability than either a single trial or the best of three trials in healthy individuals [39,44] and in individuals with intellectual disabilities [45]. On the other hand, other studies have observed that a single trial and the mean or the best of two or three trials are equally reliable in determining the maximal handgrip strength in healthy individuals, as well as in individuals who have undergone carpal tunnel decompression or flexor tendon repair [46,47,48]. Future studies are needed to draw more valid conclusions regarding the effects of testing trials on reliability, especially in flexibility measurements, where the literature is inadequate.
The present study has some limitations that could affect the generalization of its findings. First of all, the results of the present study are limited to children and adolescent athletes (wrestling or taekwondo) and non-athletes, and they cannot be generalized to other target population groups. Future studies could examine and create indicative–normative values for flexibility performance in individuals of other age groups, sports, or physical activity levels. Furthermore, the results of the present study are limited to the two flexibility tests (sit and reach and back scratch) that were used. However, future studies could examine and compare the reliability of other flexibility tests (field or laboratory) that are used in the scientific literature, as well as evaluating flexibility performance in other muscle groups of the human body. Other limitations of the present study are the measurement time and the warm-up protocol used, which could affect flexibility performance. Future studies could examine and compare flexibility performance and therefore its reliability using different measurement times and warm-up protocols.
5. Conclusions
In conclusion, the results of the present study suggest that the sit and reach and back scratch tests are reliable tests to assess flexibility in boy and girl athletes (wrestling and taekwondo) and non-athletes during the developmental years (children and adolescents). It seems, however, that engagement in sports and age could affect the reliability of these measurements. Specifically, it should be mentioned that athletes (wrestling and taekwondo athletes) present slightly better reliability compared to non-athletes. Additionally, adolescents present slightly better reliability compared to children. We also observed that sex did not affect the reliability of the sit and reach and back scratch tests. Finally, we observed similar test–retest reliability when using either a single trial or the best/mean of three testing trials. The results of the present study have important practical implications for coaches and physical fitness trainers, who could reliably use these tests (sit and reach and back scratch) for flexibility monitoring and training planning, as well as for injury prevention and rehabilitation. However, better familiarization, before the main testing, is important in children compared to adolescents and in non-athletes compared to athletes for more reliable results. Finally, it seems that, during measurement, a testing protocol with one trial could be used as an equally reliable, less fatiguing, and less time-consuming approach for the evaluation of flexibility, compared to a testing protocol with three trials.
Author Contributions
Conceptualization, K.K. and V.G.; methodology, N.T., K.K. and V.G.; investigation, N.T., K.P., F.T. and C.B.; data curation, K.K. and N.T.; writing—original draft preparation, N.T.; writing—review and editing, V.G. and K.K.; supervision, V.G. All authors have read and agreed to the published version of the manuscript.
Funding
This research received no external funding.
Institutional Review Board Statement
This study was conducted in accordance with the Declaration of Helsinki and approved by the Ethics Committee of the University of Thessaly (protocol code 2472, and approval date: 4 December 2024).
Informed Consent Statement
Informed consent was obtained from all participants involved in the study and their parents.
Data Availability Statement
Data are unavailable due to privacy or ethical restrictions.
Conflicts of Interest
The authors declare no conflicts of interest.
References
- Alter, M. Sport Stretch, 2nd ed.; Human Kinetics: Champaign, IL, USA, 1998. [Google Scholar]
- Corbin, C.B.; Welk, G.J.; Corbin, W.R.; Welk, K.A. Concepts of Fitness and Wellness: A Comprehensive Lifestyle Approach, 13th ed.; McGraw-Hill: Boston, MA, USA, 2022. [Google Scholar]
- Docherty, D. Measurement in Pediatric Exercise Science; Human Kinetics: Champaign, IL, USA, 1996. [Google Scholar]
- Callan, S.D.; Brunner, D.M.; Devolve, K.L.; Mulligan, S.E.; Hesson, J.; Randall, L.W.; Jay, K. Physiological profiles of elite freestyle wrestlers. J. Strength Cond. Res. 2000, 14, 162–169. [Google Scholar]
- Yoon, J. Physiological profiles of elite senior wrestlers. Sports Med. 2002, 32, 225–233. [Google Scholar] [CrossRef] [PubMed]
- Kim, J.W.; Nam, S.S. Physical Characteristics and Physical Fitness Profiles of Korean Taekwondo Athletes: A Systematic Review. Int. J. Environ. Res. Public Health 2021, 18, 9624. [Google Scholar] [CrossRef] [PubMed]
- Bridge, C.A.; Ferreira da Silva Santos, J.; Chaabène, H.; Pieter, W.; Franchini, E. Physical and physiological profiles of taekwondo athletes. Sports Med. 2014, 44, 713–733. [Google Scholar] [CrossRef] [PubMed]
- Agarwal, S.; Mann, E. Knee Injuries in Wrestlers: A Prospective Study from the Indian Subcontinent. Asian J. Sports Med. 2016, 7, e35000. [Google Scholar] [CrossRef]
- Barroso, B.G.; Silva, J.M.A.D.; Garcia, A.D.C.; Ramos, N.C.D.O.; Martinelli, M.O.; Resende, V.R.; Júnior, A.D.; Santili, C. Musculoskeletal injuries in wrestling athletes. Acta Ortop. Bras. 2011, 19, 98–101. [Google Scholar] [CrossRef]
- Pasque, C.B.; Hewett, T.E. A prospective study of high school wrestling injuries. Am. J. Sports Med. 2000, 28, 509–515. [Google Scholar] [CrossRef]
- Ji, M. Analysis of injuries in taekwondo athletes. J. Phys. Ther. Sci. 2016, 28, 231–234. [Google Scholar] [CrossRef]
- Hewett, T.E.; Pasque, C.; Heyl, R.; Wroble, R. Wrestling injuries. Med. Sport. Sci. 2005, 48, 152–178. [Google Scholar] [CrossRef]
- Kim, H.C.; Park, K.J. The effect of rapid weight loss on sports injury in elite taekwondo athletes. Phys. Sportsmed. 2023, 51, 313–319. [Google Scholar] [CrossRef]
- Tafazzoli, F.; Lamontagne, M. Mechanical behaviour of hamstring muscles in low-back pain patients and control subjects. Clin. Biomech. 1996, 11, 16–24. [Google Scholar] [CrossRef] [PubMed]
- Arab, A.M.; Abdollahi, I.; Joghataei, M.T.; Golafshani, Z.; Kazemnejad, A. Inter- and intra-examiner reliability of single and composites of selected motion palpation and pain provocation tests for sacroiliac joint. Man. Ther. 2009, 14, 213–221. [Google Scholar] [CrossRef] [PubMed]
- Heiderscheit, B.C.; Sherry, M.A.; Silder, A.; Chumanov, E.S.; Thelen, D.G. Hamstring strain injuries: Recommendations for diagnosis, rehabilitation, and injury prevention. J. Orthop. Sports Phys. Ther. 2010, 40, 67–81. [Google Scholar] [CrossRef] [PubMed]
- Petersen, W.; Ellermann, A.; Gösele-Koppenburg, A.; Best, R.; Rembitzki, I.V.; Brüggemann, G.P.; Liebau, C. Patellofemoral pain syndrome. Knee Surg. Sports Traumatol. Arthrosc. 2014, 22, 2264–2274. [Google Scholar] [CrossRef]
- Van der Worp, H.; van Ark, M.; Roerink, S.; Pepping, G.J.; van den Akker-Scheek, I.; Zwerver, J. Risk factors for patellar tendinopathy: A systematic review of the literature. Br. J. Sports Med. 2011, 45, 446–452. [Google Scholar] [CrossRef]
- Institute of Medicine. Fitness Measures and Health Outcomes in Youth; The National Academies Press: Washington, DC, USA, 2012. [Google Scholar]
- Ferguson, B. ACSM’s Guidelines for Exercise Testing and Prescription, 9th ed.; Lippincott Williams & Wilkins: Philadelphia, PA, USA, 2014. [Google Scholar]
- Castro-Pinero, J.; Girela-Rejón, M.J.; Gonzalez-Montesinos, J.L.; Mora, J.; Conde, J.; Sjostrom, M.; Ruiz, J. Percentile values for flexibility tests in youths aged 6 to 17 years: Influence of weight status. Eur. J. Sport Sci. 2013, 13, 139148. [Google Scholar] [CrossRef]
- Kumari, R.; Nath, B.; Singh, Y.; Mallick, R. Health-related physical fitness, physical activity and its correlates among school going adolescents in hilly state in north India: A cross sectional survey. BMC Public Health 2024, 24, 401. [Google Scholar] [CrossRef]
- Amado-Pacheco, J.C.; Prieto-Benavides, D.H.; Correa-Bautista, J.E.; García-Hermoso, A.; Agostinis-Sobrinho, C.; Alonso-Martínez, A.M.; Izquierdo, M.; Ramírez-Vélez, R. Feasibility and Reliability of Physical Fitness Tests among Colombian Preschool Children. Int. J. Environ. Res. Public Health 2019, 16, 3069. [Google Scholar] [CrossRef]
- King-Dowling, S.; Fortnum, K.; Chirico, D.; Le, T.; Kwan, M.Y.W.; Timmons, B.W.; Cairney, J. Reliability of field- and laboratory-based assessments of health-related fitness in preschool-aged children. Am. J. Hum. Biol. 2024, 36, e23987. [Google Scholar] [CrossRef]
- Ramírez-Vélez, R.; Rodrigues-Bezerra, D.; Correa-Bautista, J.E.; Izquierdo, M.; Lobelo, F. Reliability of Health-Related Physical Fitness Tests among Colombian Children and Adolescents: The FUPRECOL Study. PLoS ONE 2015, 10, e0140875. [Google Scholar] [CrossRef]
- Vanhelst, J.; Béghin, L.; Fardy, P.S.; Ulmer, Z.; Czaplicki, G. Reliability of health-related physical fitness tests in adolescents: The MOVE Program. Clin. Physiol. Funct. Imaging 2016, 36, 106–111. [Google Scholar] [CrossRef]
- Henriques-Neto, D.; Minderico, C.; Peralta, M.; Marques, A.; Sardinha, L.B. Test-retest reliability of physical fitness tests among young athletes: The FITescola® battery. Clin. Physiol. Funct. Imaging 2020, 40, 173–182. [Google Scholar] [CrossRef] [PubMed]
- Luna-Villouta, P.; Leao Ribeiro, I.; Faúndez-Casanova, C.; Vásquez-Gómez, J.; Flores-Rivera, C.; Vargas Vitoria, R. Intra-rater and intraday test-retest reliability for physical performance tests in young Chilean tennis players. Cult. Cienc. Deporte 2022, 17, 89–97. [Google Scholar] [CrossRef]
- Albaladejo-Saura, M.; Vaquero-Cristóbal, R.; García-Roca, J.A.; Esparza-Ros, F. Influence of biological maturation status on selected anthropometric and physical fitness variables in adolescent male volleyball players. Peer J. 2022, 10, e13216. [Google Scholar] [CrossRef] [PubMed]
- Demirkan, E.; Kutlu, M.; Koz, M.; Ozal, M.; Favre, M. Physical fitness differences between freestyle and Greco-Roman junior wrestlers. J. Hum. Kinet. 2014, 41, 245–251. [Google Scholar] [CrossRef]
- Demirkan, E. Age-related patterns of physical and physiological characteristics in adolescent wrestlers. Montenegrin J. Sports Sci. Med. 2015, 4, 13–18. [Google Scholar]
- Terbizan, D.J.; Seljevold, P.J. Physiological profile of age-group wrestlers. J. Sports Med. Phys. Fitness 1996, 36, 178–185. [Google Scholar] [PubMed]
- Carbonell-Baeza, A.; Álvarez-Gallardo, I.C.; Segura-Jiménez, V.; Castro-Piñero, J.; Ruiz, J.R.; Delgado-Fernández, M.; Aparicio, V.A. Reliability and feasibility of physical fitness tests in female fibromyalgia patients. Int. J. Sports Med. 2015, 36, 157–162. [Google Scholar] [CrossRef]
- Dewhurst, S.; Bampouras, T.M. Intraday reliability and sensitivity of four functional ability tests in older women. Am. J. Phys. Med. Rehabil. 2014, 93, 703–707. [Google Scholar] [CrossRef]
- Hesseberg, K.; Bentzen, H.; Bergland, A. Reliability of the senior fitness test in community-dwelling older people with cognitive impairment. Physiother. Res. Int. 2015, 20, 37–44. [Google Scholar] [CrossRef]
- Miotto, J.M.; Chodzko-Zajko, W.J.; Reich, J.L.; Supler, M.M. Reliability and validity of the Fullerton Functional Fitness Test: An independent replication study. J. Aging Phys. Activity 1999, 7, 339–353. [Google Scholar] [CrossRef]
- Hopkins, G.; Schabort, E.; Hawley, J. Reliability of power in physical performance tests. Sports Med. 2001, 31, 211–234. [Google Scholar] [CrossRef] [PubMed]
- Molenaar, H.M.; Zuidam, J.M.; Selles, R.W.; Stam, H.J.; Hovius, S.E. Age-specific reliability of two grip-strength dynamometers when used by children. J. Bone Jt. Surg. Am. 2008, 90, 1053–1059. [Google Scholar] [CrossRef] [PubMed]
- Svensson, E.; Waling, K.; Häger-Ross, C. Grip strength in children: Test-retest reliability using Grippit. Acta Paediatr. 2008, 97, 1226–1231. [Google Scholar] [CrossRef] [PubMed]
- Vieira, A.; Tufano, J.J. Reactive strength index-modified: Reliability, between group comparison, and relationship between its associated variables. Biol. Sport 2021, 38, 451–457. [Google Scholar] [CrossRef]
- Díaz-Escobar, C.; Ocaranza-Ozimica, J.; Díaz-Narváez, V.P.; Utsman, R. Reliability of flexibility tests in young soccer players from a professional club|Confiabilidad de pruebas para flexibilidad en futbolistas jóvenes de un club profesional. Apunts Educacion Fisica Deportes 2018, 131, 80–94. [Google Scholar] [CrossRef]
- Zanolie, K.; Crone, E.A. Development of cognitive control across childhood and adolescence. In Stevens’ Handbook of Experimental Psychology and Cognitive Neuroscience, 4th ed.; Wixted, J.T., Ed.; John Wiley & Sons, Inc.: Hoboken, NJ, USA, 2018. [Google Scholar] [CrossRef]
- Ortega, F.B.; Artero, E.G.; Ruiz, J.R.; Vicente-Rodriguez, G.; Bergman, P.; Hagströmer, M.; Ottevaere, C.; Nagy, E.; Konsta, O.; Rey-López, J.P.; et al. Reliability of health-related physical fitness tests in European adolescents. The HELENA Study. Int. J. Obes. 2008, 32, S49–S57. [Google Scholar] [CrossRef]
- Mathiowetz, V.; Weber, K.; Volland, G.; Kashman, N. Reliability and validity of grip and pinch strength evaluations. J. Hand Surg. Am. 1984, 9, 222–226. [Google Scholar] [CrossRef]
- Karatrantou, K.; Xagorari, A.; Vasilopoulou, T.; Gerodimos, V. Does the number of trials affect the reliability of handgrip strength measurement in individuals with intellectual disabilities? Hand Surg. Rehabil. 2020, 39, 223–228. [Google Scholar] [CrossRef]
- Coldham, F.; Lewis, J.; Lee, H. The reliability of one vs. three grip trials in symptomatic and asymptomatic subjects. J. Hand Ther. 2006, 19, 318–326. [Google Scholar] [CrossRef]
- Hamilton, A.; Balnave, R.; Adams, R. Grip strength testing reliability. J. Hand Ther. 1994, 7, 163–170. [Google Scholar] [CrossRef]
- Wang, C.Y.; Chen, L.Y. Grip strength in older adults: Test-retest reliability and cutoff for subjective weakness of using the hands in heavy tasks. Arch. Phys. Med. Rehabil. 2010, 91, 1747–1751. [Google Scholar] [CrossRef]
- Walter, S.D.; Eliasziw, M.; Donner, A. Sample size and optimal designs for reliability studies. Stat. Med. 1998, 17, 101–110. [Google Scholar] [CrossRef]
- Atkinson, G.; Nevill, A.M. Statistical methods for assessing measurement error (reliability) in variables relevant to sports medicine. Sports Med. 1998, 26, 217–238. [Google Scholar] [CrossRef] [PubMed]
- Koo, T.K.; Li, M.Y. A Guideline of Selecting and Reporting Intraclass Correlation Coefficients for Reliability Research. J. Chiropr. Med. 2016, 15, 155–163. [Google Scholar] [CrossRef] [PubMed]
- Batatolis, C.; Karatrantou, K.; Vasilopoulou, T.; Chanou, K.; Tsiakaras, N.; Gerodimos, V. Test-retest reliability of cervical strength testing protocols with handheld dynamometer in prepubertal and pubertal untrained boys. J. Funct. Morphol. Kinesiol. 2025, 10, 173. [Google Scholar] [CrossRef] [PubMed]
- Gerodimos, V.; Karatrantou, K. Reliability of maximal handgrip strength test in pre-pubertal and pubertal wrestlers. Pediatr. Exerc. Sci. 2013, 25, 308–322. [Google Scholar] [CrossRef]
- Li, L.; Smith, D.M. Neural Efficiency in Athletes: A Systematic Review. Front. Behav. Neurosci. 2021, 15, 698555. [Google Scholar] [CrossRef]
- Benton, M.J.; Raab, S.; Waggener, G.T. Effect of training status on reliability of one repetition maximum testing in women. J. Strength. Cond. Res. 2013, 27, 1885–1890. [Google Scholar] [CrossRef]
- Hartman, J.; Looney, M. Norm-referenced and criterion-referenced reliability and validity of the back-saver sit-and-reach. Meas. Phys. Educat Exerc. Sci. 2003, 7, 71–87. [Google Scholar] [CrossRef]
Disclaimer/Publisher’s Note: The statements, opinions and data contained in all publications are solely those of the individual author(s) and contributor(s) and not of MDPI and/or the editor(s). MDPI and/or the editor(s) disclaim responsibility for any injury to people or property resulting from any ideas, methods, instructions or products referred to in the content. |
© 2025 by the authors. Licensee MDPI, Basel, Switzerland. This article is an open access article distributed under the terms and conditions of the Creative Commons Attribution (CC BY) license (https://creativecommons.org/licenses/by/4.0/).