Abstract
This study aimed (1) to assess the validity of a modified method (Mmod) based on heart rate (HR)—oxygen uptake (VO2) regression functions to calculate total energy costs (Wtotal) and aerobic (Waer) and anaerobic alactic energy contribution (Wpcr) and (2) to analyse the physiological and energetic demands of high-level pommel horse routines (PH routines). The Mmod was developed because VO2 measurements are limited during high-level PH routines. Answering Part 1, nine male artistic gymnasts performed a PH routine where energy costs were calculated from VO2 measurements and then compared with energy costs determined from the HR- VO2 regressions of Mmod’s two additional tests. Using the concordance correlation coefficient (CCC) and Deming regression, Waer (CCC = 0.955), Wpcr (CCC = 0.999), and Wtotal (CCC = 0.990) show substantial to almost perfect validity without constant or proportional bias. Data from eight further gymnasts performing a high-level PH routine and a graded exercise test (GXT), as well as four data sets from Part 1, were used to determine physiological and energetic demands using Mmod. VO2 and HR during PH routines reached 86.1% and 90.4% of the maximal values during GXT. Wpcr was 47.0%, anaerobic lactic energy contribution (Wblc) was 29.7%, and Waer was 23.3% of Wtotal required during PH routines. Summarising the energetic demands of high-level PH routines, they are mainly anaerobic, where Wpcr provides the largest energy share. Waer provides a substantial part of Wtotal and should therefore also be specifically trained.
1. Introduction
Artistic gymnastics is listed as one of the most spectacular Olympic sports, as the artistry and skills performed by gymnasts often appear to be close to the ultimate limits of the human body [1]. To perform these skills at the highest technical level, gymnasts need different physical and psychological skills. In general, strength, speed, agility, and muscular endurance are considered essential physical skills in men’s artistic gymnastics (MAG) [2]. For example, gymnasts can enhance their muscular endurance by increasing metabolic efficiency and effectiveness via training specific metabolic pathways for energy production [2]. However, in MAG, knowledge about the relevance of the individual metabolic pathways is limited.
So far, for the pommel horse (PH), vault, parallel bars, and high bar, only calculations of energetic demands are present based on routine duration and blood lactate concentration (BLC). However, these calculations refer to outdated routine duration values [3] and therefore probably no longer represent the current energy demands on these apparatuses. On the other hand, for floor and still rings, there are studies that model energy supply using the PCr-LA-O2 method [4,5]. These studies show that in MAG, anaerobic energy supply is mainly realised by high-energy phosphates, and aerobic metabolism is an important energy source [4,5]. This is also confirmed in other acyclic activity sports, such as judo, indoor climbing, or rhythmic gymnastics, which involve a large number of short, high-intensity movements interspersed with short periods of less intense demands [6,7,8]. It should also be mentioned that in the MAG, only the study of still rings was performed with elite gymnasts and difficult routines. Of note, simpler routines do not represent the energetic demands of high-level routines and are therefore only of limited use for training recommendations at the top level.
PH, as one of the six apparatuses in MAG, is characterised by balance and rotation movements (circles), which are performed in side or cross support with closed or straddle legs in a continuous dynamic without interruption [9]. According to the international scoring regulations (Code de Pointage), PH routines must contain single-leg swings and scissors, circles and flairs with and/or without spindles and handstands, sweeps, Russian swings, flops, combined elements, travel-type elements, and a dismount to receive the full score [10]. Due to the frequent balance movements, the use of the PCr-LA-O2 method on the PH is limited since the required mobile spiroergometry system can lead to visual restrictions and balance irritations [11]. However, the relevance of modelling the energy requirements at PH is already given by the significant change in the routine duration [3], as routine duration substantially influences these requirements [12]. Indeed, the routine duration at PH increased by 22% after the fundamental modification of the Code de Pointage in 2005 [3]. There are also increases in physiological demands. For example, peak blood lactate concentrations (BLCpeak) in PH routines increased from 6.00 to 8.70 mmol·L−1, while peak heart rate (HRpeak) showed no increases [13]. In addition, measured data on peak oxygen consumption (VO2peak) for PH routines does not yet exist.
According to the previously mentioned estimates of energetic demand, energy supply during PH routines occurs after an initial contribution of the anaerobic-alactic system, mainly through the anaerobic-lactic system [14]. In contrast, a pilot study with three subjects using the PCr-LA-O2 method suggested that not the anaerobic-lactic system but the anaerobic-alactic and aerobic systems are the predominant energy suppliers during PH routines [11]. However, the use of the PCr-LA-O2 method with top athletes is not possible without modification, as this method requires a lot of training time with mobile spiroergometry, which is not feasible in professional sports.
Heart rate (HR), as an easily measured and accurate physiological parameter with no interfering factors for athletes, provides a way to calculate oxygen uptake (VO2) consumption via the HR- VO2 relationship [15]. In intermittent sports like tennis, basketball, or football, HR- VO2 relationship functions are widely used to calculate VO2 based on HR [15,16,17]. In this context, it should be noted that the HR- VO2 relationship varies from person to person, so it is necessary to determine the relationships between HR and VO2 individually [18]. Furthermore, it has been shown that the VO2 and energy costs determined by linear HR- VO2 relationships from ergometer-grade exercise tests overestimate the actual VO2 and energy costs [19]. Therefore, for acyclic exercise, a sport-specific adaptation of the HR- VO2 relationship functions generated on the ergometer is necessary. In this context, a study from tennis has shown that a sport-specific determination of the HR- VO2 relationship provides more accurate VO2 values than a semi-specific determination [15].
The first aim of the study was therefore to assess the concurrent validity of a modified method (Mmod) to calculate total energy costs and relative energy contributions of metabolic pathways based on HR- VO2 relationship functions in PH. Based on the theoretical positions, the first hypothesis (H1) of this study was that in PH routines, the aerobic, anaerobic, alactic, and total energy costs can be validly calculated using Mmod. The second aim of the study was to examine the physiological demands (VO2, BLC, and HR) and to determine the metabolic profile of elite PH routines using Mmod. Based on the results of a pilot study and the duration of PH routines [3,11], the second hypothesis (H2) was that anaerobic alactic energy contribution (Wpcr) provides the largest energy contribution in PH routines and that aerobic energy contribution (Waer) provides between 30% and 40% of the total energy. Finally, it would also be analysed whether there are any correlations between the energetic demands and the load characteristics of the PH routines (duration and difficulty) as well as between the energetic demands and the endurance performance (maximum VO2 [VO2max] and individual anaerobic threshold [IAT]) of the athletes. In this context, it was hypothesised (H3) that the endurance performance of the athletes correlates with the anaerobic lactic energy contribution (Wblc).
2. Materials and Methods
2.1. Experimental Approach
The study was structured into two parts: (1) Validation of the modified method (Mmod) for calculating total energy costs and relative energy contributions of metabolic pathways during PH routines; and (2) modelling of physiological and energetic demands during high-level PH routines in elite artistic gymnasts. Parts 1 and 2 of the study were basically conducted with different subjects, and due to the high performance level, data from 4 subjects from Part 1 was also included in Part 2 of the study. To test the validity of the Mmod, the athletes in Part 1 of the study also completed the PH routine with mobile spiroergometry (original method [Morg]). This procedure was very time-consuming because the athletes had to train for a long time with the mobile spiroergometry, which is therefore not practicable in professional sports. In Part 2, only the Mmod was used.
2.2. Subjects
Nine artistic gymnasts (age = 26.4 ± 5.0 years, height = 173.8 ± 5.4 cm, and weight = 68.2 ± 3.3 kg) participated in Part 1 of the study, and individual data are reported in Table 1. At the time of the study, all athletes performed as gymnasts in the German Gymnastics League. For Part 2 of the study, data from 8 gymnasts of the German national team as well as data from 4 subjects from Part 1 of the study were analysed, and individual data are also reported in Table 1. On average, the twelve gymnasts from Part 2 were 23.5 ± 4.23 years old, 174.0 ± 5.71 cm high, and weighed 66.5 ± 4.01 kg.

Table 1.
Individual demographic data of the athletes.
All athletes were free from injuries or other medical problems and were informed about the study procedure, benefits, and possible risks prior to the study. Before the start of the study, all athletes signed an informed consent. The study was approved by the Ethics Committee of the Faculty of Cultural, Social and Educational Sciences of the Humboldt University of Berlin (HU-KSBF-EK_2019_0017) and conducted in accordance with the Declaration of Helsinki.
2.3. Part 1: Validation of the Modified Method
2.3.1. Procedure and Physiological Measurements of the Modified Method
The Mmod was developed for modelling Waer and Wpcr during difficult PH routines. The Mmod consists of a PH routine and two additional performance tests (non-specific hand cycle test [HCT] and PH-specific circle test [CT]) to determine the athletes’ individual HR- VO2 relationship functions. Since determined HR- VO2 relationships on ergometers (treadmill, hand cycle, etc.) overestimate the actual VO2 [20], a PH-specific adaptation was made using the CT. In the CT, the subjects had to perform continuous circles on the PH over a certain period of time. The load in this test was below the load of a PH routine, so the mean value of the HR- VO2 functions from the HCT and CT was used to calculate the VO2 values of the PH routine. The Mmod was successfully tested on three subjects in an initial pilot study [11] and checked for validity in the present study. Figure 1 illustrates the experimental protocol design. As a first step in the Mmod, the athletes completed an individual PH routine. During the PH routine, HR was measured with a HR sensor (HRM, Garmin Ltd., Schaffhausen, Switzerland) and VO2 was measured in the 10 min post-exercise phase using mobile spiroergometry (K5 Cosmed, Rome, Italy). The second test was the HCT, with a load duration between 40 and 50 s (depending on the duration of the corresponding PH routine of the athletes). The test started (like the CT) from rest, with the intensity of the load being 3 Watt·kg−1 bodyweight and a cranking frequency between 120 and 130 rpm. In a third step, the CT (same load duration as the HCT) was performed on the PH. During the HCT and CT, VO2 and HR were measured continuously breath-by-breath using mobile spiroergometry and a paired HR sensor. To avoid day-to-day variability of the HR- VO2 functions, the three tests were performed on one day. Between the tests, there was a 30 min break during which the subjects recovered passively.
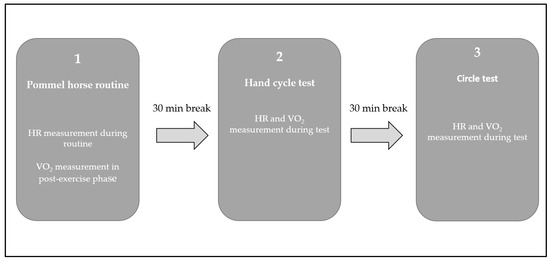
Figure 1.
Experimental study design of the modified method.
2.3.2. Calculation of VO2 during PH Routine
To improve the underlying characteristics of the VO2 measurement, obvious outliers of the VO2 values of the HCT and CT were manually eliminated. To determine the relationship between HR and VO2 values for HCT and CT, two exponential functions (Equations (1) and (2)) were fit into the data using non-linear least squares:
To calculate the final VO2 values of the PH routine, the average of the calculated VO2 values of Equations (1) and (2) was used with the HR of the PH routine:
The VO2 in the post-exercise phase of the PH routine was recorded using a mobile spiroergometry. After the end of the PH routine, the athletes walked a short distance (walking phase) to sit down on a chair, which lasted 10 s on average. As it took up to 15 s (walking phase + preparing mobile spiroergometry for measuring) until the mobile spiroergometry was ready to measure after the PH routine, no VO2 values could be recorded in the first 15 s of the post-exercise phase. Therefore, these missing VO2 values were interpolated using the cubic spline method. The walking phase was considered in the calculation of the energy shares due to the different physiological conditions [5]. Finally, using the calculated VO2 values, the physiological and energetic demands of the PH routine were modelled with the PCr-LA-O2 method established by Beneke et al. [21].
2.4. Part 2: Determination of Physiological and Energetic Demands for High-Level Pommel Horse Routines
2.4.1. Graded Exercise Test
On two different days, the athletes performed a maximal graded exercise test (GXT) on a treadmill (Mercury T170 h/p/cosmos, Naussdorf-Traunstein, Germany) and the tests of the Mmod described above. The GTX was used to determine the maximum physiological parameters (HRmax, VO2max, and BLCmax) as well as the IAT. Due to time problems, the GXT could only be performed with 9 of the 12 athletes.
On the GXT and Mmod, breath-by-breath respiratory gas exchange and HR were recorded with a portable telemetric spiroergometry system (K5 Cosmed, Rome, Italy) coupled with an HR sensor (HRM, Garmin Ltd., Schaffhausen, Switzerland). The used K5 spiroergometry system shows excellent validity (R2 > 0.99) and reliability (intraclass correlation coefficient > 0.99) in breath-by-breath mode [22]. Prior to all tests, the spiroergometric system was calibrated using ambient room air, reference gas (5.0% CO2 and 16.0% O2), and a defined 3 L air volume according to the manufacturer’s instructions.
The initial speed of the GXT was 6.0 km/h and was increased by 2.0 km/h every 3 min. The treadmill incline was set at 1%. Once the subjects felt subjectively exhausted (perceived level of exertion between 19 and 20 using the 6 to 20 Borg scale [23], the test was stopped). VO2 and HR were measured continuously during the test. HRmax was defined as the mean value over the last 10 s of exercise, and VO2max as the mean value over the last 30 s of exercise. IAT was determined according to the Dickhuth method [24].
2.4.2. Procedure and Physiological Measurements for Determination of Physiological and Energetic Demands
Each subject performed an individual PH routine as described in the Mmod, followed by the two performance tests of the Mmod (HCT and CT). For the exact determination of the start and end of the routine as well as the difficulty score of the routine (D-score), the routine (including the pre- and post-load phases) was recorded with a video camera (GC-PX100 JVC, Yokohama, Japan). The D-score of the PH routine was determined according to the Code de Pointage of the International Gymnastics Federation [10]. The execution of the routine was not judged, but the athletes had to perform their routine in good quality. Prior to the start of the PH routine, the subjects had adequate time to practice. A cool-down phase followed the practice to restore the resting level of the physiological parameters. After the cool-down phase, the two-minute prestart phase began, during which prestart lactate was taken and HR measurement and video recording were started. After the end of the PH routines, the subjects walked a short distance (walking phase) to sit down on a chair, which lasted 10 s on average. After the walking phase and preparing the mobile spiroergometry, the VO2 measurement started, which was performed until 10 min after the tests. HR was measured continuously during the 2 min pre-start phase, during the PH routines, and also until 10 min after the end of the test. By using equation 3 of the Mmod and the interpolation of the missing 15 s of post-exercise values, the VO2 data were calculated. Finally, the VO2 post-exercise values recorded by spiroergometry (breath-by-breath) were interpolated to 1-s values using the cubic spline method (Origin, 2021).
HRpeak and VO2peak have been calculated by averaging the last 5 s of the PH routines. BLC was analysed using 20 μL of capillary blood from the hyperaemic earlobe. The blood was taken in the pre-start phase, after the end of the routine, and every minute up to the eighth minute of the post-exercise phase using end-to-end glass capillaries, and finally analysed using a blood analyser (SuperGl, Dr. Müller Gerätebau, Freital, Germany). One minute after the PH routine, the athletes were asked to rate their RPE on the 6 to 20 Borg scale.
2.5. Calculation of Energy Contributions
The calculation of the energy contributions of Waer, Wblc, and Wpcr was conducted for parts 1 (validation) and 2 (physiological energetic requirements) of the study using the PCr-LA-O2 method [21]. Waer was calculated from the VO2 above the resting metabolic rate and caloric equivalent [25] by using:
VO2 above resting metabolic rate was determined as the area under the curve of actual VO2 minus resting metabolic rate. Resting metabolic rate was calculated using the Bendict-Harris formula [26]. The required caloric equivalent was defined as 20.9 J·mL−1 [12]. Wblc was calculated from the highest change in BLC (ΔBLC), the oxygen lactate equivalent of 3.0 mL·O2·kg−1·mmol−1·L−1 [25], and body weight using:
Wpcr was considered the fast component of post-exercise VO2 and was calculated as follows:
To account for the walking phase, the VO2 post-exercise curve was split into 2 phases, and the VO2 of the fast component was calculated according to the procedure described in [5]. The split time was defined as the end of the walking phase and determined manually from the video recordings. Besides the physiological background, the split of the postexercise VO2 improved the quality of the curve fitting (reduction of the average residual standard error by 7.1%).
Finally, the total energy (Wtotal) was calculated as the sum of the contributions of the individual energy systems:
And metabolic power was calculated as Waer, Wblc, Wpcr, and Wtotal divided by routine duration. All energy shares were calculated in kJ and are presented in absolute (kJ) and relative (% of Wtotal) numbers.
2.6. Statistical Analysis
Statistical analyses were conducted using statistical software products (Excel 2016, Microsoft, Redmond, WA, USA, and Jamovi [Version 2.3]). For Part 1 of the study, descriptive statistics were performed, and the data were presented as mean ± standard deviation (SD). To check validity, the normal distribution of the differences (Morg vs. Mmod) was tested and confirmed using the Shapiro-Wilk test. Relative validity was tested using Lin’s concordance correlation coefficient (CCC) with 95% confidence intervals (CI). Before using the CCC, the other criteria, heteroscedasticity and proportional bias, were tested and not confirmed. Therefore, no log-transformation of the raw data was necessary. The agreement criteria for the CCC were classified as poor (CCC < 0.90), moderate (CCC < 0.95), substantial (CCC < 0.99), and almost perfect (CCC ≥ 0.99) [27]. For the assessment of absolute validity, first a Deming regression was performed to check for constant and proportional bias between the methods. Deming regression was used because the determination of energy costs using mobile spiroergometry can also be affected by measurement errors, and Deming regression is a method for estimating the relationship between two sets of measurements, taking into account measurement error in both variables. In the absence of constant and proportional bias between the methods, a Bland-Altman analysis was performed to calculate the 95% limits of agreement (LoA) and the SD of measurement differences (SDD; random measurement error). The SDD was used to quantify the error in calculated Waer, Wpcr, and Wtotal using Mmod.
For Part 2 of the study, descriptive statistics were also performed, and data were presented as mean ± SD and 95% CI. Pearson r was used to analyse statistical correlations between the parameters.
3. Results
The results are divided into two parts, with Part 1 presenting the results of the validation of the Mmod and Part 2 presenting the physiological and energetic demands of the high-level PH routines.
3.1. Part 1: Validity of the Modified Method
Table 2 shows the descriptive data for Waer, Wpcr, and Wtotal using Morg and Mmod.
Table 2.
Descriptive data of Waer, Wpcr, and Wtotal (mean ± SD) using Morg and Mmod.
Wpcr presents almost perfect relative validity, while Waer and Wtotal have substantial relative validity (Table 3). For all three parameters, there are no significant proportional or constant biases.
Table 3.
Measures of validity of Morg and Mmod.
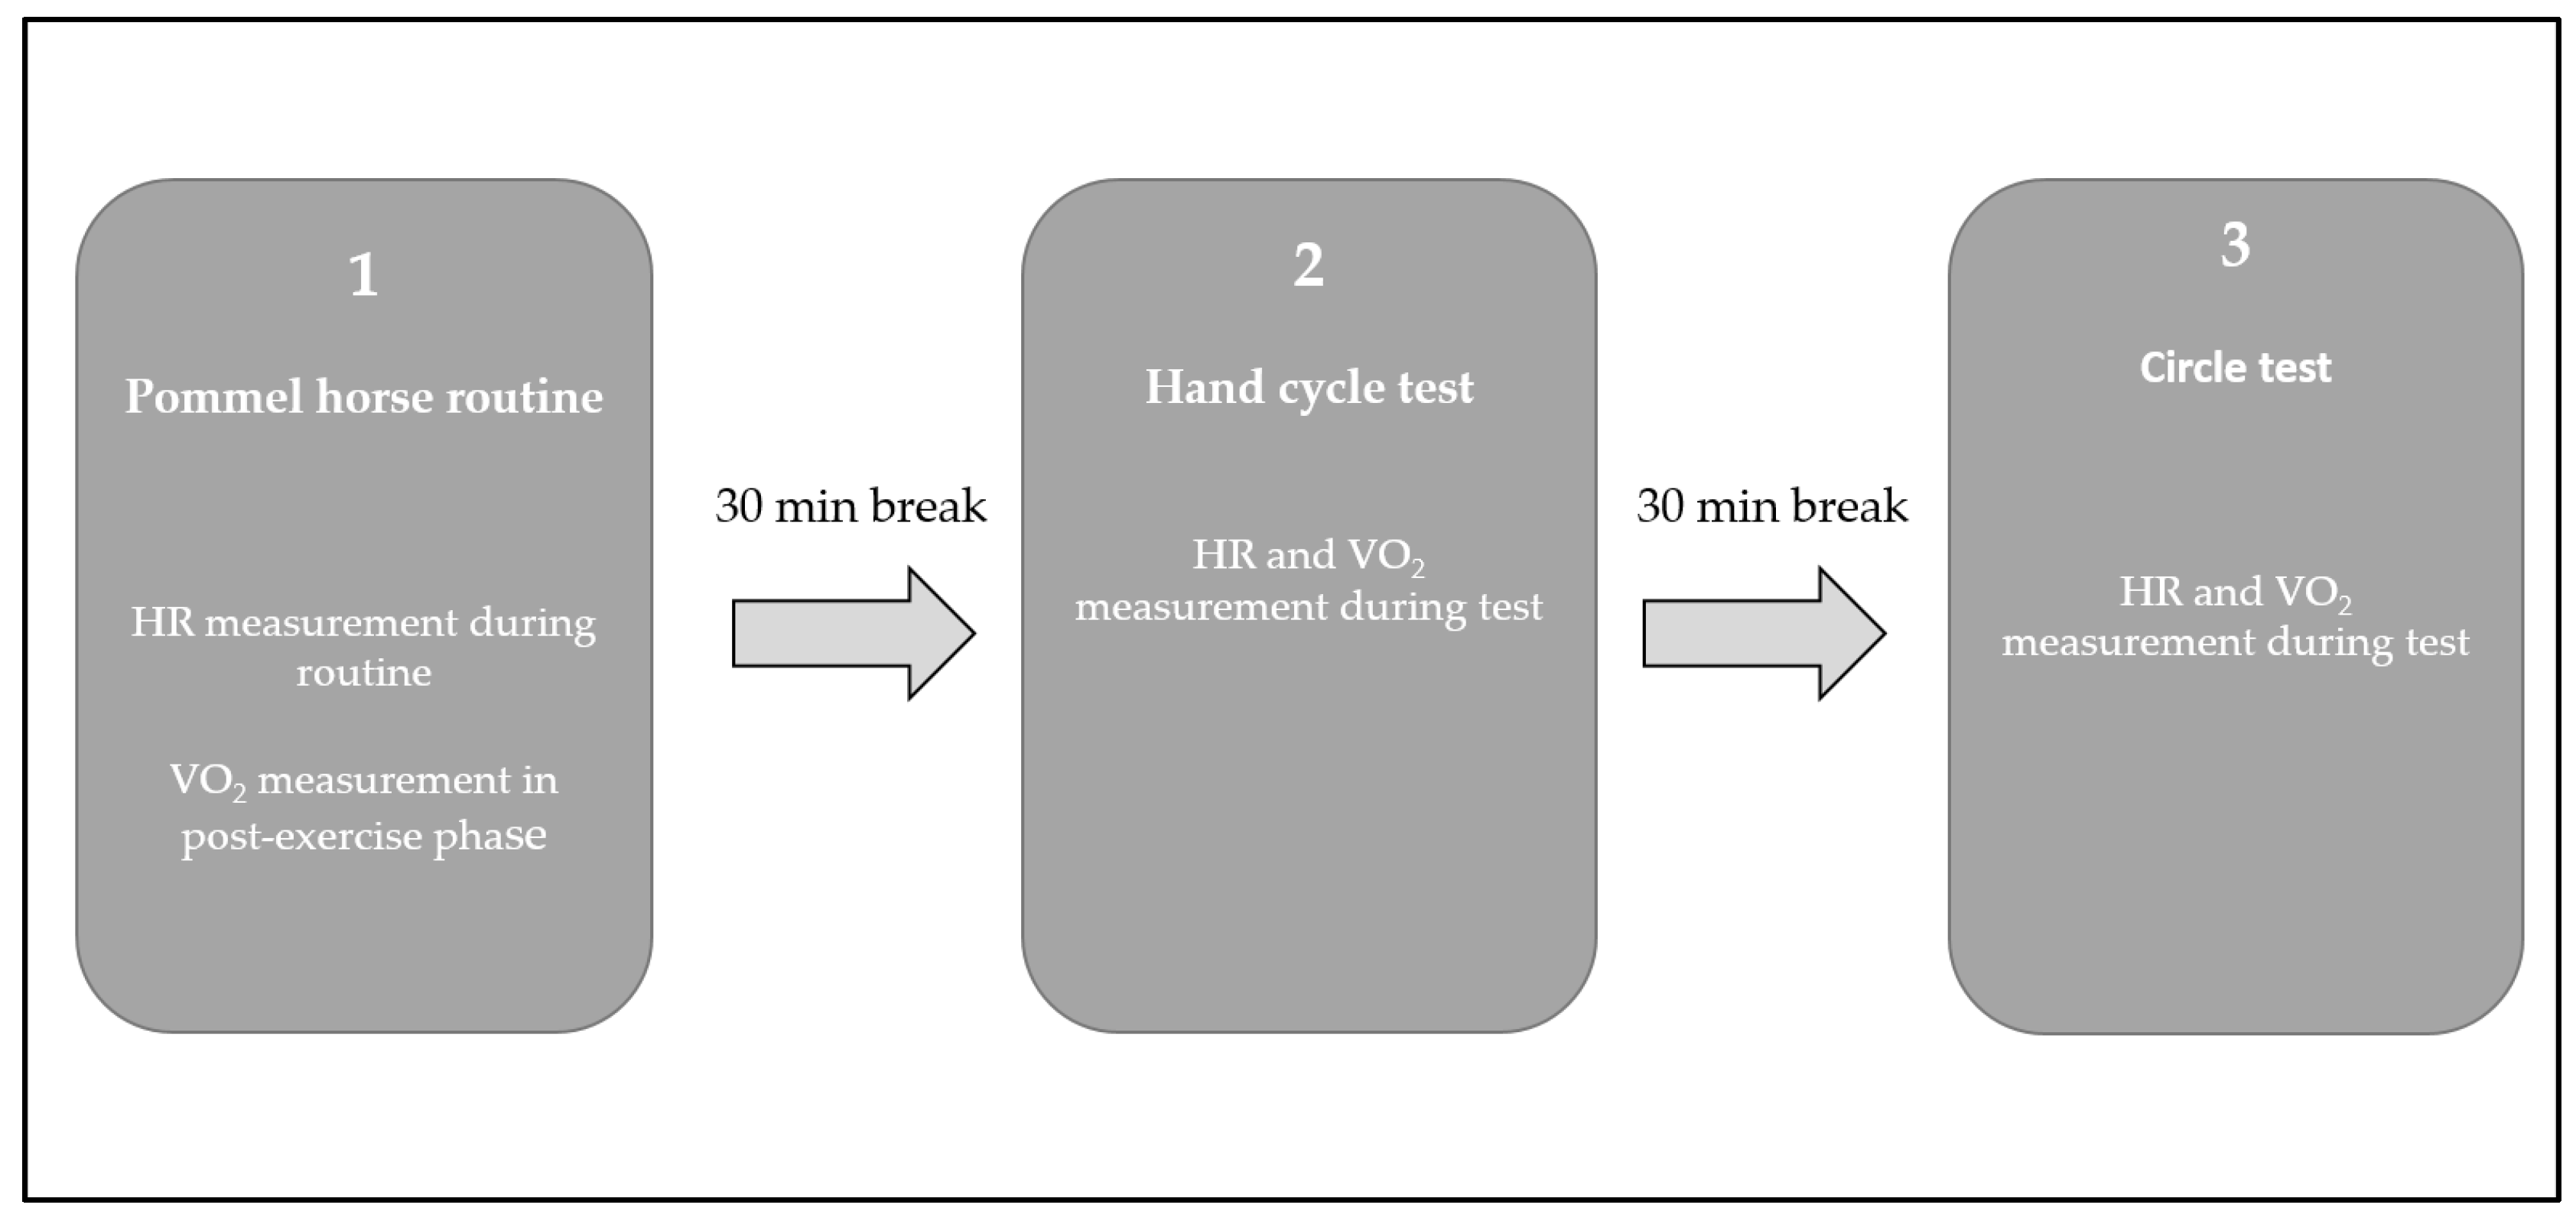
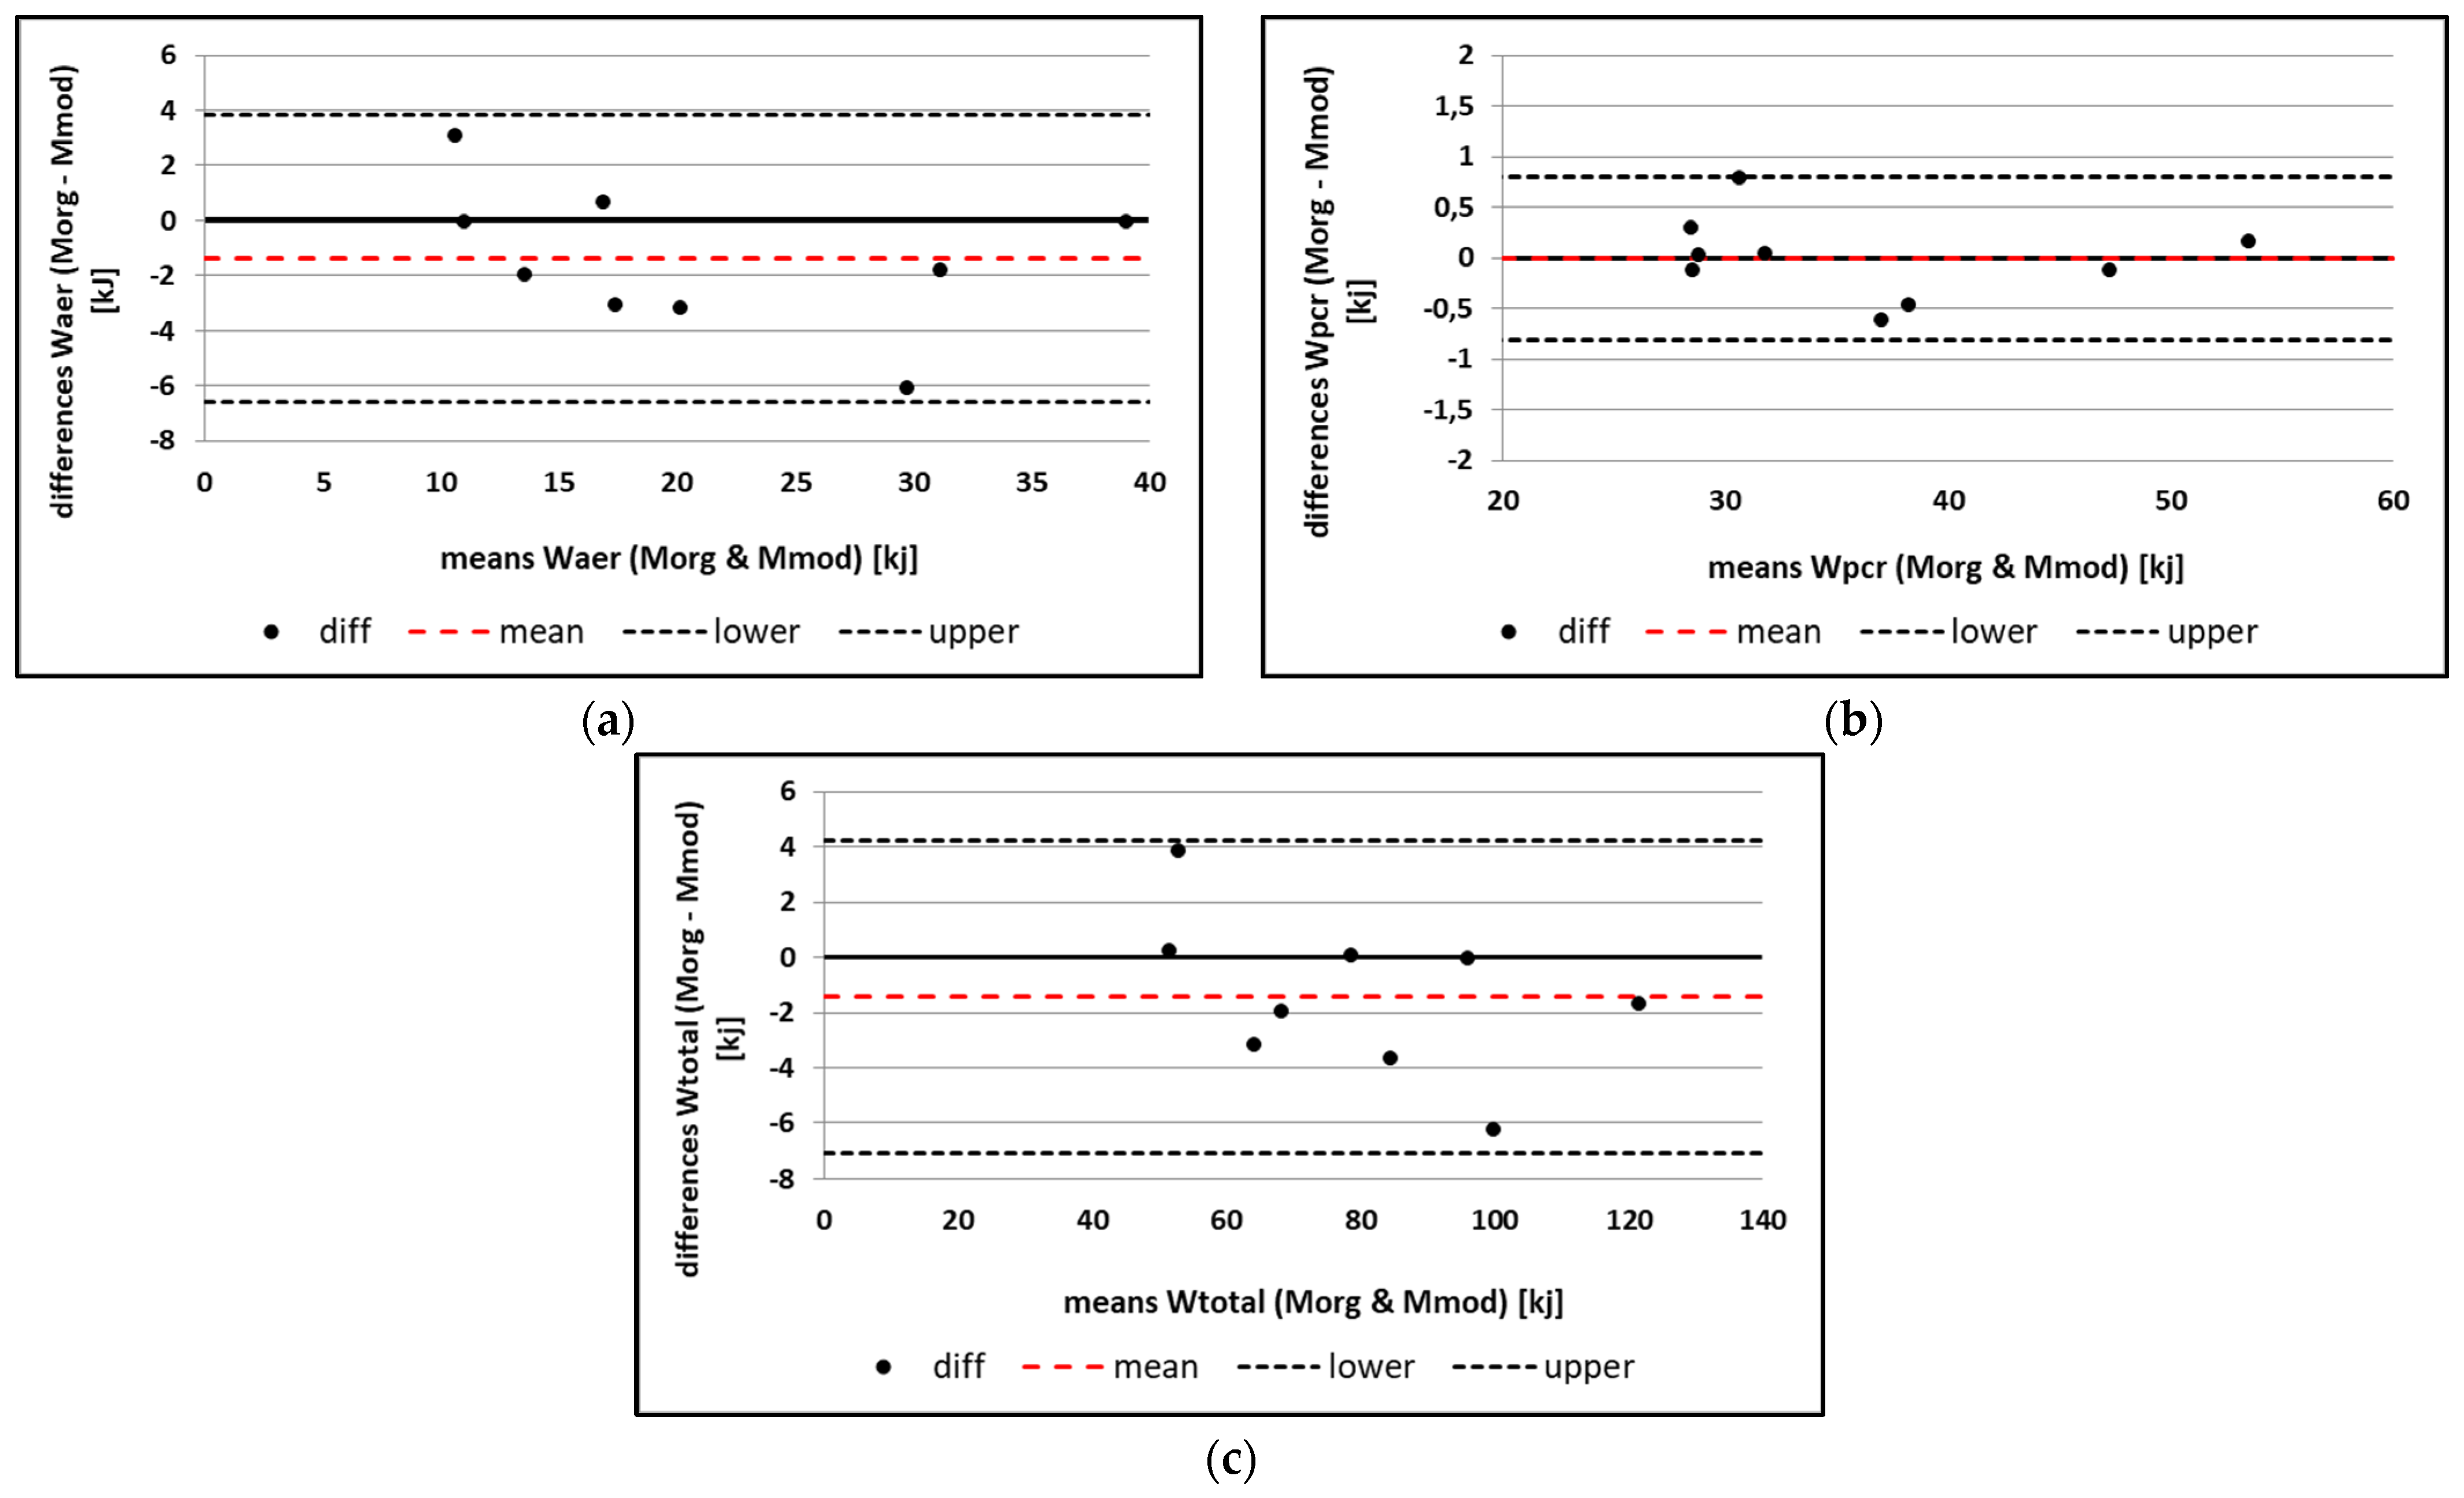
From the Bland-Altman analysis, the mean difference for Waer between Morg and Mmod is −1.396 kJ, with LoA ranging from −6.611 kJ to 3.819 kJ (Figure 2). The SDD is 2.661 kJ (12.63%). For Wpcr, the mean difference is −0.003 kJ with a LoA ranging from −0.811 kJ to 0.806 kJ (Figure 2). The SDD is 0.412 kJ (1.14%). Wtotal shows a mean difference of −1.398 kJ with LoA ranging from −7.047 kJ to 4.251 kJ (Figure 2). The SDD is 2.882 kJ (3.61%).
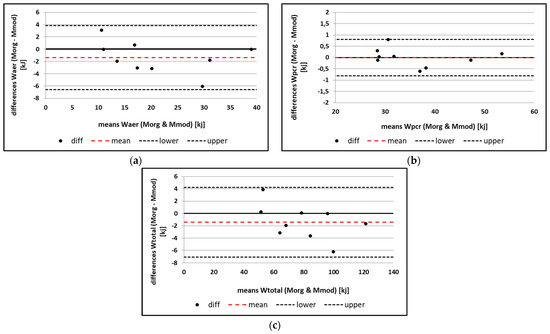
Figure 2.
Bland-Altman analysis for the comparison of (a) Waer; (b) Wpcr, and (c) Wtotal measured using Morg and Mmod (black dashed lines, upper and lower limits of agreement; red dashed line, mean difference between Morg and Mmod).
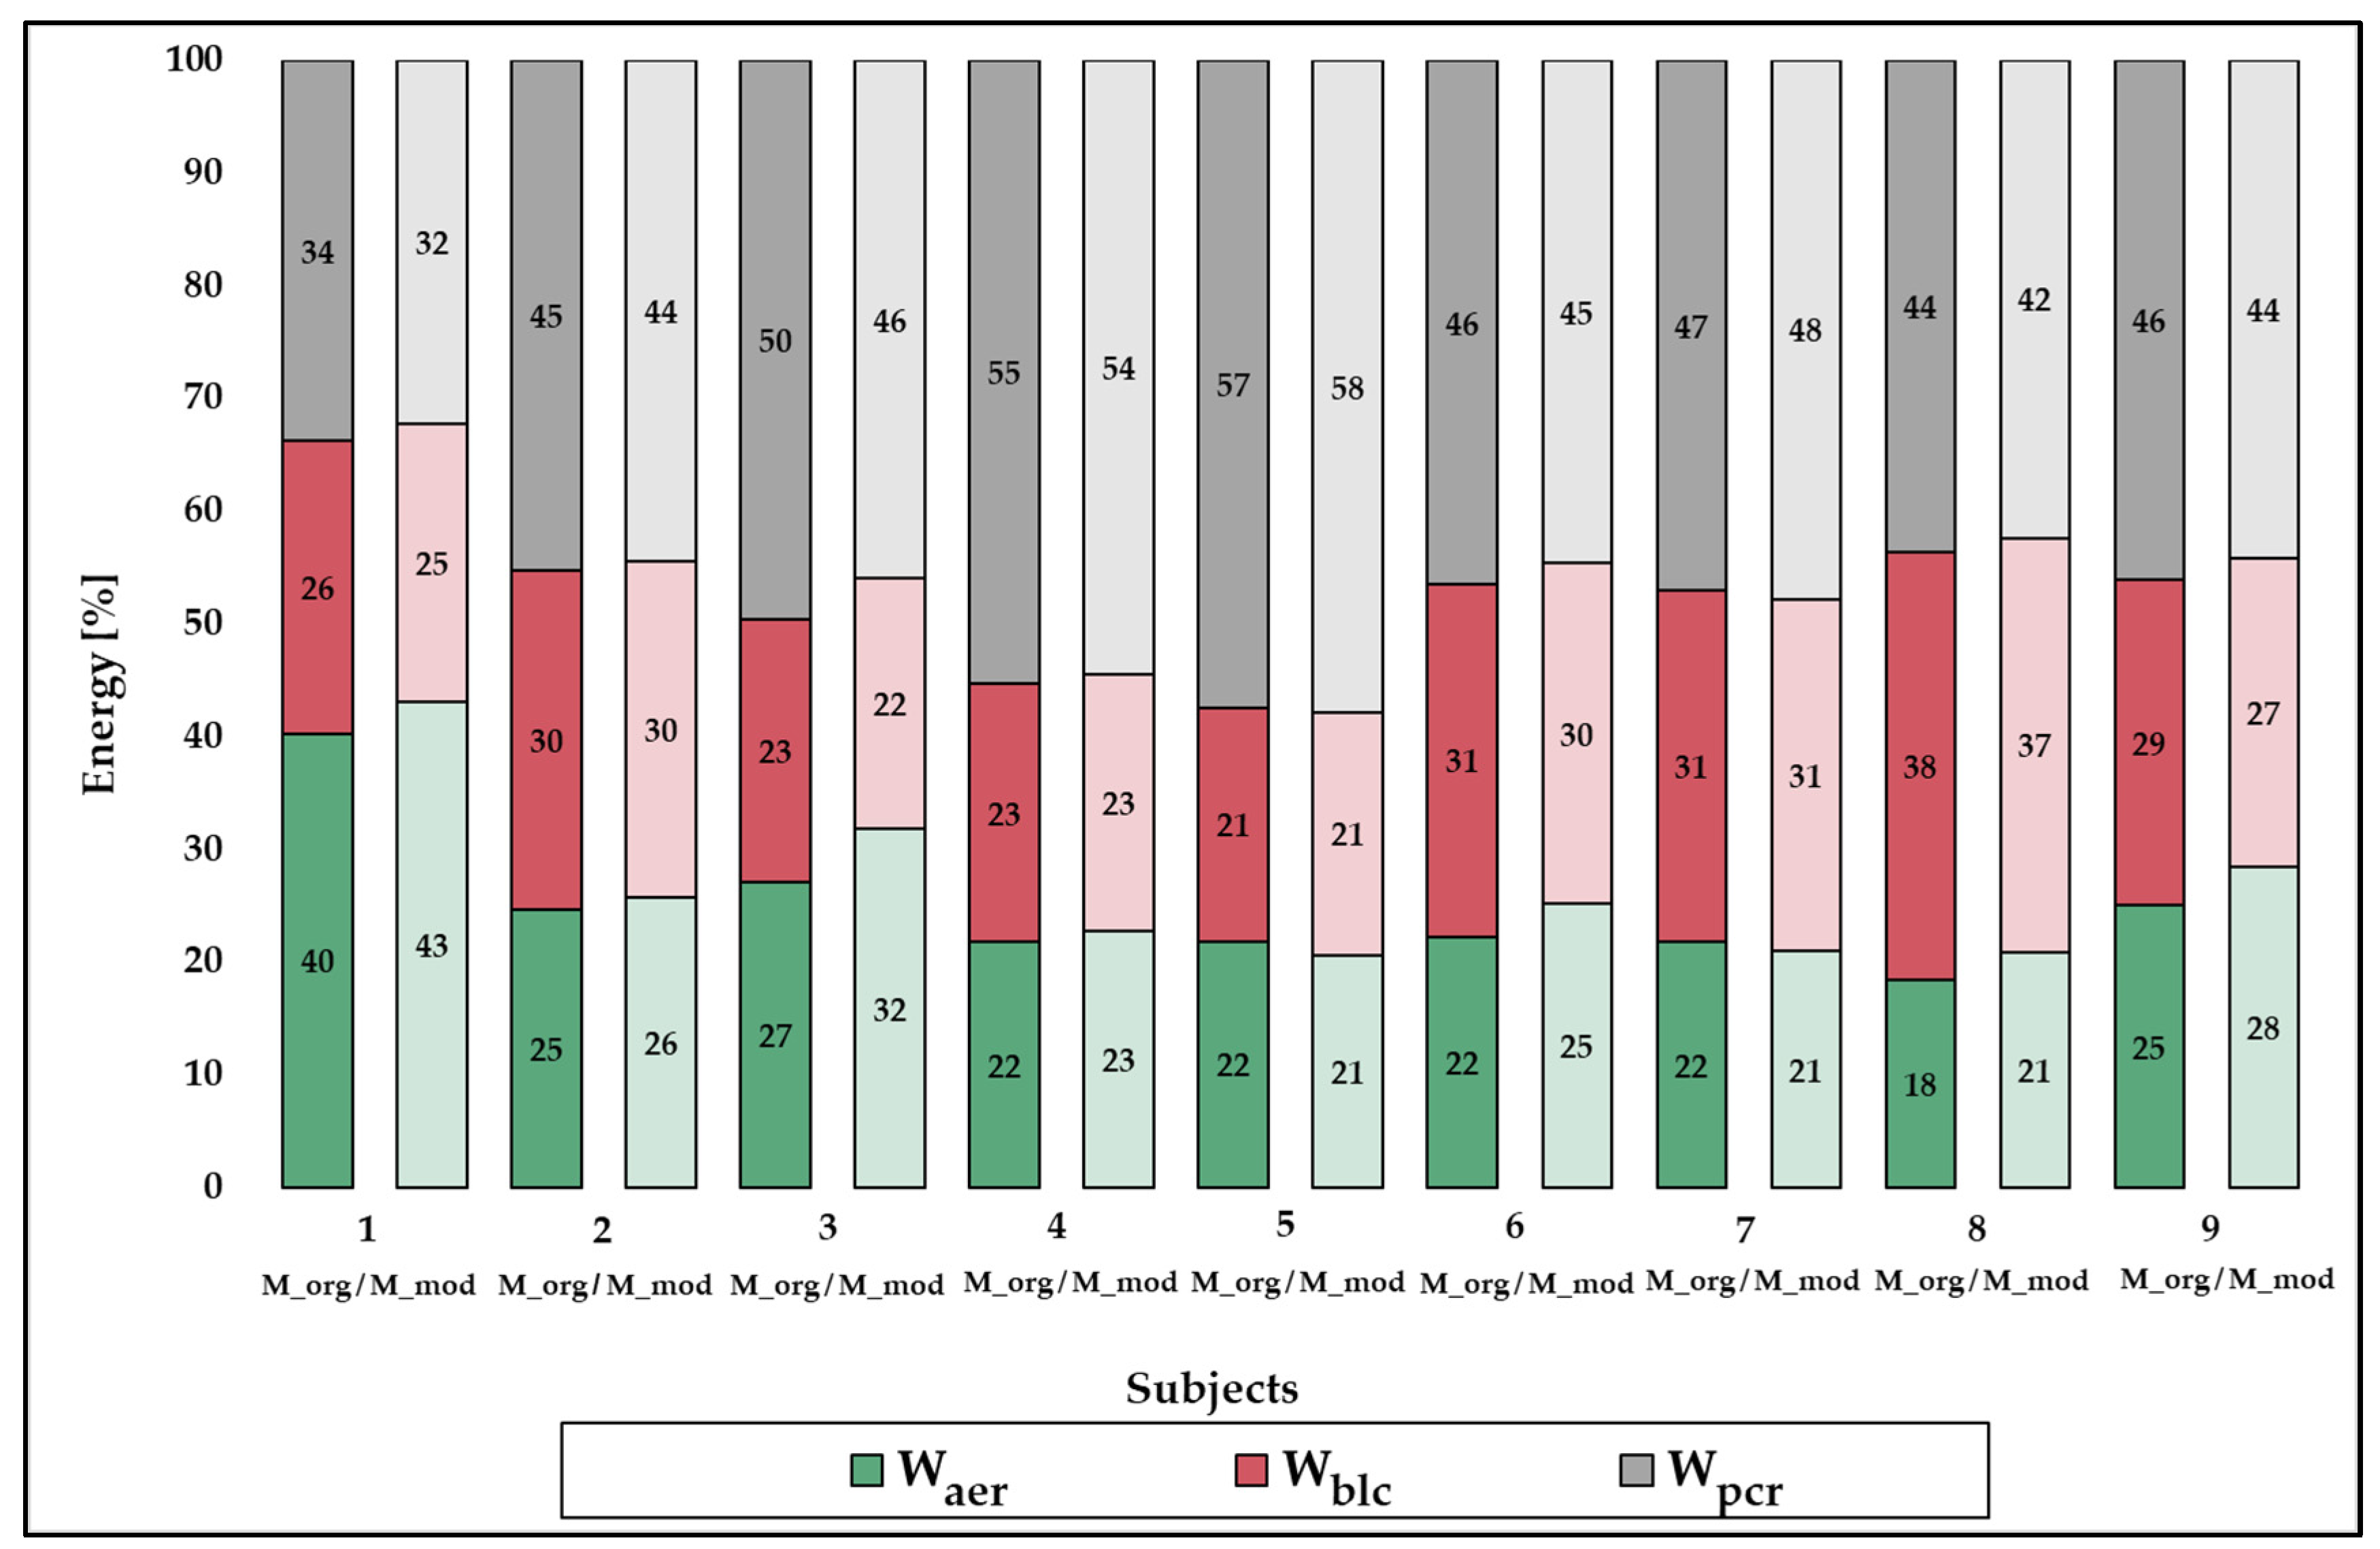
Looking at the individual values of the relative energy contributions measured with Morg and Mmod shows that there are no major differences in the distribution of energy supply (Figure 3). There is a maximum deviation of 5%, whereby the general tendency of the energetic requirements of PH routines remains the same for all tested athletes.
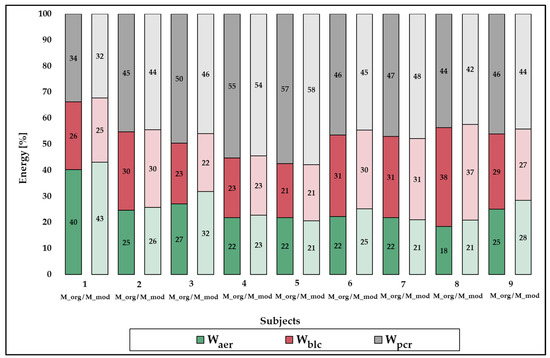
Figure 3.
Individual relative contributions of energy supply during the pommel horse routines of the nine subjects from Part 1 using Morg (dark colours) and Mmod (light colours). Waer indicates energetic contributions from the aerobic energy system; WblcC, energetic contributions from the anaerobic lactic system; Wpcr, energetic contributions from the anaerobic alactic system.
3.2. Part 2: Physiological and Energetic Data of High-Level Pommel Horse Routines
The subjects reached a maximal VO2 of 52.5 ± 4.4 mL·min−1·kg−1, a maximal HR of 189.6 ± 7.3 beats per minute, a maximal blood lactate concentration of 8.8 ± 2.0 mmol·L−1, and an IAT of 11.6. ± 1.3 km/h during the GXT. Table 4 shows the performance and physiological data of the PH routines. Data shows that lower VO2peak and HRpeak values, but higher BLCpeak values, were reached during the PH routines than during GXT. VO2peak and HRpeak of the PH routine are 86.1 ± 12.2% and 90.4 ± 4.8% of the values from the GXT. BLCpeak values reach 90.2 ± 17.4%.
Table 4.
Performance and physiological data of the pommel horse routines.
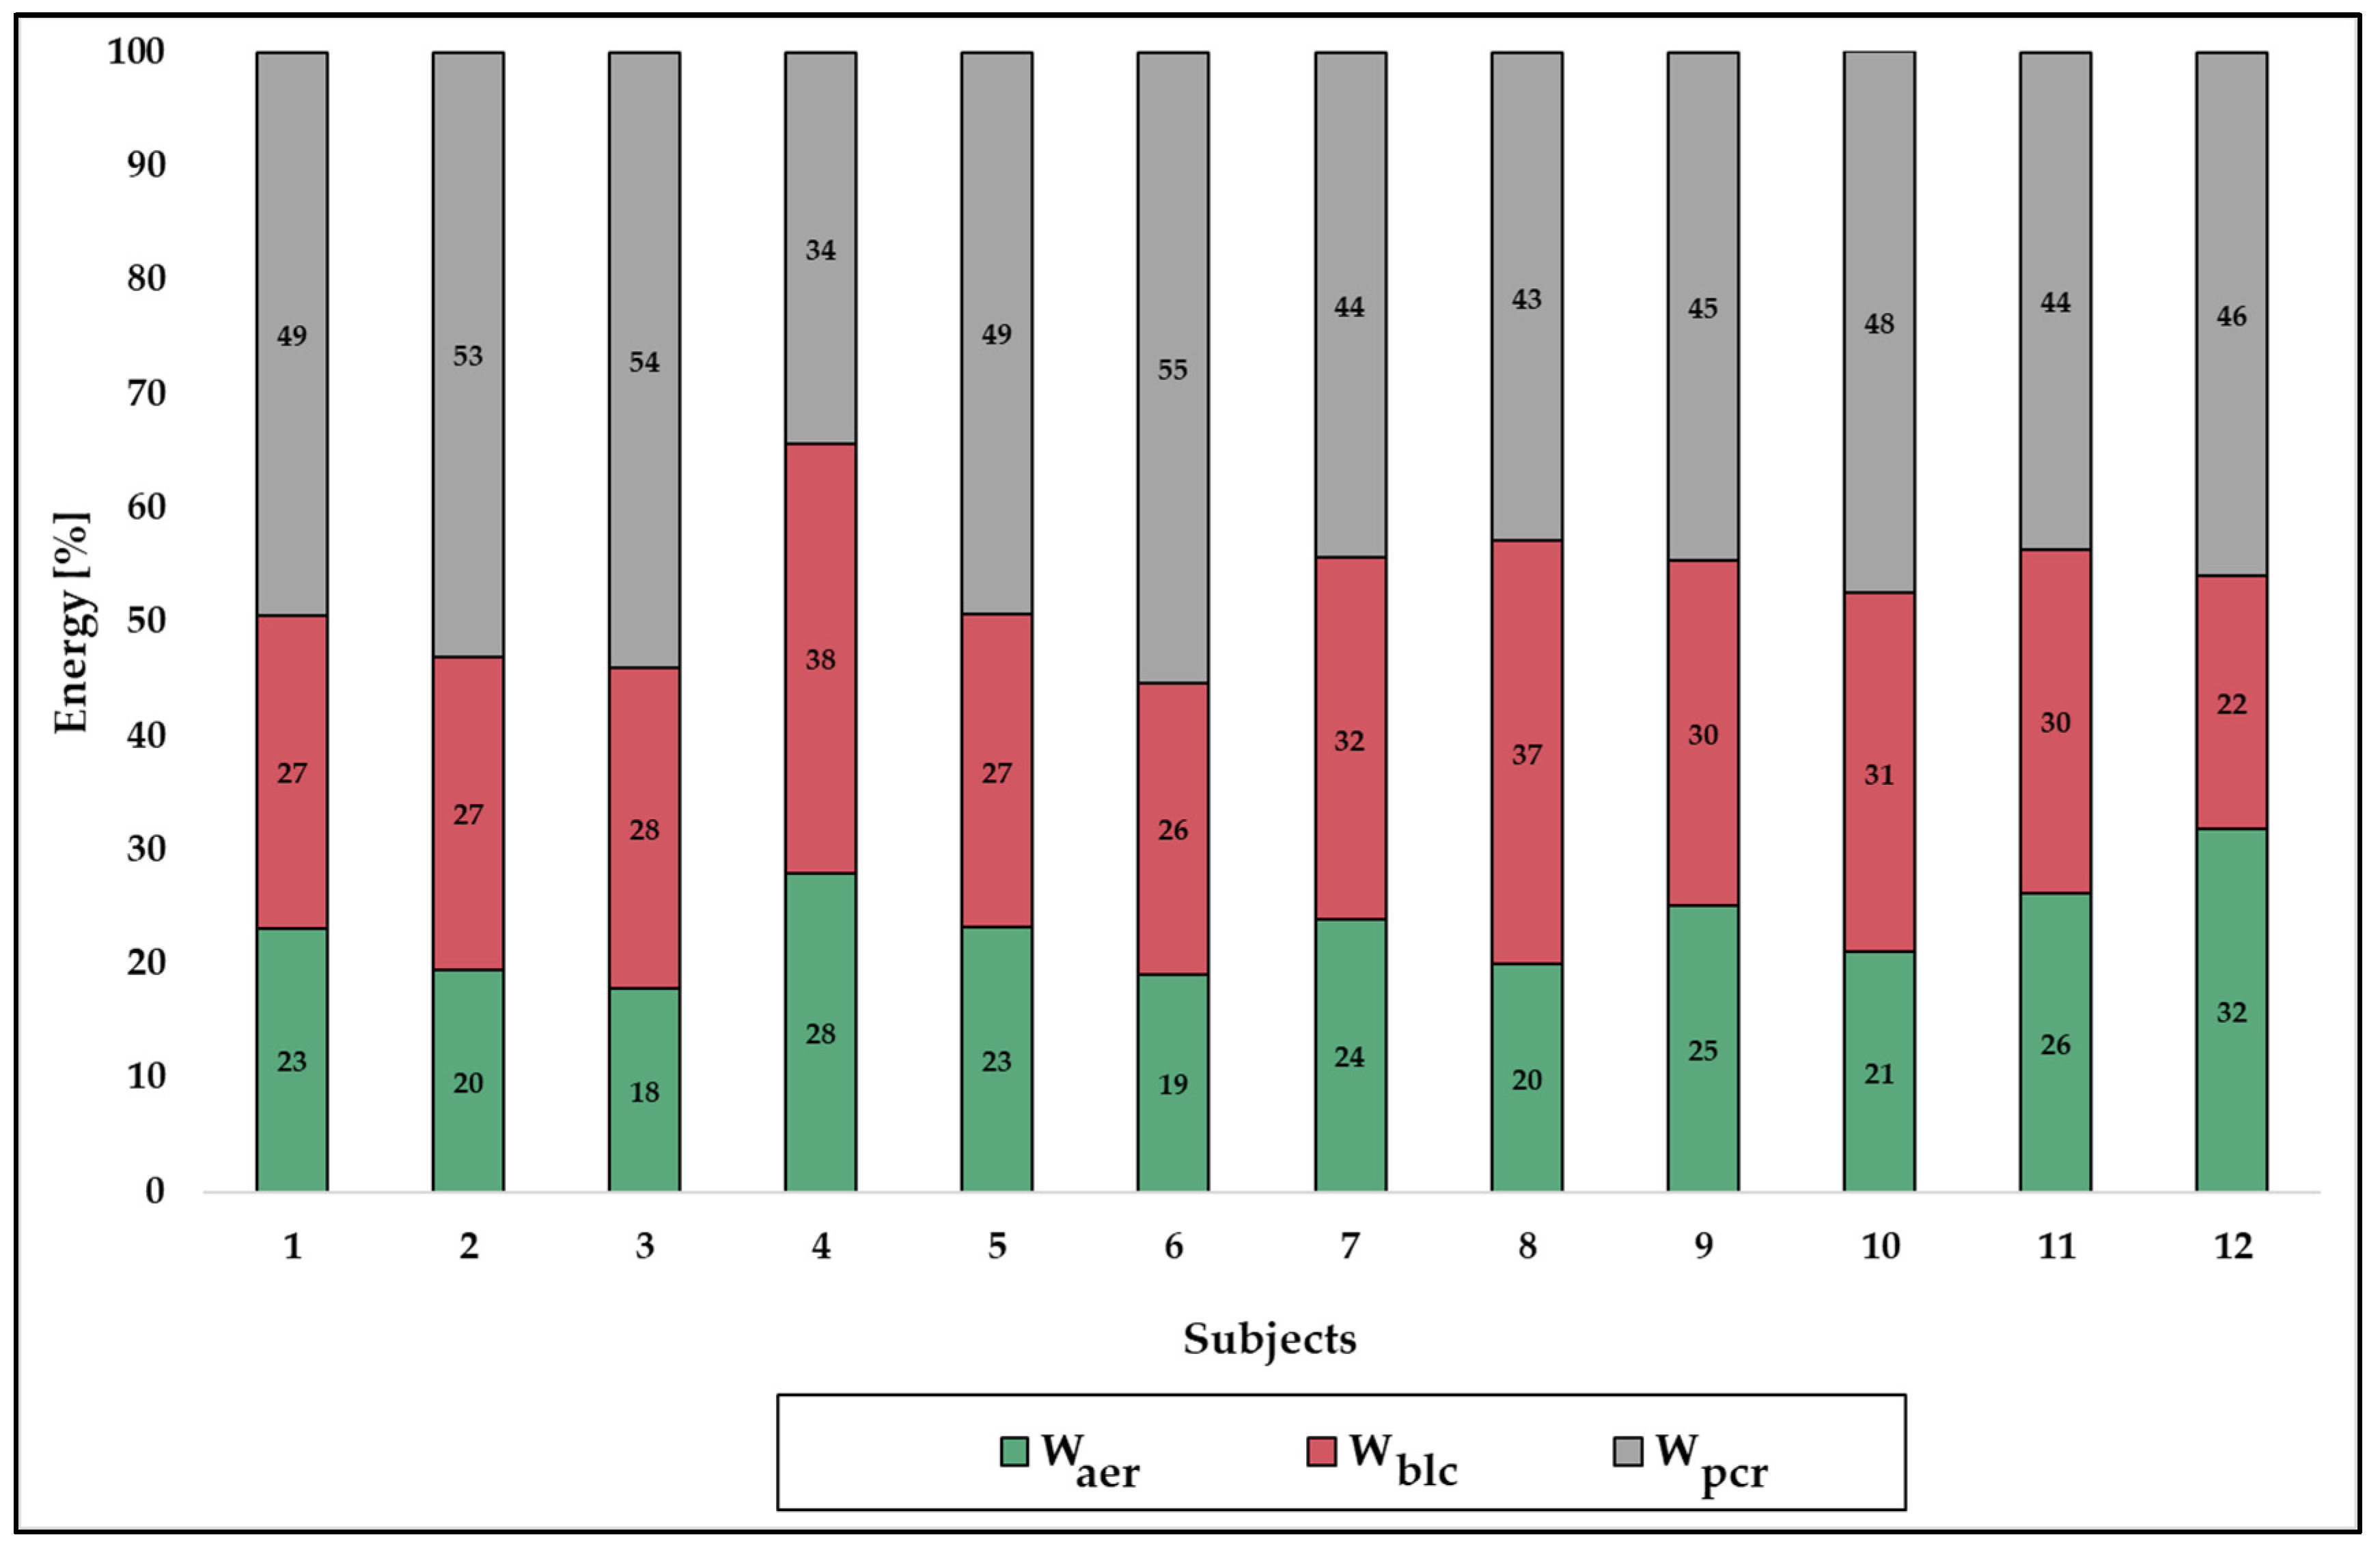
The modelled energy demands of the PH routines as well as the relative energy contributions and metabolic power are shown in Table 5. Figure 4 displays the relative contribution of the energy systems according to each athlete. On the basis of the averaged residual standard error, the goodness of fit for the curve fitting process (R2) for the VO2 post-exercise curve was 0.93 (±0.02).
Table 5.
Absolute energy, relative energy, and metabolic power of the energy systems of the pommel horse routines.
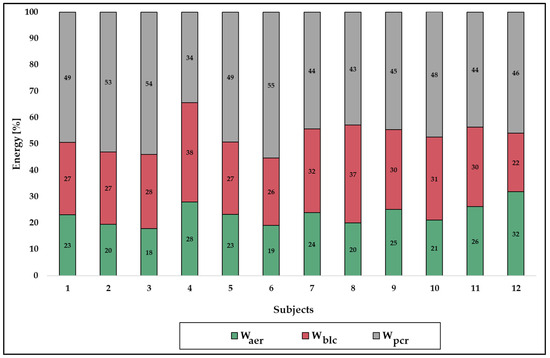
Figure 4.
Individual relative contributions of energy supply during the pommel horse routines of the twelve subjects from Part 2. Waer indicates energetic contributions from the aerobic energy system; Wblc, energetic contributions from the anaerobic lactic system; Wpcr, energetic contributions from the anaerobic alactic system.
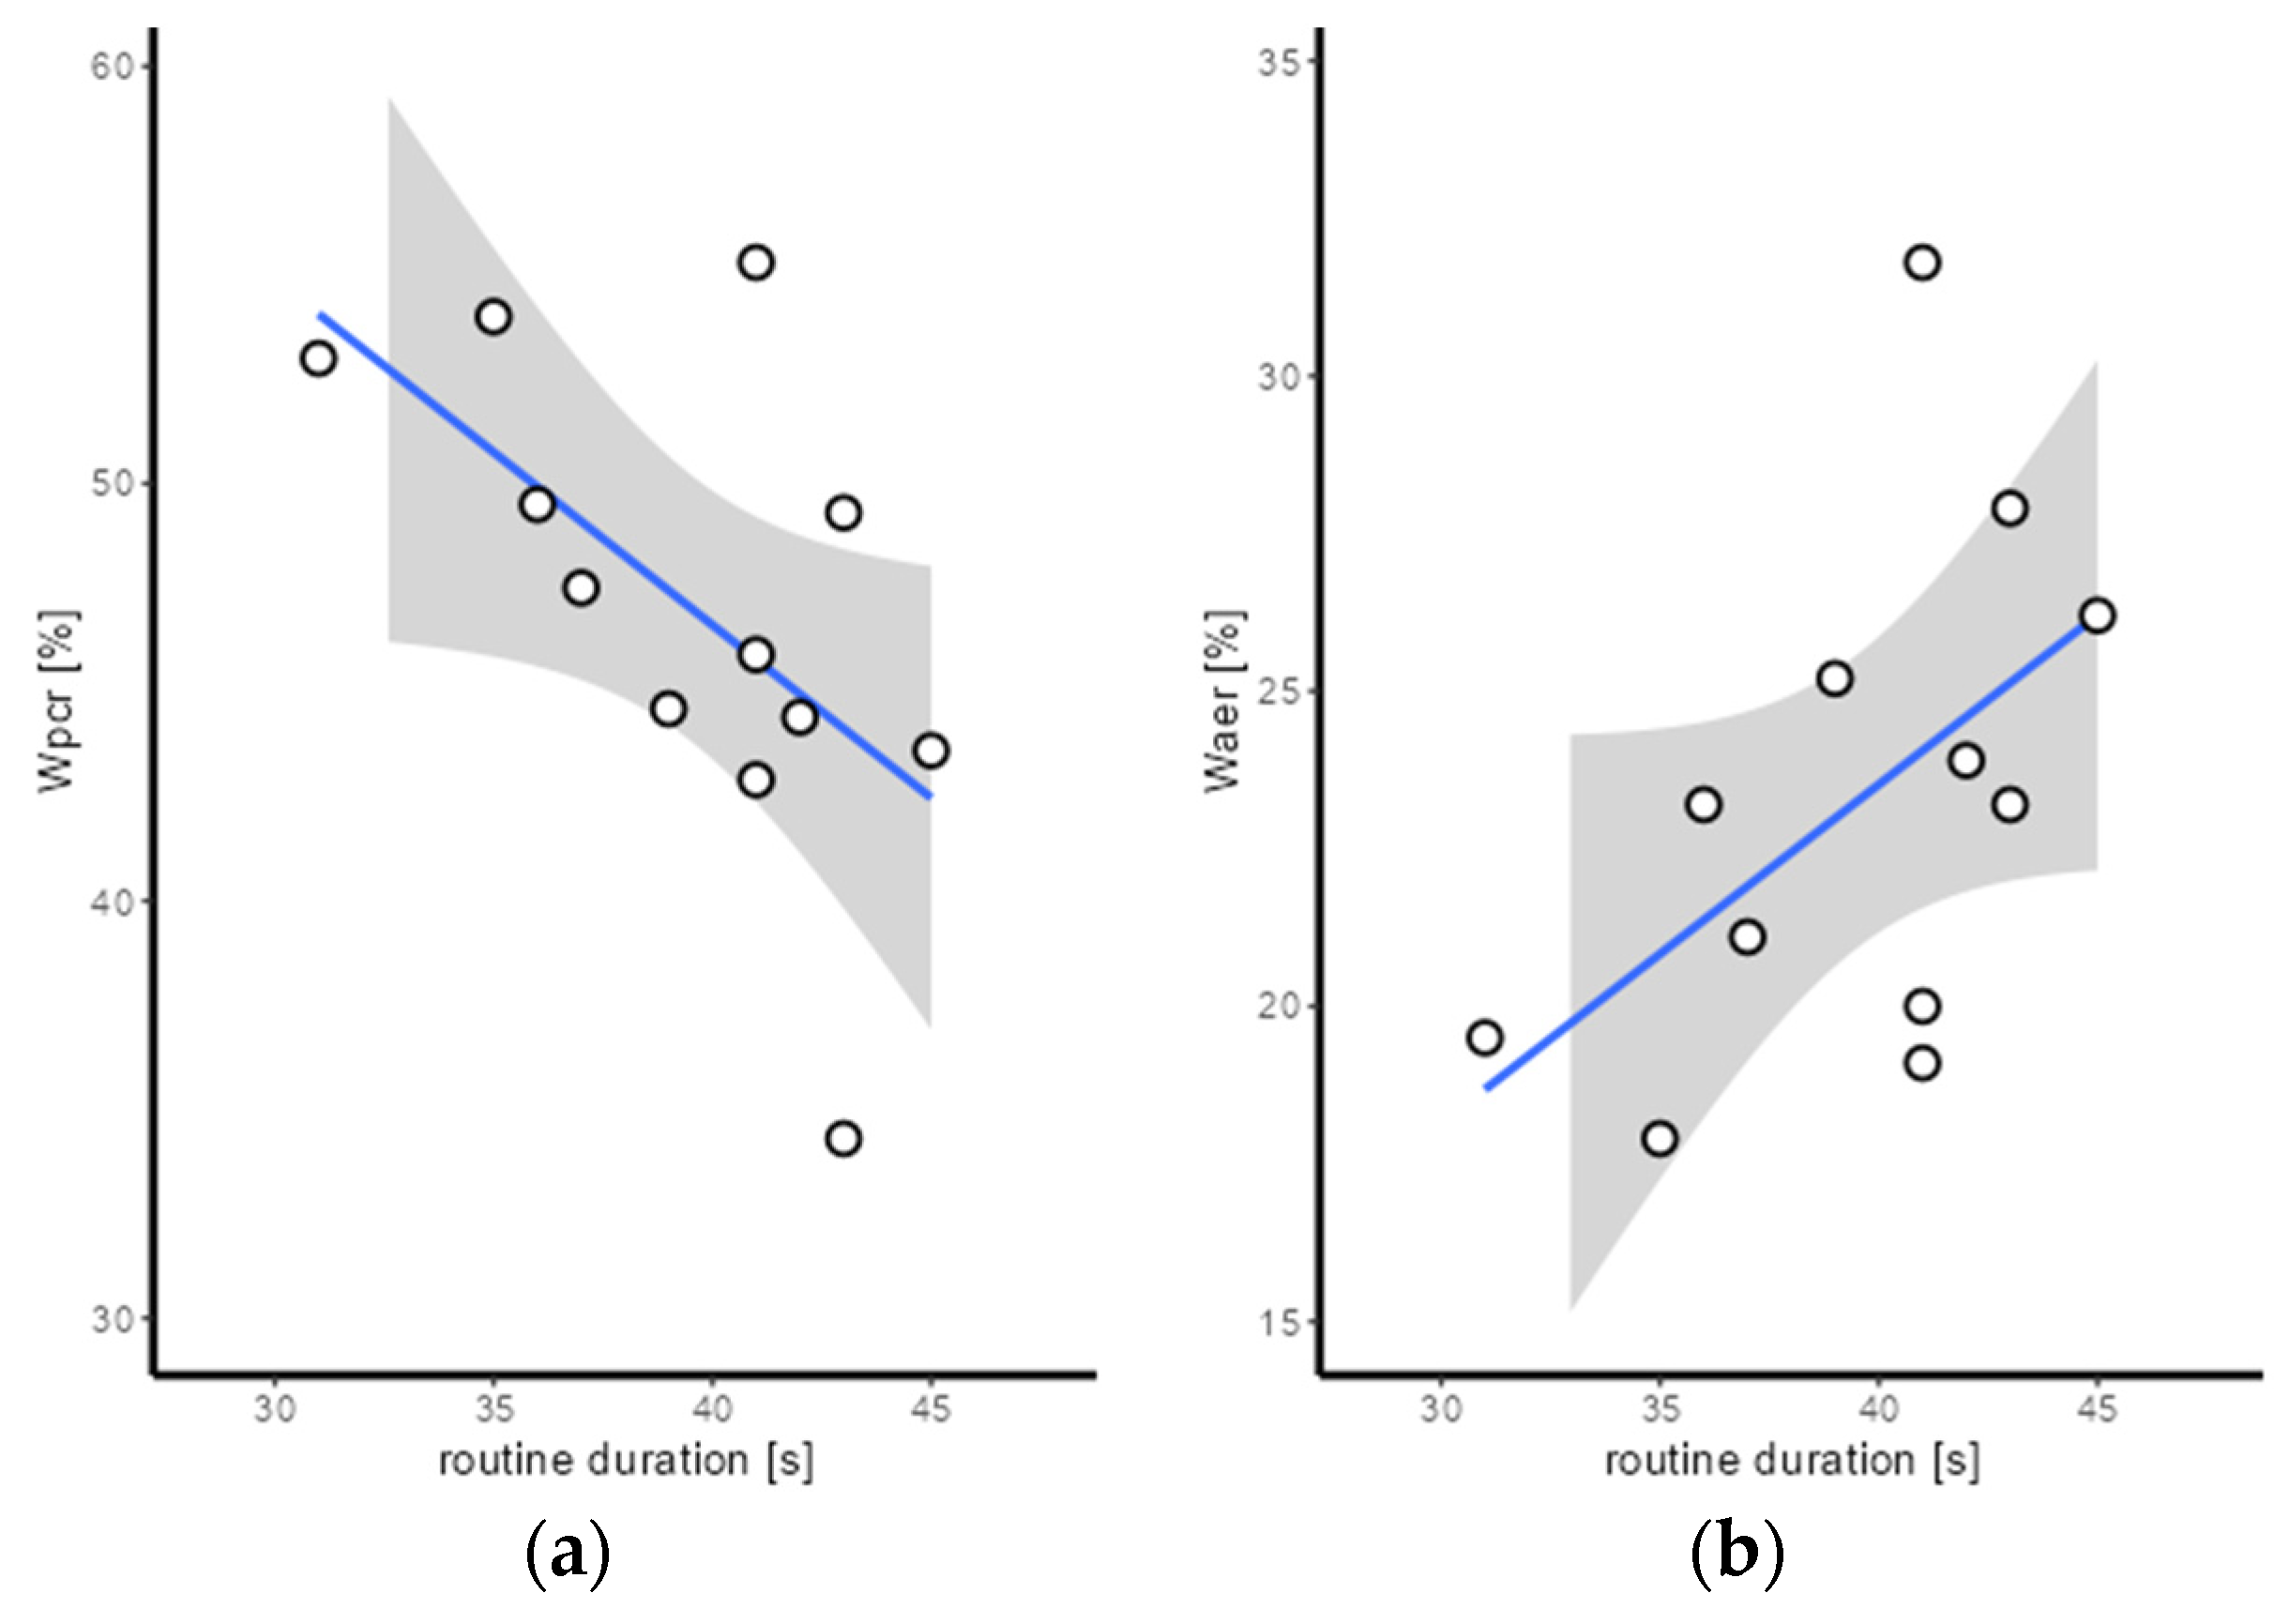
In terms of correlations, there is a significant negative correlation between routine duration and relative Wpcr (r = −0.577; p = 0.05) (Figure 5). No further significant correlations were found between the performance data of the PH routines (duration and difficulty) and the relative energy contributions. However, there is a positive trend between routine duration and relative Waer (r = 0.532; p = 0.075) (Figure 5). Moreover, there is a significant positive correlation between IAT and relative Wpcr (r = 0.726; p = 0.027) and a significant negative correlation between IAT and ΔBLC (r = −0.738; p = 0.023) (Figure 5). Further significant correlations between physiological data from GXT and the relative energy contributions have not been found.
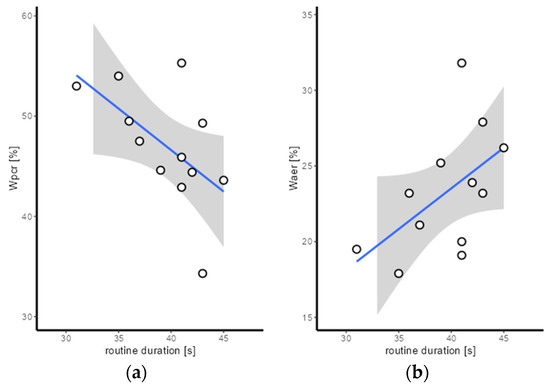
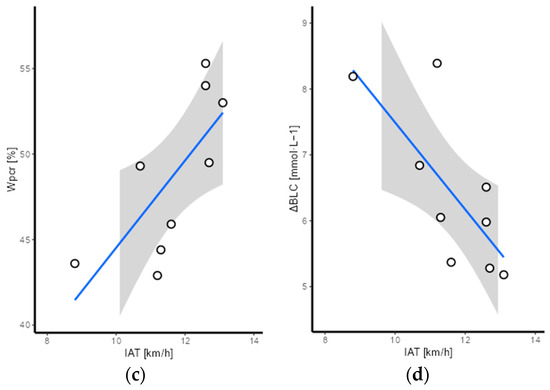
Figure 5.
Scatter plot for the comparison of (a) routine duration and relative Waer; (b) routine duration and relative Wpcr; (c) IAT and relative Wpcr; and (d) IAT and ΔBLC (blue lines, regression line; grey surface, confidence interval on regression line).
4. Discussion
The aim of the present study was (1) to assess the concurrent validity of a Mmod based on individual HR- VO2 functions to determine the energy cost during high-level PH routines and (2) to model the physiological and energetic demands of high-level PH routines in elite artistic gymnasts using the newly developed Mmod. Consistent with our hypothesis (H1), the results show substantial to almost perfect validity for Waer (CCC = 0.955), Wpcr (CCC = 0.999), and Wtotal (CCC = 0.990) using Mmod. All three parameters did not show any constant or proportional bias. These results are in line with those of Baiget, Iglesias, and Rodriguez [15] and Scribbans, Berg, Narazaki, Janssen, and Gurd [16], who also demonstrated that energy costs and VO2 values can be determined sufficiently validly for intermittent acyclic exercise using HR- VO2 relationship functions. Earlier studies regarding energy costs on PH, which were also based on individual HR- VO2 relationships, did not compare the results with direct VO2 measurements during the routines [28]. Therefore, no statement on the validity of such a method on PH could be made so far. Also, no PH-specific adaptation of the HR- VO2 relationship function was carried out in the earlier studies. In the present study, the random error of Waer is 12.6%, that of Wpcr is 1.1%, and that of Wtotal is 3.6%. One possible reason for this error could be differences in the VO2 and HR kinetics, since VO2 recovers faster and more completely than HR during periods of low intensity [19]. Another error could be the emotional stress prior to the routines, which increases HR above metabolic requirements at the onset of the routine (HR sympathetic drive) [15]. The problem of increased HR can be seen in subject 3 in Figure 2 (also the outlier in the Bland Altman plots) and leads to an increase in the random errors of Mmod. Removing this athlete from the analysis would result in a random error of 10.6% for Waer, 1.3% for Wpcr, and 3.1% for Wtotal. For future studies, one way to minimise this source of error would be to define a maximum pre-start HR value for each athlete based on individual HR reference values. Despite the aforementioned limitations, the Mmod offers the possibility of modelling the energetic demands, including the calculation of the energy costs of the individual metabolic pathways as well as the modelling of the physiological demands during high-level PH routines. This is shown in Figure 2, where no major difference in the relative energy contributions between the Morg and Mmod can be observed. Modelling the energetic and physiological demands of high-level PH routines has, to our knowledge, not been performed so far and thus provides further important information for gymnastics-specific muscular endurance performance.
Looking at the performance and physiological data of the PH routine studied, the achieved HRpeak values are slightly higher than those of French elite gymnasts, while the BLCpeak values are at similar levels [13]. Comparing the values with those of other apparatus or similar sports shows that the HRpeak values are similar to those on still rings (172 bpm) or indoor climbing (181 bpm), while the BLCpeak values are higher (still rings 6.1 mmol·L−1; indoor climbing 3.8 mmol·L−1) [5,7].This could be due to the more cyclic movement pattern of the PH routines. The VO2peak values modelled for the first time also correspond to those of still-ring routines but are higher than those for indoor climbing [5,7]. The achieved VO2peak and HRpeak correspond to 86.1 ± 12.2% and 90.4 ± 4.8% of the values from the GXT and confirm the intensive stress on the cardiopulmonary system in MAG [5,13].
The modelled energetic demands show that Wpcr provides 47.0%, Wblc 29.7%, and Waer 23.3% of the total energy required for high-level PH routines. Thus, the results confirm the hypothesis (H2) that Wpcr provides the largest energy contribution and contradict previous assumptions of a dominant anaerobic lactic metabolism on PH. The increase in peak power observed in gymnasts over the last four decades [29] may have influenced this result. Peak power and anaerobic alactic capacity seem to be key components of the physiological profile of elite gymnasts [5,29]. However, when Wpcr and Wblc are combined, PH routines are mainly anaerobic, which is in line with previous assumptions [14]. This anaerobic dominance could also be confirmed on still rings [5]. With 23.3%, the hypothesis of a 30–40% relative energy supply by Waer, which would have been expected due to the routine duration [12], cannot be confirmed. This is in line with results on still rings and indoor climbing, where the modelled relative Waer was also slightly lower than the expected Waer [5,7]. It seems that in mainly upper-body short-duration acyclic sports with highly explosive movements and high technical focus, routine duration has limited validity as a predictor of relative Waer. As the upper limbs have a greater proportion of type II fibres [30] and slower VO2 kinetics than the lower limbs [31], the main use of upper limb muscles could explain the lower use of the aerobic system. Nevertheless, with 23.3%, Waer is not insignificant and should be trained specifically. Especially since the aerobic energy supply on PH increases with increasing routine duration [14]. This is also indicated by the positive trend between routine duration and relative Waer observed in this study. Improved aerobic power could, for example, reduce high lactate accumulation and associated muscular fatigue during the PH routine. This fact has also been shown in still rings or ballet routines, where an increase in aerobic power reduces relative Wblc [5,32]. In this study, there was no significant correlation between aerobic power and relative Wblc, so the hypothesis (H3) cannot be confirmed. Only a moderate negative trend between IAT and relative Wblc was observed. However, there was a significant negative relationship between IAS and ΔBLC. This suggests that improved aerobic power can reduce lactate accumulation during PH routines.
The modelled metabolic profile and metabolic power of PH routines differ slightly compared with metabolic profiles on floors, still rings, or other short-duration acyclic sports. Compared with still rings and indoor climbing, relative Wblc is higher (still rings 20.5%; indoor climbing 13.8%), while relative Wpcr and Waer are slightly lower (still rings 50.9% and 28.6%; indoor climbing 42.4% and 43.8%). This could be due to the slightly different movement structure and routine duration. PH routines have a more cyclic character and a shorter routine duration, which favours anaerobic lactic energy supply. Still rings routines and indoor climbing, on the other hand, are characterised by intermittent static movements and small breaks between elements or climbing moves, as well as a longer routine duration, which tends to favour anaerobic, alactic, and aerobic metabolism. On the floor, Waer is the dominant energy source (54.4%), while Wblc (18.9%) provides the lowest energy share. The aforementioned slower VO2 kinetics of the upper body and the higher proportion of type II fibres, as well as the significantly shorter routine duration of the PH routine, could be responsible for these differences. Metabolic power is 34.80 ± 3.49 W · kg−1, higher than on still rings (30.7 ± 4.8 W · kg−1) or on floor (21.9 W · kg−1), but significantly lower than on a 30s Wingate test (58.0 ± 5.4 W · kg−1) [4]. This also shows that a shorter routine duration and a more cyclic movement profile can influence metabolic power. Further study on the metabolic profiles of other gymnastics apparatuses could provide more information. Moreover, the already-mentioned estimates of energetic demands based on routine duration and BLC could be verified.
When interpreting the results, however, the following limitations of the study must be taken into account. The experimental process was routine in a simulated competition and was carried out with a small sample size. Therefore, the available data should be compared with future studies. A further limitation is that, in addition to aerobic power (VO2peak), no anaerobic power of the athletes was measured. Differences in anaerobic power could influence the energy supply and be a reason for the individual differences in the energy demands of the athletes. In addition, no data were collected concerning the muscle and fat mass of the athletes, as this was not part of the general medical check-up of the athletes. Considering that a higher contracting muscle mass increases the total amount of ATP-PCr [33], the anaerobic alactic energy fraction could have been influenced by a different muscle mass. Therefore, due to the possible influence of muscle mass and the anaerobic power of the athletes, the general validity of the results should be considered with caution. On the other hand, this offers a perspective for further studies: How do anaerobic performance and muscle mass affect the energetic demands of high-level PH routines?
5. Conclusions
To our knowledge, this is the first study modelling the energetic and physiological demands of high-level PH routines using a Mmod based on HR- VO2 relationship functions. The Mmod was found to be a practicable and valid method for this purpose. The determined physiological demands show that high-level PH routines with 86.1 ± 12.2% of VO2max and 90.4 ± 4.8% of HRmax place high demands on the aerobic and cardiovascular systems. The calculated metabolic profile differs from previous assumptions in the literature. The anaerobic alactic and, not as previously assumed, the anaerobic lactic metabolic pathways represent the dominant energy source during high-level PH routines. Thus, peak power as well as anaerobic alactic capacity seem to be key components of the physiological profile of elite gymnasts. The aerobic metabolism provides a substantial part of the total energy and should therefore also be specifically trained. Especially as its energy share seems to increase with increasing routine duration. The demonstrated positive correlation between IAT and ΔBLC shows that a higher aerobic power (and thus also a higher IAT) can lead to further benefits. A higher IAT could reduce excessive lactate accumulation and minimise the associated muscular fatigue during high-level PH routines. Future studies could examine whether an improved IAT also has a positive effect on the other apparatus and possibly identify the IAT as another key component of the physiological profile of elite gymnasts.
Author Contributions
Conceptualization, A.S.-S., P.R. and F.N.; Data curation, A.S.-S. and T.G.; Formal analysis, A.S.-S.; Investigation, A.S.-S. and P.R.; Methodology, A.S.-S., P.R. and I.S.; Supervision, I.S., F.N. and B.W.; Writing—original draft, A.S.-S.; Writing—review and editing, T.G., I.S., F.N. and B.W. All authors have read and agreed to the published version of the manuscript.
Funding
This research received no external funding.
Institutional Review Board Statement
The study was conducted in accordance with the guidelines set in the Declaration of Helsinki and approved by the Ethics Committee of the Faculty of Cultural, Social and Educational Sciences of the Humboldt University of Berlin (HU-KSBF-EK_2019_0017).
Informed Consent Statement
Informed consent was obtained from all subjects involved in the study.
Data Availability Statement
The data used to support the findings of this study are available from the corresponding author upon request. The data are not publicly available due to ethical restrictions.
Acknowledgments
This study was funded by the German Federal Ministry of the Interior and Community and was supported by a decision of the German Bundestag. The authors thank the athletes for their participation in the study. The article processing charge was funded by the Deutsche Forschungsgemeinschaft (DFG, German Research Foundation)—491192747 and the Open Access Publication Fund of Humboldt-Universität zu Berlin.
Conflicts of Interest
The authors declare no conflicts of interest.
References
- Brueggemann, G.-P.; Hume, P.A. Biomechanics related to injury. In Handbook of Sports Medicine and Science: Gymnastics; Caine, D.J., Russell, K., Lim, L., Eds.; John Wiley & Sons: Hoboken, NJ, USA, 2013; pp. 63–74. [Google Scholar]
- Jemni, M. Energetics of gymnastics. In The Science of Gymnastics, 2nd ed.; Jemni, M., Ed.; Routledge: Abingdon, UK, 2018; pp. 5–23. [Google Scholar]
- Seemann-Sinn, A.; Brehmer, S.; Naundorf, F.; Wolfarth, B. Development of the routine duration in artistic gymnastics from 1997 to 2019. Int. J. Perform. Anal. Sport 2021, 21, 250–262. [Google Scholar] [CrossRef]
- Kaufmann, S.; Ziegler, M.; Werner, J.; Noe, C.; Latzel, R.; Witzany, S.; Beneke, R.; Hoos, O. Energetics of floor gymnastics: Aerobic and anaerobic share in male and female sub-elite gymnasts. Sports Med. 2022, 8, 3. [Google Scholar] [CrossRef] [PubMed]
- Seemann-Sinn, A.; Rudrich, P.; Gorges, T.; Naundorf, F.; Wolfarth, B. Physiological and energetic demands during still-rings routines of elite artistic gymnasts. Int. J. Sports Physiol. Perform. 2023, 18, 704–710. [Google Scholar] [CrossRef] [PubMed]
- Julio, U.F.; Panissa, V.L.; Esteves, J.V.; Cury, R.L.; Agostinho, M.F.; Franchini, E. Energy-system contributions to simulated judo matches. Int. J. Sports Physiol. Perform. 2017, 12, 676–683. [Google Scholar] [CrossRef] [PubMed]
- Bertuzzi, R.C.d.M.; Franchini, E.; Kokubun, E.; Kiss, M.A.P.D.M. Energy system contributions in indoor rock climbing. Eur. J. Appl. Physiol. 2007, 101, 293–300. [Google Scholar] [CrossRef]
- Guidetti, L.; Baldari, C.; Capranica, L.; Persichini, C.; Figura, F. Energy cost and energy sources of ball routine in rhythmic gymnasts. Int. J. Sports Med. 2000, 21, 205–209. [Google Scholar] [CrossRef] [PubMed]
- Solcanu, M.; Bidiugan, S.; Corlaci, I. Specific demands of the effort on the pommel horse in artistic gymnastics. In Eur. Proc. Soc. Behav. Sci.; 2019; Volume 55, pp. 215–224. [Google Scholar]
- Fédération Internationale de Gymnastique. 2022–2024 Code of Points Men’s Artistic Gymnastics; Fédération Internationale de Gymnastique: Lausanne, Switzerland, 2020. [Google Scholar]
- Seemann-Sinn, A.; Rüdrich, P.; Naundorf, F.; Wolfarth, B. Modifiziertes Verfahren zur Bestimmung der Energiebereitstellung bei Pauschenpferdübungen. Dtsch. Z. Sport. 2021, 72, 90. [Google Scholar]
- Gastin, P.B. Energy system interaction and relative contribution during maximal exercise. Sports Med. 2001, 31, 725–741. [Google Scholar] [CrossRef]
- Mkaouer, B.; Jemni, M.; Chaabene, H.; Amara, S.; Njah, A.; Chtara, M. Effect of two different types of olympic rotation order on cardiovascular and metabolic variables in men’s artistic gymnastics. J. Hum. Kinet. 2018, 61, 179–187. [Google Scholar] [CrossRef]
- Armstrong, N.; Sharp, C. Gymnastics physiology. In Handbook of Sports Medicine and Science: Gymnastics; Caine, D.J., Russell, K., Lim, L., Eds.; John Wiley & Sons: Hoboken, NJ, USA, 2013; pp. 85–97. [Google Scholar]
- Baiget, E.; Iglesias, X.; Rodriguez, F.A. Validity of heart rate-based models for estimating oxygen uptake during tennis play. J. Strength Cond. Res. 2020, 34, 3208–3216. [Google Scholar] [CrossRef]
- Scribbans, T.D.; Berg, K.; Narazaki, K.; Janssen, I.; Gurd, B.J. Heart rate during basketball game play and volleyball drills accurately predicts oxygen uptake and energy expenditure. J. Sports Med. Phys. Fit. 2015, 55, 905–913. [Google Scholar]
- Wong, D.P.; Carling, C.; Chaouachi, A.; Dellal, A.; Castagna, C.; Chamari, K.; Behm, D.G. Estimation of oxygen uptake from heart rate and ratings of perceived exertion in young soccer players. J. Strength. Cond. Res. 2011, 25, 1983–1988. [Google Scholar] [CrossRef] [PubMed]
- Maas, S.; Kok, M.L.; Westra, H.G.; Kemper, H.C. The validity of the use of heart rate in estimating oxygen consumption in static and in combined static/dynamic exercise. Ergonomics 1989, 32, 141–148. [Google Scholar] [CrossRef]
- Novas, A.M.; Rowbottom, D.G.; Jenkins, D.G. A practical method of estimating energy expenditure during tennis play. J. Sci. Med. Sport 2003, 6, 40–50. [Google Scholar] [CrossRef] [PubMed]
- Castagna, C.; Belardinelli, R.; Impellizzeri, F.M.; Abt, G.A.; Coutts, A.J.; D’Ottavio, S. Cardiovascular responses during recreational 5-a-side indoor-soccer. J. Sci. Med. Sport. 2007, 10, 89–95. [Google Scholar] [CrossRef] [PubMed]
- Beneke, R.; Pollmann, C.; Bleif, I.; Leithäuser, R.; Hütler, M. How anaerobic is the wingate anaerobic test for humans? Eur. J. Appl. Physiol. 2002, 87, 388–392. [Google Scholar] [PubMed]
- Guidetti, L.; Meucci, M.; Bolletta, F.; Emerenziani, G.P.; Gallotta, M.C.; Baldari, C. Validity, reliability and minimum detectable change of COSMED K5 portable gas exchange system in breath-by-breath mode. PLoS ONE 2018, 13, e0209925. [Google Scholar] [CrossRef]
- Borg, G.A. Psychophysical bases of perceived exertion. Med. Sci. Sports Exerc. 1982, 14, 377–381. [Google Scholar] [CrossRef]
- Dickhuth, H.-H.; Huonker, M.; Münzel, T.; Drexler, H.; Berg, A.; Keul, J. Individual anaerobic threshold for evaluation of competitive athletes and patients with left ventricular dysfunction. In Advances in Ergometry; Bachl, N., Graham, T.E., Löllgen, H., Eds.; Springer: Berlin/Heidelberg, Germany, 1991; pp. 173–179. [Google Scholar]
- Cerretelli, P.; di Prampero, P.E. Gas exchange in exercise. In Handbook of Physiology, Section 3; Fahri, L.E., Tenney, S.M., Eds.; American Physiological Society: Rockville, MD, USA, 1987; Volume 4, pp. 297–339. [Google Scholar]
- Harris, J.A.; Benedict, F.G. A Biometric study of human basal metabolism. Proc. Natl. Acad. Sci. USA 1918, 4, 370–373. [Google Scholar] [CrossRef]
- McBride, G. A Proposal for Strength-of-Agreement Criteria for Lin’s Concordance Correlation Coefficient; NIWA: Auckland, New Zealand, 2005; pp. 307–310. [Google Scholar]
- Hoeger, W.; Fisher, G. Energy costs for men’s gymnastic routines. IG Tech. Suppl. 1981, 5, 1–3. [Google Scholar]
- Jemni, M.; Sands, W.; Friemel, F.; Cooke, C.; Stone, M. Effect of gymnastics training on aerobic and anaerobic components in elite and sub elite men gymnasts. J. Strength. Cond. Res. 2006, 20, 899–907. [Google Scholar] [PubMed]
- Zinner, C.; Morales-Alamo, D.; Ørtenblad, N.; Larsen, F.J.; Schiffer, T.A.; Willis, S.J.; Gelabert-Rebato, M.; Perez-Valera, M.; Boushel, R.; Calbet, J.A.; et al. The physiological mechanisms of performance enhancement with sprint interval training differ between the upper and lower extremities in humans. Front. Physiol. 2016, 7, 426. [Google Scholar] [CrossRef] [PubMed]
- Koppo, K.; Bouckaert, J.; Jones, A.M. Oxygen uptake kinetics during high-intensity arm and leg exercise. Respir. Physiol. Neurobiol. 2002, 133, 241–250. [Google Scholar] [CrossRef] [PubMed]
- Guidetti, L.; Emerenziani, G.P.; Gallotta, M.C.; Da Silva, S.G.; Baldari, C. Energy cost and energy sources of a ballet dance exercise in female adolescents with different technical ability. Eur. J. Appl. Physiol. 2008, 103, 315–321. [Google Scholar] [CrossRef]
- Sahlin, K. Muscle energetics during explosive activities and potential effects of nutrition and training. Sports Med. 2014, 44, 167–173. [Google Scholar] [CrossRef]

Disclaimer/Publisher’s Note: The statements, opinions and data contained in all publications are solely those of the individual author(s) and contributor(s) and not of MDPI and/or the editor(s). MDPI and/or the editor(s) disclaim responsibility for any injury to people or property resulting from any ideas, methods, instructions or products referred to in the content. |
© 2024 by the authors. Licensee MDPI, Basel, Switzerland. This article is an open access article distributed under the terms and conditions of the Creative Commons Attribution (CC BY) license (https://creativecommons.org/licenses/by/4.0/).