
Sex Differences in Bone, Muscle, and Inflammatory Markers and Their Associations with Muscle Performance Variables


Abstract
:1. Introduction
2. Methods
2.1. Protocol
2.2. Muscular Performance
2.3. Statistical Analysis
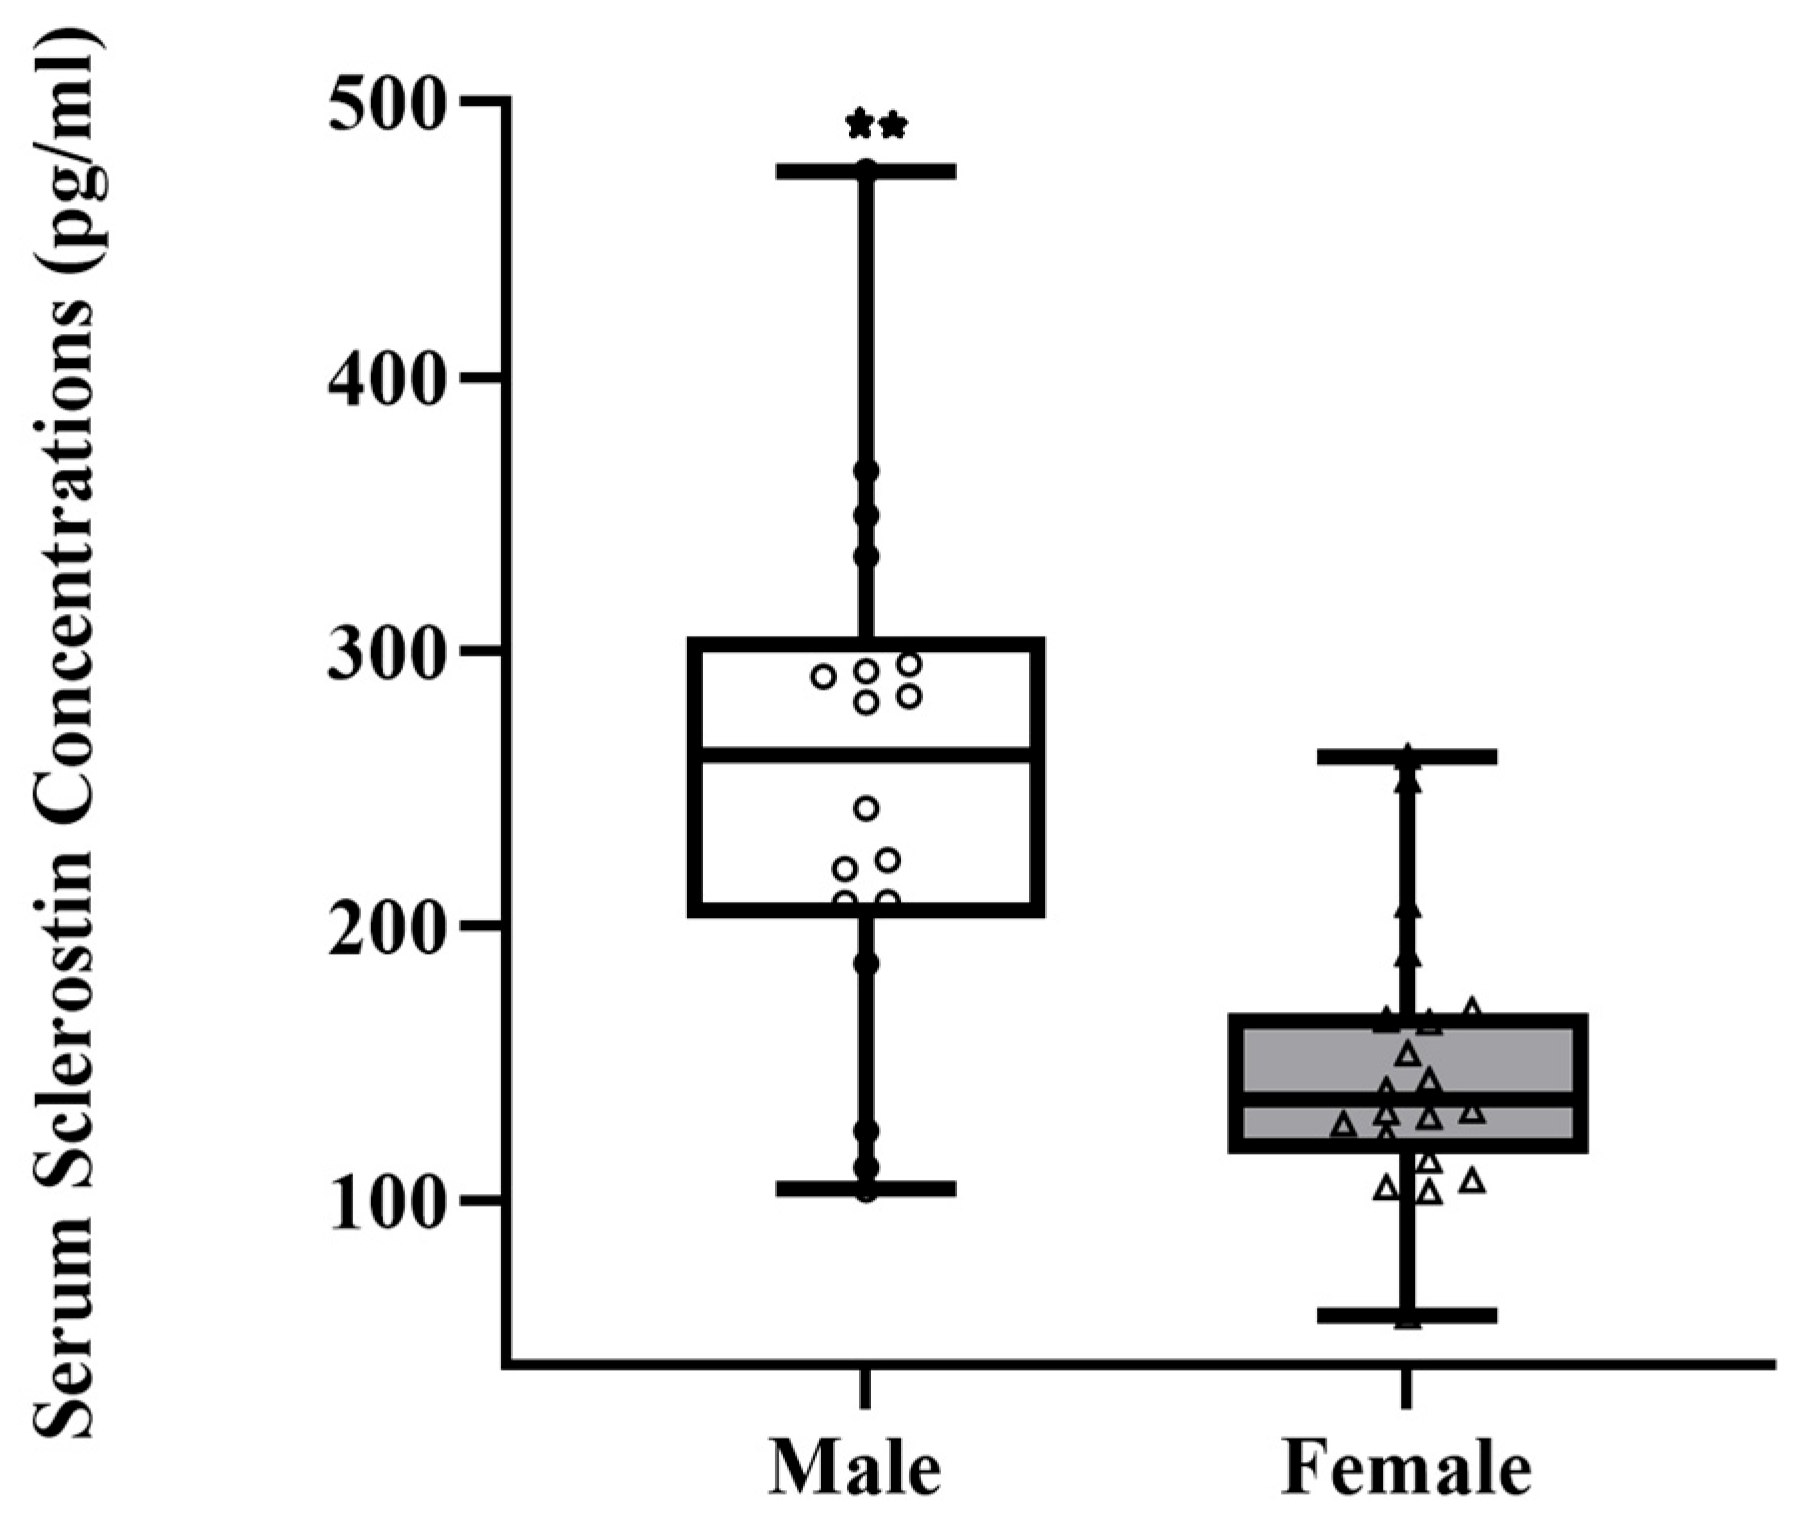
3. Results
4. Discussion
5. Conclusions
Author Contributions
Funding
Institutional Review Board Statement
Informed Consent Statement
Data Availability Statement
Acknowledgments
Conflicts of Interest
References
- Mikolajewicz, N.; Sehayek, S.; Wiseman, P.W.; Komarova, S.V. Transmission of mechanical information by purinergic signaling. Biophys. J. 2019, 116, 2009–2022. [Google Scholar] [CrossRef] [PubMed]
- DiGirolamo, D.J.; Clemens, T.L.; Kousteni, S. The skeleton as an endocrine organ. Nat. Rev. Rheumatol. 2012, 8, 674–683. [Google Scholar] [CrossRef] [PubMed]
- Frost, H.M. A 2003 update of bone physiology and Wolff’s Law for clinicians. Angle Orthod. 2004, 74, 3–15. [Google Scholar]
- Herrmann, M.; Engelke, K.; Ebert, R.; Müller-Deubert, S.; Rudert, M.; Ziouti, F.; Jundt, F.; Felsenberg, D.; Jakob, F. Interactions between muscle and bone—Where physics meets biology. Biomolecules 2020, 10, 432. [Google Scholar] [CrossRef] [PubMed]
- Nassari, S.; Duprez, D.; Fournier-Thibault, C. Non-myogenic contribution to muscle development and homeostasis: The role of connective tissues. Front. Cell Dev. Biol. 2017, 5, 22. [Google Scholar] [CrossRef]
- DiGirolamo, D.J.; Kiel, D.P.; Esser, K.A. Bone and skeletal muscle: Neighbors with close ties. J. Bone Miner. Res. 2013, 28, 1509–1518. [Google Scholar] [CrossRef]
- Kirk, B.; Feehan, J.; Lombardi, G.; Duque, G. Muscle, bone, and fat crosstalk: The biological role of myokines, osteokines, and adipokines. Curr. Osteoporos. Rep. 2020, 18, 388–400. [Google Scholar] [CrossRef]
- Bonnet, N.; Bourgoin, L.; Biver, E.; Douni, E.; Ferrari, S. RANKL inhibition improves muscle strength and insulin sensitivity and restores bone mass. J. Clin. Investig. 2023, 129, 3214–3223. [Google Scholar] [CrossRef]
- Kouvelioti, R.; Kurgan, N.; Falk, B.; Ward, W.E.; Josse, A.R.; Klentrou, P. Cytokine and Sclerostin Response to High-Intensity Interval Running versus Cycling. Med. Sci. Sports Exerc. 2019, 51, 2458–2464. [Google Scholar] [CrossRef]
- Liang, H.; Qi, W.; Jiajue, R.; Chi, Y.; Liu, W.; Wang, O.; Li, M.; Xing, X.; Yu, W.; Jiang, Y.; et al. Serum Irisin level is associated with fall risk, muscle strength, and cortical porosity in postmenopausal women. Front. Endocrinol. 2023, 14, 1096950. [Google Scholar] [CrossRef]
- Park, H.S.; Kim, H.C.; Zhang, D.; Yeom, H.; Lim, S.K. The novel myokine irisin: Clinical implications and potential role as a biomarker for sarcopenia in postmenopausal women. Endocrine 2019, 64, 341–348. [Google Scholar] [CrossRef] [PubMed]
- Franceschi, C.; Bonafè, M.; Valensin, S.; Olivieri, F.; De Luca, M.; Ottaviani, E.; De Benedictis, G. Inflamm-aging: An evolutionary perspective on immunosenescence. Ann. N. Y. Acad. Sci. 2000, 908, 244–254. [Google Scholar] [CrossRef] [PubMed]
- He, C.; He, W.; Hou, J.; Chen, K.; Huang, M.; Yang, M.; Luo, X.; Li, C. Bone and muscle crosstalk in aging. Front. Cell Dev. Biol. 2020, 8, 585644. [Google Scholar] [CrossRef] [PubMed]
- Gaudio, A.; Rapisarda, R.; Xourafa, A.; Zanoli, L.; Manfrè, V.; Catalano, A.; Signorelli, S.S.; Castellino, P. Effects of competitive physical activity on serum irisin levels and bone turnover markers. J. Endocrinol. Investig. 2021, 44, 2235–2241. [Google Scholar] [CrossRef] [PubMed]
- Miller, R.M.; Freitas, E.D.; Heishman, A.D.; Peak, K.M.; Buchanan, S.R.; Bemben, D.A.; Bemben, M.G. Associations of serum IL-6 with muscle, bone, and adipose tissue in women. Cytokine 2022, 151, 155787. [Google Scholar] [CrossRef]
- Kim, J.A.; Roh, E.; Hong, S.H.; Lee, Y.B.; Kim, N.H.; Yoo, H.J.; Seo, J.A.; Kim, N.H.; Kim, S.G.; Baik, S.H.; et al. Association of serum sclerostin levels with low skeletal muscle mass: The Korean Sarcopenic Obesity Study (KSOS). Bone 2019, 128, 115053. [Google Scholar] [CrossRef]
- Amrein, K.; Amrein, S.; Drexler, C.; Dimai, H.P.; Dobnig, H.; Pfeifer, K.; Tomaschitz, A.; Pieber, T.R.; Fahrleitner-Pammer, A. Sclerostin and its association with physical activity, age, gender, body composition, and bone mineral content in healthy adults. J. Clin. Endocrinol. Metab. 2012, 97, 148–154. [Google Scholar] [CrossRef]
- Weeks, B.K.; Beck, B.R. The BPAQ: A bone-specific physical activity assessment instrument. Osteoporos. Int. 2008, 19, 1567–1577. [Google Scholar] [CrossRef]
- Craig, C.L.; Marshall, A.L.; Sjöström, M.; Bauman, A.E.; Booth, M.L.; Ainsworth, B.E.; Pratt, M.; Ekelund, U.L.F.; Yngve, A.; Sallis, J.F.; et al. International physical activity questionnaire: 12-country reliability and validity. Med. Sci. Sports Exerc. 2003, 35, 1381–1395. [Google Scholar] [CrossRef]
- Hagströmer, M.; Oja, P.; Sjöström, M. The International Physical Activity Questionnaire (IPAQ): A study of concurrent and construct validity. Public Health Nutr. 2006, 9, 755–762. [Google Scholar] [CrossRef]
- Musgrave, K.O.; Liane, G.; Leclerc, H.L.; Rosen, C.J. Validation of a quantitative food frequency questionnaire for rapid assessment of dietary calcium intake. J. Am. Diet. Assoc. 1989, 89, 1484–1485. [Google Scholar] [CrossRef] [PubMed]
- Mödder, U.I.; Hoey, K.A.; Amin, S.; McCready, L.K.; Achenbach, S.J.; Riggs, B.L.; Melton, L.J., III; Khosla, S. Relation of age, gender, and bone mass to circulating sclerostin levels in women and men. J. Bone Miner. Res. 2011, 26, 373–379. [Google Scholar] [CrossRef]
- Coulson, J.; Bagley, L.; Barnouin, Y.; Bradburn, S.; Butler-Browne, G.; Gapeyeva, H.; Hogrel, J.Y.; Maden-Wilkinson, T.; Maier, A.B.; Meskers, C.; et al. Circulating levels of dickkopf-1, osteoprotegerin and sclerostin are higher in old compared with young men and women and positively associated with whole-body bone mineral density in older adults. Osteoporos. Int. 2017, 28, 2683–2689. [Google Scholar] [CrossRef] [PubMed]
- Thorson, S.; Prasad, T.; Sheu, Y.; Danielson, M.E.; Arasu, A.; Cummings, S.R.; Cauley, J.A. Sclerostin and bone strength in women in their 10th decade of life. J. Bone Miner. Res. 2013, 28, 2008–2016. [Google Scholar] [CrossRef]
- Bentzinger, C.F.; von Maltzahn, J.; Dumont, N.A.; Stark, D.A.; Wang, Y.X.; Nhan, K.; Frenette, J.; Cornelison, D.D.W.; Rudnicki, M.A. Wnt7a stimulates myogenic stem cell motility and engraftment resulting in improved muscle strength. J. Cell Biol. 2014, 205, 97–111. [Google Scholar] [CrossRef] [PubMed]
- Kaji, H. Interaction between muscle and bone. J. Bone Metab. 2014, 21, 29–40. [Google Scholar] [CrossRef]
- Kabasakalis, A.; Nikolaidis, S.; Tsalis, G.; Mougios, V. Response of blood biomarkers to sprint interval swimming. Int. J. Sports Physiol. Perform. 2020, 15, 1442–1447. [Google Scholar] [CrossRef]
- Anastasilakis, A.D.; Polyzos, S.A.; Saridakis, Z.G.; Kynigopoulos, G.; Skouvaklidou, E.C.; Molyvas, D.; Vasiloglou, M.F.; Apostolou, A.; Karagiozoglou-Lampoudi, T.; Siopi, A.; et al. Circulating irisin in healthy, young individuals: Day-night rhythm, effects of food intake and exercise, and associations with gender, physical activity, diet, and body composition. J. Clin. Endocrinol. Metab. 2014, 99, 3247–3255. [Google Scholar] [CrossRef]
- Kim, S.; Baker, B.S.; Sharma-Ghimire, P.; Bemben, D.A.; Bemben, M.G. Association between bone-specific physical activity scores and pQCT-derived measures of bone strength and geometry in healthy young and middle-aged premenopausal women. Arch. Osteoporos. 2018, 13, 83. [Google Scholar] [CrossRef]
- Daskalopoulou, S.S.; Cooke, A.B.; Gomez, Y.H.; Mutter, A.F.; Filippaios, A.; Mesfum, E.T.; Mantzoros, C.S. Plasma irisin levels progressively increase in response to increasing exercise workloads in young, healthy, active subjects. Eur. J. Endocrinol. 2014, 171, 343–352. [Google Scholar] [CrossRef]
- Grimaldi, A.S.; Parker, B.A.; Capizzi, J.A.; Clarkson, P.M.; Pescatello, L.S.; White, C.M.; Thompson, P.D. 25 (OH) vitamin D is associated with greater muscle strength in healthy men and women. Med. Sci. Sports Exerc. 2013, 45, 157. [Google Scholar] [CrossRef] [PubMed]
- Brännström, A.; Yu, J.G.; Jonsson, P.; Åkerfeldt, T.; Stridsberg, M.; Svensson, M. Vitamin D in relation to bone health and muscle function in young female soccer players. Eur. J. Sport Sci. 2017, 17, 249–256. [Google Scholar] [CrossRef] [PubMed]
- Singh, T.; Newman, A.B. Inflammatory markers in population studies of aging. Aging Res. Rev. 2011, 10, 319–329. [Google Scholar] [CrossRef]
- Tiainen, K.; Hurme, M.; Hervonen, A.; Luukkaala, T.; Jylhä, M. Inflammatory markers and physical performance among nonagenarians. Arch. Gerontol. Geriatr. 2010, 65, 658–663. [Google Scholar] [CrossRef] [PubMed]
- Lukic, L.; Lalic, N.M.; Rajkovic, N.; Jotic, A.; Lalic, K.; Milicic, T.; Seferovic, J.P.; Macesic, M.; Stanarcic Gajovic, J. Hypertension in obese type 2 diabetes patients is associated with increases in insulin resistance and IL-6 cytokine levels: Potential targets for an efficient preventive intervention. Int. J. Environ. Res. 2014, 11, 3586–3598. [Google Scholar] [CrossRef]
- Visser, M.; Pahor, M.; Taaffe, D.R.; Goodpaster, B.H.; Simonsick, E.M.; Newman, A.B.; Nevitt, M.; Harris, T.B. Relationship of interleukin-6 and tumor necrosis factor-α with muscle mass and muscle strength in elderly men and women: The Health ABC Study. J. Gerontol. Ser. A Biol. Sci. Med. Sci. 2002, 57, M326–M332. [Google Scholar] [CrossRef]
- Mikó, A.; Pótó, L.; Mátrai, P.; Hegyi, P.; Füredi, N.; Garami, A.; Illés, A.; Solymár, M.; Vincze, Á.; Balaskó, M.; et al. Gender difference in the effects of interleukin-6 on grip strength—A systematic review and meta-analysis. BMC Geriatr. 2018, 18, 107. [Google Scholar] [CrossRef]
- Hamoudi, D.; Marcadet, L.; Piette Boulanger, A.; Yagita, H.; Bouredji, Z.; Argaw, A.; Frenette, J. An anti-RANKL treatment reduces muscle inflammation and dysfunction and strengthens bone in dystrophic mice. Hum. Mol. Genet. 2019, 28, 3101–3112. [Google Scholar] [CrossRef]
- Marques, E.A.; Mota, J.; Viana, J.L.; Tuna, D.; Figueiredo, P.; Guimarães, J.T.; Carvalho, J. Response of bone mineral density, inflammatory cytokines, and biochemical bone markers to a 32-week combined loading exercise programme in older men and women. Arch. Gerontol. Geriatr. 2013, 57, 226–233. [Google Scholar] [CrossRef]
- Loncar, G.; Bozic, B.; Von Haehling, S.; Düngen, H.D.; Prodanovic, N.; Lainscak, M.; Arandjelovic, A.; Dimkovic, S.; Radojicic, Z.; Popovic, V. Association of adiponectin with peripheral muscle status in elderly patients with heart failure. Eur. J. Intern. Med. 2013, 24, 818–823. [Google Scholar] [CrossRef]
- Baker, K.A.; Miller, T.D.; Marino, F.E.; Hartmann, T.E. The exercise-induced inflammatory response in inflammatory bowel disease: A systematic review and meta-analysis. PLoS ONE 2022, 17, e0262534. [Google Scholar] [CrossRef] [PubMed]
- Dufresne, S.S.; Dumont, N.A.; Boulanger-Piette, A.; Fajardo, V.A.; Gamu, D.; Kake-Guena, S.A.; David, R.O.; Bouchard, P.; Lavergne, É.; Penninger, J.M.; et al. Muscle RANK is a key regulator of Ca2+ storage, SERCA activity, and function of fast-twitch skeletal muscles. Am. J. Physiol. Cell Physiol. 2016, 310, C663–C672. [Google Scholar] [CrossRef] [PubMed]
- Sylow, L.; Nielsen, I.L.; Kleinert, M.; Møller, L.L.; Ploug, T.; Schjerling, P.; Bilan, P.J.; Klip, A.; Jensen, T.E.; Richter, E.A. Rac1 governs exercise-stimulated glucose uptake in skeletal muscle through regulation of GLUT4 translocation in mice. J. Physiol. 2016, 594, 4997–5008. [Google Scholar] [CrossRef] [PubMed]
- Liakou, C.G.; Mastorakos, G.; Makris, K.; Fatouros, I.G.; Avloniti, A.; Marketos, H.; Antoniou, J.D.; Galanos, A.; Dontas, I.; Rizos, D.; et al. Changes of serum sclerostin and Dickkopf-1 levels during the menstrual cycle. A pilot study. Endocrine 2016, 54, 543–551. [Google Scholar] [CrossRef]
- Hayashida, H.; Shimura, M.; Sugama, K.; Kanda, K.; Suzuki, K. Exercise-induced inflammation during different phases of the menstrual cycle. Physiother. Rehabil. 2016, 1, 4. [Google Scholar] [CrossRef]


| Variables | Male (n = 18) | Female (n = 20) |
|---|---|---|
| Age (years) | 20.6 ± 1.6 | 20.6 ± 1.3 |
| Height (cm) | 178.0 ± 8.6 | 160.7 ± 6.9 ** |
| Weight (kg) | 85.1 ± 18.7 | 70.4 ± 18.5 * |
| Body Mass Index (kg/m2) | 26.7 ± 4.4 | 27.1 ± 5.79 |
| tBPAQ | 21.5 ± 13.1 | 38.2 ± 29.8 * |
| Calcium Intake (mg/dL) | 1015.4 ± 520.7 | 744.5 ± 465.9 |
| Total PA Score (MET-min/Wk) | 4743. 9 ± 3410.9 | 5781.32 ± 4893.7 |
| Variables | Male (n = 18) | Female (n = 20) |
|---|---|---|
| Irisin (ng/mL) | 154.4 ± 7.2 | 130.3 ± 6.8 * |
| Vitamin D (ng/mL) | 44.7 ± 3.3 | 34.7 ± 3.1 * |
| IL-6 (pg/mL) | 3.69 ± 0.7 | 5.0 ± 0.6 |
| RANKL (pg/mL) | 4.2 ± 0.6 | 5.7 ± 0.6 |
| TNF-α (pg/mL) | 15.0 ± 1.4 | 15.0 ± 1.3 |
| Variables | Male (n = 18) | Female (n = 20) |
|---|---|---|
| Time in air (s) | 0.6 ± 0.0 | 0.5 ± 0.0 ** |
| Jump Height (inches) | 20.3 ± 0.8 | 14.9 ± 0.7 ** |
| Velocity (m/s) | 1.4 ± 0.0 | 1.1 ± 0.0 ** |
| Power (watts) | 1075.6 ± 31.6 | 848.6 ± 29.9 ** |
| Relative Power | 13.6 ± 0.3 | 10.9 ± 0.3 ** |
| Right-Hand Grip Strength (kg) | 58.1 ± 6.0 | 59.7 ± 5.6 |
| Left-Hand Grip Strength (kg) | 52.8 ± 5.7 | 52.0 ± 5.4 |
| Variables | IL-6 | Irisin | RANKL | TNF-α | Vitamin D |
|---|---|---|---|---|---|
| BMI | r = 0.4 * | r = 0.3 | r = −0.0 | r = −0.2 | r = 0.1 |
| p = 0.01 | p = 0.8 | p = 0.6 | p = 0.1 | p = 0.3 | |
| CI (mg/day) | r = −0.2 | r = 0.0 | r = 0.2 | r = −0.0 | r = −0.2 |
| p = 0.8 | p = 0.5 | p = 0.2 | p = 0.7 | p = 0.8 | |
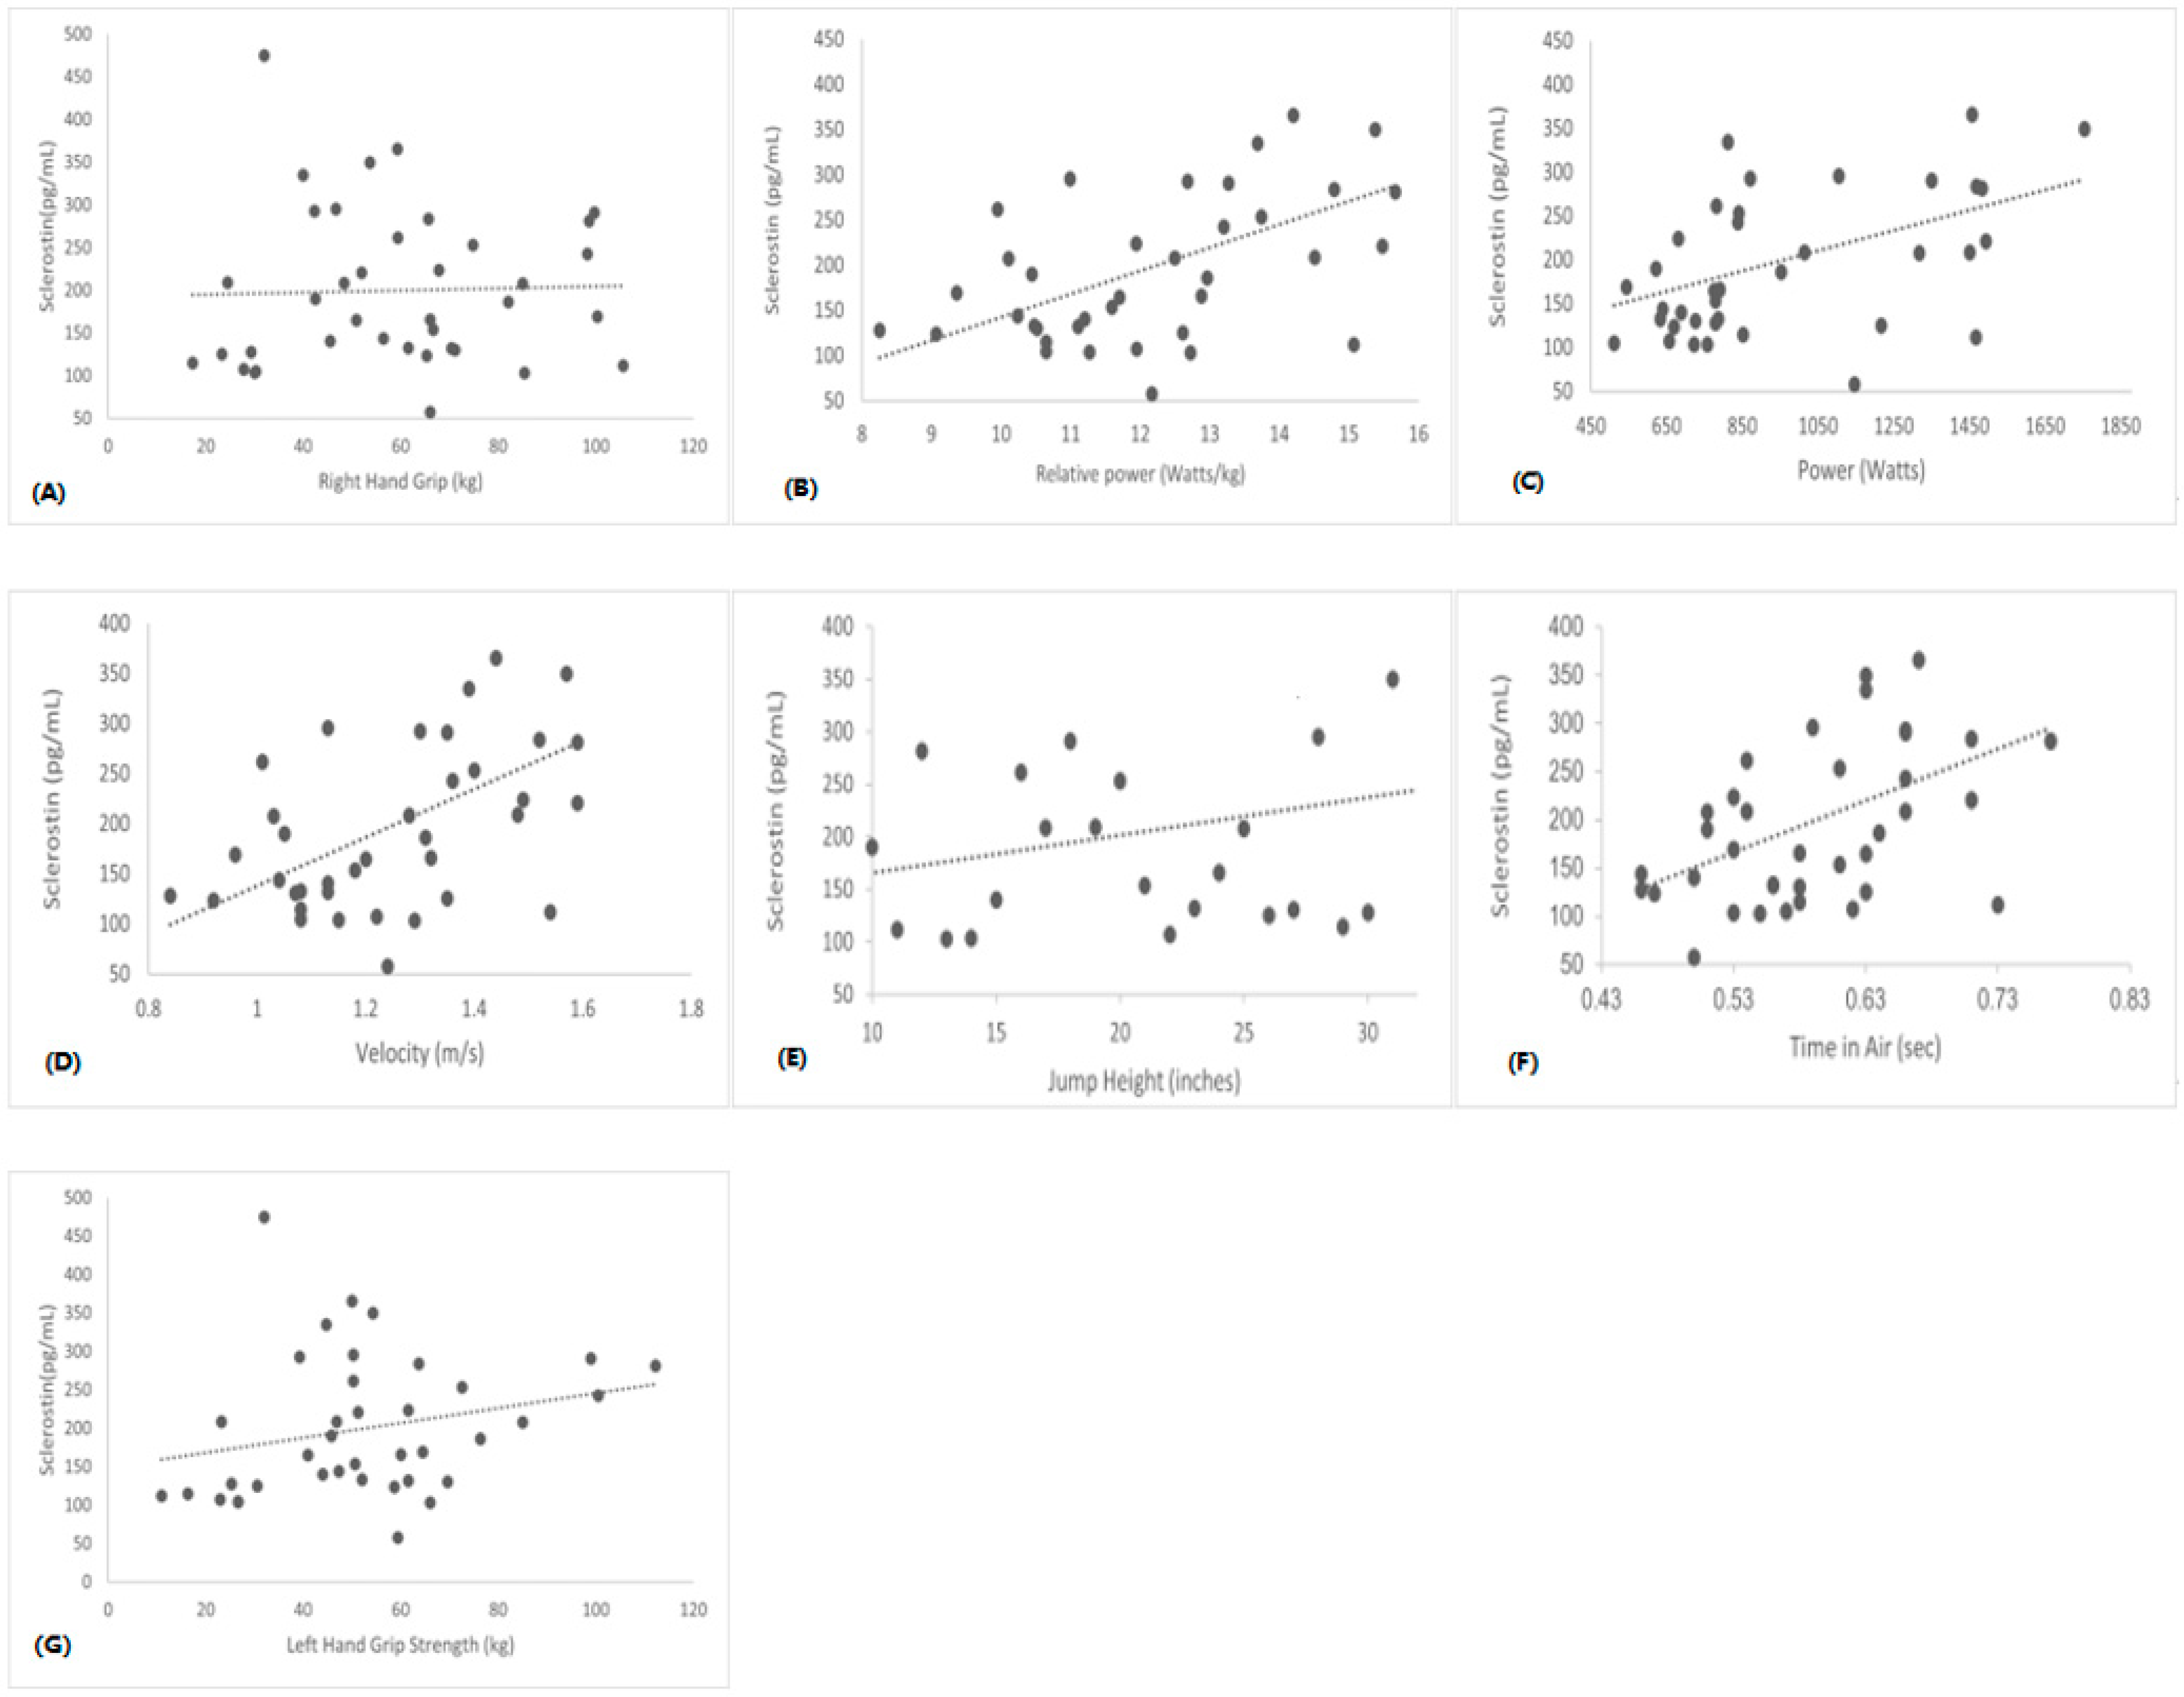
| TIA (s) | r = −0.1 | r = −0.2 | r = 0.0 | r = −0.3 * | r = 0.3 * |
| p = 0.3 | p = 0.2 | p = 0.7 | p = 0.04 | p = 0.02 | |
| JH (inches) | r = −0.1 | r = −0.2 | r = 0.0 | r = −0.3 * | r = 0.3 * |
| p = 0.4 | p = 0.1 | p = 0.7 | p = 0.04 | p = 0.03 | |
| Vel (m/s) | r = −0.2 | r = −0.2 | r = −0.0 | r = −0.1 | r = 0.4 * |
| p = 0.1 | p = 0.2 | p = 0.6 | p = 0.4 | p = 0.08 | |
| Power (watts) | r = −0.0 | r = −0.7 | r = −0.0 | r = −0.3 * | r = 0.24 |
| p = 0.7 | p = 0.6 | p = 0.7 | p = 0.05 | p = 0.1 | |
| R. Power | r = −0.2 | r = −0.1 | r = −0.0 | r = −0.2 | r = −0.4 * |
| p = 0.1 | p = 0.2 | p = 0.7 | p = 0.1 | p = 0.04 | |
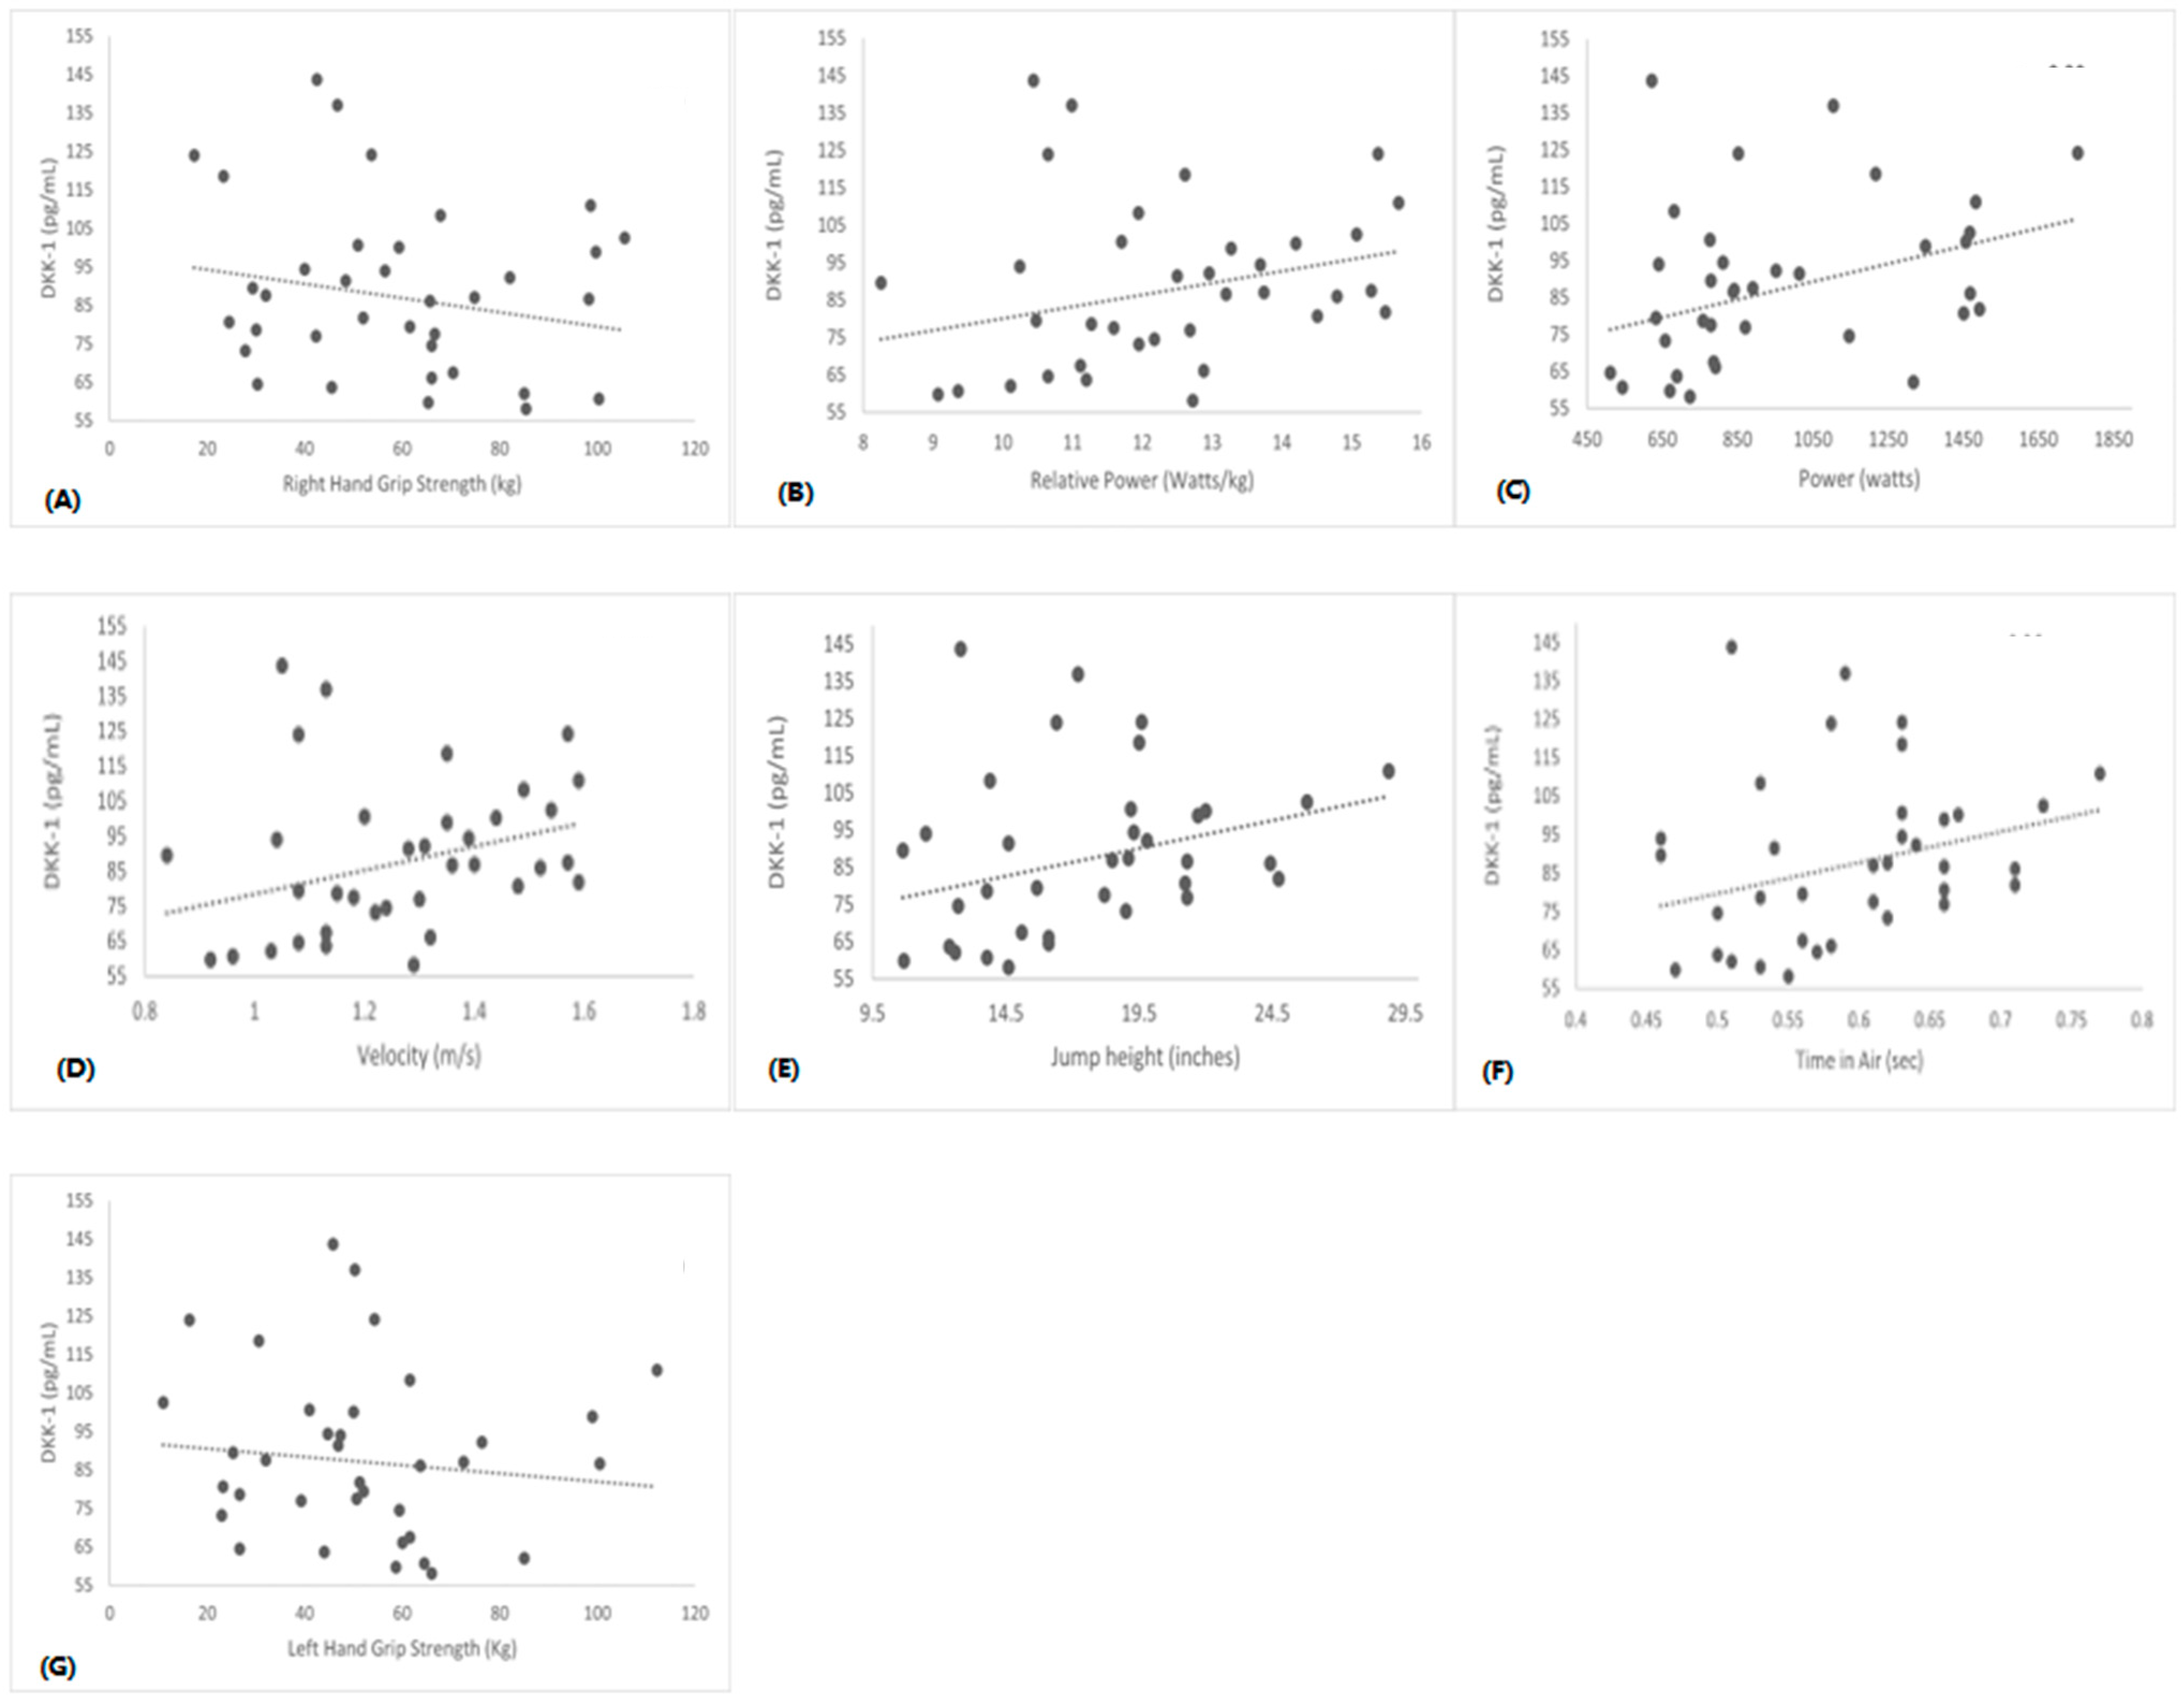
| RH Grip S (kg) | r = −0.2 | r = 0.0 | r = 0.5 * | r = 0.1 | r = −0.2 |
| p = 0.2 | p = 0.8 | p = 0.01 | p = 0.4 | p = 0.1 | |
| LH Grip S (kg) | r = −0.1 | r = 0.8 | r = 0.4 * | r = 0.0 | r = −0.2 |
| p = 0.3 | p = 0.6 | p = 0.01 | p = 0.6 | p = 0.1 |
| Dependent Variable | Predictor Variables | β | SEE | R2 | p |
|---|---|---|---|---|---|
| IL-6 * | BMI | 0.23 | 2.78 | 0.16 | <0.014 |
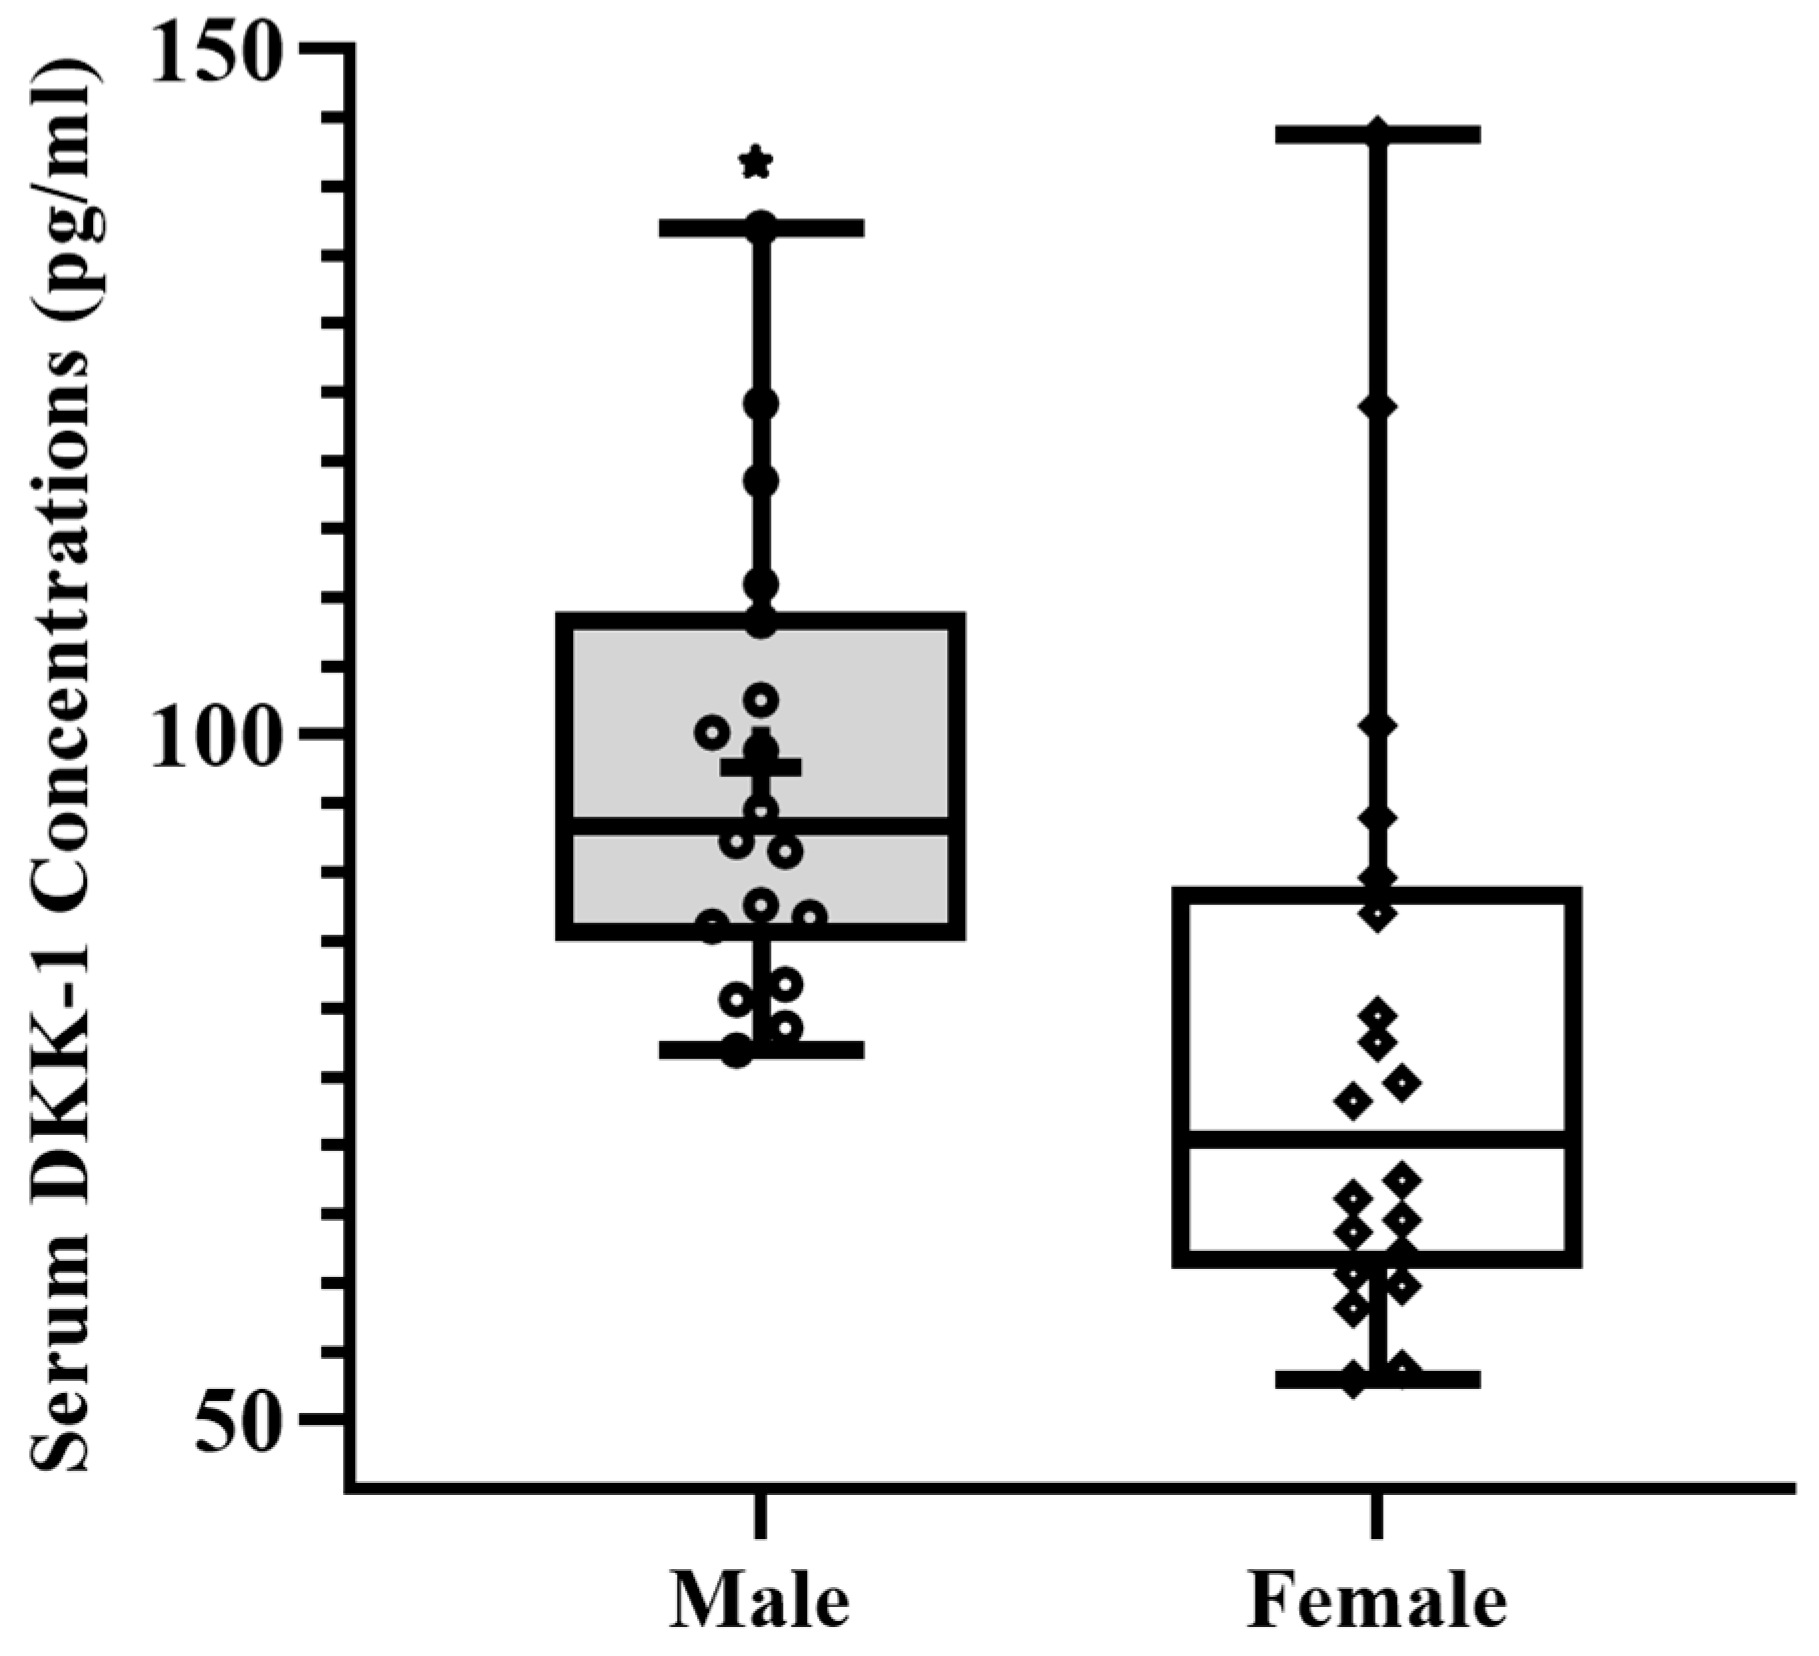
| Sclerostin * | Gender Calcium Intake | −92.40 0.05 | 75.60 71.64 | 0.34 0.43 | <0.032 |
| DKK-1 ** | Gender tBPAQ | −26.37 0.47 | 20.85 18.04 | 0.18 0.37 | <0.001 |
| Irisin * | cBPAQ | −0.42 | 29.38 | 0.14 | <0.018 |
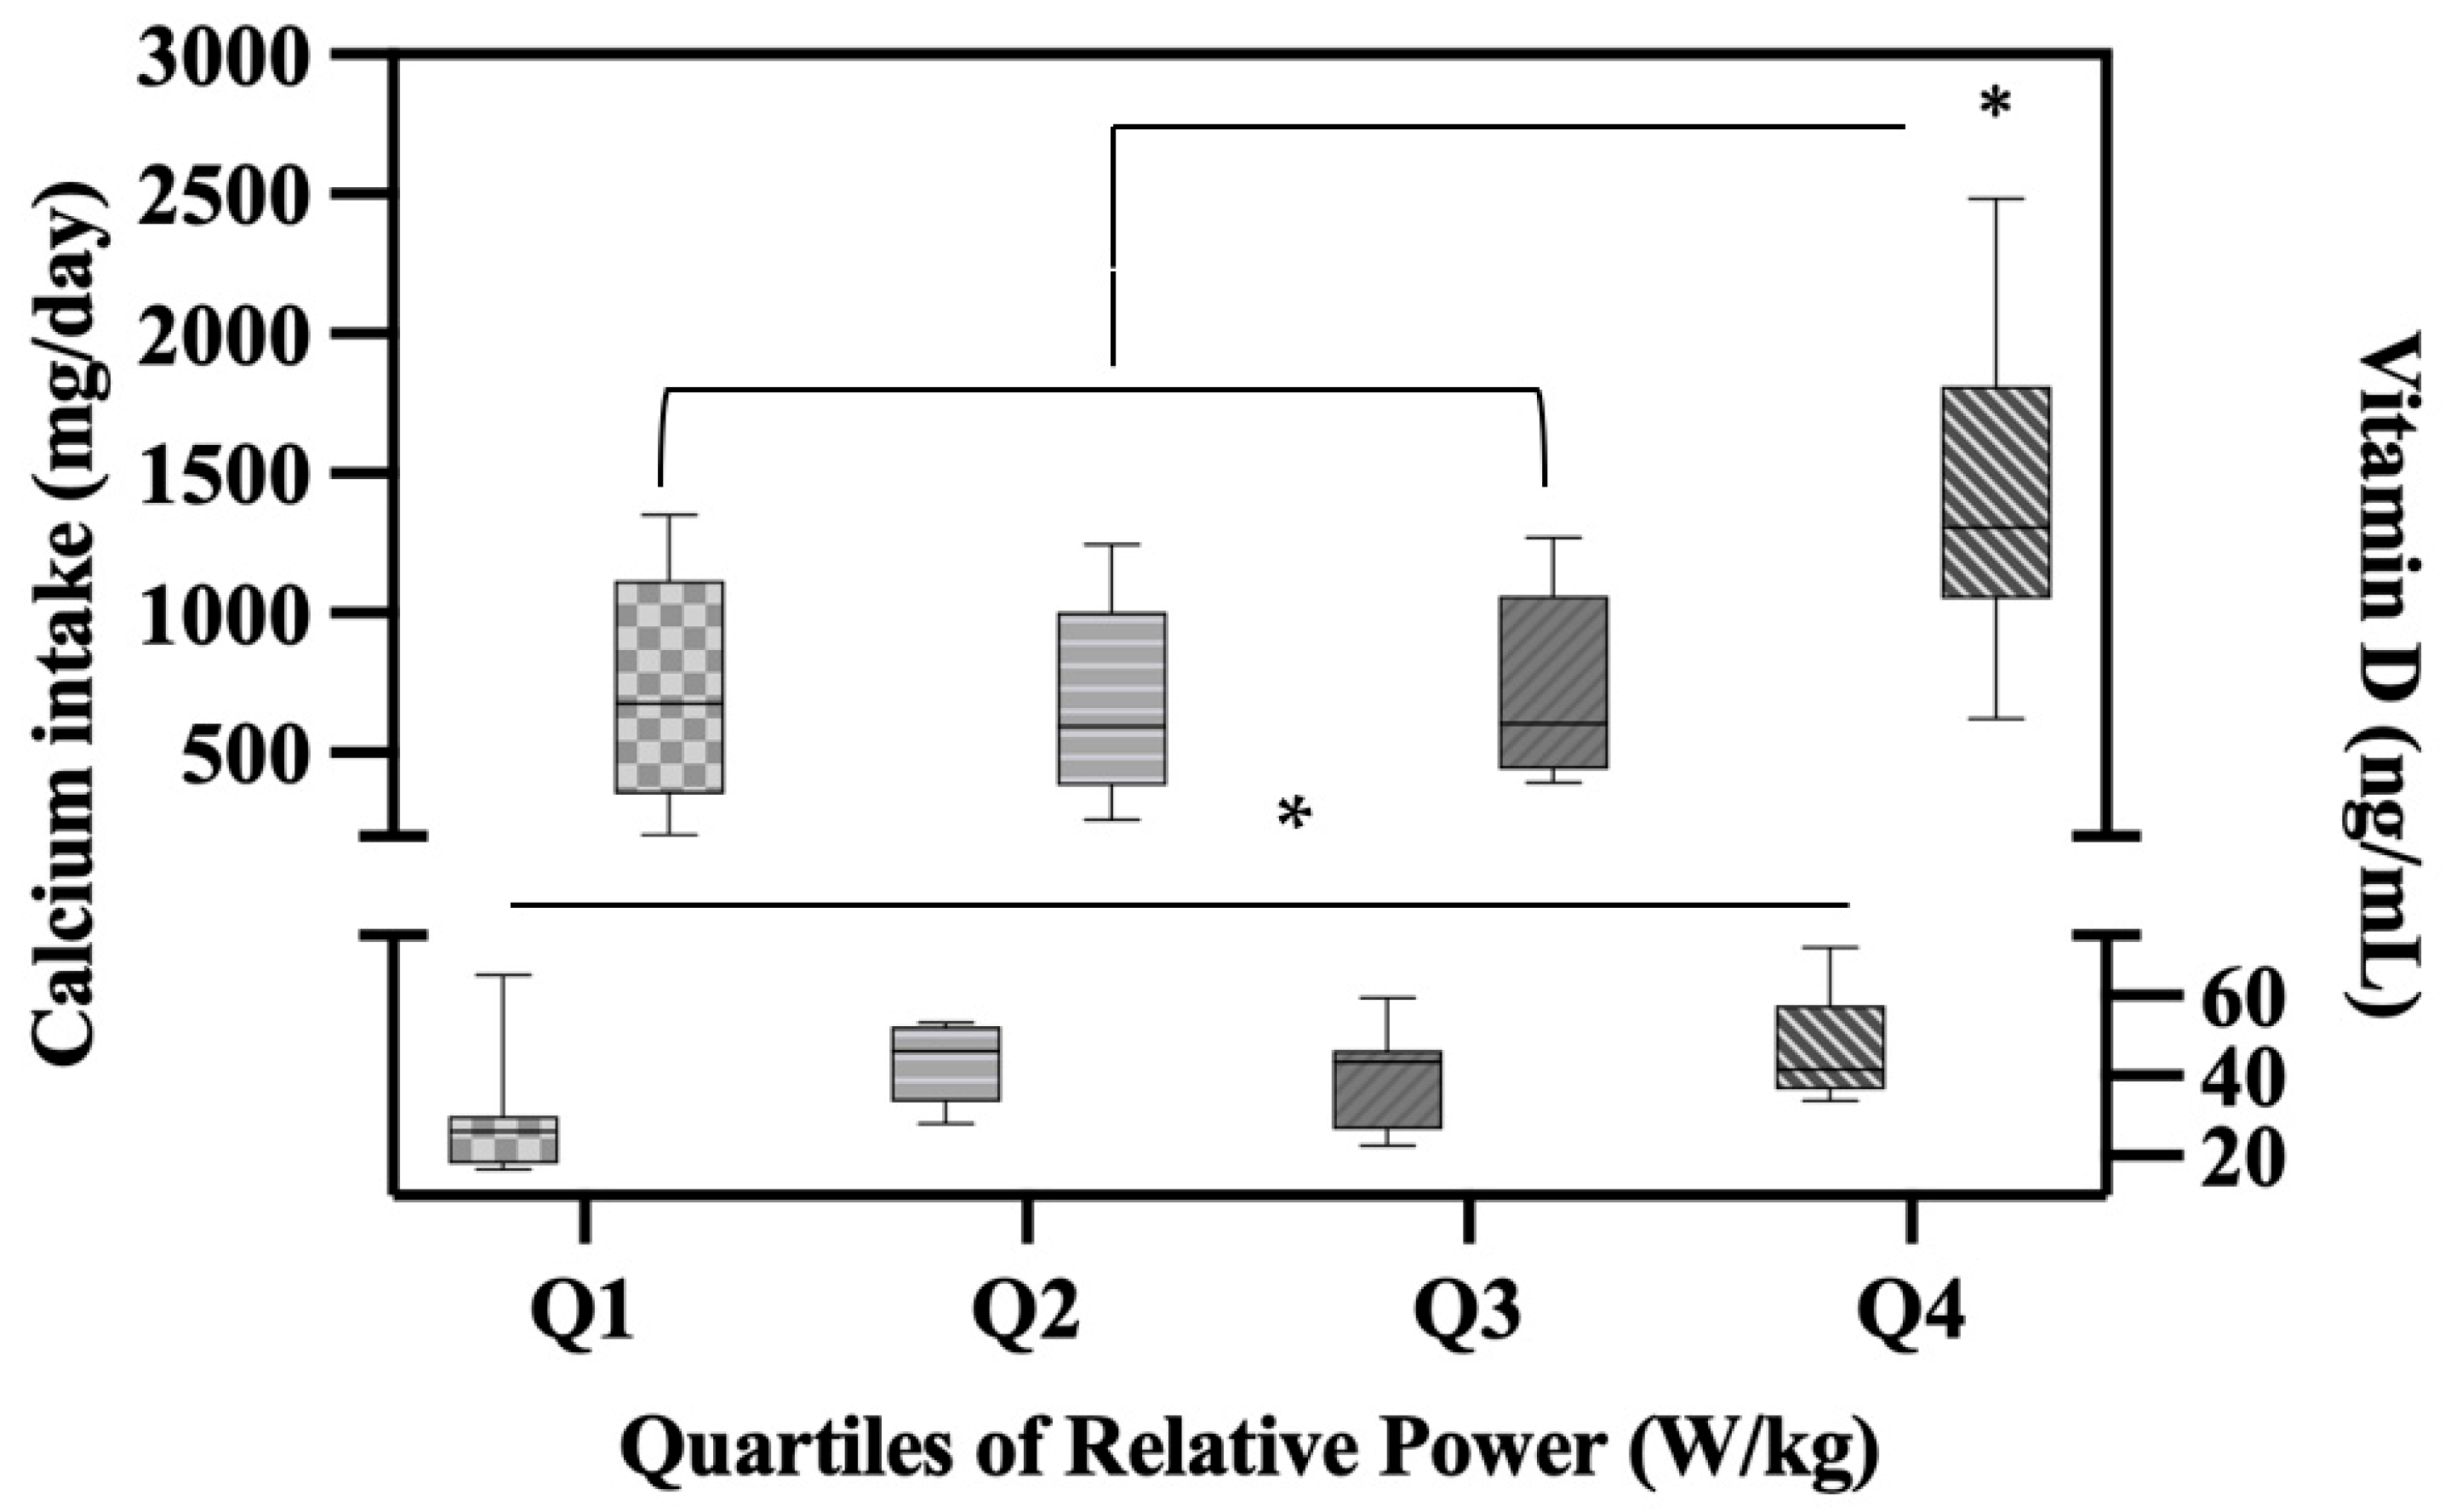
| Vitamin D * | Relative Power Right Hand Grip Calcium Intake | 4.71 −0.20 −0.009 | 12.82 12.01 11.48 | 0.20 0.32 0.40 | <0.020 |
| RANKL ** | Right Hand Grip | 0.60 | 2.38 | 0.27 | <0.001 |
| TNF-α * | Time in Air | −25.10 | 5.63 | 0.10 | <0.046 |
Disclaimer/Publisher’s Note: The statements, opinions and data contained in all publications are solely those of the individual author(s) and contributor(s) and not of MDPI and/or the editor(s). MDPI and/or the editor(s) disclaim responsibility for any injury to people or property resulting from any ideas, methods, instructions or products referred to in the content. |
© 2023 by the authors. Licensee MDPI, Basel, Switzerland. This article is an open access article distributed under the terms and conditions of the Creative Commons Attribution (CC BY) license (https://creativecommons.org/licenses/by/4.0/).
Share and Cite
Sharma Ghimire, P.; Eckart, A.; Al-Makhzoomy, I.K.; Stavitz, J. Sex Differences in Bone, Muscle, and Inflammatory Markers and Their Associations with Muscle Performance Variables. Sports 2023, 11, 215. https://doi.org/10.3390/sports11110215
Sharma Ghimire P, Eckart A, Al-Makhzoomy IK, Stavitz J. Sex Differences in Bone, Muscle, and Inflammatory Markers and Their Associations with Muscle Performance Variables. Sports. 2023; 11(11):215. https://doi.org/10.3390/sports11110215
Chicago/Turabian StyleSharma Ghimire, Pragya, Adam Eckart, Ibtihal K. Al-Makhzoomy, and James Stavitz. 2023. "Sex Differences in Bone, Muscle, and Inflammatory Markers and Their Associations with Muscle Performance Variables" Sports 11, no. 11: 215. https://doi.org/10.3390/sports11110215
APA StyleSharma Ghimire, P., Eckart, A., Al-Makhzoomy, I. K., & Stavitz, J. (2023). Sex Differences in Bone, Muscle, and Inflammatory Markers and Their Associations with Muscle Performance Variables. Sports, 11(11), 215. https://doi.org/10.3390/sports11110215