Article

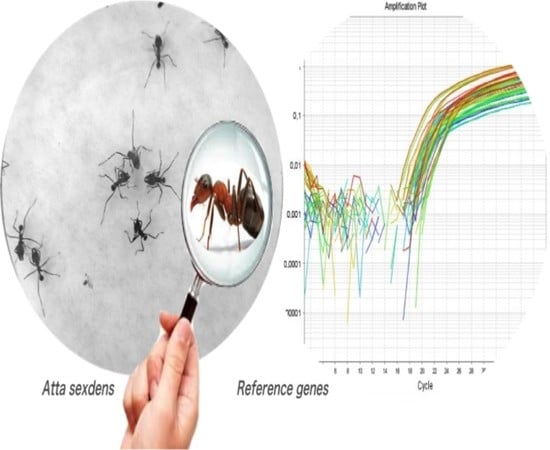
Gene Expression Profile Analysis is Directly Affected by the Selected Reference Gene: The Case of Leaf-Cutting Atta Sexdens

by
Kalynka G. do Livramento
1,*,
Natália C. Freitas
1,
Wesley P. F. Máximo
1,
Ronald Zanetti
2 and
Luciano V. Paiva
3
1
Central Laboratory of Molecular Biology, Federal University of Lavras (UFLA), Lavras, MG 37200-000, Brazil
2
Entomology Department, Federal University of Lavras (UFLA), Lavras, MG 37200-000, Brazil
3
Chemistry Department, Federal University of Lavras (UFLA), Lavras, MG 37200-000, Brazil
*
Author to whom correspondence should be addressed.
Insects 2018, 9(1), 18; https://doi.org/10.3390/insects9010018
Submission received: 8 January 2018 / Revised: 31 January 2018 / Accepted: 2 February 2018 / Published: 8 February 2018

Abstract

:
Although several ant species are important targets for the development of molecular control strategies, only a few studies focus on identifying and validating reference genes for quantitative reverse transcription polymerase chain reaction (RT-qPCR) data normalization. We provide here an extensive study to identify and validate suitable reference genes for gene expression analysis in the ant Atta sexdens, a threatening agricultural pest in South America. The optimal number of reference genes varies according to each sample and the result generated by RefFinder differed about which is the most suitable reference gene. Results suggest that the RPS16, NADH and SDHB genes were the best reference genes in the sample pool according to stability values. The SNF7 gene expression pattern was stable in all evaluated sample set. In contrast, when using less stable reference genes for normalization a large variability in SNF7 gene expression was recorded. There is no universal reference gene suitable for all conditions under analysis, since these genes can also participate in different cellular functions, thus requiring a systematic validation of possible reference genes for each specific condition. The choice of reference genes on SNF7 gene normalization confirmed that unstable reference genes might drastically change the expression profile analysis of target candidate genes.

Graphical Abstract

1. Introduction

Atta sexdens leaf-cutting ant is considered the main eucalyptus plantations pest and for therefore, the need to find more viable pest control methods has proportionally increased for forest plantation expansion [1]. Such insect can cause total plant defoliation in Eucalyptus species, affecting both diameter and height of trees, hence leading to a production decrease and consequent profit reduction [2]. Currently, the major strategy used to control leaf-cutting ant has been through chemical insecticides-based methods which are very toxic and have had its applications restricted by Kyoto protocol. The RNA-mediated interference (RNAi) mechanism via double-stranded RNA (dsRNA) has been a potential alternative not only to combat pest insects [3,4] but also to study gene expression in ants [5]. Regardless of the choice, it is necessary to evaluate the expression levels of target genes by quantifying transcribed RNAs at a given time, specific condition through quantitative reverse transcription polymerase chain reaction (RT-qPCR).
RT-qPCR technique is both efficient and reproducible for gene expression quantification during real time. However, many factors may influence data normalization in RT-qPCR, such as quality and integrity of RNA samples as well as efficiency in complementary DNA (cDNA) synthesis [6]. In order to minimize these influences on experiments and at the same time ensure their reproducibility, data normalization from gene expression analysis of reference genes is commonly employed since both reference and target genes can be quantified in the same samples [7,8].
The reference gene choice has to be thoroughly made, hence, picking endogenous genes that express quantitatively themselves in all cells regardless of conditions and stimuli [9]. RefFinder (East Carolina University, Greenville, NC, USA) is currently the most promising evaluation tool for reference genes selection as provides the ranking of genes based on results from four distinct softwares geNorm [7], NormFinder [10], BestKeeper [11] and Delta-Ct [12] and also calculates the geometric mean of their values for a final general ranking [13], generating more consistent and appropriate results for RT-qPCR analyses.
The statistics from geNorm and BestKeeper depends on that expression ratio of two ideal reference genes be constant among all samples regardless of experimental conditions. On the other hand, NormFinder considers that considers that expression stability average variations of multiple genes are lower than those observed in single genes expression and that reference genes involved with different groups may contribute to decrease such variations [14]. Gene classification using the Delta-Ct method is based on partial comparisons through crude values, taking into account that the mean standard deviation (SD) of each set of genes is inversely proportional to gene stability [12].
The reference gene stability by the geNorm software is calculated from an M value, defined as the average expression variation of a given gene over all others tested. Genes with the lowest M values have the most stable expression [7] and M values equal to 1.5 are generally considered cut-off values [15,16,17]. The NormFinder software is based on analysis of variance and allows estimating the variation value of intra and inter-sample gene expression, as well as the calculation of expression stability (SV) values for candidate reference genes. Genes with lower SV are considered more stable and show the lowest variation combining intra and inter-sample expression [10]. BestKeeper software individually evaluates the gene expression stability for all genes based on three variables: standard deviation (SD), correlation coefficient (r) and percentage of covariance (PC) [11]. The Delta-Ct analyzes the variability index among Cq values of samples and, at the end, the lowest value is considered the most stable [12]. The NormFinder software is based on analysis of variance and allows estimating the variation value of intra and inter-sample gene expression, as well as the calculation of expression stability (SV) values for candidate reference genes. Genes with lower SV are considered more stable and show the lowest variation combining intra and inter-sample expression [10]. BestKeeper software evaluates the gene expression stability for all genes individually based on three variables: standard deviation (SD), correlation coefficient (r) and percentage of covariance (PC) [11]. The Delta-Ct analyzes the variability index among Cq values of samples and, at the end, the lowest value is considered the most stable [12].
This approach has been successfully applied on reference genes determination in a wide range of organisms including plants, insects and animals, such as Coffea arabica [18], Solenopsis invicta [19] and Ovis aries [20], respectively.
The aim of this study was to select a set of reference genes with stable expression in different A. sexdens samples based on the RefFinder results. The stability of candidate genes as ribosomal protein L18 (RPL18), ribosomal protein L32 (RPL32), ribosomal protein S16 (RPS16), glyceraldehyde-3-phosphate dehydrogenase (GAPDH), NADH dehydrogenase (NADH) and succinate dehydrogenase B (SDHB) was evaluated in different tissues (head and midgut of forager and larval midgut), development stages (foragers, larva and pupa) and castes (foragers, soldier and queen). As a result, different sets of reference genes were recommended according to each sample group, as well as optimal gene numbers. Finally, we validated the selection of our reference genes by evaluating the SNF7 gene expression profile, involved in identifying and selecting proteins that will undergo lysosomal degradation [21].

2. Materials and Methods

2.1. Biological Samples

All samples came from three colonies of A. sexdens ants kept in the Laboratory of Integrated Pest Management, Department of Entomology, Federal University of Lavras, MG, Brazil. The ants were maintained at 23 ± 2 °C under relative humidity of 60 ± 10%. Ants were fed on Acalypha hispida, Morus nigra or Hibiscus sabdariffa leaves, once a day.
Each biological triplicate consisted of 25 individuals (forager, soldier and pupa) from one colony. The biological triplicates from “larva” (75 larva) and “head” samples (75 heads) were collected by using surgical scissors and immediately placed in liquid nitrogen for maceration. Midgut of foragers and larva (200 units per replicate) were removed under a magnifying glass Stemi 2000 (Zeiss, Thornwood, NY, USA) model and directly macerated in TRIzol® Reagent (Invitrogen, Carlsbad, CA, USA). The queens were randomly collected upon flock and after wing drop. Each biological sample consisted of 25 individuals stored at −80 °C in a 50 mL falcon tube for further maceration.

2.2. Total RNA Extraction and cDNA Synthesis

Total RNA was extracted using TRIzol® Reagent (Invitrogen, Carlsbad, CA, US), dissolved in RNase-free water and stored at −80 °C. The RNA integrity was determined by denaturing agarose gel (1.2%) electrophoresis in 1× TAE buffer (0.04 M Tris-acetate, 0.001 M EDTA (pH 8.0)) and stained by ethidium bromide (EtBr). The intense ribosomal RNA bands with absence of smears after electrophoresis confirmed the RNA integrity. The RNA concentration of each sample was measured in triplicate using a Nanodrop 1000 spectrophotometer (ThermoFischer Scientific, Waltham, MA, USA). The RNA purity was measured by the 260/280 nm ratio, with expected values between 1.8 and 2.0.
Thereafter, the RNA samples were treated with DNase (TURBOTM DNase-Ambion, Waltham, MA, USA), according to the manufacturer’s recommendations. cDNAs were synthesized from 800 ng of total RNA in triplicate by using the High-Capacity cDNA Reverse Transcription kits (Applied Biosystems-Life Technologies, Waltham, MA, USA) following the manufacturer’s recommendations. The cDNA quality was confirmed by the RPL18 gene (108 bp) amplification followed by 1.0% agarose gel electrophoresis using 10 μL of its PCR product. The synthesized cDNAs were stored at −80 °C for further RT-qPCR.

2.3. Selection of Candidate Reference Genes and Primer Design

A set of six candidate genes were selected comprising several conventionally used reference genes in insects and other species based on previous reports [22,23,24] such as: ribosomal protein L18 (RPL18), ribosomal protein L32 (RPL32), ribosomal protein S16 (RPS16), glyceraldehyde-3-phosphate dehydrogenase (GAPDH), NADH dehydrogenase (NADH) and succinate dehydrogenase B (SDHB).
Orthologous sequences search for candidate reference genes was performed through the Basic local alignment search tool (BLAST), using the available sequences of the genes under study on GenBank (http://www.ncbi.nlm.nih.gov/) and in the ant Atta cephalotes genome (http://www.antgenomes.org) (Table 1).
The sequences were submitted to Primer Express software version 3.0 (Applied Bio-systems) for primer design. The length of the primers was between 20 and 22 bp with GC content ranging from 45% to 60% and a melting temperature (Tm value) in a range from 57 to 63 °C.
The primer pair specificity was verified through the dissociation (melting) curve analysis. Both PCR amplification efficiency (E) and regression coefficient (R2) were determined during the validation of primers according to the standard curve method using a set of all cDNA samples with 5× serial dilution. The specifications of the selected reference genes and primer pairs are shown on Table 1.

2.4. RT-qPCR Amplification

RT-qPCR analyses were performed using the Applied Biosystems 7500 Real-Time PCR system with a reaction mix containing 5.0 μL of SYBR® Green PCR Master Mix (Applied Biosystems, Foster City, CA, USA), 1.0 μL of cDNA, optimized concentrations of primers (see Table 1) and RNase-free water to a total volume of 10.0 μL. Amplification conditions were: initial denaturation at 95 °C for 10 min and 40 cycles of denaturation at 95 °C for 15 s with both annealing and extension steps at 60 °C for 1 min. In order to confirm the primer specificity, melting curves were recorded after the 40 amplification cycles had been completed by increasing the temperature from 60 to 95 °C. All RT-qPCR assays were carried out in technical and biological triplicate.

2.5. Expression Stability Analysis of Candidate Reference Genes

The expression levels of candidate reference genes were determined based on the quantification cycle (Cq), also known as the threshold cycle (Ct), which is defined as the cycle at which the amplification fluorescence exceeds the one coming from the background [25]. The Cq values were determined by using 7500 software version 2.0.5 (Applied Biosystems, Foster City, CA, USA) and corrected according to the efficiency of each primer pair [18]. Box plot diagrams were made using Microsoft Excel 2013 to illustrate levels and variations in expression of each tested reference gene.
The RefFinder tool (http://150.216.56.64/referencegene.php) was employed to assess the gene expression stability in four sample sets: (i) caste (queen, forager and soldier), (ii) development stages (larva, pupa and forager) (iii) tissues (forager head, larval midgut and forager midgut) and (iv) a pool of biological samples representing all sample types from (i) to (iii).

2.6. Determination of the Minimum Number of Reference Genes

Based on the rank order obtained after RefFinder analyses, pairwise variations (V-values) were calculated for each dataset to establish the minimum number of reference genes needed for accurate data normalization. In summary, Vn/n + 1 is calculated between each set of two sequential normalization factors (NF) (starting with the relative expression values of the two most stable genes, as ordered by RefFinder) for all samples in each dataset.
An array consisting of the log2-transformed NF ratios of every sequential combination of two NF in each sample is calculated. Finally, the standard deviation (SD) of the array data for each NF combination is calculated (Vn/n + 1) and plotted to display changes in expression stability of NF in comparison to the employed number of genes [6].

2.7. Validation of Reference Genes by SNF7 Expression Analysis

To verify how the expression data normalization for a gene of interest is affected by employing different reference genes, using both the most-stable reference genes and the most-unstable ones, the same eight cDNA samples used for the stability analyses of reference genes were also analyzed by RT-qPCR and then calculated by applying Pfaffl formula [26] for the SNF7 gene expression.

3. Results

3.1. Primer Specificity and Efficiency

Primer specificity during PCR amplifications was confirmed by the presence of a single peak on the melting curve.
The PCR efficiency (E) and the regression coefficient (R2) were calculated using the slope of the standard curve established for each primer pair. E-values ranged from 90% to 102% and R2 showed values equal to or greater than 0.973 (Table 1), indicating that template cDNA was successfully duplicated at the end of each cycle.

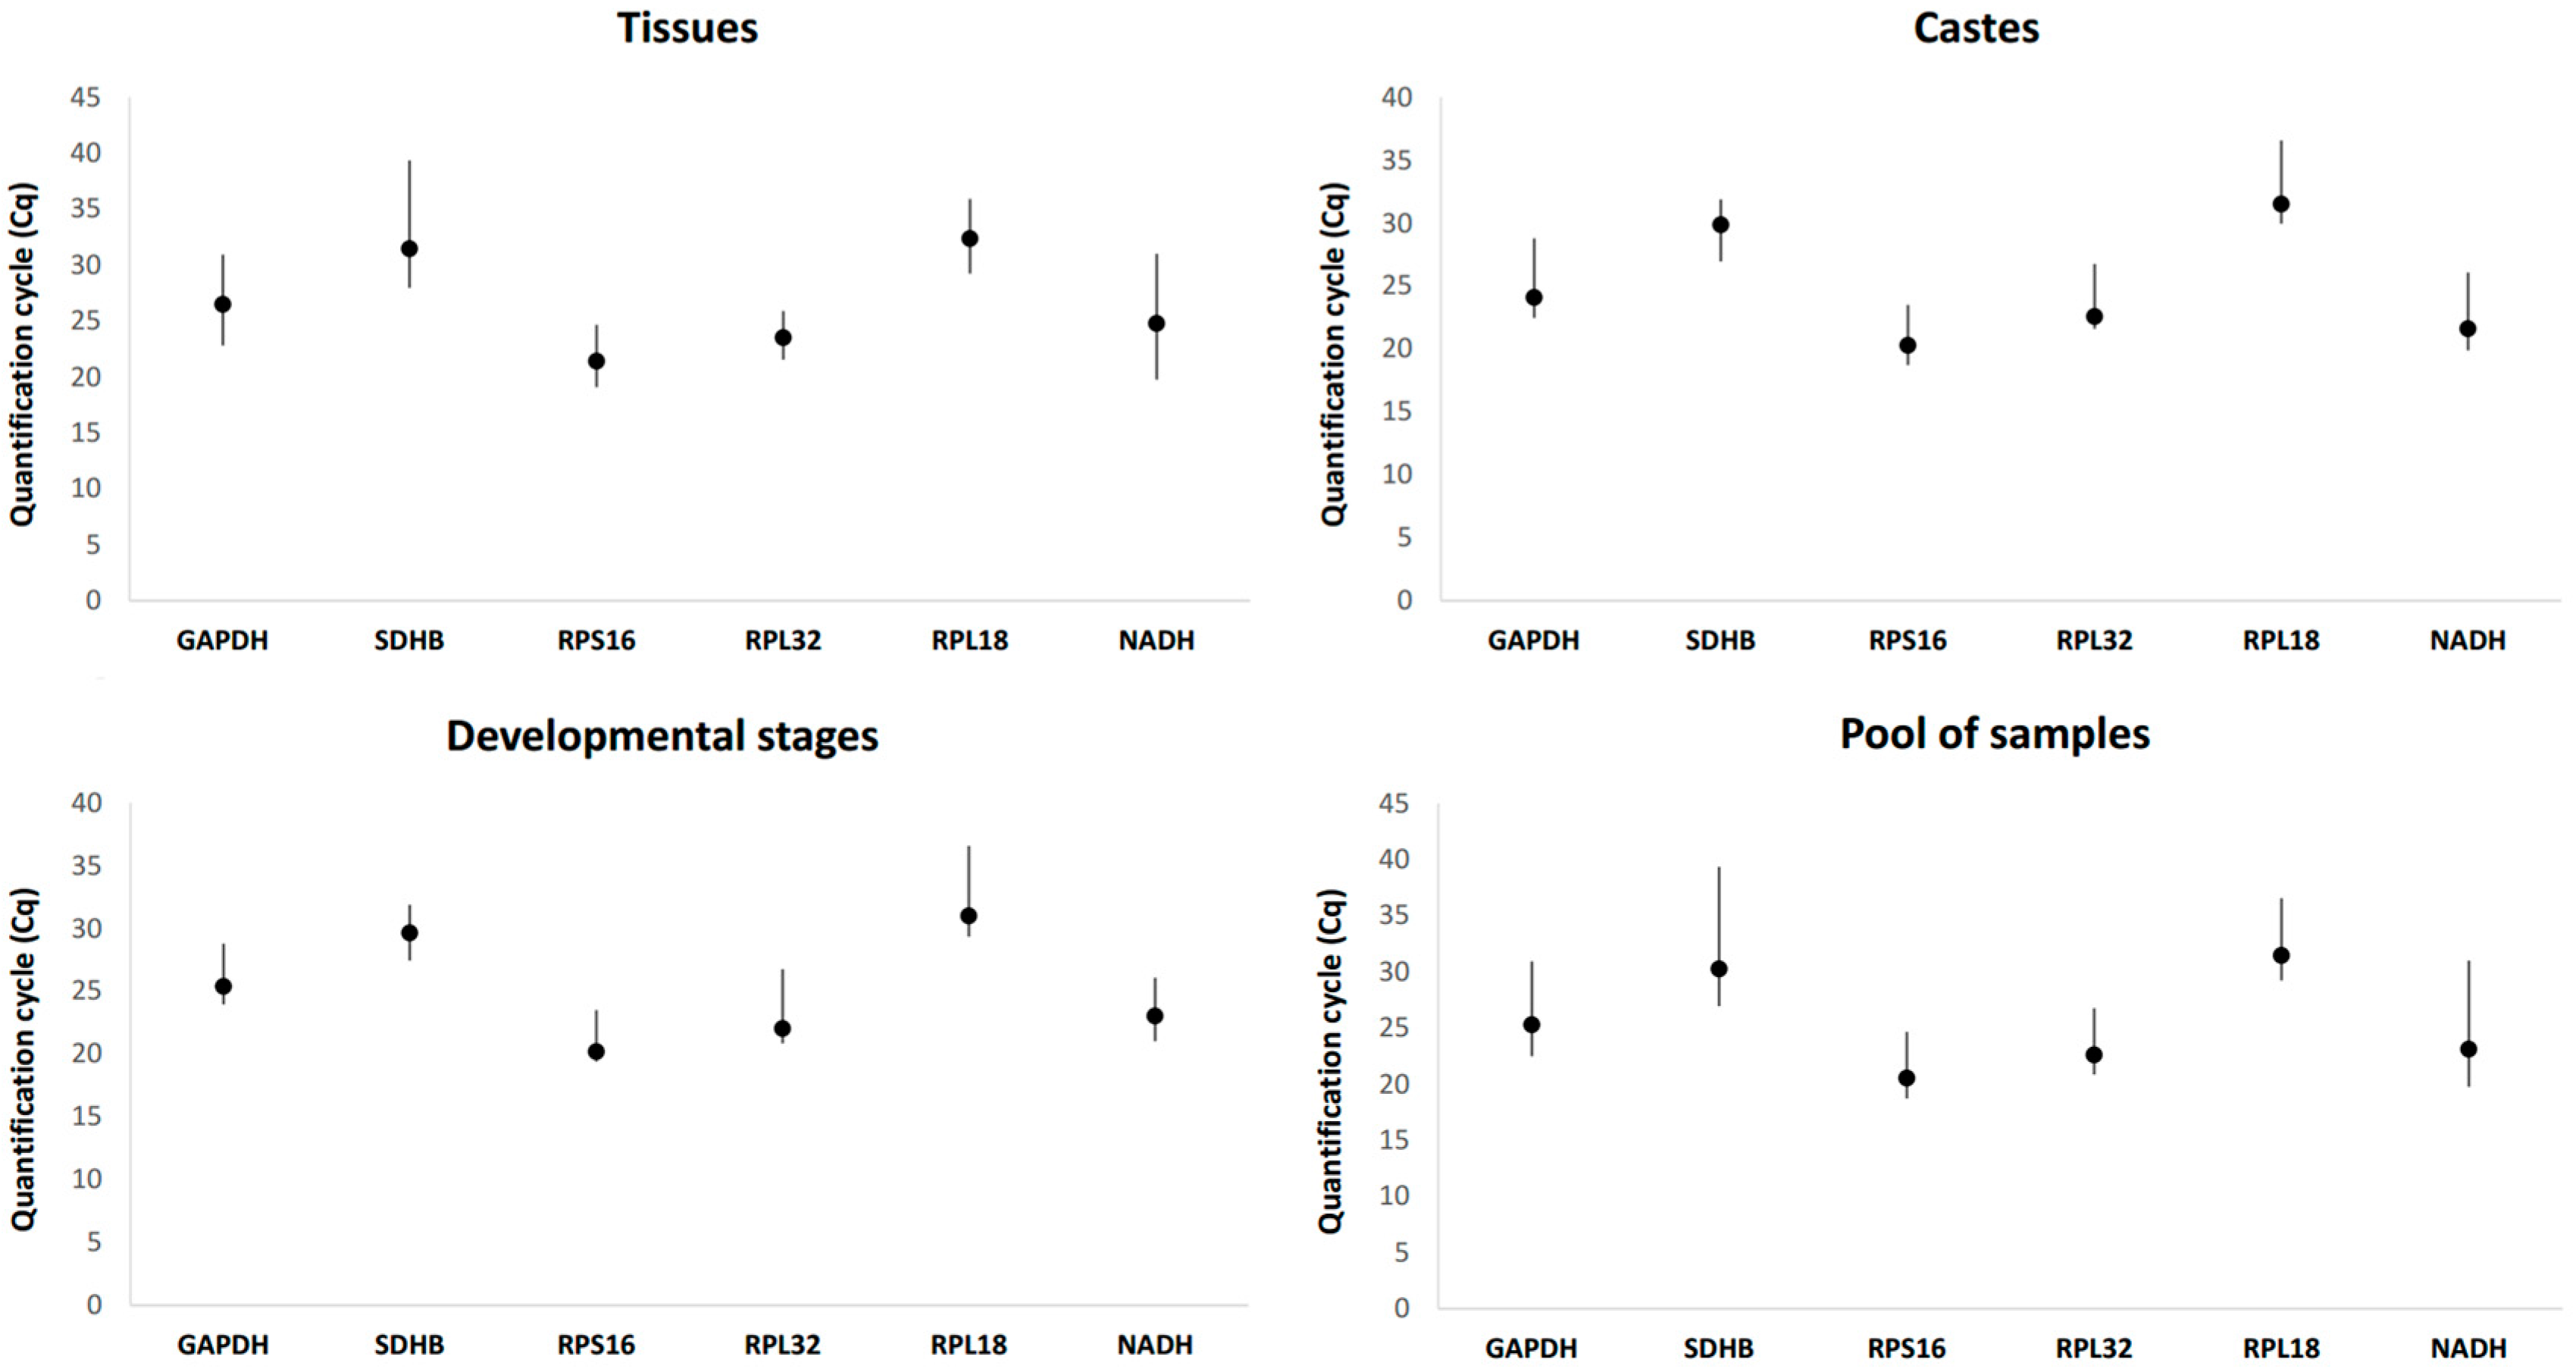
3.2. Expression Profile of Candidate Reference Genes

The expression levels and variations of the tested genes were analyzed for sample sets: caste (Queen, forager and soldier), development stages (larva, pupa and forager), tissues (forager head, larval midgut and forager midgut) and a pool of biological samples representing all sample types from caste, development stages and tissues (Figure 1). The six potential reference genes showed expression with a wide range of Cq values (18.7 to 39.4).
In the sample pool analysis, RPL18 showed the lowest expression level with an average Cq value equivalent to 31.5 cycles, unlike RPS16 which showed the highest expression level with an average value of 20.6 cycles. All candidate reference genes showed average Cq values ranging from 20 to 31 cycles. The highest expression variations among all tested samples were verified in the SDHB and NADH genes (ΔCq = 12.4 and 11.3, respectively) and the lowest in the RPS16 and RPL32 genes (ΔCq = 5.9 and 5.8, respectively). ΔCq represents the variation between the maximum and minimum Cq for each gene.
By analyzing the different collected tissues (forager head, larval midgut and forager midgut), the expression levels ranged from 19.8 to 39.4 cycles. The most expressed gene was RPS16 with average Cq value equivalent to 21.4 cycles. SDHB was the lowest expressed gene with an average Cq value of 31.5 cycles. In general, the highest expression of each candidate gene was observed in the “forager head” samples, except for the RPL32 gene. This gene had the lowest variation in the expressions among all samples (ΔCq = 4.4). The opposite was observed in SDHB gene expression (ΔCq = 11.4), which ranged from 28.0 to 39.4 cycles, being less expressed in larval midgut tissues.
When the castes were analyzed, it was possible to observe that candidate genes showed the highest expression in soldier samples, except for the RPL18 gene, which was more expressed in the queens. In this case, the variation in candidate gene expressions ranged from 18.7 to 36.6 cycles. The lowest expression (Cq of 31.5 cycles) was observed for the RPL18 gene in forager ants, while the highest expression (Cq of 20.3 cycles) was in the RPS16 gene in soldiers. In the forager ants, it was possible to verify the highest expression variations among all genes when castes were analyzed and the development stages when the samples were analyzed.
Forager, larva and pupa were the samples used to analyze the candidate reference gene expression during ant development stages. RPS16 and NADH genes showed the lowest mean values of Cq, 21.1 and 23.4 cycles, respectively, in forager. In larva, the RPS16 gene showed the highest expression, with average Cq of 19.7 cycles. The other three genes (RPL18, GAPDH and SDHB) were less expressed at the pupal stage. RPL18 candidate gene showed the highest variation (ΔCq = 7.2) among the samples from development stages, with expression profile between 29.3 and 36.6 cycles.

3.3. Expression Stabilities of Candidate Reference Genes

The geNorm, NormFinder, Bestkeeper and Delta-Ct software packages were used through the RefFinder tool. Besides generating the analyses of each program, RefFinder serves as means of comparison between candidate genes general classification. The RefFinder analysis is essential when algorithms generate frequently contrasting results.
The geNorm, NormFinder, Bestkeeper and Delta-Ct software packages were used through the RefFinder tool. Besides generating the analyses of each program, RefFinder serves as mean of comparison between candidate genes general classification. The RefFinder analysis is essential when algorithms generate frequently contrasting results.
In expression stability analysis of candidate reference genes on the sample pool (Table 2), the M values from geNorm software were lower than the stability cut-off value (1.5).
The most stable genes were GAPDH and NADH (M = 0.132) and the less stable genes were RPL32 (M = 0.248) and RPL18 (M = 0.234). NormFinder identified RPS16 (SV = 0.056) as the most stable reference gene and RPL32 (SV = 0.228) as the least stable. BestKeeper indicated the SDHB gene as the most stable candidate (SD = 0.168) and RPL32 (SD = 0.247) as the least stable. The Delta-Ct method determined RPS16 and NADH as the most stable genes, with stability values equal to 0.204 and 0.246, respectively. The RPL32 gene displayed the lowest stability (0.275). The final ranking suggested that the most stable reference gene was RPS16 (1.565) followed by NADH (2.060), while RPL32 was the least stable gene (6.000).
For analysis of different tissues, the geNorm and BestKeeper software indicated the RPL18 gene as the most stable, with stability values of 0.079 and 0.204, respectively. However, NormFinder and Delta-Ct indicated the RPS16 gene as the most stable, with stability values equal to 0.073 and 0.243, respectively. SDHB gene was considered the least stable in all methods of analysis. The final ranking suggested that the most stable reference gene was RPL18 (1.414), followed by RPS16 (1.968) and the least stable genes were SDHB (5.233) and RPL32 (5.045) (Table 3).
Among the castes, the RPS16 gene was considered the most stable in the Normfinder, BestKeeper and Delta-Ct software, with stability values of 0.106, 0.182 and 0.208, respectively. GAPDH and NADH were the most stable genes through geNorm analysis, with M = 0.122 and the least stable gene being RPL18 (M = 0.237), also considered the least stable gene in the analyses of all other three software packages. The final ranking showed RPS16 (1.316) as the most stable reference gene, followed by NADH (1.861), while the least stables were RPL32 (4.229) and RPL18 (6.000) (Table 4).
Analyses from NormFinder, BestKeeper and Delta-CT suggested that the RPS16 and NADH genes were the most and least stable, respectively, after evaluating samples from development stages. In the same sample set, the analysis performed by geNorm showed that the most stable genes were RPL32 and RPL18 (M = 0.163) and, similar to outcomes from other software, the NADH gene was the least stable (0.308). The final ranking suggested that the most stable reference gene was RPS16 (1.316) followed by RPL32 (2.115), while the least stable genes were SDHB (4.162) and NADH (6.000) (Table 5).

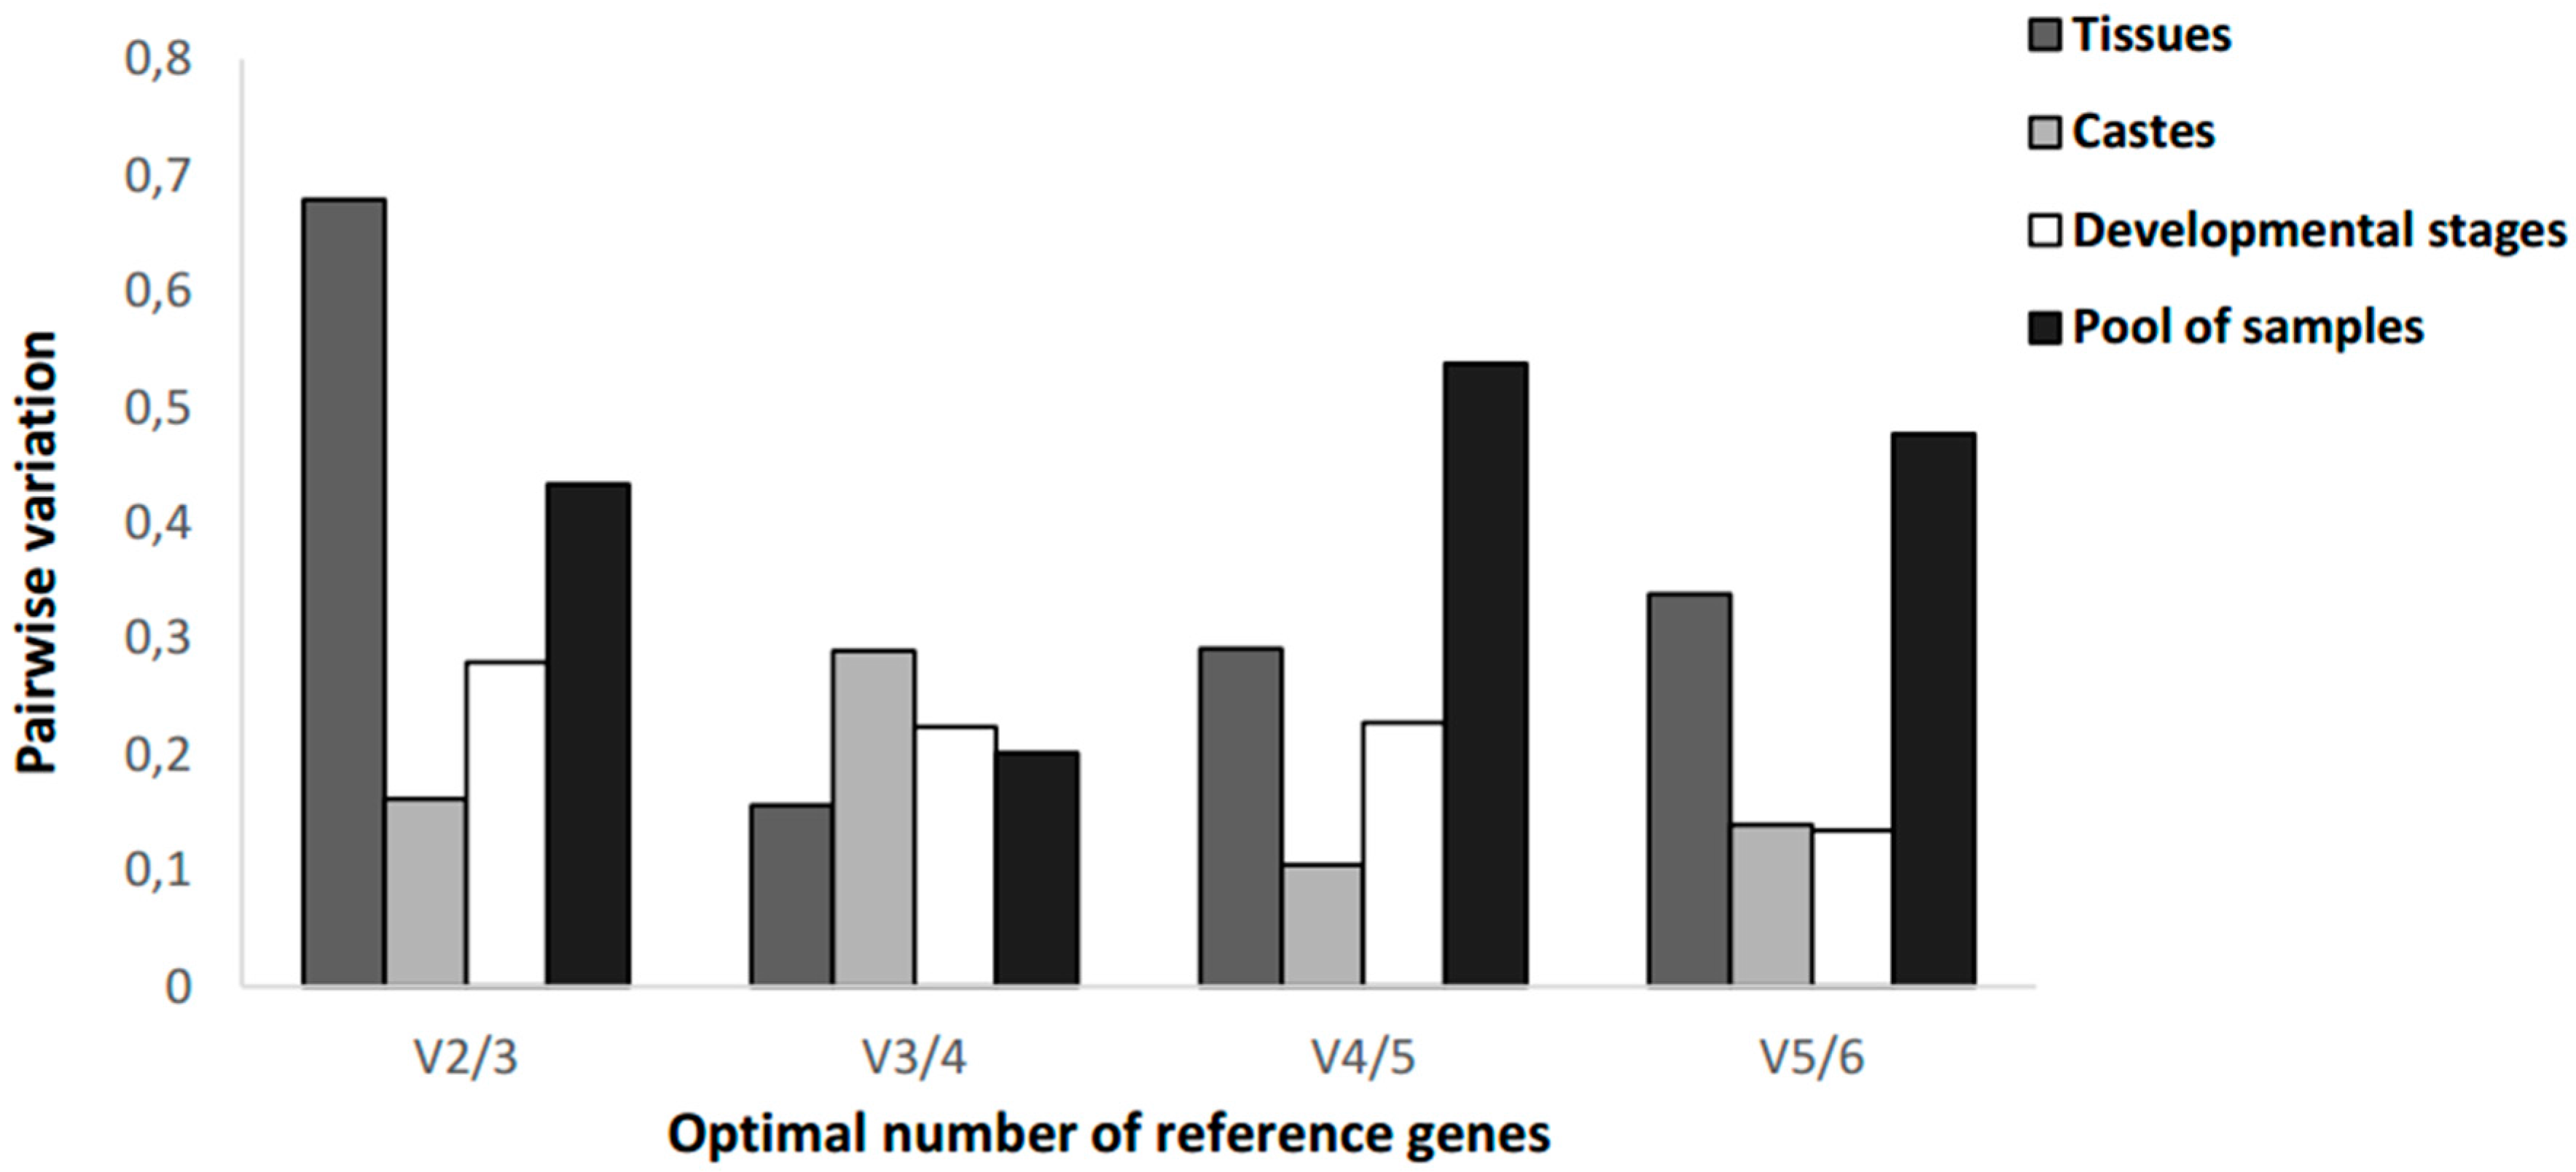
3.4. Determination of the Minimum Number of Reference Genes

In order to generate more accurate and reliable gene expression results, putting stable reference genes together is essential when multiple reference genes are used [24]. Normalization with an inappropriate number of reference genes can lead to significant analysis errors [7]. The optimal number of reference genes to be used for a more accurate normalization is determined by calculating V-values as a pairwise variation (Vn/Vn + 1) between two consecutively ranked normalization factors (NF) after the stepwise addition of the subsequent more stable reference gene (NFn and NFn + 1) [7], which is included in the geNorm package. The n indicates the number of the most stable reference genes.
In our study results showed that pairwise variation value for V3/4 was the lowest (0.20), indicating that the combination among three most stable reference genes would be sufficient for the gene expression normalization within total sample pool (Figure 2).
For gene expression analysis in different tissues (forager head, larval midgut and forager midgut), the pairwise variation value for V3/4 was the lowest (0.156), indicating that the combination among three most stable reference genes would also be sufficient for normalization in different tissue samples.
The ideal gene expression normalization in caste samples (forager, soldier and queen) was obtained using the four most stable reference genes, on behalf of the Pairwise variation values for V4/5 to be equal to 0.105.
Finally, for gene expression analysis at the development stages (larva, pupa and forager), the pairwise variation values for V5/6 were the lowest (0.134), indicating that the combination among five most stable reference genes would be sufficient for the gene expression normalization.
The threshold variation value in pairs of 0.15 as demonstrated in the Vandesompele et al. (2002) [7] studies should not be rigorous and trend to change V-values is recognized as being equally effectual [27]. Moreover, normalization patterns indicate the use from two to five stable and validated reference genes as the most appropriate approach to normalize RT-qPCR data [28]. We have observed that the variability decrease obtained by adding a high number of reference genes does not overcome some disadvantages related to time consumption and additional costs after such inclusions.

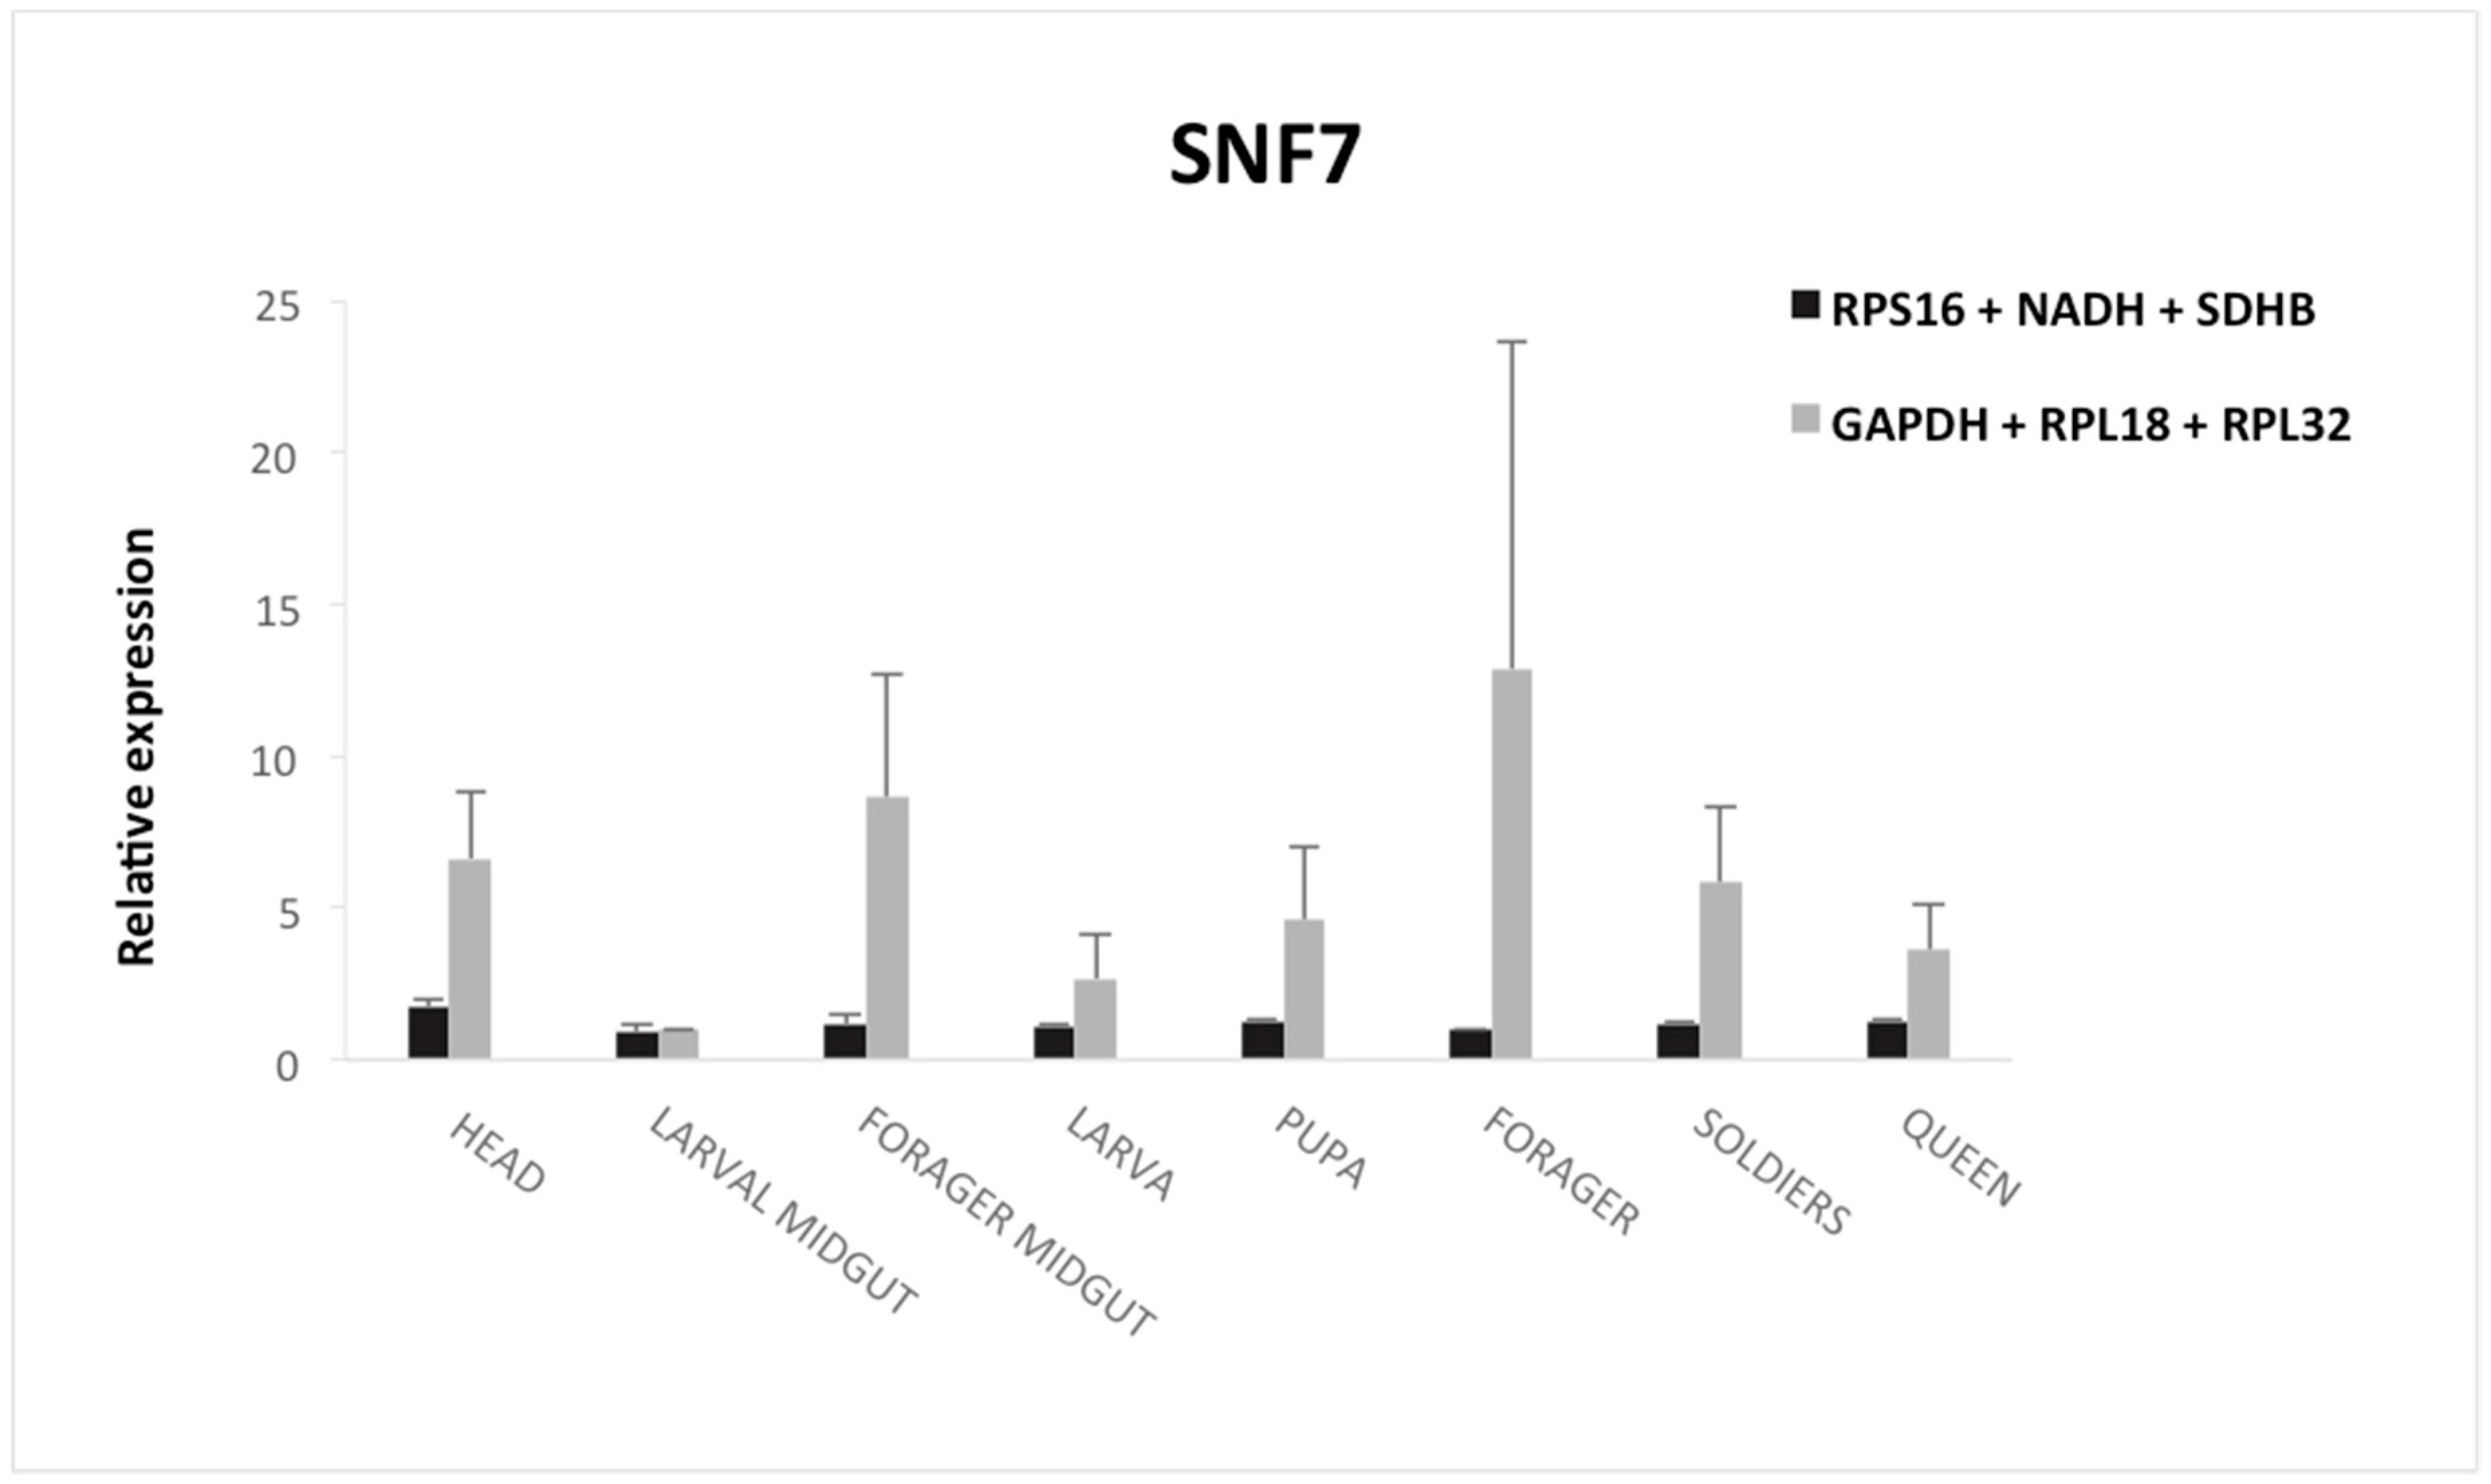
3.5. Validation of the Selected Reference Genes

To evaluate the reference gene selection impact on gene expression measurements, we analyzed SNF7 gene expression using two normalization strategies: the combination of the three most stable genes (RPS16, NADH and SDHB) or the three most unstable (RPL32, RPL18 and GAPDH) in the sample pool (Figure 3).
Relative abundance of transcripts for the target gene was dependent on reference genes used for normalization. The SNF7 expression levels were over-estimated when using non-suitable reference genes for normalization. The SNF7 expression pattern shows stable expression with a relative expression ratio around 1 in all samples. In contrast, when less stable genes were used for normalization, it was possible to verify a large variability in SNF7 gene expression. Furthermore, identified normalization controls resulted in significantly lower standard deviations, ensuring greater reproducibility of results. Thus, indicating that questionable results could be produced if unstable reference genes had been used. These results show the importance of validating reference genes prior to experimental applications.

4. Discussion

Among the RT-qPCR applications, stand out the gene expression profile analysis, monitoring of primer efficiency and verification of gene knockdown through RNA interference-mediated functional effects, among others [29,30].
Regardless of the application, all experiments with RT-qPCR analyses should be standardized with more than one reference gene and these should be validated regarding its stability to avoid erroneous differences in expression [13]. In a recent research, RT-qPCR normalization procedures were analyzed in more than 1700 published papers and it was concluded that most articles had inadequate standardization procedures [31].
We have observed in some studies about gene expression in ants the use of only a single reference gene without any mention of its validation. Expression analyzes of genes involved in immunological responses, such as PGRP-LB and PGRP-SC2 in the ant Camponotus floridanus were normalized with only one reference gene, the RPL32 [32]. Similarly, the reference gene β-actin was the only one used for normalization of Calreticulin gene expression [33] and Muscarinic Cholinergic receptor [34] in studies with Polyrhachis vicina.
Although the need for systematic selection and validation of reference genes in RT-qPCR studies is widely requested, little information is available about the stability of reference gene expression in A. sexdens, even with genomes of some ant species already available on databases [35,36,37]. The increasing number of validation studies in transcriptome analyzes [38,39] and the works associated with gene silencing based on RNAi [5,40] promise the control monitoring of important agricultural pests affecting cultivated plant performance
Our results suggest that the RPS16, NADH and SDHB genes were the best reference genes in the sample pool (head, larval and forager midgut, larva, pupa foragers and queen) according to stability values acquired by RefFinder, while the RPL32, RPL18 and GAPDH genes were the least stable under the same analyses. Few differences were observed after analyzing the results of four software packages, except for the development stage samples (Table 2, Table 3, Table 4 and Table 5).
When we compared our results with the reference genes from S. invicta ant [19], it was observed that two analyzed genes are homologous to A. sexdens genes (GAPDH and RPL18). In both studies, GAPDH is among the least stable genes. In our work, RPL18 was considered unstable to be used in normalization experiments of sample pool and castes in A. sexdens. In contrast, the expression of this gene was the second most stable in tissue samples and the third most stable in developmental stage. These results do not differ from those found in the reference gene evaluation in A. sexdens rubropilosa, on which RPL18 was the most stable gene in tissues under development stage. [41].
In Camponotus floridanus, the homologues RPL32, RPL18, EF1a (elongation factor 1-alpha) and GAPDH were evaluated. For the RPL32 gene, higher expression stability was observed in the analyses with pupa [42], in agreement with the evaluation performed on development stages in our study, in which the RPL32 gene appears ranked in second place (Table 5). Using BestKeeper, this same study showed low Cq variations in expression levels in different tissues and in development stages for all tested reference genes, indicating that all are suitable to be used as reference genes, even though they have not been validated. These results diverge from our data obtained by RefFinder, which shows high specificity for a particular experimental situation and how much careful analysis of candidate reference genes is required for each particular case.
To validate the RefFinder results, the SNF7 gene expression was investigated, showing a stable expression profile in different samples in the current study. The SNF7 gene encodes a class E vacuolar protein conserved in several organisms, such as in the fruit fly Drosophila melanogaster [43], nematode Caenorhabditis elegans [44] and plant Arabidopsis thaliana [45]. This protein belongs to the ESCRT (endosomal sorting complex required for transport) complex (III) and is involved in the selection of transmembrane proteins towards to lysosomal degradation pathway [21,46] but also in multiple cell processes in Drosophila [47,48]. Given the importance of the ESCRT-III complex and its associated proteins on the regulation of membrane receptor proteins, a natural process present in several organism cells, the relative stability of SNF7 expression in different tissues is an indication of its adequate functioning in the cellular environment. Other studies have found changing on SNF7 expression levels but only after treatment with dsRNA directed to its suppression. In Diabrotica virgifera virgifera, the SNF7 gene (DvSNF7) had a reduced expression profile in the carcass and midgut of neonatal larva [49] and midgut and fatty bodies of 2nd instar larva [50] only after suppression with caused dsRNA treatment directed to the SNF7 itself, a fact not observed in cells not treated or treated with dsRNA not specific for this target gene. Similar behavior was observed in the insects Cylas brunneus [51] and Cylas punctiollis [52]. In these cases, SNF7 expression levels remained normal in the insect body until reducing the gene expression after treatment with specific dsRNA. Such information reinforces the idea that the SNF7 gene has an expression profile generally stable in different tissues and insects, until being suppressed by exogenous molecules.
However, for the ant A. sexdens we confirm that the choice of a reference gene to normalize the relative expression profile of interest genes may change the final expression outcome and should be the subject of a careful selection.

5. Conclusions

There is no universal reference gene suitable for all variables under analysis (development stages, larval tissues, insecticide and dsRNA treatments, etc.), since these genes can also participate in different cellular functions which implies the need for a systematic validation of possible reference genes for specific conditions.
Finally, analyses of RT-qPCR with A. sexdens can be evaluated for these first-line reference genes, thus, allowing the search and study the target genes for RNAi and other biotechnology applications.

Acknowledgments

We are grateful to members of the lab of entomology who have maintained ants, especially Léa and Caroline Abreu. We wish to acknowledge financial support from Conselho Nacional de Desenvolvimento Científico e Tecnológico (CNPq), Coordenação de Aperfeiçoamento de Pessoal de Nível Superior (CAPES), Fundação de Amparo à Pesquisa do Estado de Minas Gerais (FAPEMIG/) and Financiadora de estudos e projetos (FINEP).

Author Contributions

Kalynka G. do Livramento, Natália C. Freitas, Ronald Zanetti and Luciano V. Paiva conceived and designed the experiments; Kalynka G. do Livramento and Natália C. Freitas performed the experiments; Kalynka G. do Livramento, Natália C. Freitas and Wesley P.F. Máximo analyzed the data; Kalynka G. do Livramento, Wesley P.F. Máximo and Luciano V. Paiva wrote the paper.

Conflicts of Interest

The authors declare no conflict of interest.

References

  1. Zanetti, R.; Zanuncio, J.C.; Vilela, E.F.; Leite, H.G.; Jaffé, K.; Oliveira, A.C. Level of economic damage for leaf-cutting ants (Hymenoptera: Formicidae) in eucalyptus plantations in Brazil. Sociobiology 2003, 42, 433–442. [Google Scholar]
  2. Matrangolo, C.A.R.; Castro, R.V.O.; Della Lucia, T.M.C.; Della Lucia, R.M.; Mendes, A.F.N.; Costa, J.M.F.N.; Leite, H.G. Crescimento de eucalipto sob efeito de desfolhamento artificial. Pesqui. Agropecu. Bras. 2010, 45, 952–957. [Google Scholar] [CrossRef]
  3. Asokan, R.; Sharath Chandra, G.S.; Manamohan, M.; Kumar, N.K.K.; Sita, T. Response of various target genes to diet-delivered dsRNA mediated RNA interference in the cotton bollworm, Helicoverpa armigera. J. Pest Sci. 2014, 87, 163–172. [Google Scholar] [CrossRef]
  4. Kolliopoulou, A.; Swevers, L. Recent progress in RNAi research in Lepidoptera: Intracellular machinery, antiviral immune response and prospects for insect pest control. Curr. Opin. Insect Sci. 2014, 6, 28–34. [Google Scholar] [CrossRef]
  5. Cheng, D.; Lu, Y.; Zeng, L.; Liang, G.; He, X. Si-CSP9 regulates the integument and moulting process of larvae in the red imported fire ant, Solenopsis invicta. Sci. Rep. 2015, 5, 9245. [Google Scholar] [CrossRef] [PubMed]
  6. Bustin, S.A.; Benes, V.; Garson, J.A.; Hellemans, J.; Huggett, J.; Kubista, M.; Mueller, R.; Nolan, T.; Pfaffl, M.W.; Shipley, G.L.; et al. The MIQE guidelines: Minimum information for publication of quantitative real-time PCR experiments. Clin. Chem. 2009, 55, 611–622. [Google Scholar] [CrossRef] [PubMed]
  7. Vandesompele, J.; De Preter, K.; Pattyn, F.; Poppe, B.; Van Roy, N.; De Paepe, A.; Speleman, F. Accurate normalization of real-time quantitative RT-PCR data by geometric averaging of multiple internal control genes. Genome Biol. 2002, 3, 1–11. [Google Scholar] [CrossRef] [Green Version]
  8. Zhu, X.; Yuan, M.; Shakeel, M.; Zhang, Y.; Wang, S.; Wang, X.; Zhan, S.; Kang, T.; Li, J. Selection and Evaluation of Reference Genes for Expression Analysis Using RT-qPCR in the Beet Armyworm Spodoptera exigua (Hübner) (Lepidoptera: Noctuidae). PLoS ONE 2014, 9, e84730. [Google Scholar] [CrossRef]
  9. Thellin, O.; Zorzi, W.; Lakaye, B.; De Borman, B.; Coumans, B.; Hennen, G.; Grisar, T.; Igout, A.; Heinen, E. Housekeeping genes as internal standards: Use and limits. J. Biotechnol. 1999, 75, 291–295. [Google Scholar] [CrossRef]
  10. Andersen, C.L.; Jensen, J.L.; Ørntoft, T.F. Normalization of real-time quantitative reverse transcription-PCR data: a model-based variance estimation approach to identify genes suited for normalization, applied to bladder and colon cancer data sets. Cancer Res. 2004, 64, 5245–5250. [Google Scholar] [CrossRef] [PubMed]
  11. Pfaffl, M.W.; Tichopad, A.; Prgomet, C.; Neuvians, T.P. Determination of stable housekeeping genes, differentially regulated target genes and sample integrity: BestKeeper—Excel-based tool using pair-wise correlations. Biotechnol. Lett. 2004, 26, 509–515. [Google Scholar] [CrossRef] [PubMed]
  12. Silver, N.; Best, S.; Jiang, J.; Thein, S.L. Selection of housekeeping genes for gene expression studies in human reticulocytes using real-time PCR. BMC Mol. Biol. 2006, 7, 33. [Google Scholar] [CrossRef] [PubMed]
  13. RefFinder. Evaluating Reference Genes Expression. 2016. Available online: http://150.216.56.64/referencegene.php (accessed on 16 November 2017).
  14. Vandesompele, J.; Kubista, M.; Pfaffl, M. Reference gene validation software for improved normalization. In Real-Time Pcr: Current Technology and Applications; Logan, J., Edwards, K., Saunders, N., Eds.; Caister Academic: Norfolk, UK, 2009; pp. 47–63. ISBN 978-1-904455-39-4. [Google Scholar]
  15. Mamo, S.; Gal, A.B.; Bodo, S.; Dinnyes, A. Quantitative evaluation and selection of reference genes in mouse oocytes and embryos cultured in vivo and in vitro. BMC Dev. Biol. 2007, 7, 14. [Google Scholar] [CrossRef] [PubMed]
  16. Rodrigues, T.B.; Khajuria, C.; Wang, H.; Matz, N.; Cardoso, D.C.; Valicente, F.H.; Zhou, X.; Siegfried, B. Validation of reference housekeeping genes for gene expression studies in western corn rootworm (Diabrotica virgifera virgifera). PLoS ONE 2014, 9, e109825. [Google Scholar] [CrossRef] [PubMed]
  17. Spinsanti, G.; Panti, C.; Lazzeri, E.; Marsili, L.; Casini, S.; Frati, F.; Fossi, C.M. Selection of reference genes for quantitative RT-PCR studies in striped dolphin (Stenella coeruleoalba) skin biopsies. BMC Mol. Biol. 2006, 7, 32. [Google Scholar] [CrossRef] [PubMed]
  18. Freitas, N.C.; Barreto, H.G.; Fernandes-Brum, C.N.; Moreira, R.O.; Chalfun-Junior, A.; Paiva, L.V. Validation of reference genes for qPCR analysis of Coffea arabica L. somatic embryogenesis-related tissues. Plant Cell Tissue Organ Cult. 2017, 128, 663–678. [Google Scholar] [CrossRef]
  19. Cheng, D.; Zhang, Z.; He, X.; Liang, G. Validation of Reference Genes in Solenopsis invicta in Different Developmental Stages, Castes and Tissues. PLoS ONE 2013, 8, e57718. [Google Scholar] [CrossRef] [PubMed]
  20. Jiang, X.; Xue, Y.; Zhou, H.; Li, S.; Zhang, Z.; Hou, R.; Ding, Y.; Hu, K. Evaluation of reference gene suitability for quantitative expression analysis by quantitative polymerase chain reaction in the mandibular condyle of sheep. Mol. Med. Rep. 2015, 12, 5633–5640. [Google Scholar] [CrossRef] [PubMed]
  21. Lee, J.A.; Beigneux, A.; Ahmad, S.T.; Young, S.G.; Gao, F.B. ESCRT-III dysfunction causes autophagosome accumulation and neurodegeneration. Curr. Biol. 2007, 17, 1561–1567. [Google Scholar] [CrossRef] [PubMed]
  22. Chandra, G.S.; Asokan, R.; Manamohan, M.; Kumar, N.K.K.; Sita, T. Evaluation of reference genes for quantitative real-time PCR normalization in cotton bollworm Helicoverpa armigera. Mol. Biol. 2014, 48, 813–822. [Google Scholar] [CrossRef]
  23. Yang, C.; Pan, H.; Liu, Y.; Zhou, X. Selection of Reference Genes for Expression Analysis Using Quantitative. Real-Time PCR in the Pea Aphid, Acyrthosiphon pisum (Harris) (Hemiptera Aphidiae). PLoS ONE 2014, 9, e110454. [Google Scholar] [CrossRef] [PubMed]
  24. Zhang, S.; An, S.; Li, Z.; Wu, F.; Yang, Q.; Liu, Y.; Cao, J.; Zhang, H.; Zhang, Q.; Liu, X. Identification and validation of reference genes for normalization of gene expression analysis using qRT-PCR in Helicoverpa armigera (Lepidoptera: Noctuidae). Gene 2015, 555, 393–402. [Google Scholar] [CrossRef] [PubMed]
  25. Kosera, B.; Rapacz, M. Reference genes in real-time PCR. J. Appl. Gene. 2013, 54, 391–406. [Google Scholar] [CrossRef] [PubMed]
  26. Pfaffl, M.W. A new mathematical model for relative quantification in real-time RT-PCR. Nucleic Acids Res. 2001, 29, e45. [Google Scholar] [CrossRef] [PubMed]
  27. Hong, S.Y.; Seo, P.; Yang, M.S.; Xiang, F.; Park, C.M. Exploring valid reference genes for gene expression studies in Brachypodium distachyon by real-time PCR. BMC Plant Biol. 2008, 8, 112. [Google Scholar] [CrossRef] [PubMed]
  28. Xiao, X.; Ma, J.; Wang, J.; Wu, X.; Li, P.; Yao, Y. Validation of suitable reference genes for gene expression analysis in the halophyte Salicornia europaea by real-time quantitative PCR. Front. Plant Sci. 2015, 5, 788. [Google Scholar] [CrossRef] [PubMed]
  29. Sun, M.; Lu, M.X.; Tang, X.T.; Du, Y.Z. Exploring valid reference genes for quantitative real-time PCR analysis in Sesamia inferens (Lepidoptera: Noctuidae). PLoS ONE 2015, 10, e0115979. [Google Scholar] [CrossRef] [PubMed]
  30. Maerken, T.V.; Mestdagh, P.; De Clercq, S.; Pattyn, F.; Yigit, N.; De Paepe, A.; Marine, J.-C.; Speleman, F.; Vandesompele, J. Real-Time qPCR as a Tool for Evaluating RNAi-Mediated Gene Silencing. BioTech. Protoc. Guide 2009, 47. [Google Scholar] [CrossRef]
  31. Bustin, S.A.; Benes, V.; Garson, J.; Hellemans, J.; Huggett, J.; Kubista, M.; Mueller, R.; Nolan, T.; Pfaffl, M.W.; Shipley, G.; et al. The need for transparency and good practices in the qPCR literature. Nat. Methods 2013, 10, 1063–1067. [Google Scholar] [CrossRef] [PubMed]
  32. Kupper, M.; Stigloher, C.; Feldhaar, H.; Gross, R. Distribution of the obligate endosymbiont Blochmannia floridanus and expression analysis of putative immune genes in ovaries of the carpenter ant Camponotus floridanus. Arthropod Struct. Dev. 2016, 45, 475–487. [Google Scholar] [CrossRef] [PubMed]
  33. Liu, L.; Dang, L.; Xi, G.; Wang, F. Molecular Cloning, Characterization and Expression Analysis of Calreticulin Gene in the Ant Polyrhachis vicina Roger (Hymenoptera: Formicidae). Sociobiology 2013, 60, 355–361. [Google Scholar] [CrossRef]
  34. Lü, S.M.; Zhao, Z.; Li, K.; Zhang, Y.L.; Xi, G.S. Cloning and expression analysis of a muscarinic cholinergic receptor from the brain of ant, Polyrhachis vicina. Arch. Insect Biochem. Physiol. 2011, 78, 46–60. [Google Scholar] [CrossRef] [PubMed]
  35. Elsik, C.G.; Tayal, A.; Diesh, C.M.; Unni, D.R.; Emery, M.L.; Nguyen, H.N.; Hagen, D.E. Hymenoptera Genome Database: Integrating genome annotations in HymenopteraMine. Nucleic Acids Res. 2016, 44, D793–D800. [Google Scholar] [CrossRef] [PubMed]
  36. Nygaard, S.; Zhang, G.; Schiøtt, M.; Li, C.; Wurm, Y.; Hu, H.; Zhou, J.; Ji, L.; Qiu, F.; Rasmussen, M.; et al. The genome of the leaf-cutting ant Acromyrmex echinatior suggests key adaptations to advanced social life and fungus farming. Genome Res. 2011, 21, 1339–1348. [Google Scholar] [CrossRef] [PubMed]
  37. Suen, G.; Teiling, C.; Li, L.; Holt, C.; Abouheif, E. The Genome Sequence of the Leaf-Cutter Ant Atta cephalotes Reveals Insights into Its Obligate Symbiotic Lifestyle. PLoS Genet. 2011, 7, e1002007. [Google Scholar] [CrossRef] [PubMed]
  38. Simola, D.F.; Graham, R.J.; Brady, C.M.; Enzmann, B.L.; Desplan, C.; Ray, A.; Zwiebel, L.J.; Bonasio, R.; Reinberg, D.; Liebig, J.; et al. Epigenetic (re)programming of caste-specific behavior in the ant Camponotus floridanus. Science 2016, 351, aac6633. [Google Scholar] [CrossRef] [PubMed]
  39. Gotoh, A.; Shigenobu, S.; Yamaguchi, K.; Kobayashi, S.; Ito, F.; Tsuji, K. Transcriptome profiling of the spermatheca identifies genes potentially involved in the long-term sperm storage of ant queens. Sci. Rep. 2017, 7, 5972. [Google Scholar] [CrossRef] [PubMed]
  40. Ratzka, C.; Gross, R.; Feldhaar, H. Gene expression analysis of the endosymbiont-bearing midgut tissue during ontogeny of the carpenter ant Camponotus floridanus. J. Insect Physiol. 2013, 59, 611–623. [Google Scholar] [CrossRef] [PubMed]
  41. Moreira, A.C.; Santos, A.M.; Carneiro, R.L.; Bueno, O.C.; Souza, D.H.F. Validation of reference genes in leaf-cutting ant Atta sexdens rubropilosa in different developmental stages and tissues. Int. J. Environ. Agric. Biotechnol. 2017, 2, 743–755. [Google Scholar] [CrossRef]
  42. Ratzka, C.; Gross, R.; Feldhaar, H. Systemic gene knockdown in Camponotus floridanus workers by feeding of dsRNA. Insectes Sociaux 2013, 60, 475–484. [Google Scholar] [CrossRef]
  43. Gao, F.B.; Brenman, J.E.; Jan, L.Y.; Jan, Y.N. Genes regulating dendritic outgrowth, branching, and routing in Drosophila. Genes Dev. 1999, 13, 2549–2561. [Google Scholar] [CrossRef] [PubMed]
  44. Kim, D.W.; Sung, H.; Shin, D.; Shen, H.; Ahnn, J.; Lee, S.K.; Lee, S. Differential physiological roles of ESCRT complexes in Caenorhabditis elegans. Mol. Cells 2011, 31, 585–592. [Google Scholar] [CrossRef] [PubMed]
  45. Winter, V.; Hauser, M.T. Exploring the ESCRTing machinery in eukaryotes. Trends Plant Sci. 2006, 11, 115–123. [Google Scholar] [CrossRef] [PubMed]
  46. Urquhart, W.; Mueller, G.M.; Carleton, S.; Song, Z.; Perez, T.; Uffman, J.P.; Jensen, P.D.; Levine, S.L.; Ward, J. A novel method of demonstrating the molecular and functional equivalence between in vitro and plant-produced double-stranded RNA. Regul. Toxicol. Pharmacol. 2015, 73, 607–612. [Google Scholar] [CrossRef] [PubMed]
  47. Vaccari, T.; Rusten, T.E.; Menut, L.; Nezis, I.P.; Brech, A.; Stenmark, H.; Bilder, D. Comparative analysis of ESCRT-I, ESCRT-II and ESCRT-III function in Drosophila by efficient isolation of ESCRT mutants. J. Cell Sci. 2009, 122, 2413–2423. [Google Scholar] [CrossRef] [PubMed]
  48. Sweeney, N.T.; Brenman, J.E.; Jan, Y.N.; Gao, F.B. The coiled-coil protein shrub controls neuronal morphogenesis in Drosophila. Curr. Biol. 2006, 16, 1006–1011. [Google Scholar] [CrossRef] [PubMed]
  49. Bolognesi, R.; Ramaseshadri, P.; Anderson, J.; Bachman, P.; Clinton, W.; Flannagan, R.; Ilagan, O.; Lawrence, C.; Levine, S.; Moar, W. Characterizing the Mechanism of Action of Double-Stranded RNA Activity against Western Corn Rootworm (Diabrotica virgifera virgifera LeConte). PLoS ONE 2012, 7, e47534. [Google Scholar] [CrossRef] [PubMed]
  50. Ramaseshadri, P.; Segers, G.; Flannagan, R.; Wiggins, E.; Clinton, W.; Ilagan, O.; McNulty, B.; Clark, T.; Bolognesi, R. Physiological and Cellular Responses Caused by RNAi-Mediated Suppression of Snf7 Orthologue in Western Corn Rootworm (Diabrotica virgifera virgifera) Larvae. PLoS ONE 2013, 8, e54270. [Google Scholar] [CrossRef] [PubMed]
  51. Christiaens, O.; Swevers, L.; Smagghe, G. DsRNA degradation in the pea aphid (Acyrthosiphon pisum) associated with lack of response in RNAi feeding and injection assay. Peptides 2014, 53, 307–314. [Google Scholar] [CrossRef] [PubMed]
  52. Prentice, K.; Christiaens, O.; Pertry, I.; Bailey, A.; Niblett, C.; Ghislain, M.; Gheysen, G.; Smagghe, G. RNAi-based gene silencing through dsRNA injection or ingestion against the African sweetpotato weevil Cylas puncticollis (Coleoptera: Brentidae). Pest Manag. Sci. 2016, 73, 44–52. [Google Scholar] [CrossRef] [PubMed]
Figure 1. Expression of candidate reference genes as determined by the quantification cycle (Cq) values determined in four sample sets. Bars indicate maximum and minimum Cq values while circles represent mean values.
Insects 09 00018 g001
Figure 2. Pairwise (V) variation calculated by geNorm to determine the optimal number of reference genes.
Insects 09 00018 g002
Figure 3. Differential gene expression of SNF-7 using the selected reference gene. Relative gene expression quantification was performed using two different normalization strategies: the combination of the three top ranked genes and combination three most unstable genes. The columns represent the gene expression in different samples (head, larval midgut, forager midgut, larva, pupa, forager, soldiers and queen) of Atta sexdens. Error bars indicate standard deviation (SD).
Insects 09 00018 g003
Table 1. Description of the candidate reference genes and SNF7 for RT-qPCR analysis.
Gene AbbreviationAccession NumberPrimer Sequence (Forward/Reverse 5′–3′)Concentration (uM)Tm (°C)Amplicon (pb)E (%)R2
RPL18EH413666CTCTGTCGTTTCCGCTGTCTCACCTTCCGATCATGCTTATG0.460.59 60.48108102.070.973
RPL32JQ744274.1TTCTGCCTTTCTGTTTTTCGTTTGGGTCGATAAACTGGTC1.058.15 57.529199.6270.997
RPS16EH413178.1GAAACAAAAAGAGCCGATCCTCCACGTCCACGTTTACAAT0.458.77 58.908899.2230.988
GAPDHEH413647CGTGGTATGACAACGAGTACGGGAGTTAGGAGGACGCAGATGAA0.462.62 60.7612099.2390.986
NADHNM_001162323GGAAAAATCGCACTAGGAGGATGTGTAGTTGCTGCTTCCATAA0.460.57 58.5213793.5290.99
SDHBNM_001162436GCTAATGTGAGCCAAAAGCCGATGCTGCGTTGTGTCATCT0.459.85 59.8713999.3460.984
SNF-7 aXM_012199288.1GAGCCAACTGCTCCTTCAACTTCGACGCATTTTTCTTCG0.460.31 59.1213491.6050.996
a Used in validation of selected reference genes.
Table 2. Ranking of candidate reference genes according to stability values evaluated in a pool of A. sexdens biological samples.
RankinggeNormNormFinderBestKeeperDelta-CtRefFinder
Stability M-Value GeneStability SV-Value GeneStability SD-ValueGeneStability ΔCt-ValueGeneOverall Stability ValueGene
10.132GAPDH/NADH0.056RPS160.168SDHB0.204RPS161.565RPS16
2--0.176NADH0.189RPS160.246NADH2.060NADH
30.192RPS160.183SDHB0.212NADH0.249SDHB2.213SDHB
40.207SDHB0.188RPL180.218RPL180.253RPL183.344GAPDH
50.234RPL180.207GAPDH0.241GAPDH0.260GAPDH4.229RPL18
60.248RPL320.228RPL320.247RPL320.275RPL326.000RPL32
Sample pool comprised forager, soldier, queen, pupa, larva, head and midgut of forager and larval midgut. Ribosomal protein L18 (RPL18), ribosomal protein L32 (RPL32), ribosomal protein S16 (RPS16), glyceraldehyde-3-phosphate dehydrogenase (GAPDH), NADH dehydrogenase (NADH) and succinate dehydrogenase B (SDHB).
Table 3. Ranking of candidate reference genes according to stability values evaluated in tissues of A. sexdens.
RankinggeNormNormFinderBestKeeperDelta-Ct RefFinder
Stability M-ValueGeneStability SV-ValueGeneStability SD-ValueGeneStability ΔCt-ValueGeneOverall Stability ValueGene
10.079RPL18/NADH0.073RPS160.204RPL180.243RPS161.414RPL18
2--0.081RPL180.208NADH0.244RPL181.968RPS16
30.121GAPDH0.111GAPDH0.226RPL320.251GAPDH2.060NADH
40.144RPS160.113NADH0.248GAPDH0.270NADH4.000GAPDH
50.176RPL320.217RPL320.269RPS160.309RPL325.045RPL32
60.322SDHB0.599SDHB0.300SDHB0.613SDHB5.233SDHB
Samples comprised three tissues such as head and midgut from the forager and larval midgut. Ribosomal protein L18 (RPL18), ribosomal protein L32 (RPL32), ribosomal protein S16 (RPS16), glyceraldehyde-3-phosphate dehydrogenase (GAPDH), NADH dehydrogenase (NADH) and succinate dehydrogenase B (SDHB).
Table 4. Ranking of candidate reference genes according to stability values evaluated in castes of A. sexdens.
RankinggeNormNormFinderBestKeeperDelta-CtRefFinder
Stability M-ValueGeneStability SV-ValueGeneStability SD-ValueGeneStability ΔCt-ValueGeneOverall Stability ValueGene
10.122GAPDH/NADH0.106RPS160.182RPS160.208RPS161.316RPS16
2--0.135NADH0.187SDHB0.218NADH1.861NADH
30.189RPS160.154GAPDH0.231NADH0.227GAPDH2.590GAPDH
40.201SDHB0.181RPL320.237RPL320.245RPL323.761SDHB
50.222RPL320.209SDHB0.241GAPDH0.257SDHB4.229RPL32
60.237RPL180.218RPL180.251RPL180.267RPL186.000RPL18
Samples comprised three castes such as forager, soldier and queen. Ribosomal protein L18 (RPL18), ribosomal protein L32 (RPL32), ribosomal protein S16 (RPS16), glyceraldehyde-3-phosphate dehydrogenase (GAPDH), NADH dehydrogenase (NADH) and succinate dehydrogenase B (SDHB).
Table 5. Ranking of candidate reference genes according to stability values evaluated in development stages of A. sexdens.
RankinggeNormNormFinderBestKeeperDelta-Ct RefFinder
Stability M-ValueGeneStability SV-ValueGeneStability SD-ValueGeneStability ΔCt-ValueGeneOverall Stability ValueGene
10.163RPL32/RPL180.114RPS160.174RPS160.261RPS161.316RPS16
2--0.208RPL320.208GAPDH0.293RPL322.115RPL32
30.196RPS160.213RPL180.211SDHB0.296RPL182.449RPL18
40.253SDHB0.230GAPDH0.229RPL180.316GAPDH3.557GAPDH
50.285GAPDH0.247SDHB0.243RPL320.329SDHB4.162SDHB
60.308NADH0.293NADH0.274NADH0.353NADH6.000NADH
Samples comprised three development stages such as forager, pupa and larva. Ribosomal protein L18 (RPL18), ribosomal protein L32 (RPL32), ribosomal protein S16 (RPS16), glyceraldehyde-3-phosphate dehydrogenase (GAPDH), NADH dehydrogenase (NADH) and succinate dehydrogenase B (SDHB).

