
Effects of Oxalic Acid on Apis mellifera (Hymenoptera: Apidae)

Abstract
:1. Introduction
2. Materials and Methods
2.1. Laboratory Tests: Treatment of Individual Bees with OAD
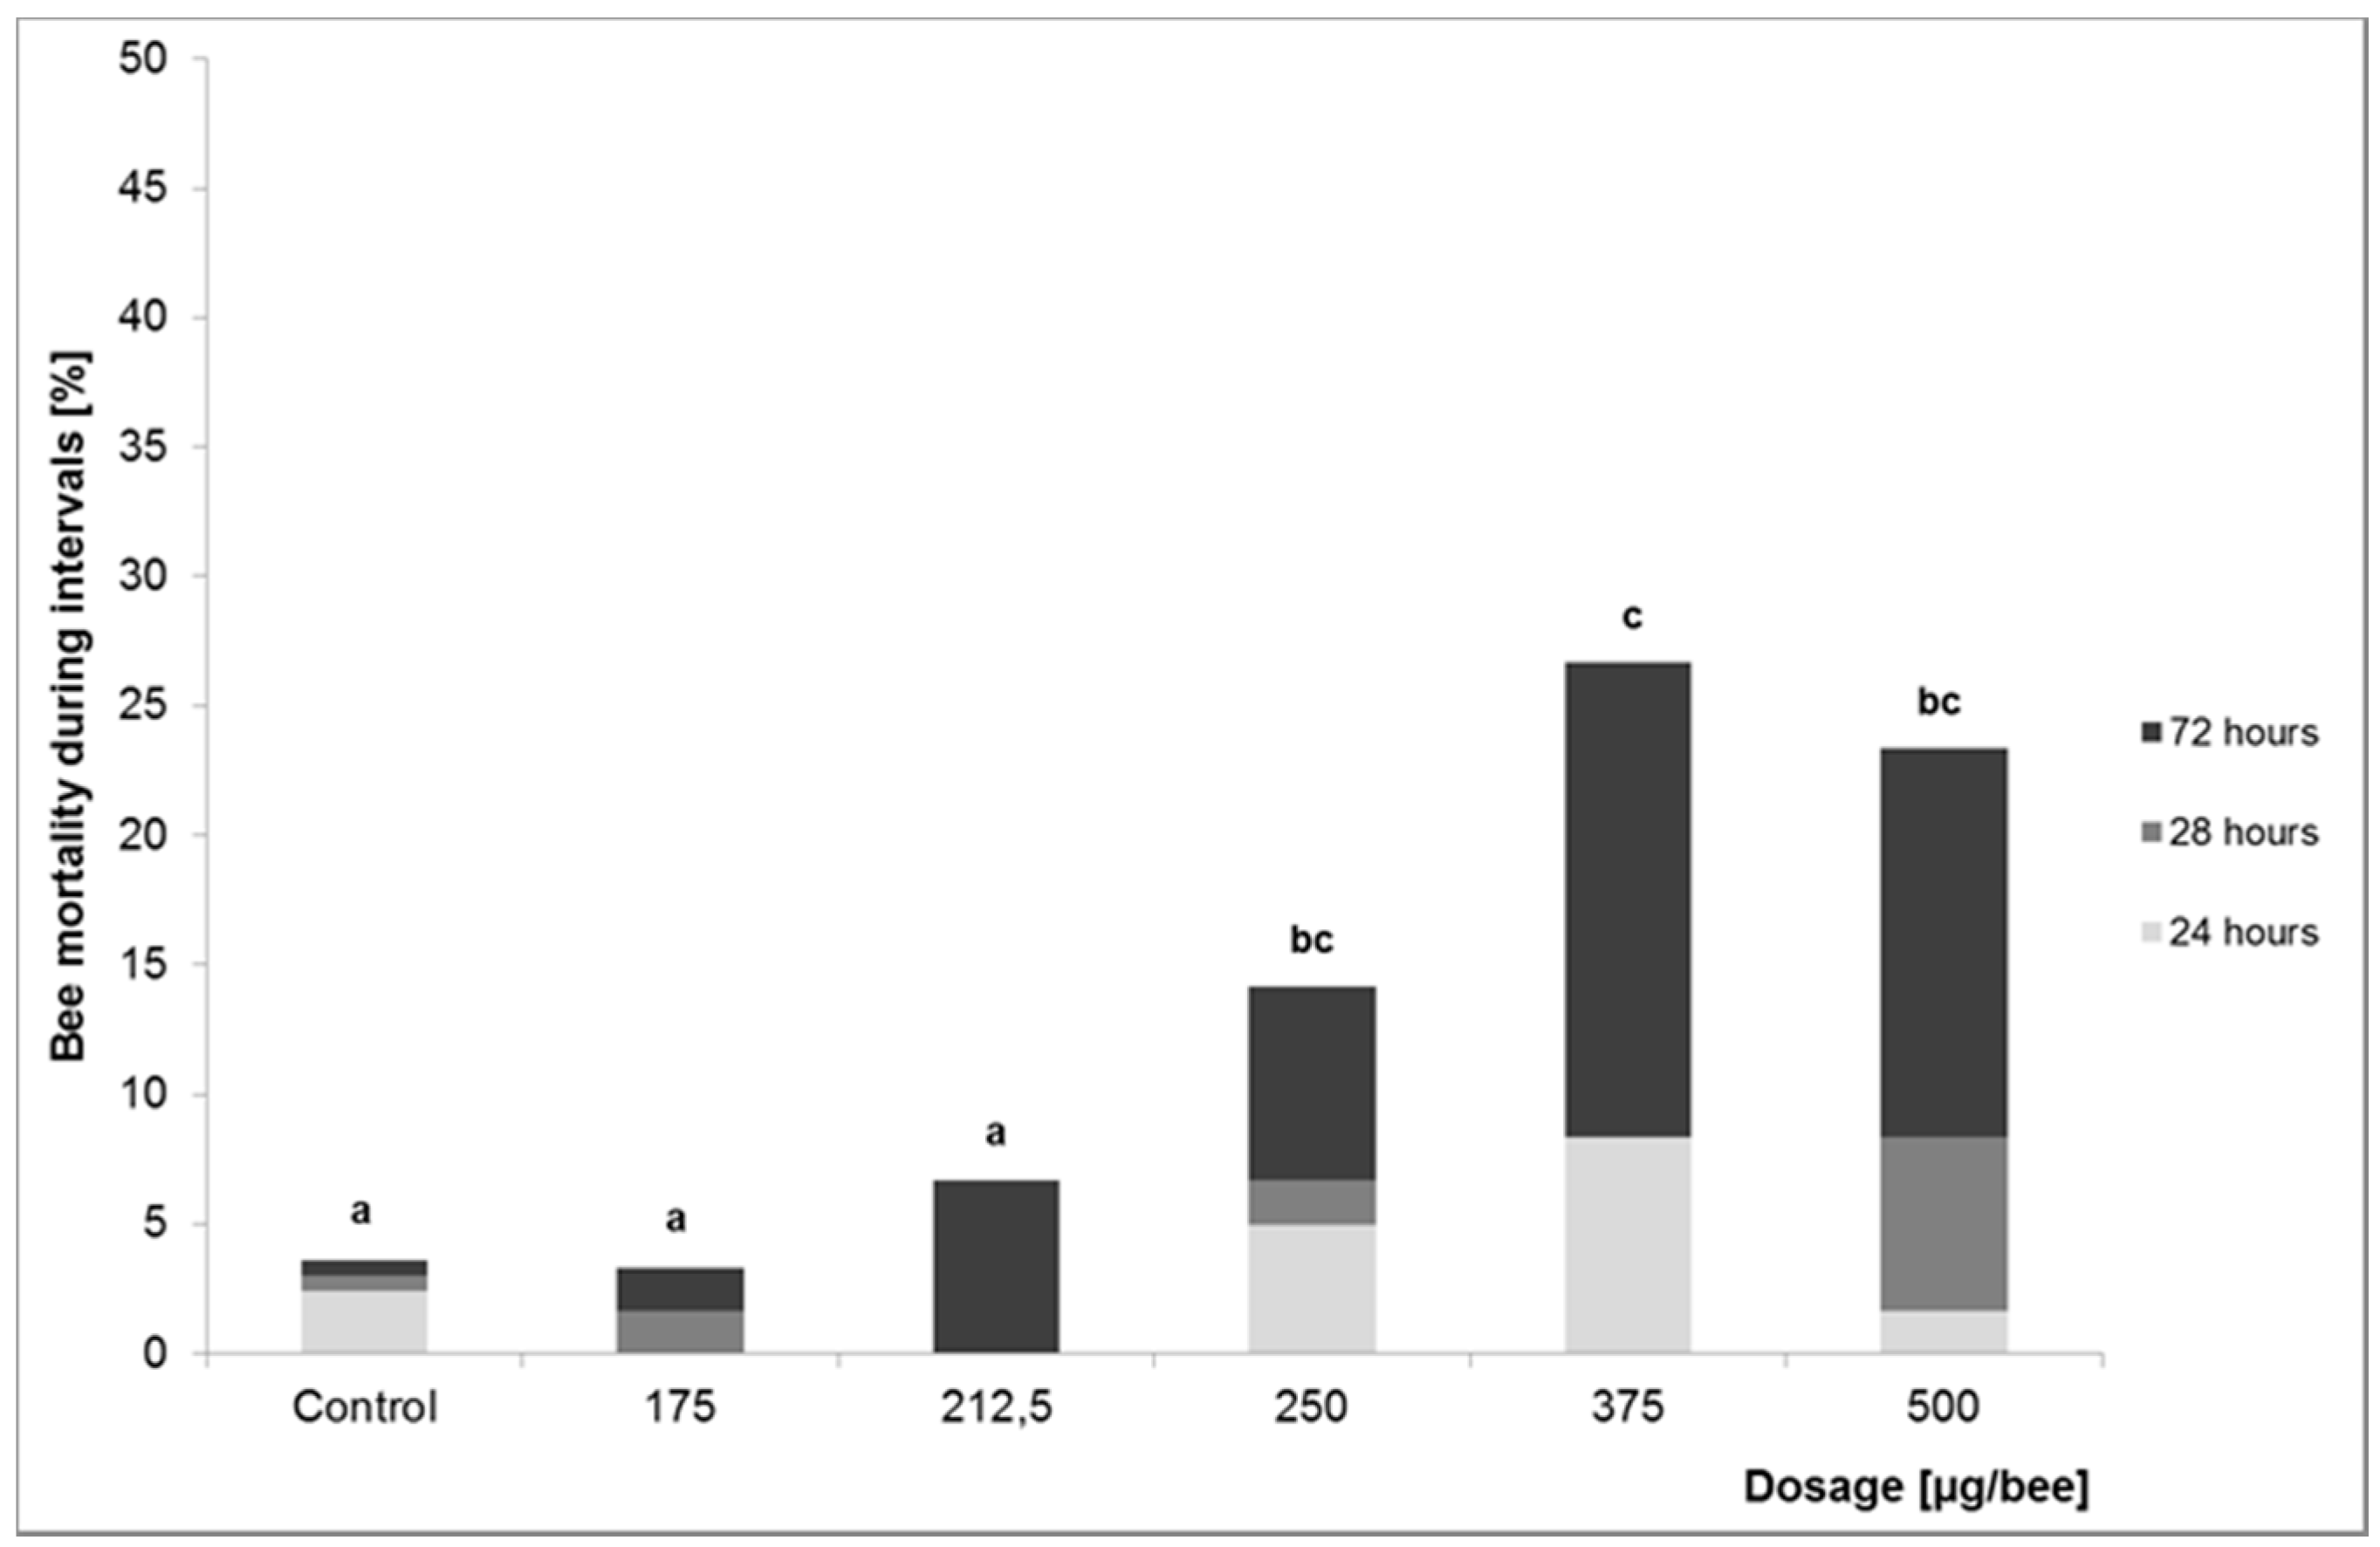
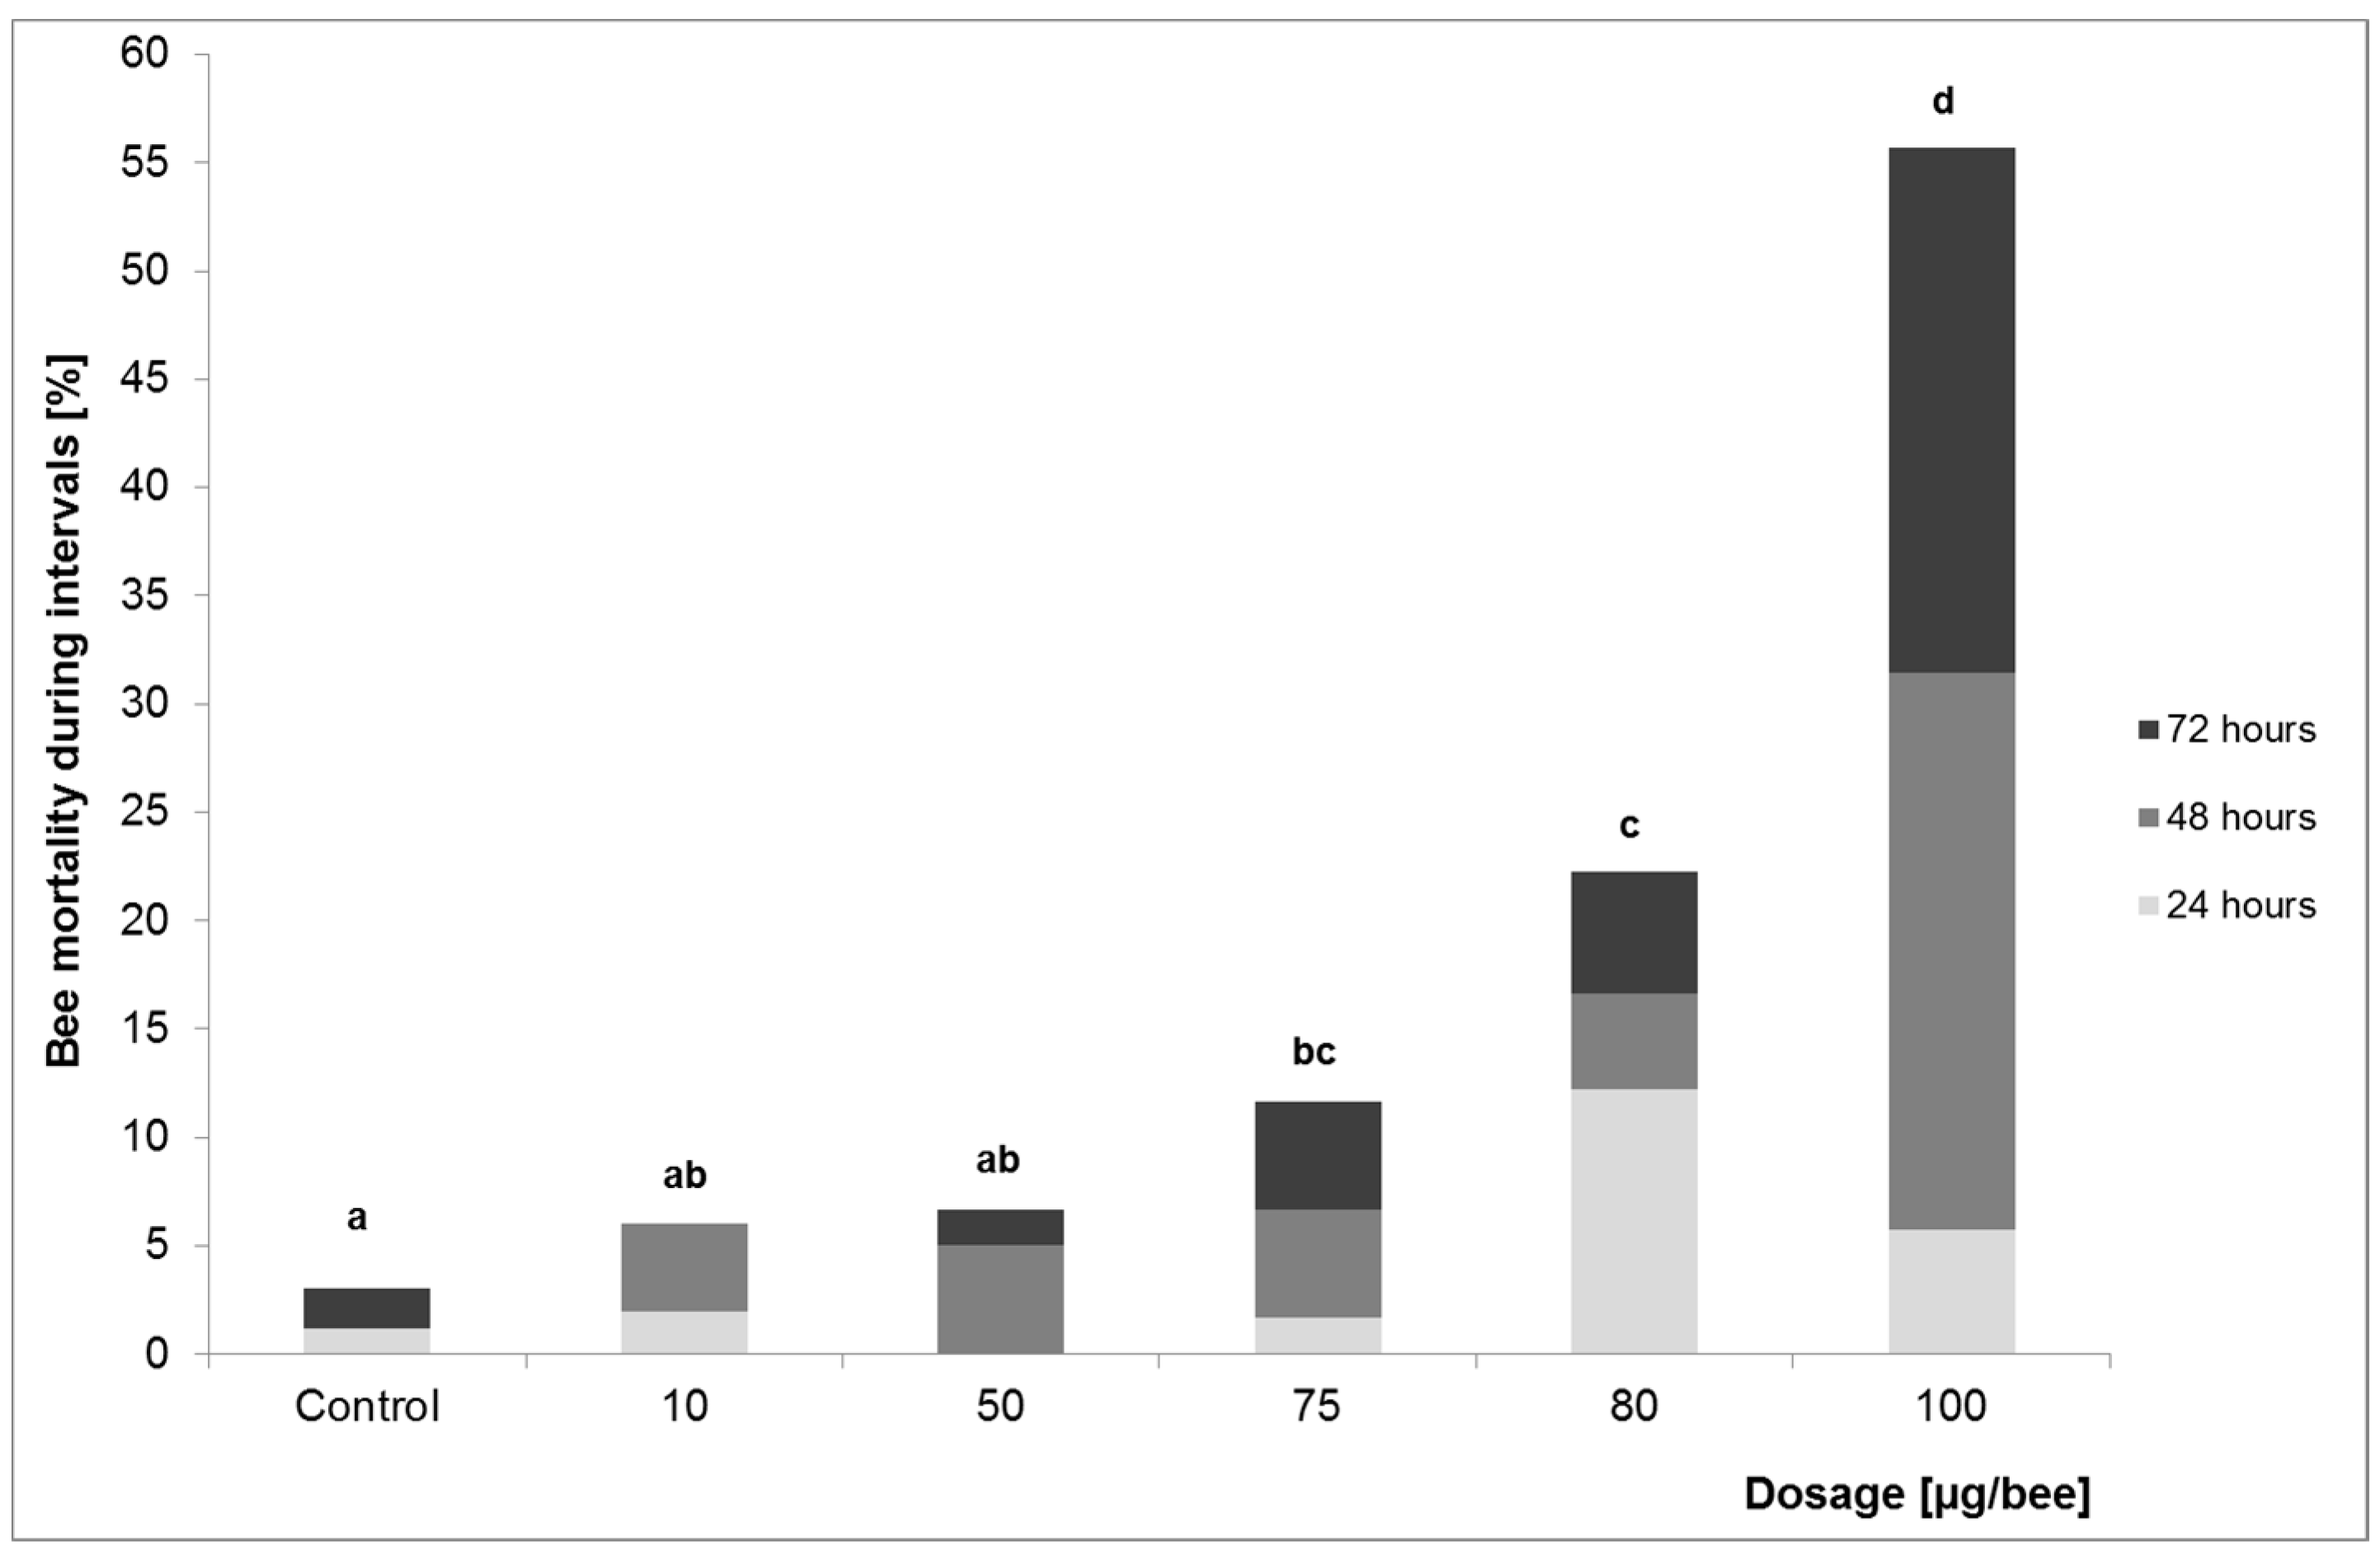
2.1.1. Investigation of Lethal Effects—Acute Oral and Dermal Toxicity
2.1.2. Investigation of Sublethal Effects
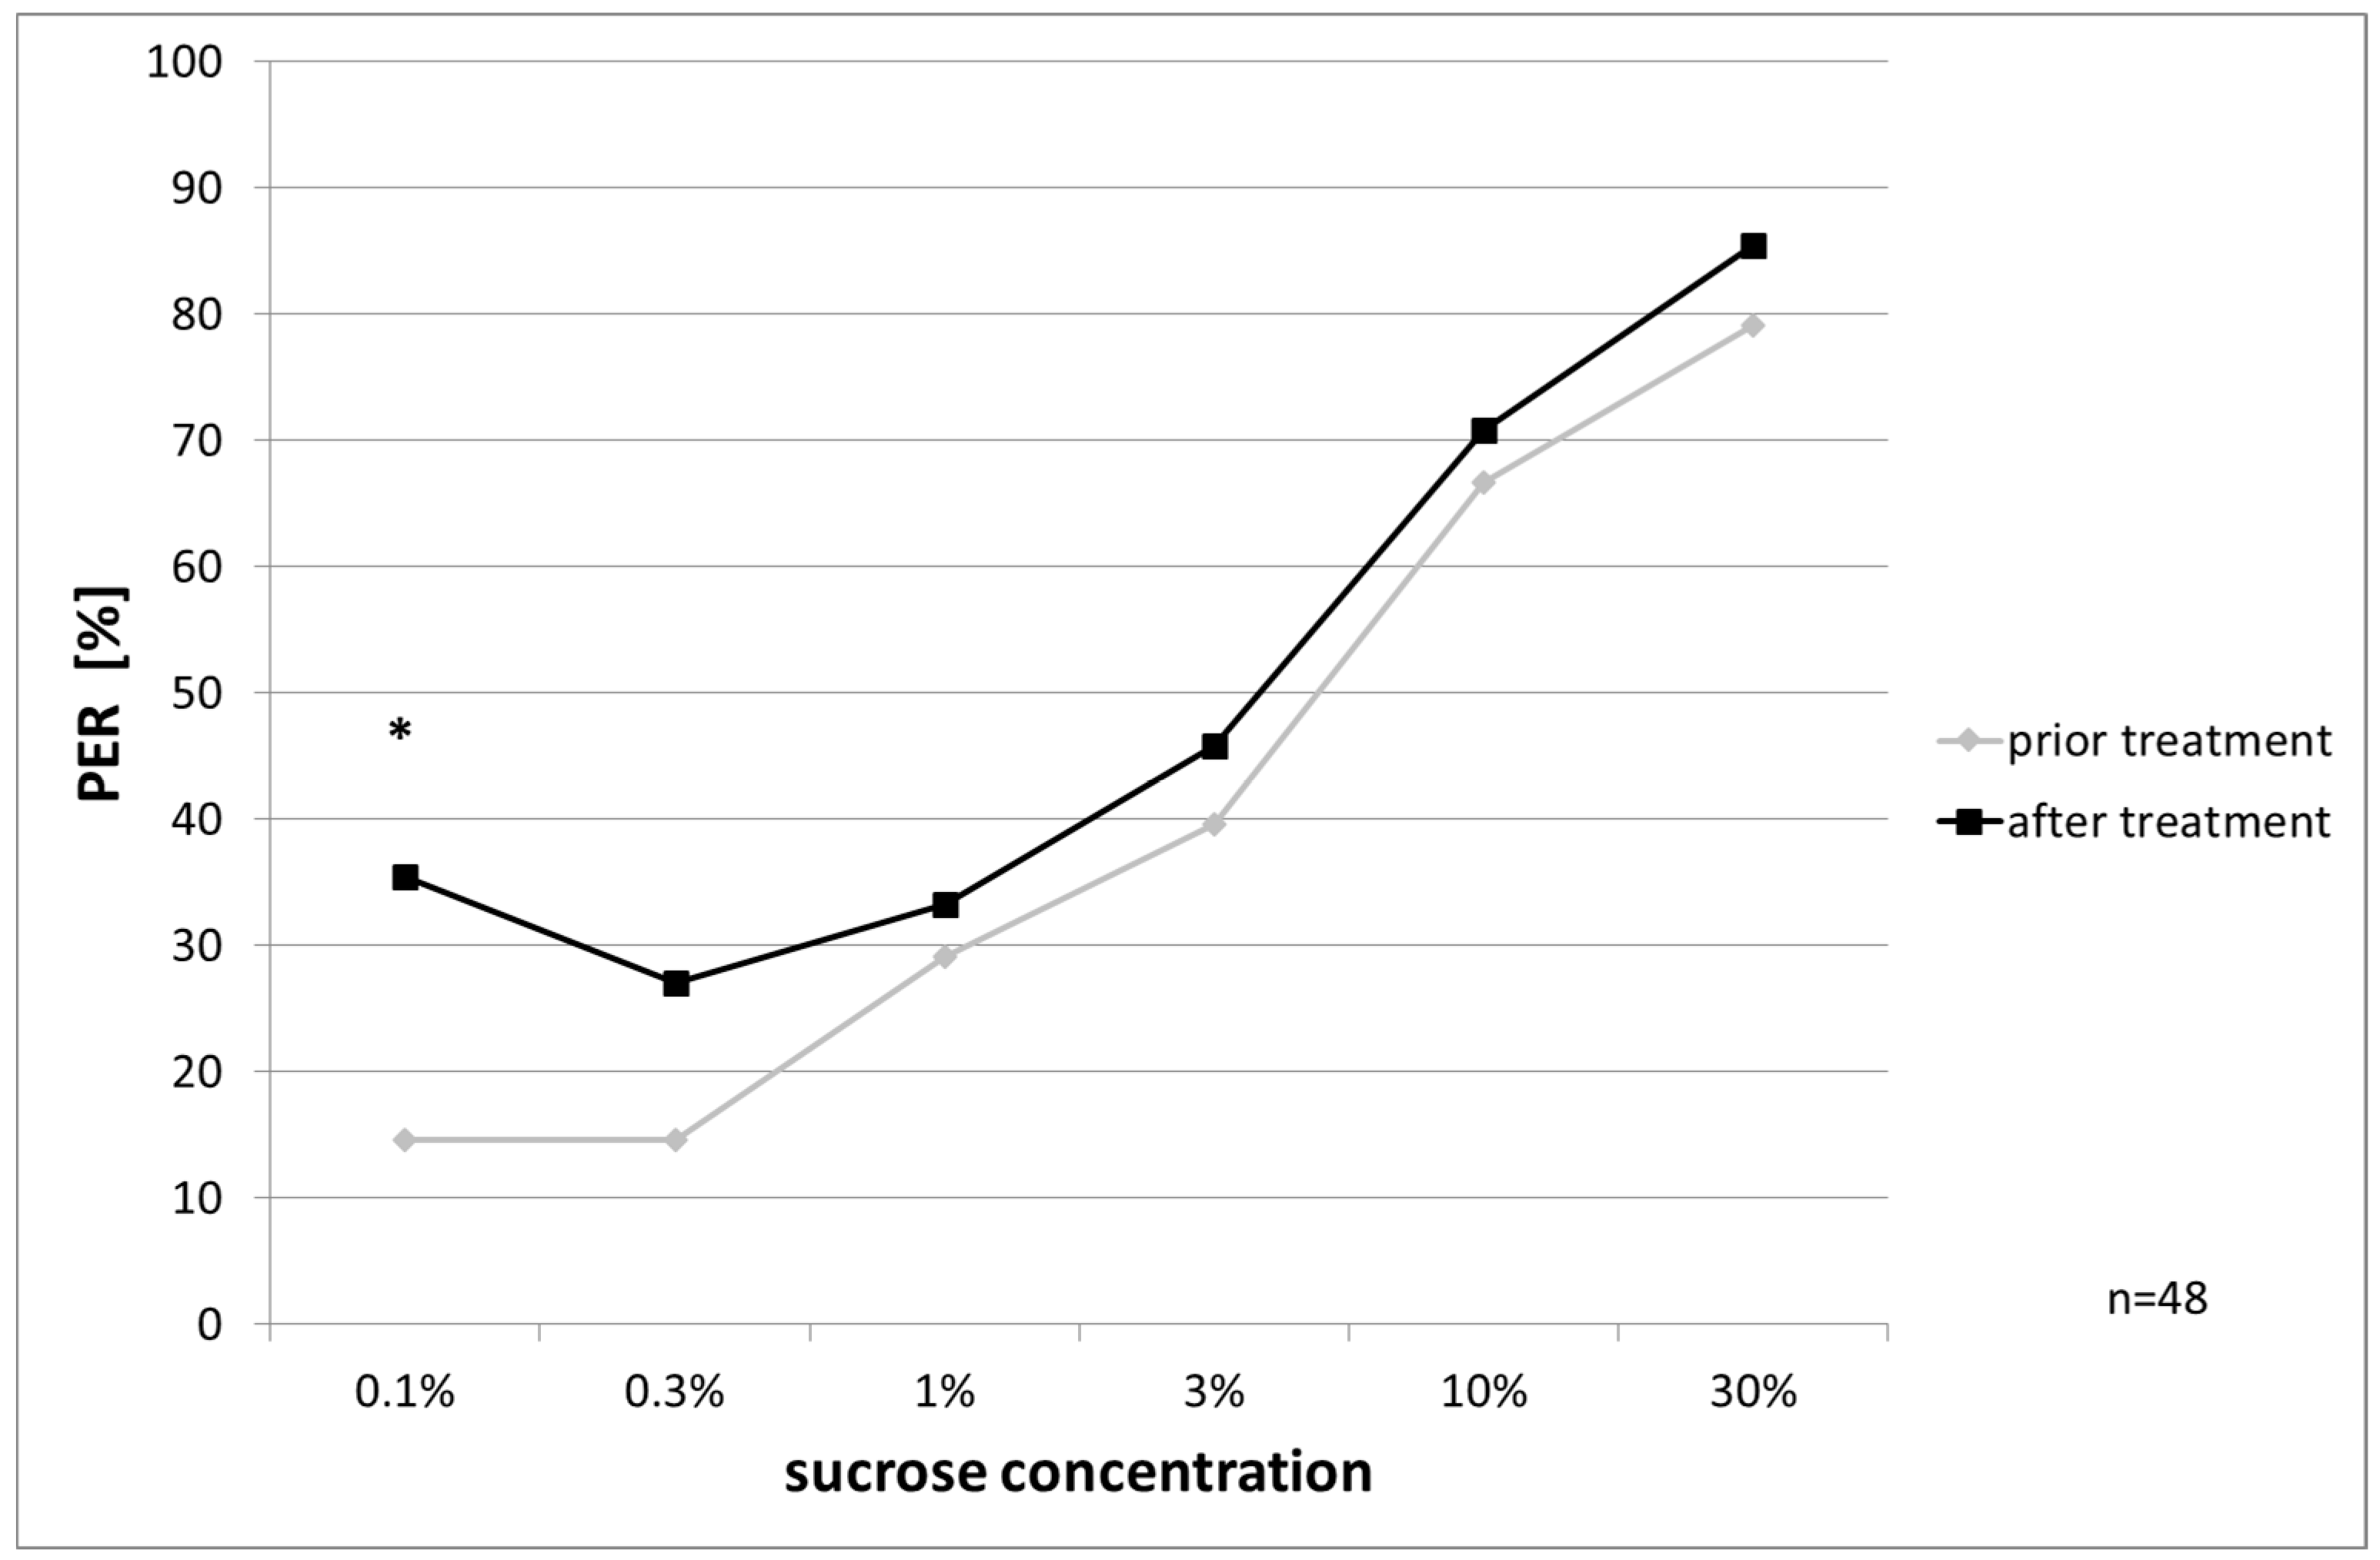
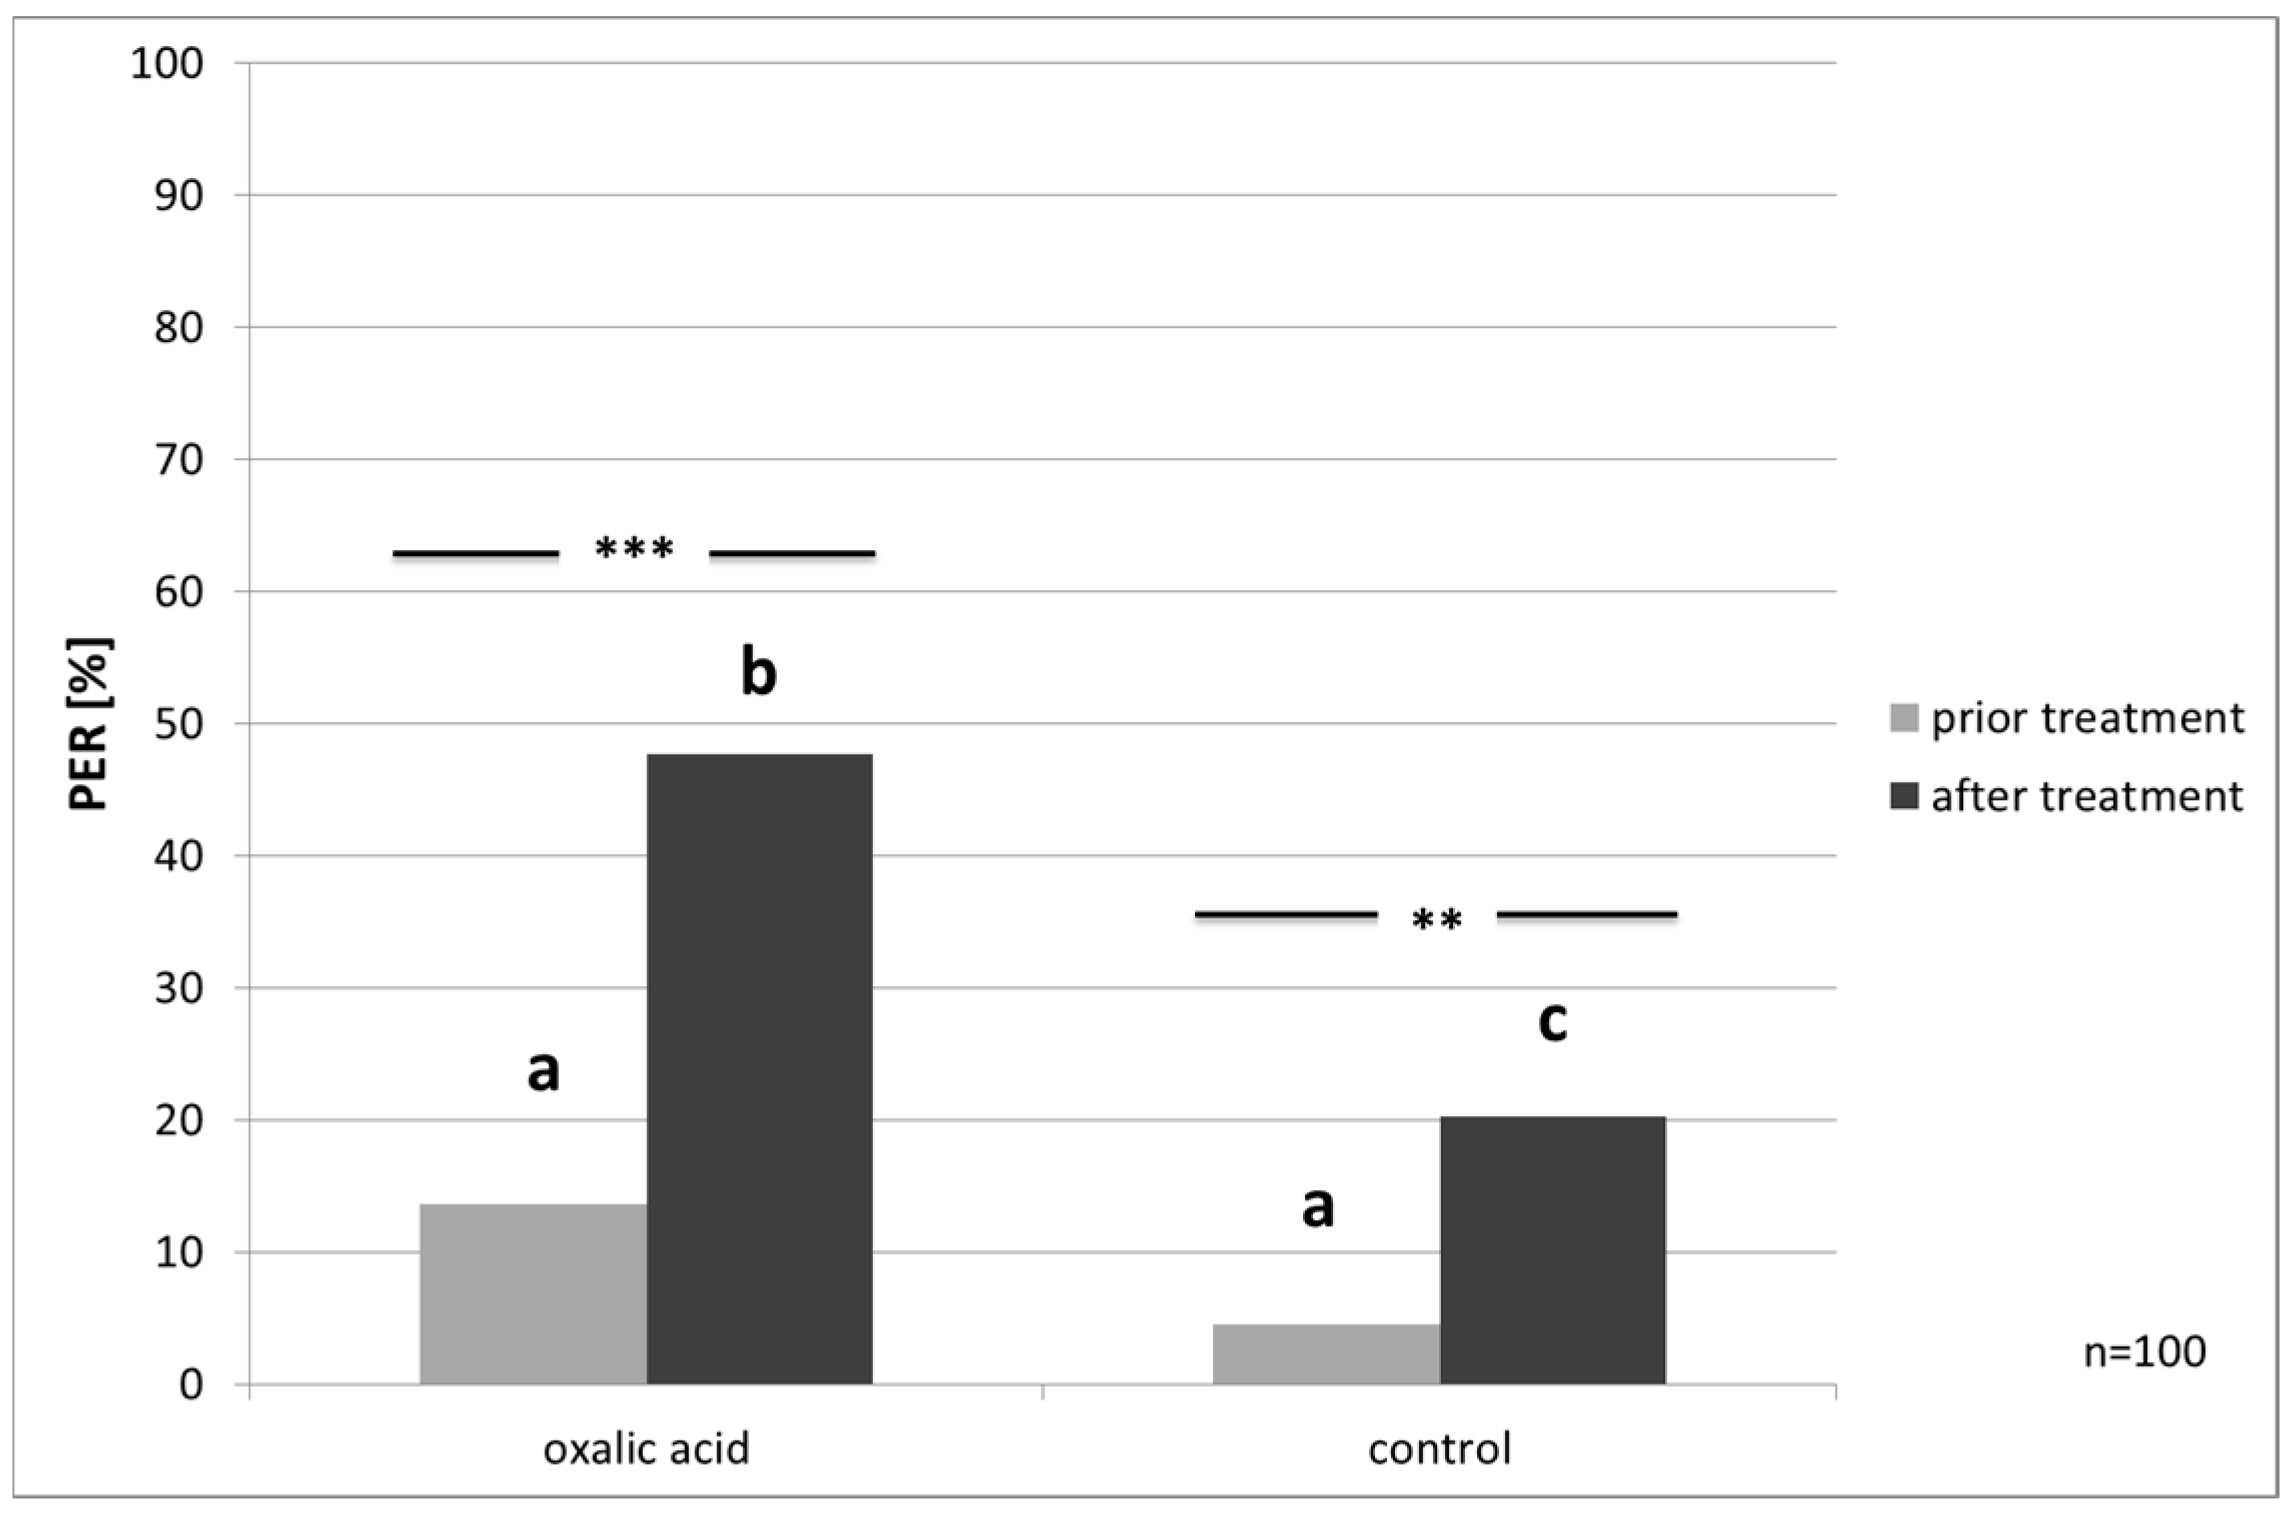
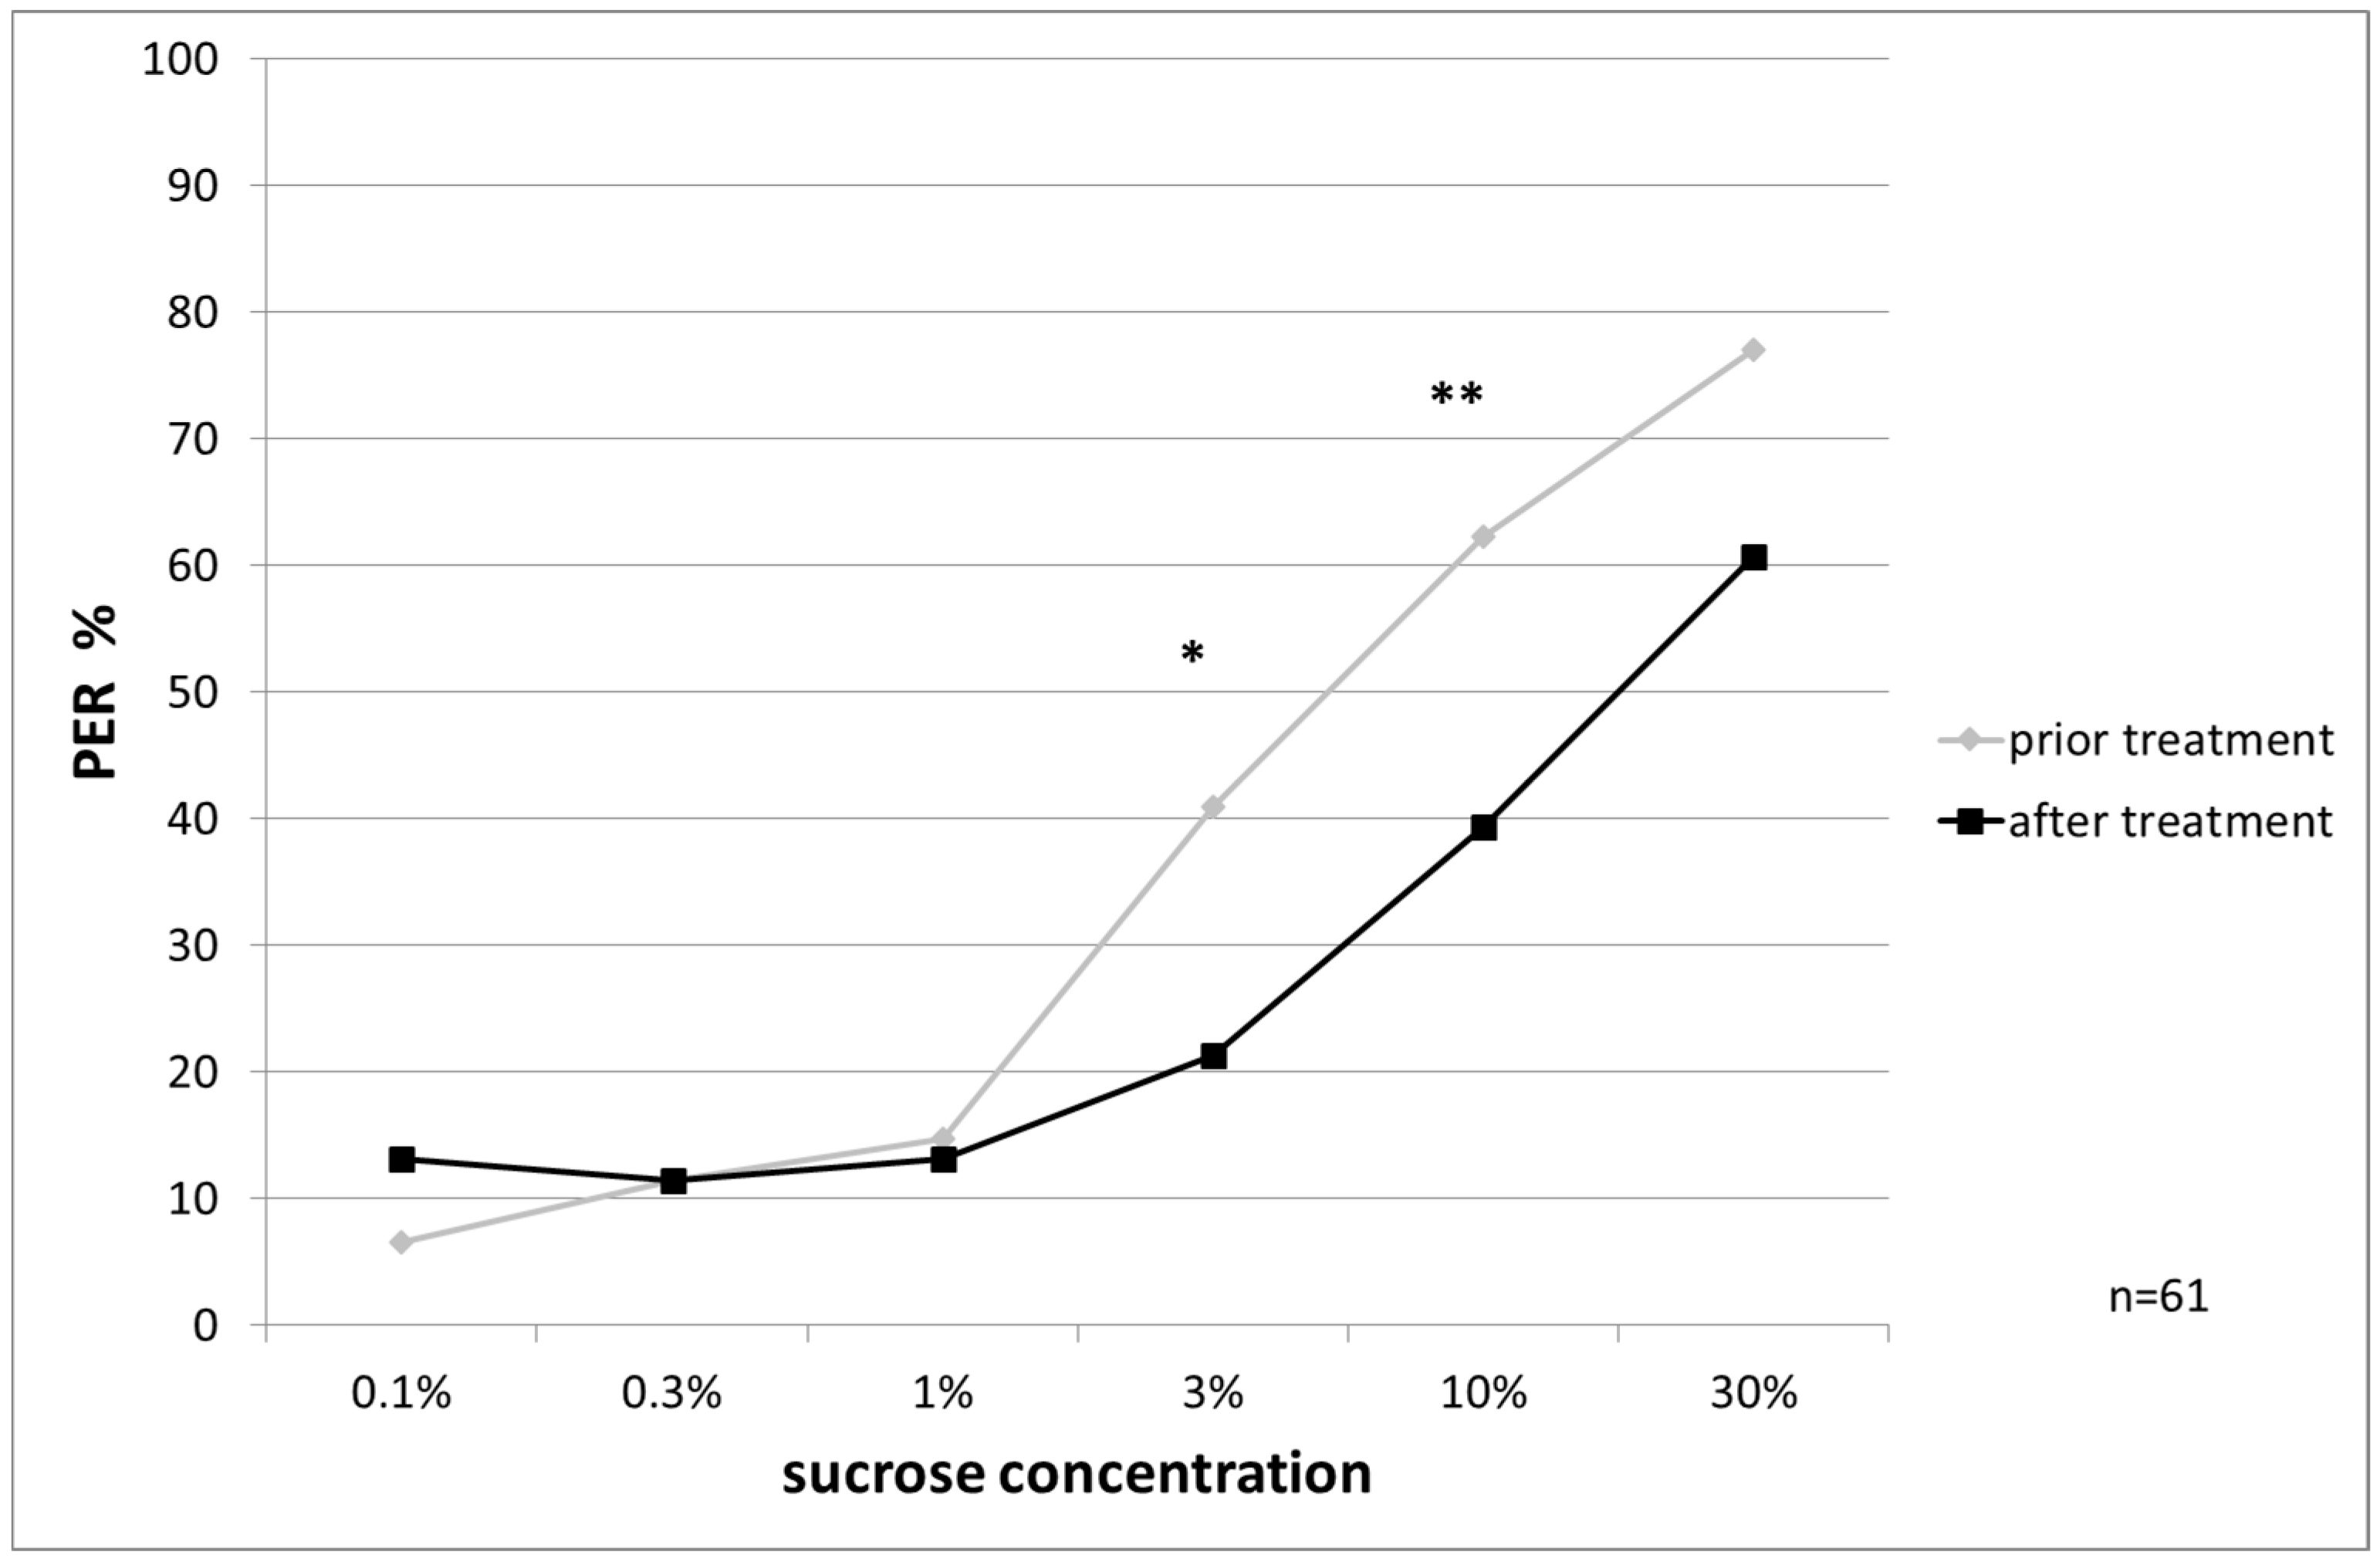
Responsiveness to Water and Ascending Concentrations of Sucrose Solution
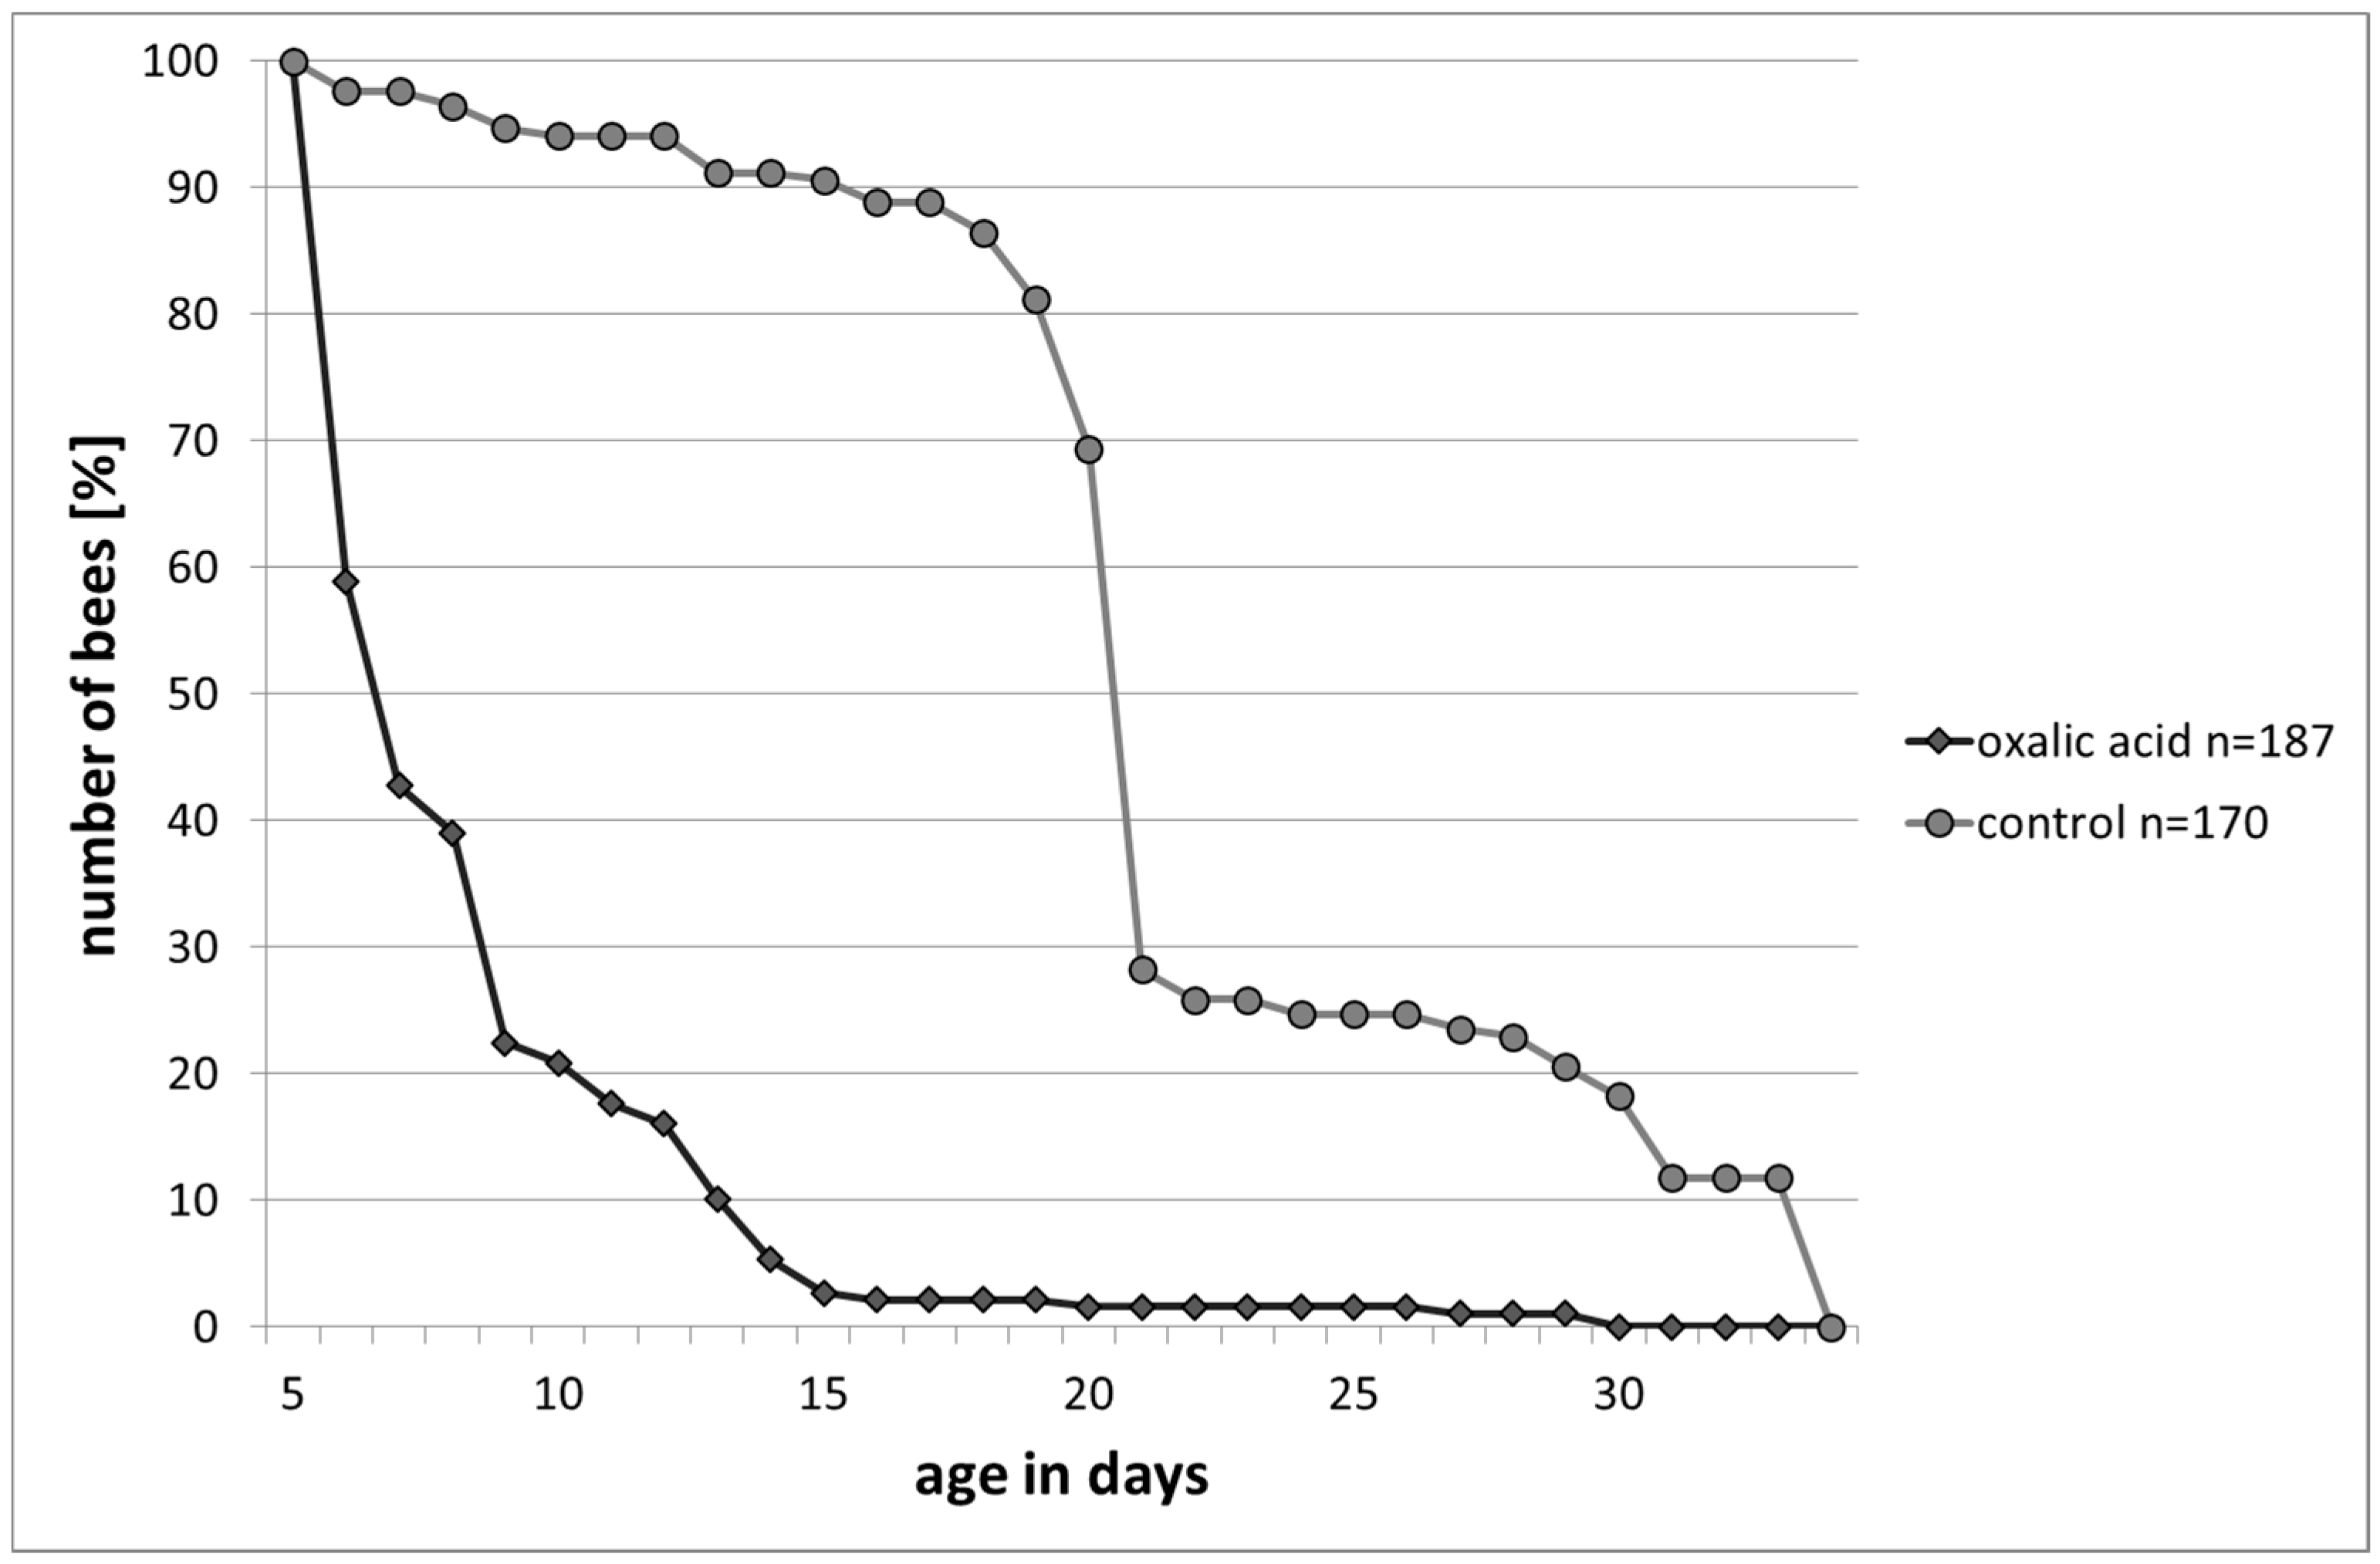
Longevity under Laboratory Conditions
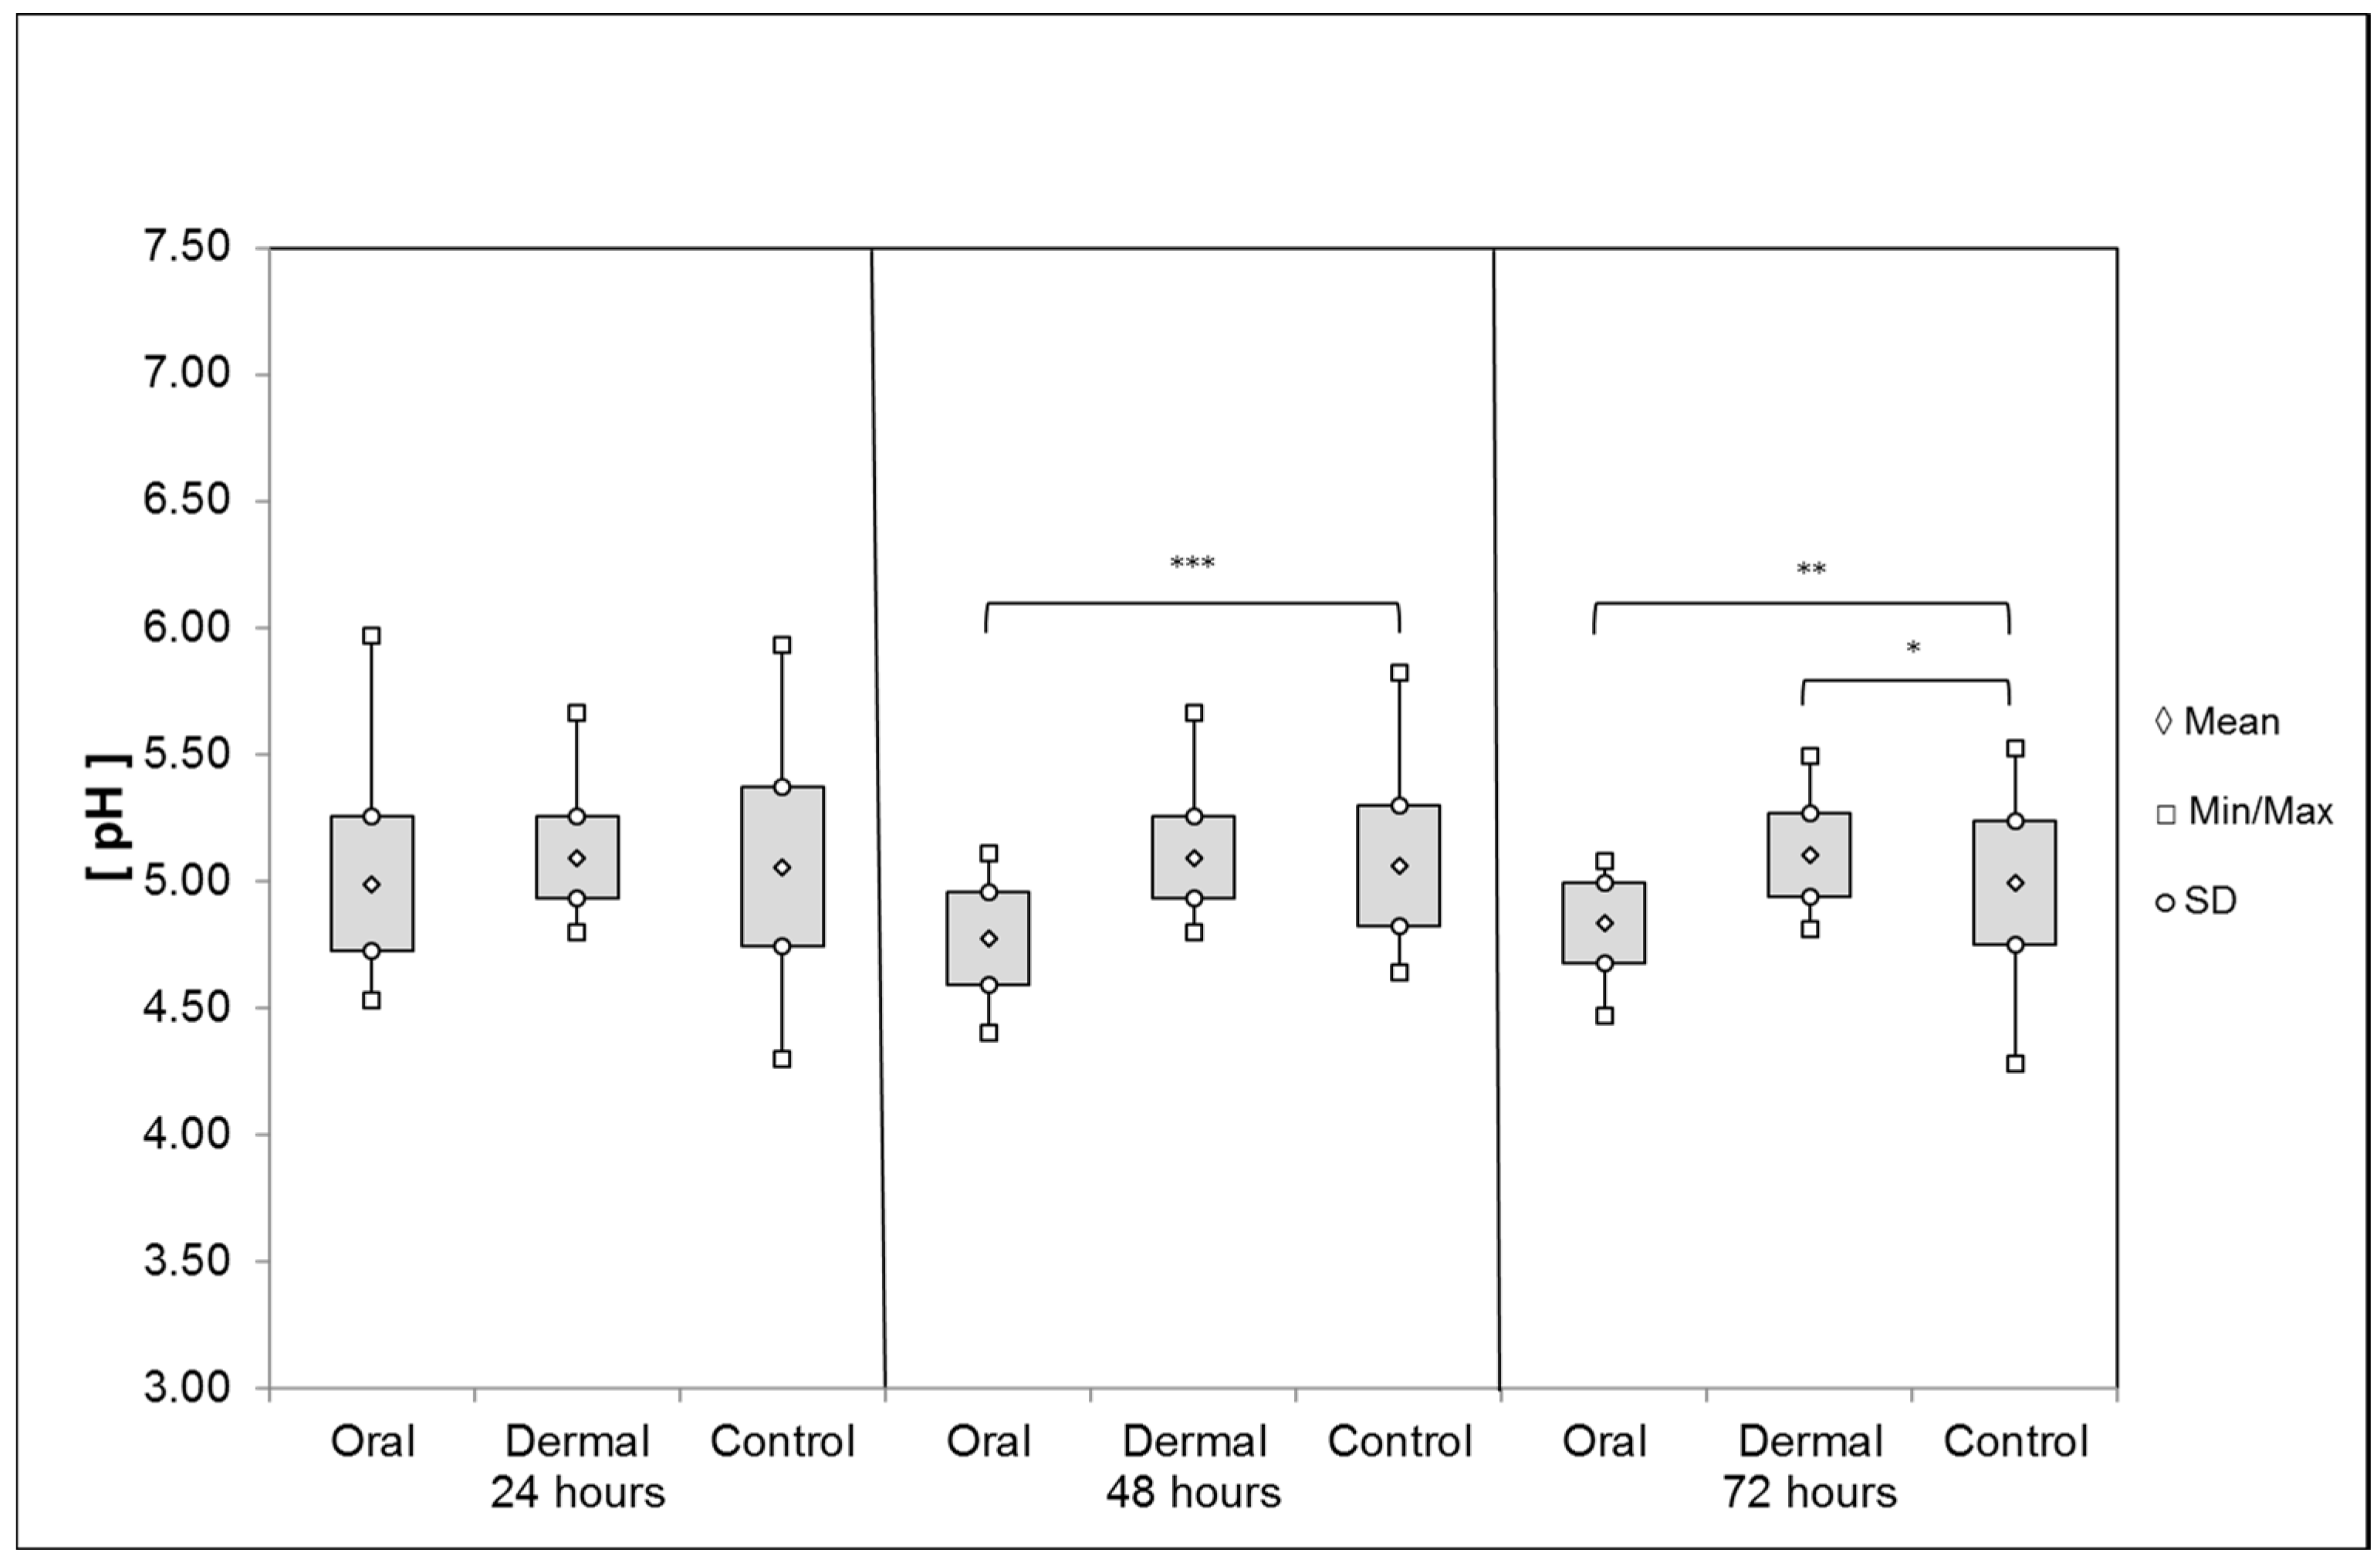
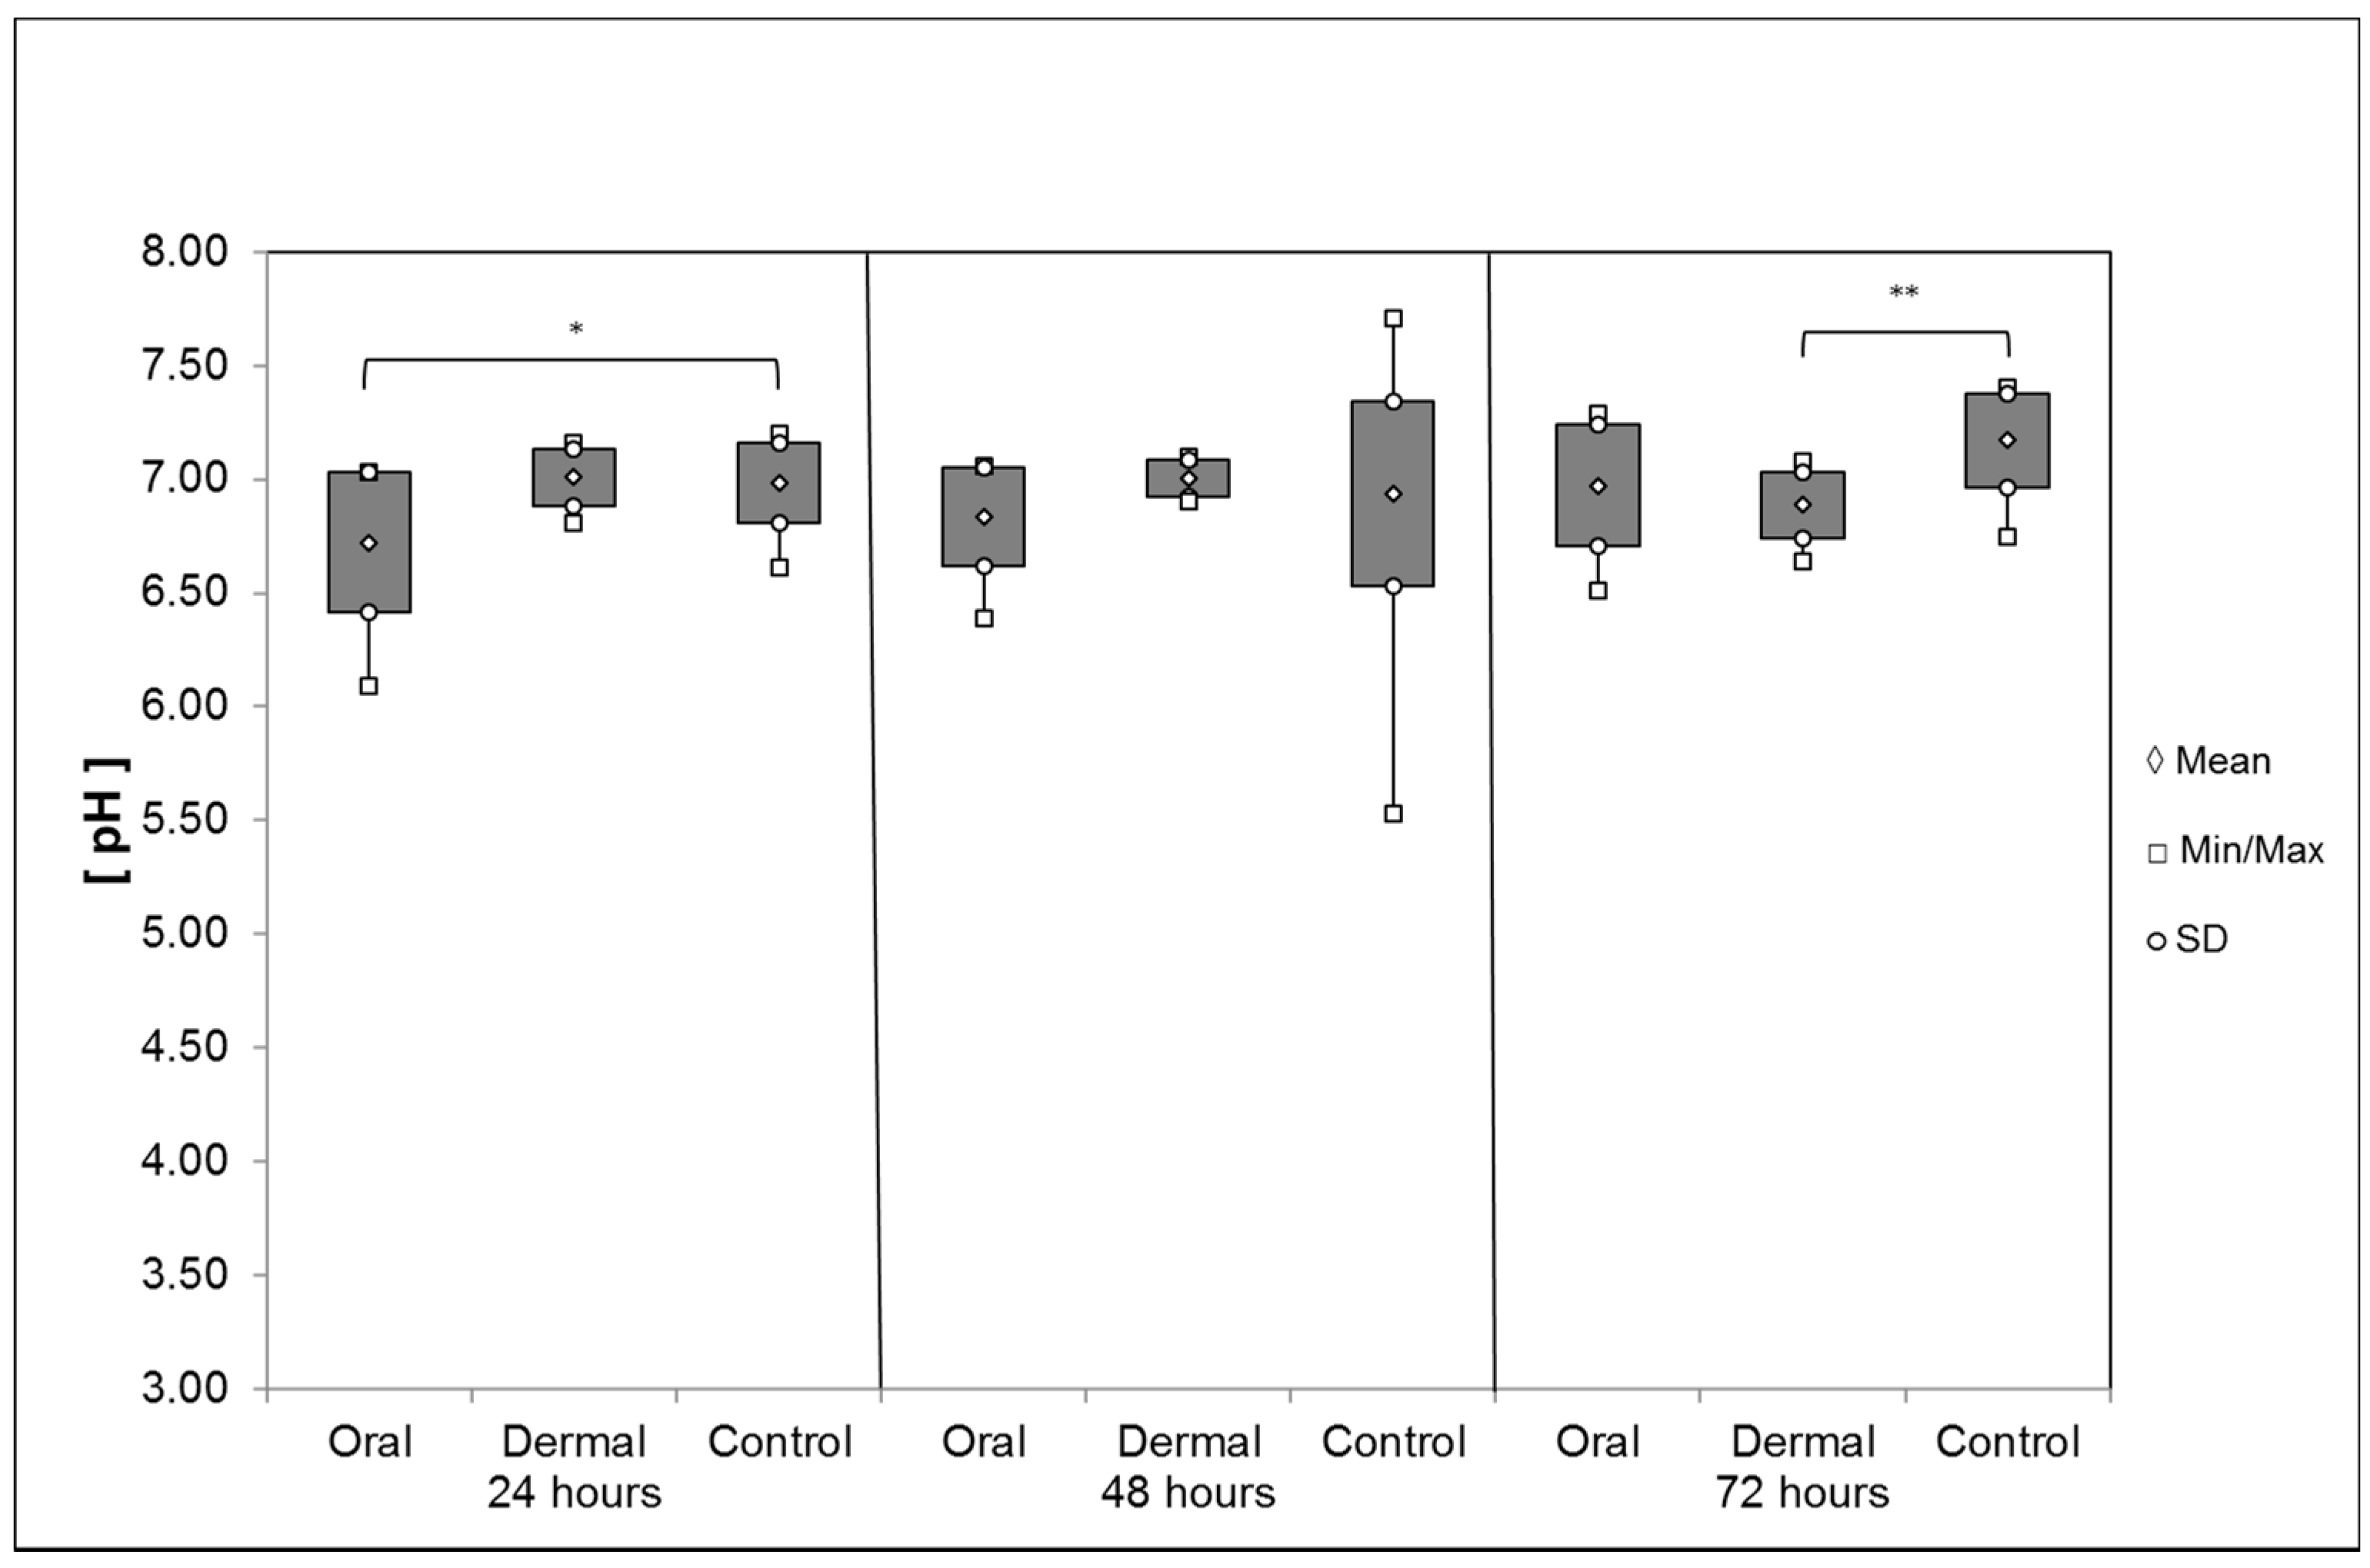
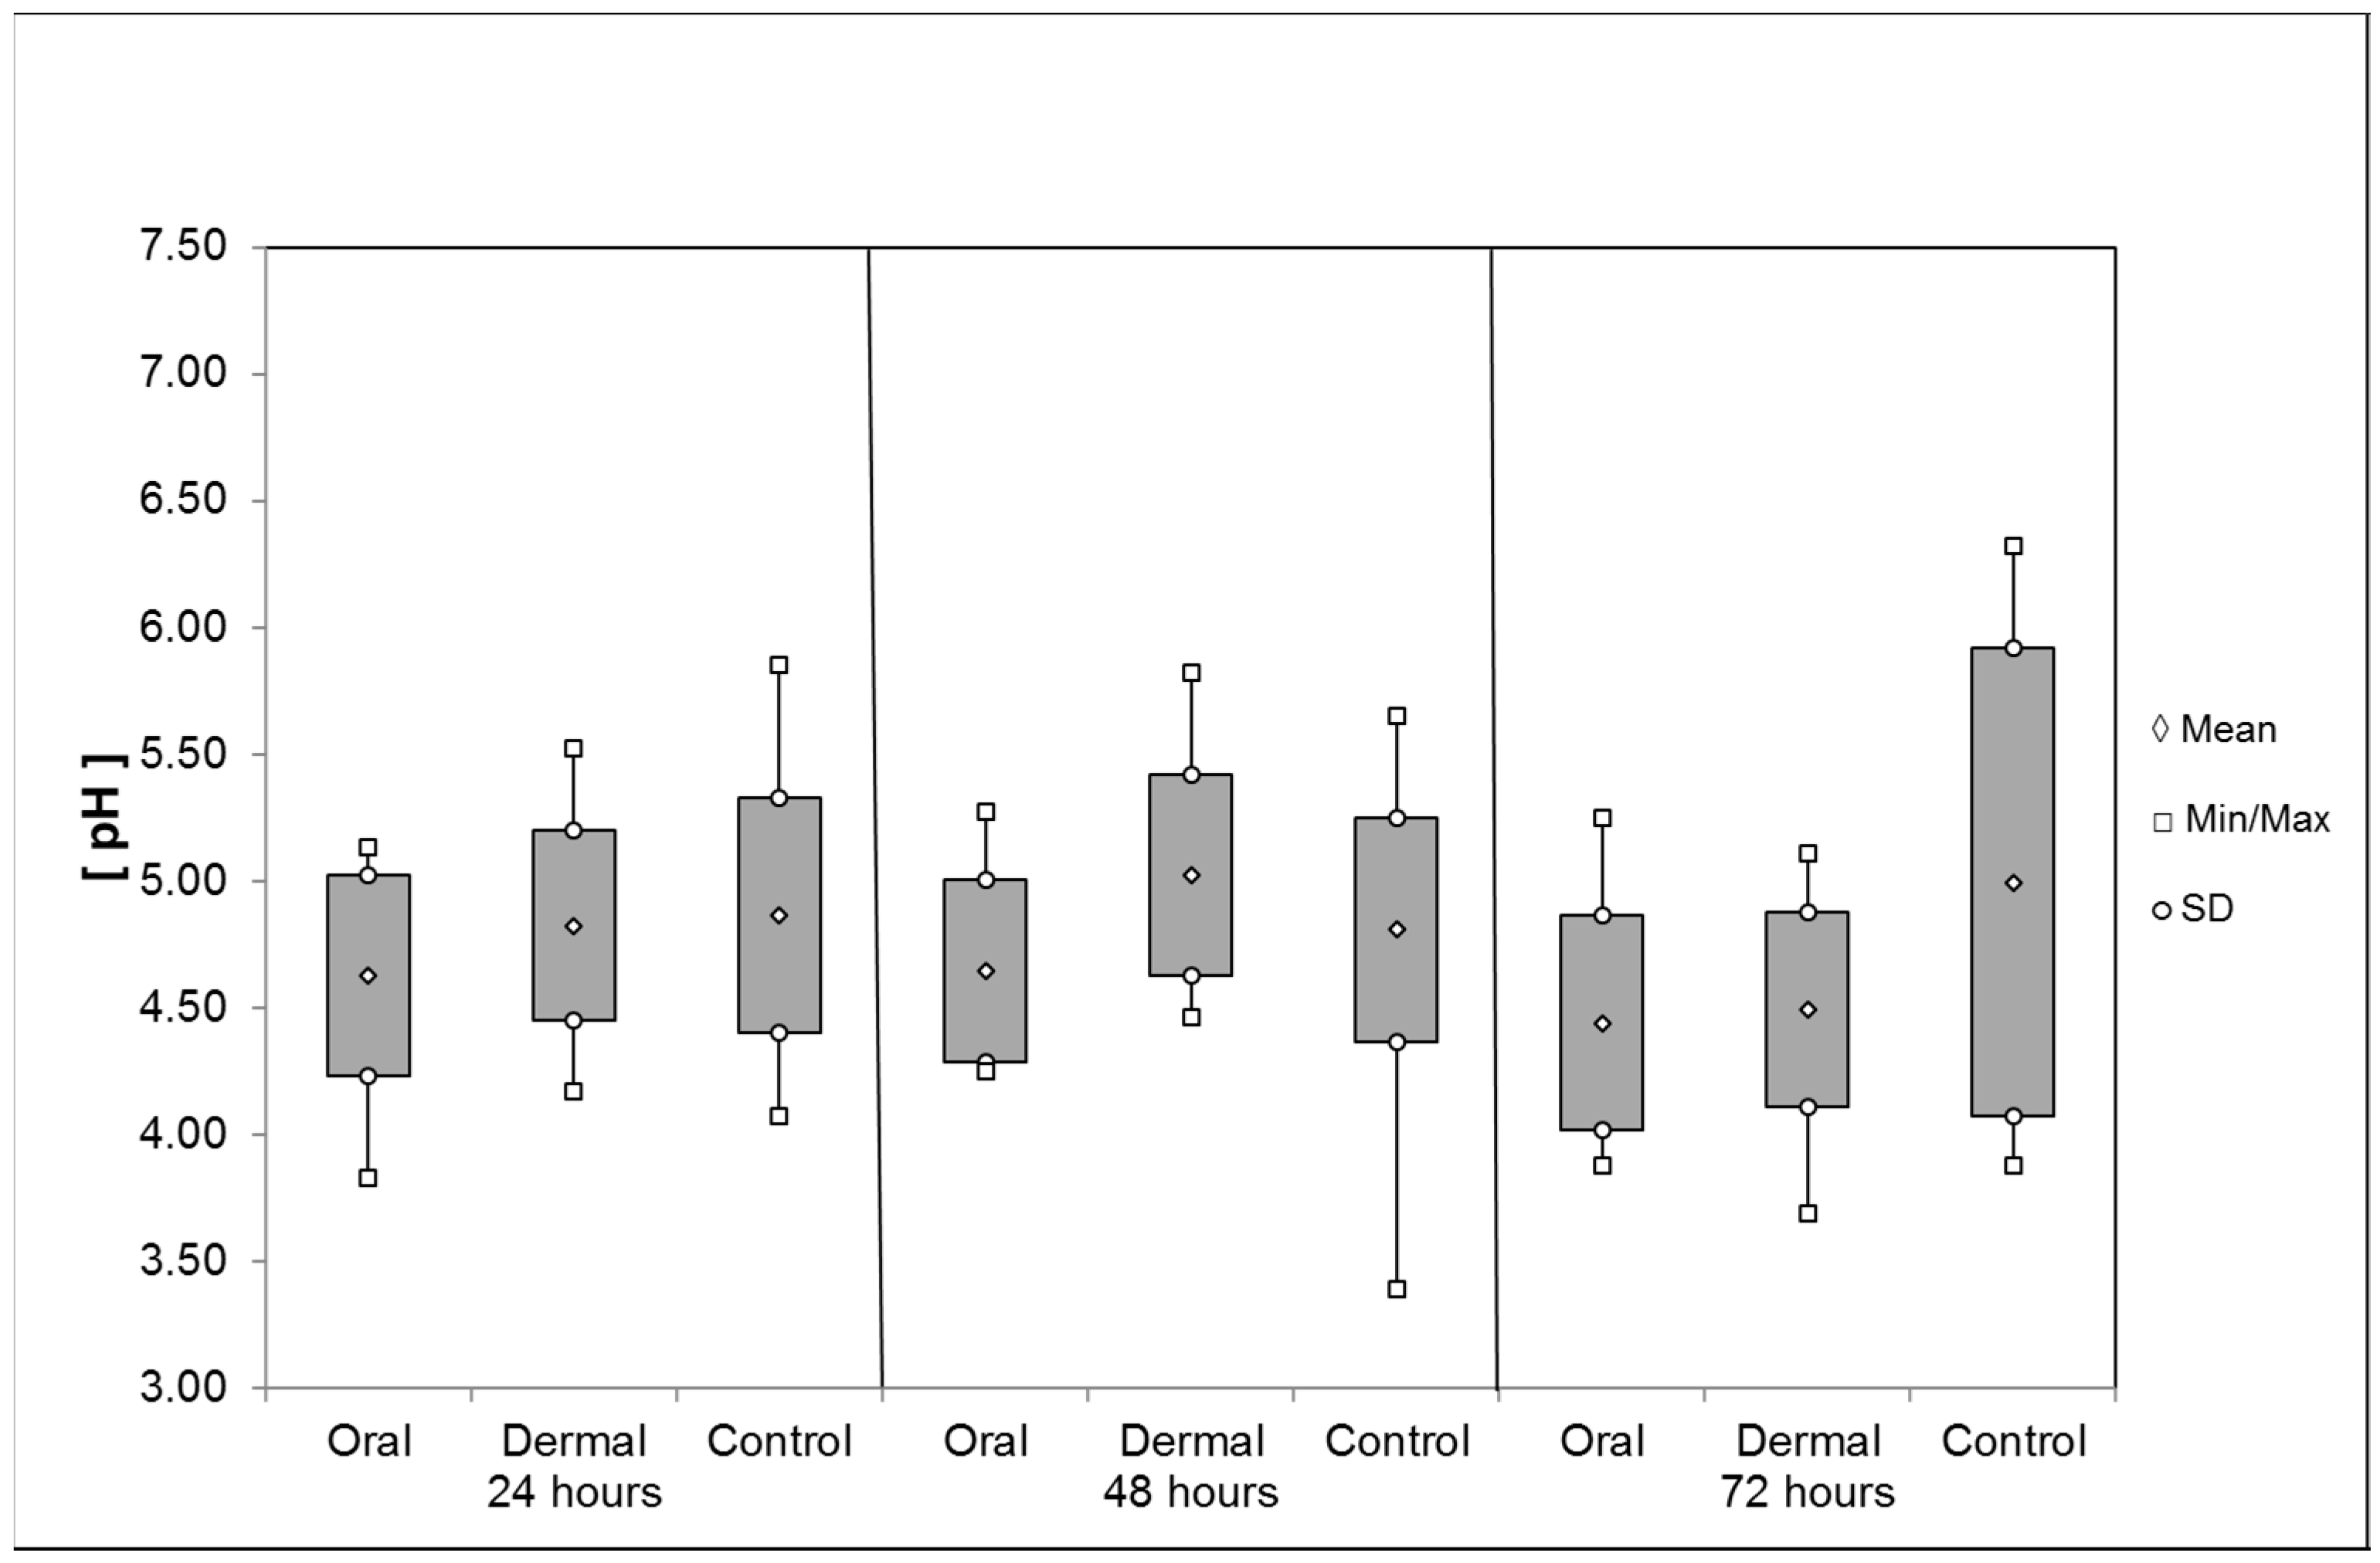
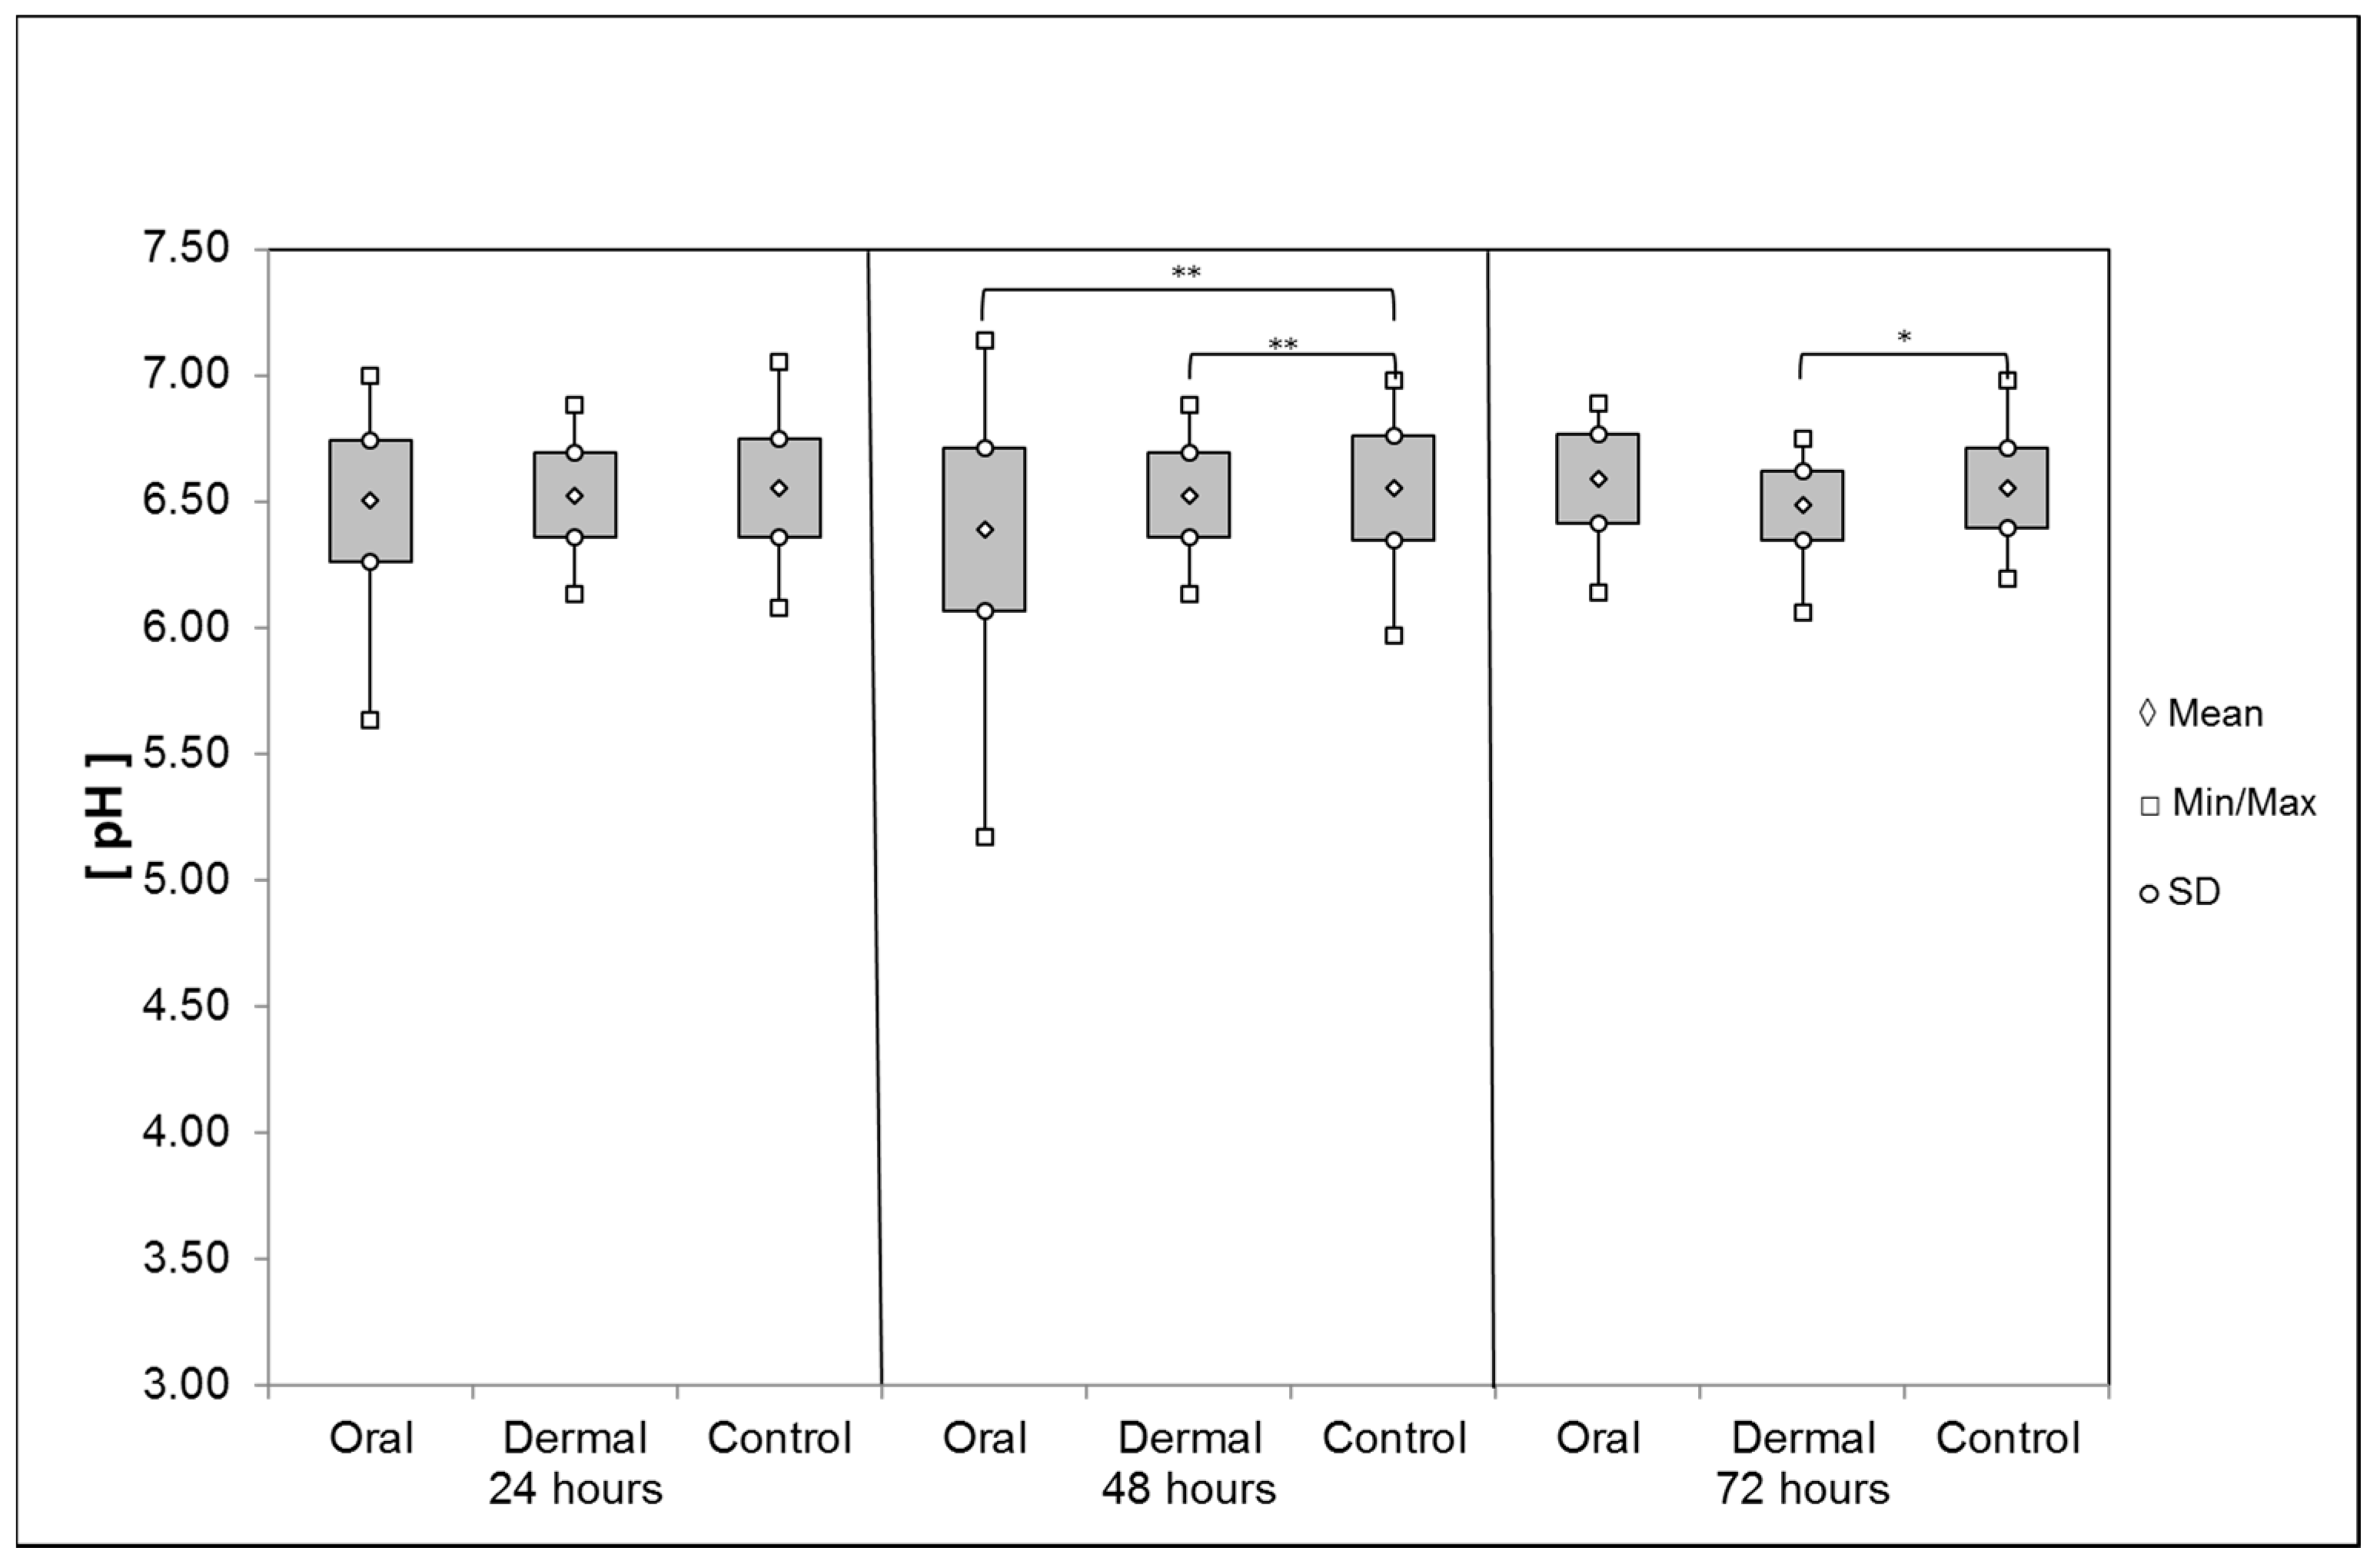
pH Values of the Digestive System and the Hemolymph
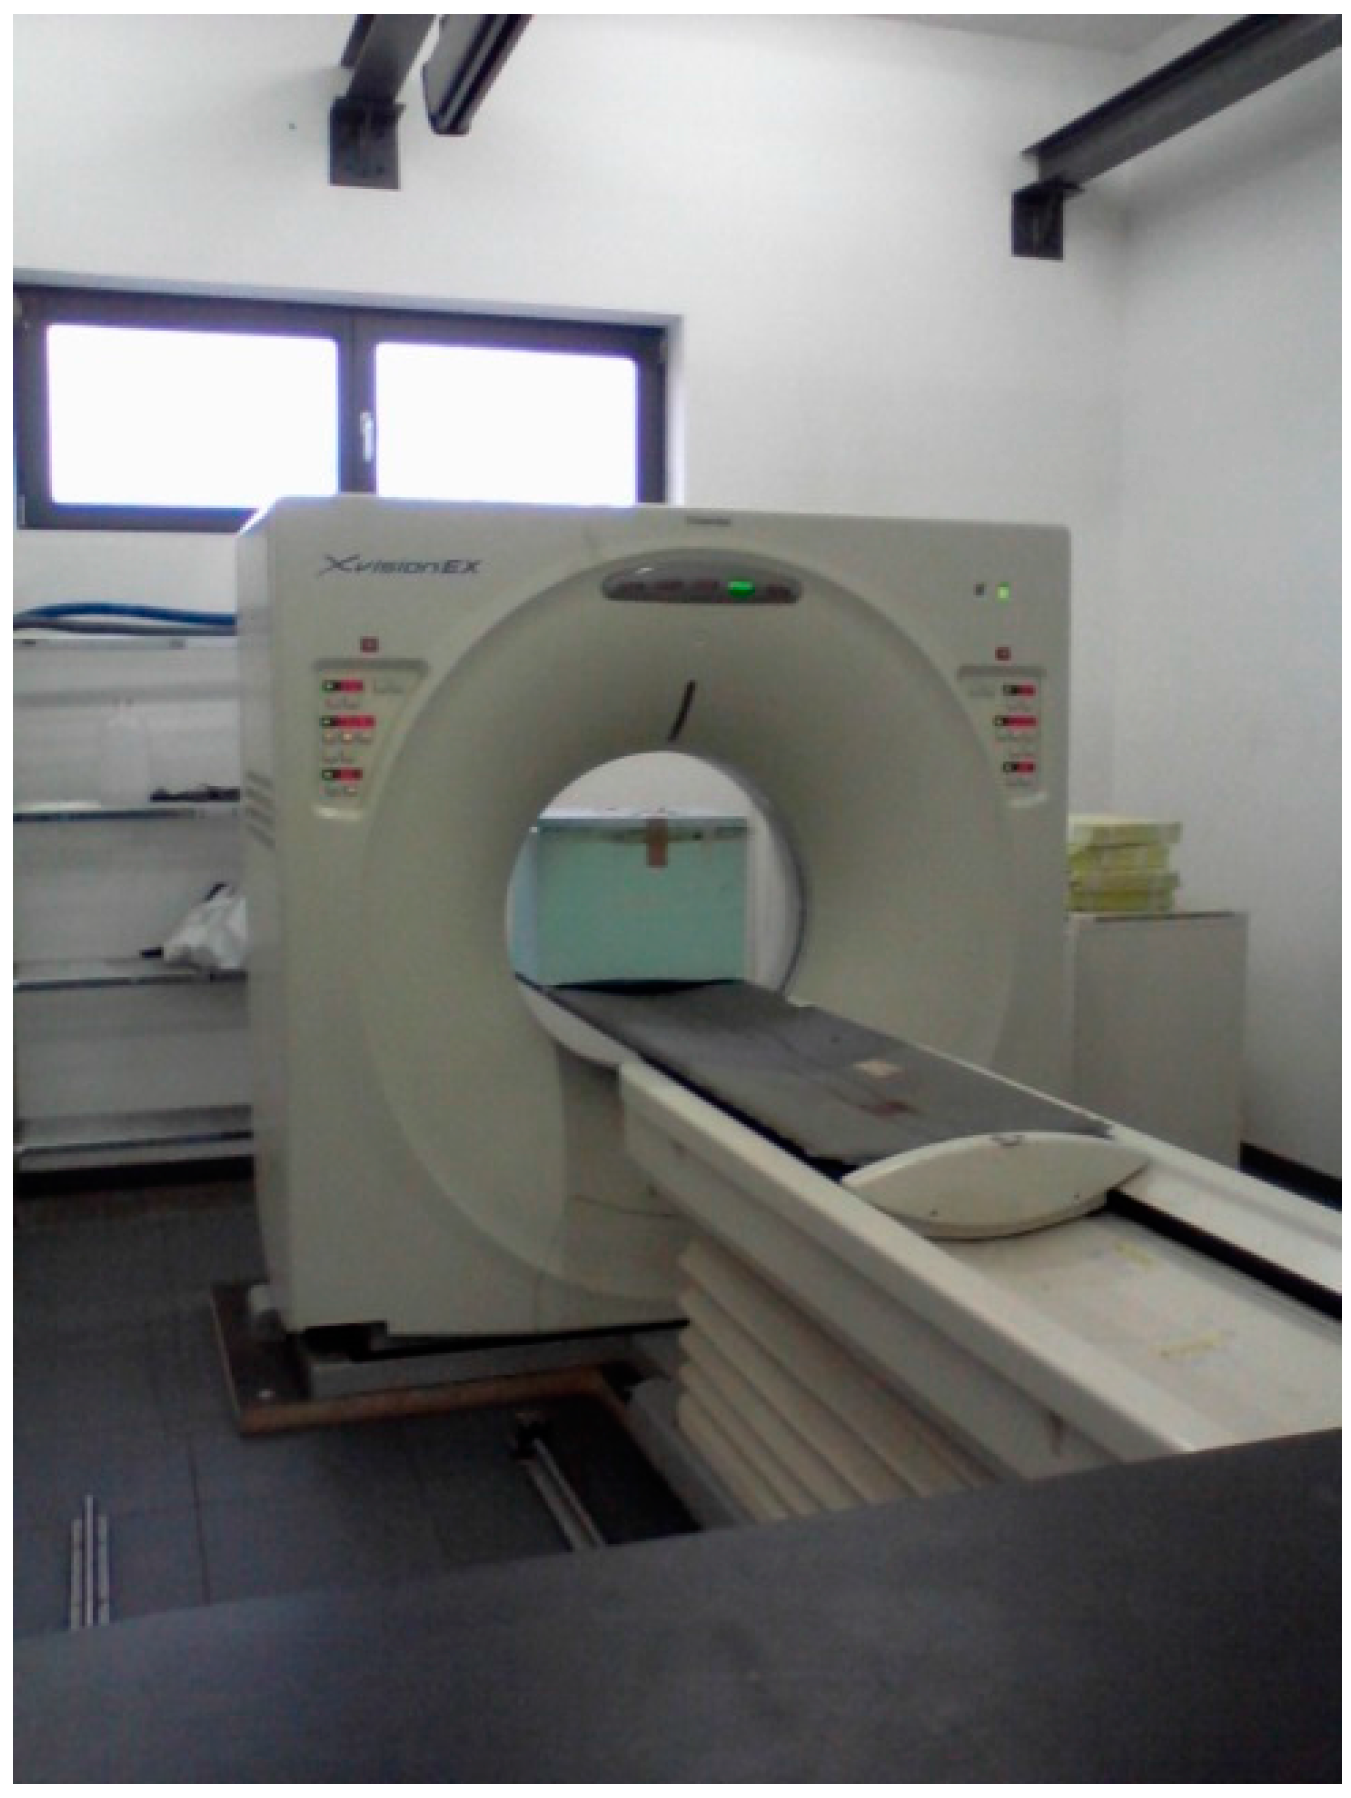
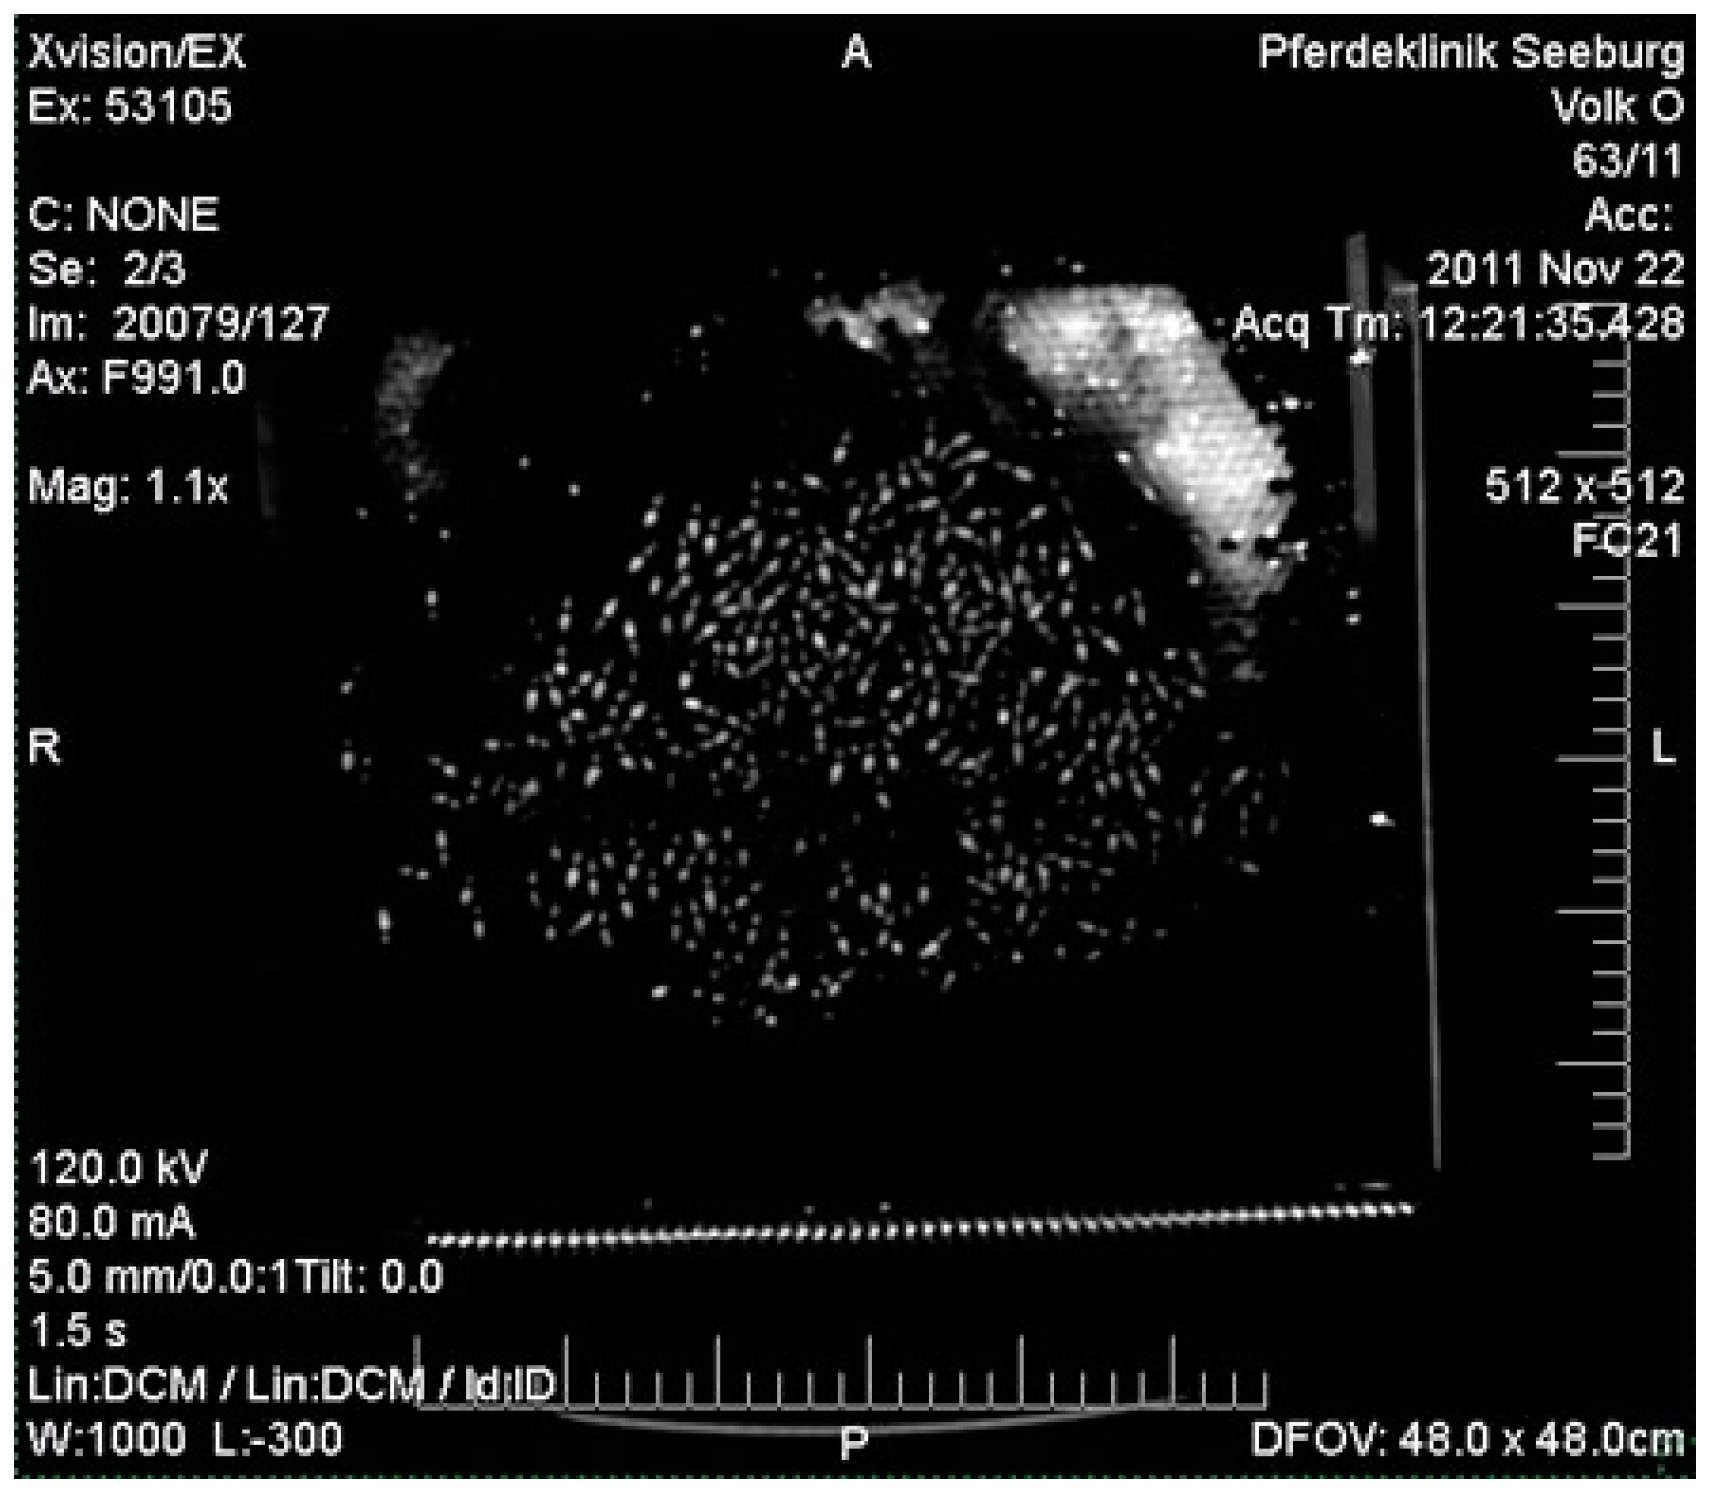
2.2. Computer Tomography of Honey Bee Colonies: Distribution of OAD
2.3. Statistical Analysis
3. Results
3.1. Laboratory Tests: Treatment of Individual Bees with OAD
3.1.1. Investigation of Lethal Effects—Acute Oral and Dermal Toxicity
3.1.2. Investigation of Sublethal Effects
Responsiveness to Water and Ascending Concentrations of Sucrose Solution
Longevity under Laboratory Conditions
pH Values of the Digestive System and the Hemolymph
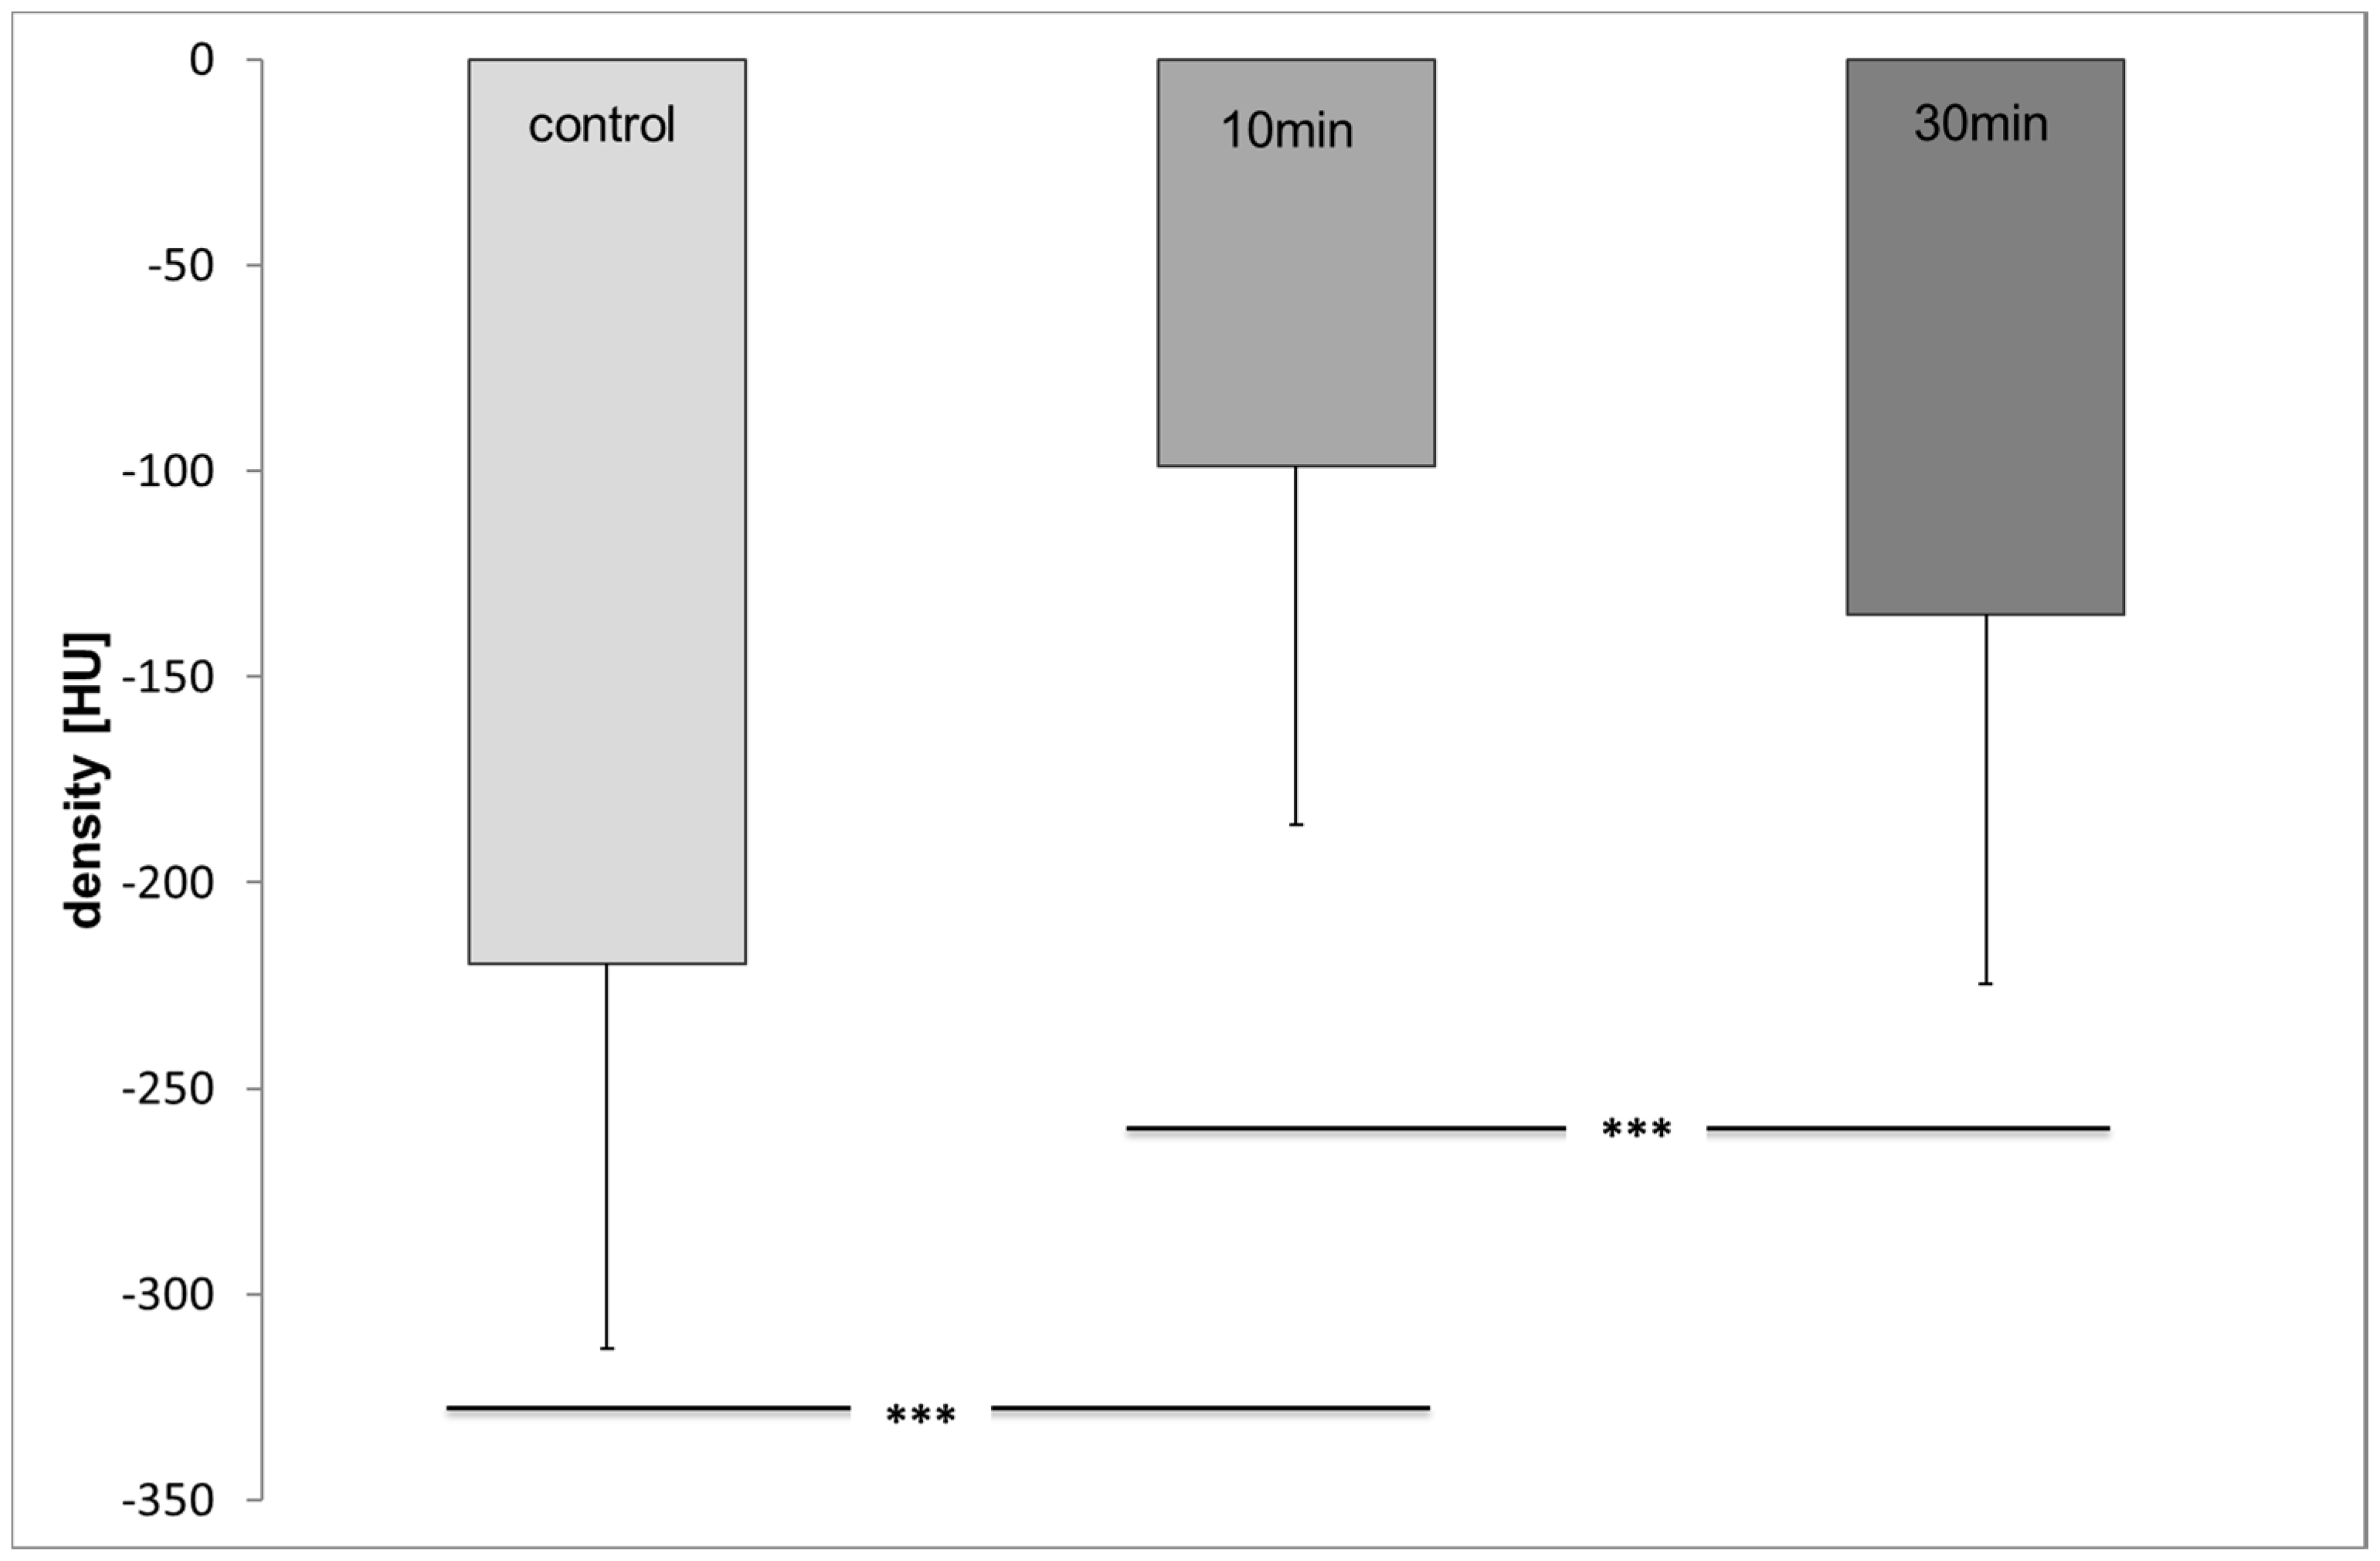
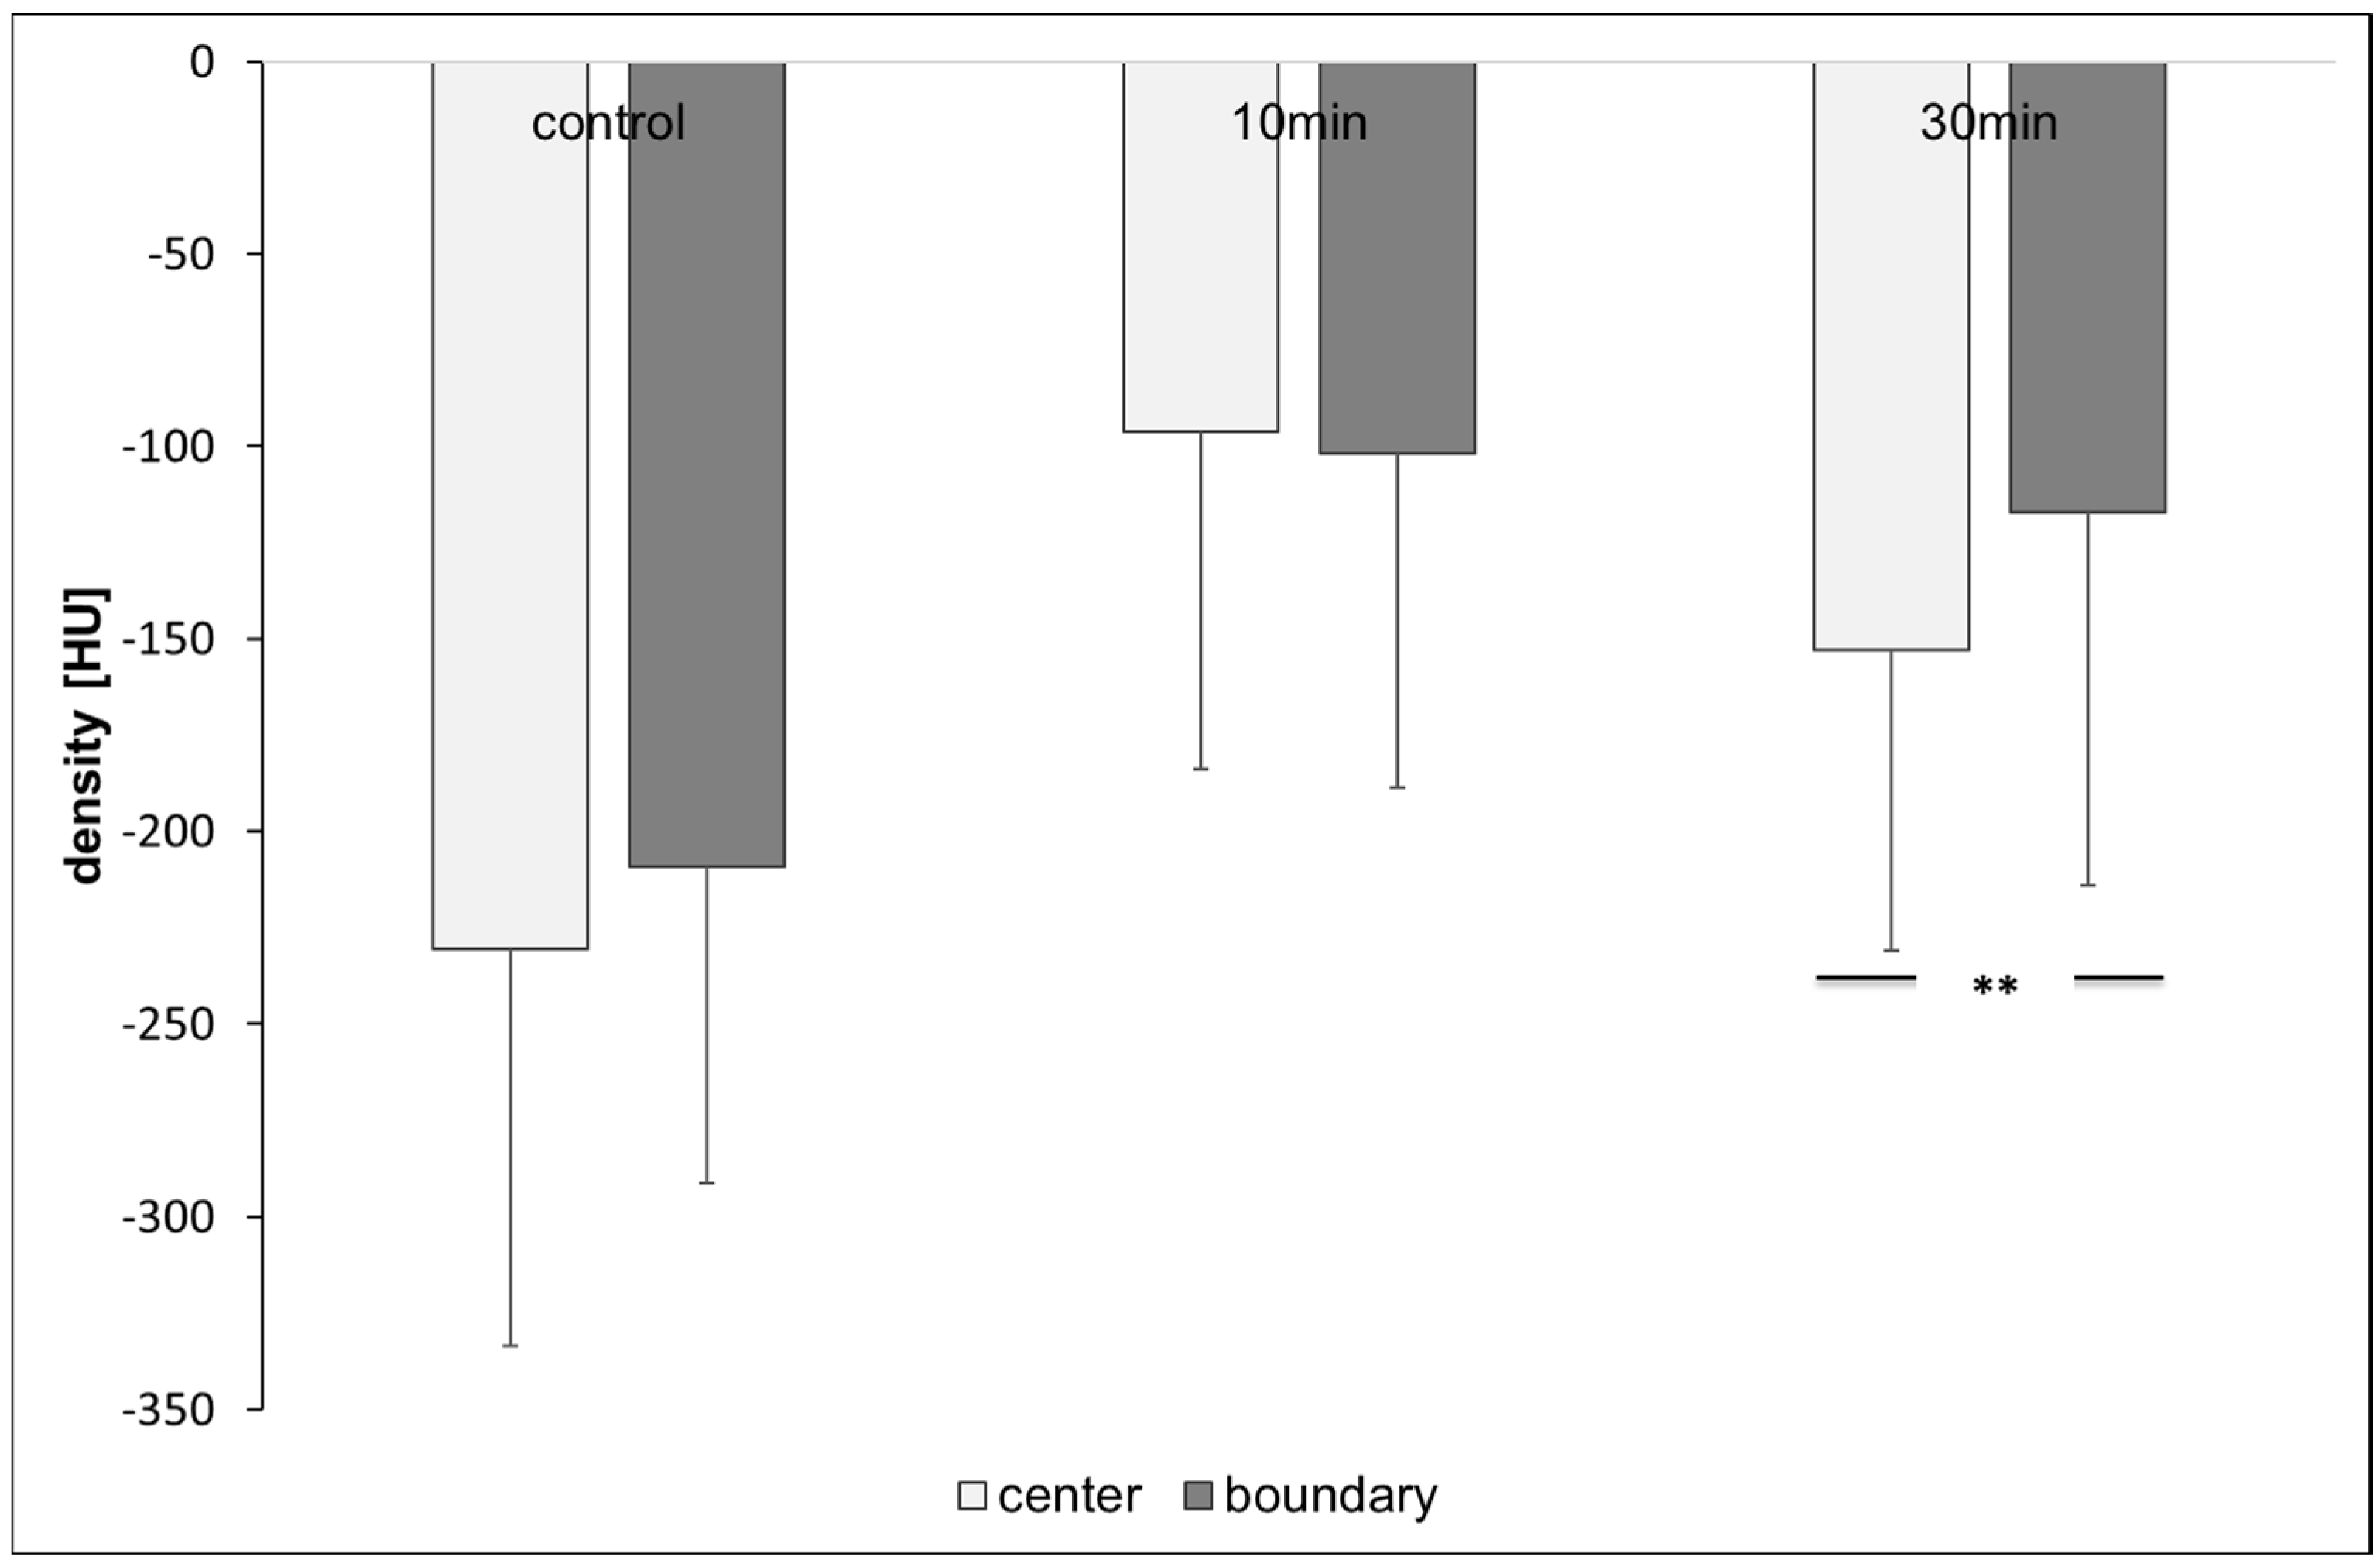
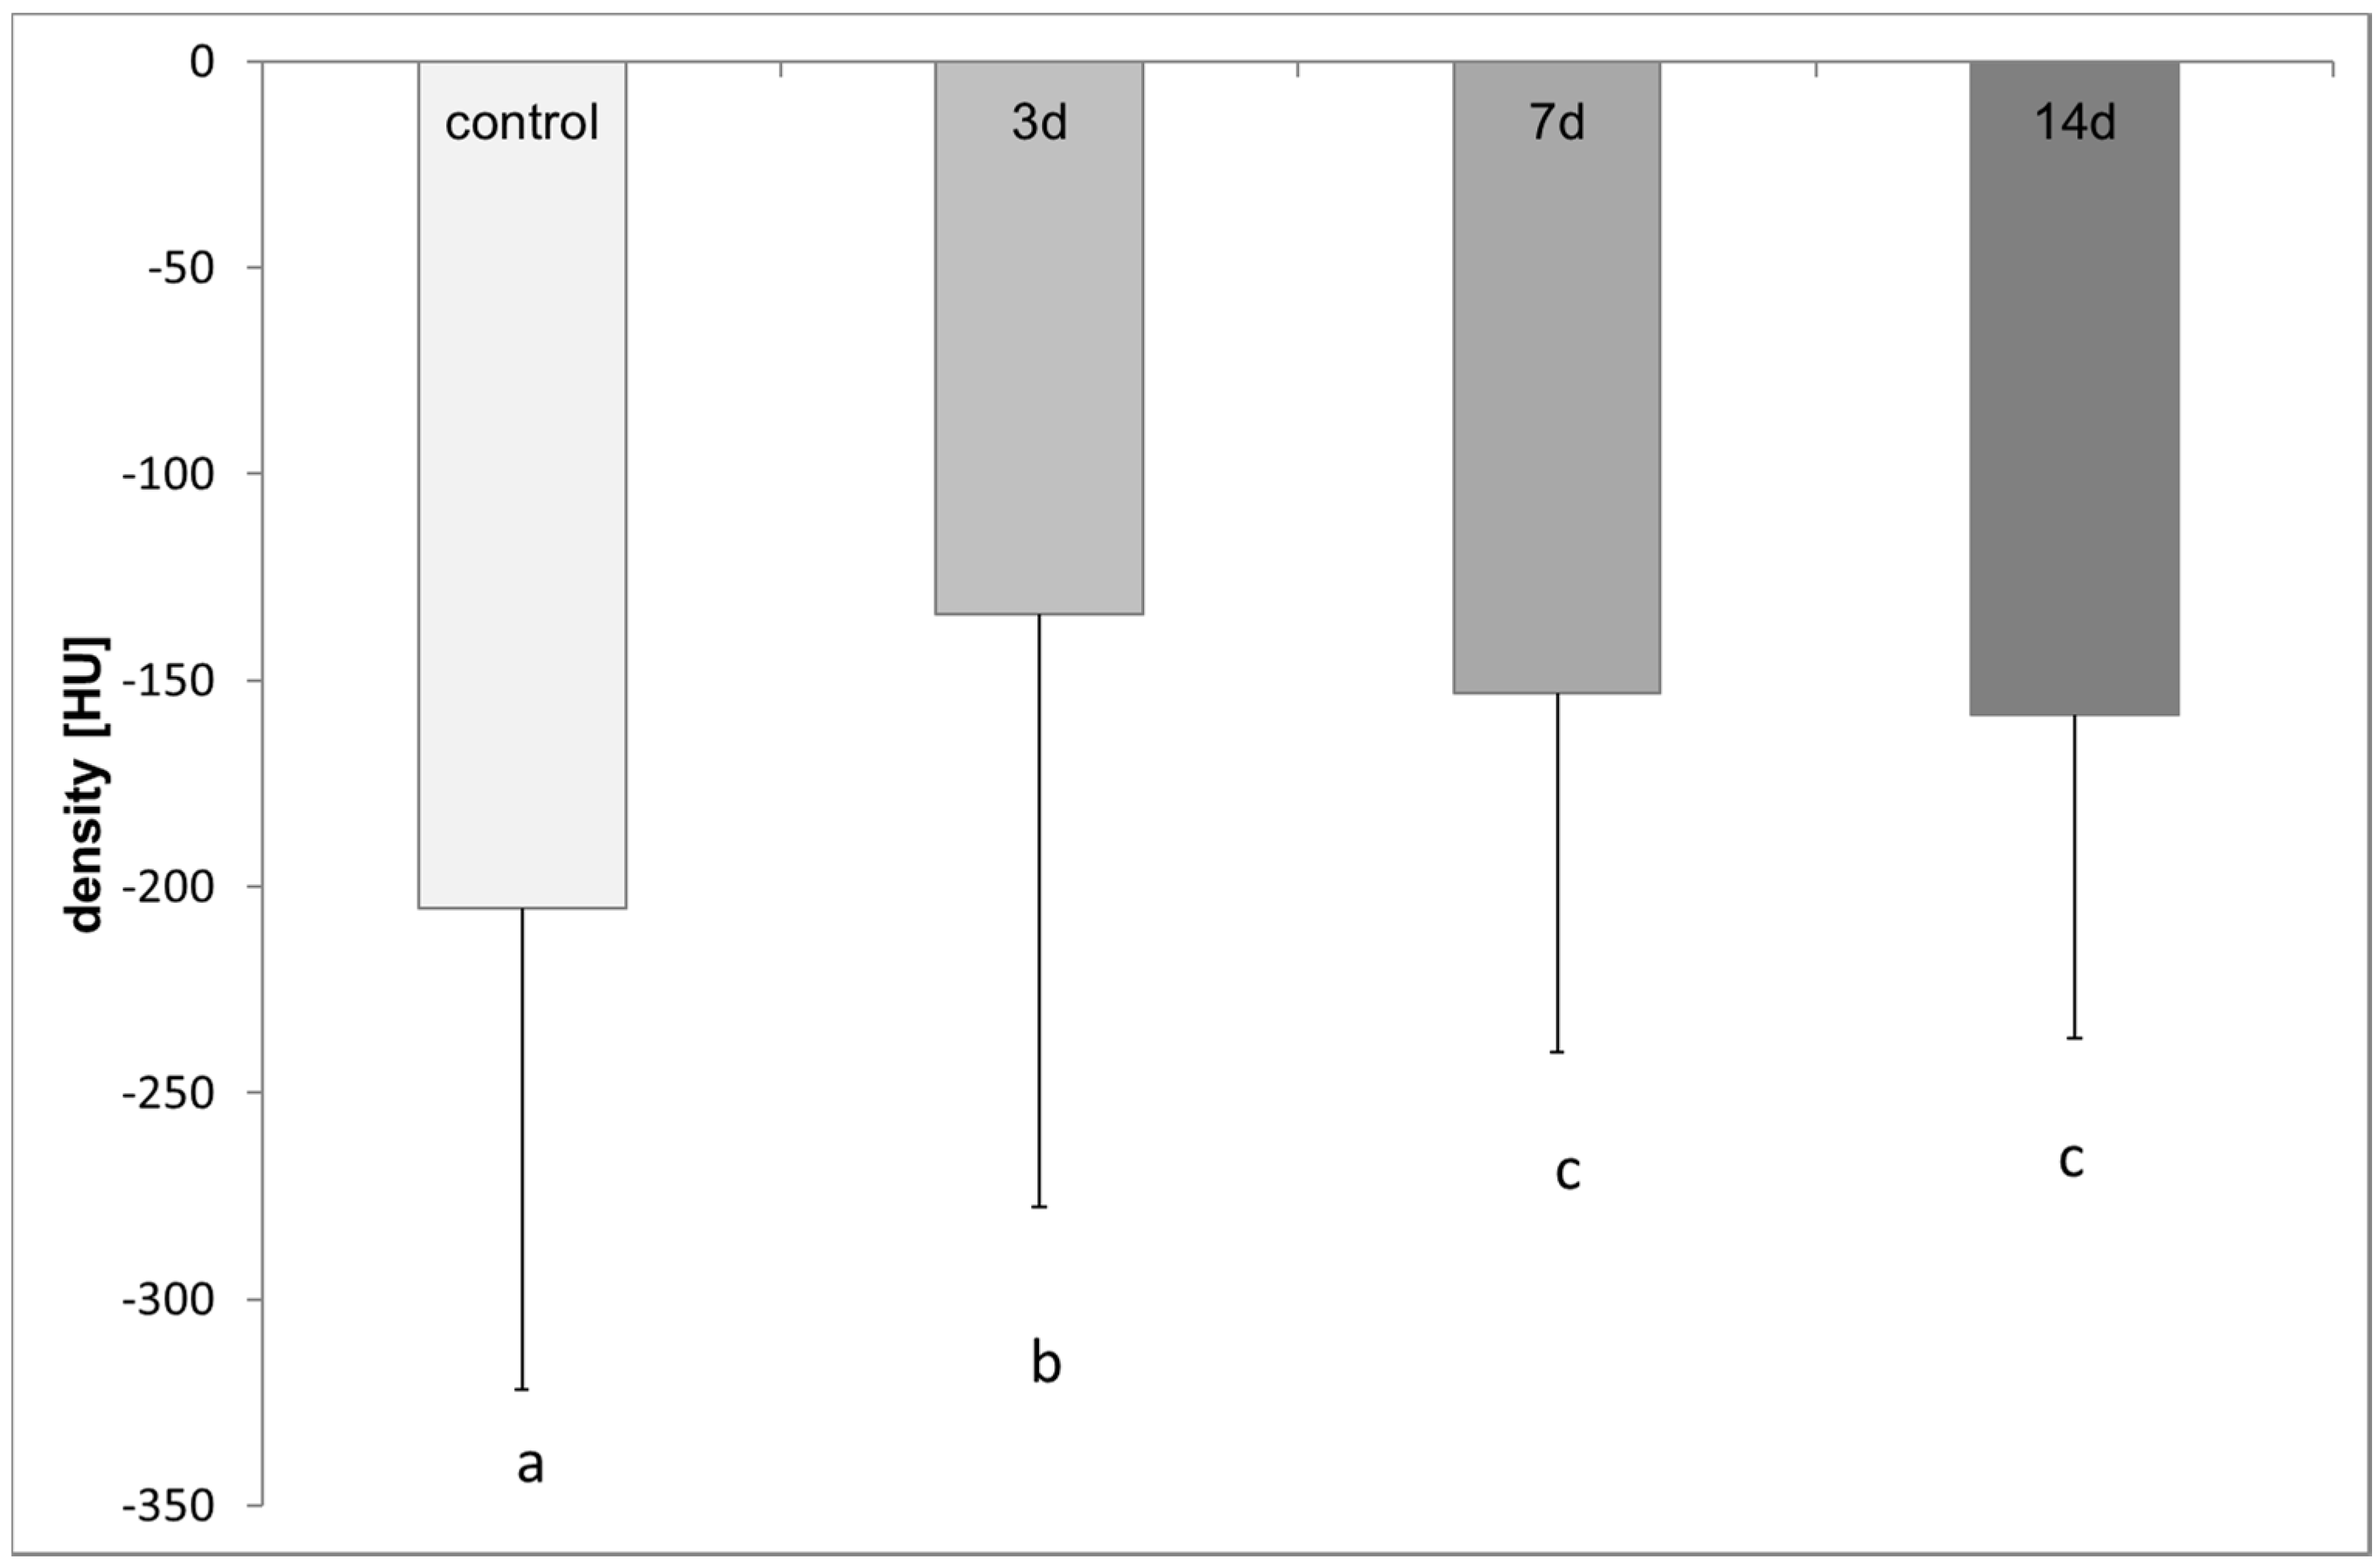
3.2. Computer Tomography of Honey Bee Colonies: Distribution of OAD
4. Discussion
5. Conclusions
Acknowledgments
Author Contributions
Conflicts of Interest
References
- Popov, E.T.; Melnik, V.N.; Matchinev, A.N. Application of oxalic acid in varroatosis. In XXXII International Congress Apimondia; Apimondia Publication: Bucharest, Romania, 1989; p. 149. [Google Scholar]
- Nanetti, A.; Büchler, R.; Charriere, J.D.; Fries, I.; Helland, S.; Imdorf, A.; Korpela, S.; Kristiansen, P. Oxalic acid treatments for varroa control (review). Apiacta 2003, 38, 81–87. [Google Scholar]
- Rademacher, E.; Imdorf, A. Legalization of the use of oxalic acid in Varroa control. Bee World 2004, 85, 70–72. [Google Scholar] [CrossRef]
- Rademacher, E.; Harz, M. Oxalic acid for the control of Varroosis in honey bee colonies—A review. Apidologie 2006, 37, 98–120. [Google Scholar] [CrossRef]
- Rademacher, E. Oxalsäure als Tierarzneimittel zur Bekämpfung der Varroose legal einsetzbar. ADIZ/die biene/Imkerfreund 2006, 2, 9. (In German) [Google Scholar]
- Dade, H.A. Anatomy and Dissection of the Honeybee; Bee Research Association Publications: London, UK, 1977. [Google Scholar]
- Greco, M.K. Imaging techniques for improved bee management. ALP Sci. 2010, 534, 1–38. [Google Scholar]
- Rademacher, E.; Fahlberg, A.; Raddatz, M.; Schneider, S.; Voigt, K. Galenics: Studies of the toxicity and distribution of sugar substitutes on Apis mellifera. Apidologie 2013, 44, 222–233. [Google Scholar] [CrossRef]
- Kanao, T.; Okamoto, T.; Miyachi, Y.; Nohara, N. Parental exposure to low dose X-rays in Drosophila melanogaster includes early emergence in offspring, which can be modulated by transplantation of polar cytoplasm. Mutat. Res. 2003, 527, 1–6. [Google Scholar] [CrossRef]
- Rademacher, E.; Harz, M. Oxalic acid: Toxicology on Apis mellifera. Apidologie 2009, 40, 651–669. [Google Scholar]
- Aliano, N.P.; Ellis, M.D.; Siegfried, B.D. Acute contact toxicity of oxalic acid to Varroa destructor (Acari: Varroidae) and their Apis mellifera (Hymenoptera: Apidae) hosts in laboratory bioassays. J. Econ. Entomol. 2006, 99, 1579–1582. [Google Scholar] [CrossRef] [PubMed]
- Carrasco-Letelier, L.; Mendoza, Y.; Ramallo, G. Acute contact toxicity of oxalic acid on honeybees in the southwestern zone of Uruguay. Chil. J. Agric. Res. 2012, 72, 285–289. [Google Scholar] [CrossRef]
- Desneux, N.; Decourtye, A.; Delpuch, J.M. The sublethal effects of pesticides on beneficial arthropods. Annu. Rev. Entomol. 2007, 52, 81–106. [Google Scholar] [CrossRef] [PubMed]
- Rouibi, A.; Bouchema, W.; Loucif-Ayad, W.; Achou, M.; Soltani, N. Risks assessment of two acaricides (fluvalinate ad oalic acid) in Apis mellifera intermissa (Hymenoptera, Apidae): Acethylcholinestease and glutathione S-trasferase activities. J. Entomol. Zool. Stud. 2016, 4, 503–508. [Google Scholar]
- Brosgaard, C.J.; Jensen, S.E.; Hansen, C.W.; Hansen, H. Spring treatment with oxalic acid in honeybee colonies as Varroa control. DIAS Rep. Hortic. 1999, 6, 1–16. [Google Scholar]
- Gregorc, A.; Pogaènik, A.; Bowen, I.D. Cell death in honeybee (Apis mellifera) larvae treated with oxalic acid. Apidologie 2004, 35, 453–460. [Google Scholar] [CrossRef]
- Hatjina, F.; Haristos, L. Indirect effects of oxalic acid administration by trickling method on bee brood. J. Apicult. Res. 2005, 44, 172–174. [Google Scholar] [CrossRef]
- Moosbeckhofer, R.; (AGES, Vienna, Austria); Rademacher, E.; (Freie Universität Berlin, Berlin, Germany). Personal communication, 2012.
- Higes, M.; Meana, A.; Suarez, M.; Llorente, J. Negative long-term effects on bee colonies treated with oxalic acid against Varroa jacobsoni Oud. Apidologie 1999, 30, 289–292. [Google Scholar] [CrossRef]
- Martin-Hernandez, R.; Higes, M.; Perez, J.L.; Nozal, M.J.; Gomez, L.; Meana, A. Short term negative effect of oxalic acid in Apis mellifera iberiensis. Span. J. Agric. Res. 2007, 5, 474–480. [Google Scholar] [CrossRef]
- Nozal, M.J.; Bernal, J.; Gomez, L.; Higes, M.; Meana, A. Determination of oxalic acid and other organic acids in honey and in some anatomic structures of bees. Apidologie 2003, 34, 181–188. [Google Scholar] [CrossRef]
- Nanetti, A.; Ghini, S.; Gattavecchia, E.; Bartolomei, P.; Marcazzan, G.L.; Massi, S. Pharmacodynamics of Oxalic Acid and Treatment Residues in Honey; European Group for Integrated Varroa Control (CA 3686): Rauischholzhausen, Germany, 2003. [Google Scholar]
- Raddatz, M.; Rademacher, E. Sublethal effects of oxalic acid on Apis mellifera L. (Hymenoptera: Apidae): Pharmacodynamics. Apidologie 2010, 41, 676–694. [Google Scholar]
- Schneider, S.; Eisenhardt, D.; Rademacher, E. Sublethal effects of oxalic acid on Apis mellifera L. (Hymenoptera Apidae): Changes in behavior and longevity. Apidologie 2012, 43, 218–225. [Google Scholar] [CrossRef]
- O’Neil, M.J. The Merck Index: An Encyclopedia of Chemicals, Drugs and Biologicals, 13th ed.; Whitehouse Station: New York, NY, USA, 2001. [Google Scholar]
- Charriere, J.D.; Imdorf, A. Oxalic acid treatment by trickling against Varroa destructor: Recommendations for use in Central Europe and under temperate climate conditions. Bee World 2002, 83, 51–60. [Google Scholar] [CrossRef]
- Toomemaa, K.; Martin, A.; Williams, I. The effect of different concentrations of oxalic acid in aquaeous and sucrose solution on Varroa mites and honey bees. Apidologie 2010, 41, 634–653. [Google Scholar] [CrossRef]
- Aliano, N.P.; Ellis, M.D. Bee-to-bee contact drives oxalic acid distribution in honey bee colonies. Apidologie 2008, 39, 481–487. [Google Scholar] [CrossRef]
- Rademacher, E.; Harz, M.; Schneider, S. The development of HopGuard® as a winter treatment against Varroa destructor in colonies of Apis mellifera. Apidologie 2015, 46, 748–759. [Google Scholar] [CrossRef]


| Parameter | Resolution |
|---|---|
| Slice thickness | 2 mm |
| Pitch | 2.5 |
| Helix | 250 mm |
| Peak X ray voltage | 120 kV |
| X ray tube current | 80 mA |
| Total scan time | 75 s |
| Matrix | 512x512 |
| Scan field of view | large |
| Display field of view | 480 mm |
| Window width | 1000 |
| Window level | −300 |
| Total scan dosage | 249.8 mGy |
| Dermal Application (µg/bee) | Oral Application (µg/bee) | |||
|---|---|---|---|---|
| 48 h | 72 h | 48 h | 72 h | |
| LD10 | 467.7 | 256.4 | 68.1 | 60.3 |
| NOAEL | n.d. b | 212.5 | 75 | 50 |
| LOAEL a | n.d. b | 250 | 80 | 75 |
| chi2-test | p = 0.003 | p < 0.001 | p = 0.027 | |
© 2017 by the authors. Licensee MDPI, Basel, Switzerland. This article is an open access article distributed under the terms and conditions of the Creative Commons Attribution (CC BY) license (http://creativecommons.org/licenses/by/4.0/).
Share and Cite
Rademacher, E.; Harz, M.; Schneider, S. Effects of Oxalic Acid on Apis mellifera (Hymenoptera: Apidae). Insects 2017, 8, 84. https://doi.org/10.3390/insects8030084
Rademacher E, Harz M, Schneider S. Effects of Oxalic Acid on Apis mellifera (Hymenoptera: Apidae). Insects. 2017; 8(3):84. https://doi.org/10.3390/insects8030084
Chicago/Turabian StyleRademacher, Eva, Marika Harz, and Saskia Schneider. 2017. "Effects of Oxalic Acid on Apis mellifera (Hymenoptera: Apidae)" Insects 8, no. 3: 84. https://doi.org/10.3390/insects8030084
APA StyleRademacher, E., Harz, M., & Schneider, S. (2017). Effects of Oxalic Acid on Apis mellifera (Hymenoptera: Apidae). Insects, 8(3), 84. https://doi.org/10.3390/insects8030084