Article

Identification of Eastern United States Reticulitermes Termite Species via PCR-RFLP, Assessed Using Training and Test Data

1
Department of Biology, University of Mississippi, Oxford, MS 38677, USA
2
Department of Biology, Virginia Commonwealth University, Richmond, VA 23284, USA
*
Author to whom correspondence should be addressed.
Insects 2015, 6(2), 524-537; https://doi.org/10.3390/insects6020524
Submission received: 17 April 2015 / Revised: 30 May 2015 / Accepted: 2 June 2015 / Published: 9 June 2015

Abstract

:
Reticulitermes termites play key roles in dead wood decomposition and nutrient cycling in forests. They also damage man-made structures, resulting in considerable economic loss. In the eastern United States, five species (R. flavipes, R. virginicus, R. nelsonae, R. hageni and R. malletei) have overlapping ranges and are difficult to distinguish morphologically. Here we present a molecular tool for species identification. It is based on polymerase chain reaction (PCR) amplification of a section of the mitochondrial cytochrome oxidase subunit II gene, followed by a three-enzyme restriction fragment length polymorphism (RFLP) assay, with banding patterns resolved via agarose gel electrophoresis. The assay was designed using a large set of training data obtained from a public DNA sequence database, then evaluated using an independent test panel of Reticulitermes from the Southern Appalachian Mountains, for which species assignments were determined via phylogenetic comparison to reference sequences. After refining the interpretive framework, the PCR-RFLP assay was shown to provide accurate identification of four co-occurring species (the fifth species, R. hageni, was absent from the test panel, so accuracy cannot yet be extended to training data). The assay is cost- and time-efficient, and will help improve knowledge of Reticulitermes species distributions.

Graphical Abstract

1. Introduction

Termites in the genus Reticulitermes provide critical ecosystem services in forests [1]. They also cause extensive damage to man-made structures, and are one of the most economically important pests in urban areas. Five species with overlapping geographic ranges occur in the eastern United States (i.e., R. flavipes Kollar, R. virginicus Banks, R. nelsonae Lim and Forschler, R. hageni Banks and Snyder, and R. malletei Howard and Clement), and they are notoriously difficult to distinguish morphologically [2]. In this group, the most informative characters are possessed by soldiers and adult winged reproductives (alates). However, soldiers are often quite rare (<5% frequency [3]), and even when they are encountered, 9–29 individuals are usually needed to achieve 95% confidence in species identification [2]. Furthermore, many colonies are quite young [4] such that only one primary reproductive pair (i.e., the original king and queen that founded the colony) is present, making this caste difficult to sample. Accordingly, molecular approaches offer considerable value for identification of Reticulitermes species, as they can be readily applied to the worker caste [5].
Mitochondrial DNA (mtDNA) sequences have been successfully used for species identification across diverse invertebrate groups (e.g., Collembola [6], Lepidoptera [7], and Hymenoptera [8]). Properties of this genome that simplify its utility include haploid uniparental inheritance, lack of recombination, and fast molecular evolutionary rates relative to protein-coding nuclear genes [9]. These advantages, coupled with the early development of conserved polymerase chain reaction (PCR) primers [10,11], have contributed to a strong representation of arthropod mtDNA sequences in public databases. Reticulitermes termites are no exception (e.g., currently >790 records for the five eastern United States species in the GenBank repository; www.ncbi.nlm.nih.gov). This large amount of information facilitates discovery of diagnostic nucleotide differences, which can then be targeted in genetic screening assays to enable identification of specimens regardless of caste or life stage.
Over the past two decades, natural resource managers have gained valuable information by using PCR-based molecular diagnostics for rapid taxonomic identification (e.g., illegal wildlife trade [12], biodiversity surveys [13], and trophic interactions [14]). Ultimately, these approaches are underpinned by DNA sequence-based comparison of an “unknown” sample to a reference database comprised of specimens of known identity. One potential limitation, however, relates to the cost of DNA sequencing. Indeed, when the pool candidate species to which a sample may belong is small and well-characterized, the information content of a typical Sanger sequence read (≥700-bp) can far exceed that needed to make a positive identification. In these cases, more cost- and time-efficient assays such as PCR-restriction fragment length polymorphism (RFLP) are desirable.
PCR-RFLP has been widely employed in studies focused on either intra- or interspecific levels of biological organization [15,16,17,18,19], including in the context of Reticulitermes species identification [3,20]. Here we extend on previous work by identifying a set of mtDNA sequence differences, located within restriction enzyme recognition sites, which can be used to distinguish among Reticulitermes species that co-occur in the eastern United States. We focused on the mitochondrial cytochrome oxidase subunit II (mtCOII) gene because it is well represented in public databases, and compared to other genes such as the cytochrome oxidase subunit I (mtCOI) “barcoding” gene region [13], it shows low intraspecific variability in Reticulitermes [2]. We applied the PCR-RFLP assay to an independent “test panel” (i.e., samples that had not contributed to primer design or selection of restriction enzymes) comprised of Reticulitermes collected from the Southern Appalachian Mountains. To assess accuracy, PCR-RFLP species identifications for the test panel were compared to identifications based on DNA sequencing coupled with phylogenetic analyses that included reference sequences for which morphological species diagnoses had been previously been performed. Finally, we refined the interpretive framework relating to expected PCR-RFLP banding patterns.

2. Materials and Methods

2.1. Database Mining and PCR-RFLP Assay Design

Mitochondrial COII sequences from each of the five target species of Reticulitermes were retrieved from the GenBank repository. Only those accessions that were reported to have been sampled from the eastern United States (broadly defined as east of the Mississippi River) were used. We also excluded sequences that contained premature stop codons, or were atypical of the focal species and thus may represent cases of nuclear-mitochondrial pseudogenes, or misidentification. Following this filtering step, for each focal species, mtCOII sequences were aligned in MEGA v6.06 [21] and a consensus sequence containing information on all observed intraspecific nucleotide polymorphisms was generated. Species-specific consensus sequences were then aligned, and potentially diagnostic single nucleotide polymorphisms (SNPs) were identified.
NEBcutter v2.0 [22] was used to determine which of the potentially diagnostic DNA sequence differences could be resolved using restriction enzymes. The final choice of enzymes considered cost, simplicity of expected banding patterns (i.e., total number of cut sites and resolvability of fragment length differences via agarose gel electrophoresis), and overall efficiency (i.e., minimum number of separate restriction digest reactions). We then designed PCR primers (RetCo2-F: 5'-TGCAATACCATCCTTACG-3' and RetCo2-R: 5'-TCCACAGATTTCTGAGC-3') to amplify the most information-rich fragment of mtCOII while keeping amplicon length short, so that electrophoretic separation of PCR-RFLP fragments was rapid. This also facilitates application to degraded DNA.

2.2. Empirical Application of the PCR-RFLP Assay to Novel Samples

Reticulitermes termites were collected from 55 sites (i.e., decomposing logs) throughout the Southern Appalachian Mountains and surrounding forested areas Figure 1. Collection sites spanned Mississippi, Alabama, Georgia, Tennessee, South Carolina, North Carolina, Virginia and West Virginia because these states encompass geographic distributions of each of the five focal species including areas where they co-occur. We sampled natural populations (rather than infestations of man-made structures in urban areas) because these may contain a better representation of extant intraspecific genetic diversity. Following collection, specimens were stored in 95% ethanol, and spatial coordinates of each site were recorded (Table S1).
Genomic DNA was extracted from whole specimens (worker caste; one individual per site, n = 55) using a DNeasy Blood and Tissue Kit (Qiagen, Valencia CA, USA), following the manufacturer’s recommendations. The mtCOII fragment was amplified in 10 µL volumes (or multiples thereof) comprised of 2.0 μL 5 × PCR buffer (Promega, Maddison WI, USA), 0.8 μL MgCl2 (25 mM, Promega), 1.6 μL dNTPs (1.25 mM, Promega), 0.5 μL Bovine Serum Albumin (10 mg/mL, New England BioLabs, Ipswich, MA, USA), 3.0 μL dH2O, 0.5 μL of each primer (RetCo2-F and RetCo2-R, 10 μM), 0.1 μL Go-Taq (5 U/μL, Promega), and 1.0 μL of genomic DNA. Amplifications were performed using a Bio-Rad T100 Thermal Cycler with the following profile: 95 °C for 2 min (1 cycle), 95 °C for 30 s, 54 °C for 30 s, and 72 °C for 1 min (35 cycles), and final extension of 72 °C for 2 min (1 cycle). Restriction enzyme digestions of PCR products were performed in 25 μL reaction volumes containing 13.75 μL dH2O, 2.5 μL of the recommended 10× restriction enzyme buffer (Promega), 0.25 μL Bovine Serum Albumin (10 mg/mL, New England BioLabs), 1.5 μL restriction enzyme (10 U/μL, Promega), and 7 μL of PCR product. Reactions were incubated at the recommended temperature overnight, to ensure complete digestion. For electrophoretic separation of fragments, we used 1.5% agarose gels with GelRed™ nucleic acid stain (Phenix Research Products, Asheville NC, USA), and 1× TBE buffer. A 100-bp ladder was included, and gels were run for ~3 h at 80 V, 50 mA.
Figure 1. Map of collection sites of Reticulitermes specimens used as a “test panel” when assessing performance of the new PCR-RFLP assay. Sites are represented as black circles, numbered sequentially from 1–55 according to latitude, corresponding with Table S1 (grey numbers indicate sites from which R. flavipes were sampled, red = R. virginicus, blue = R. malletei, and green = R. nelsonae). States are represented by dashed grey lines, and those from which termites were collected are labelled with abbreviations (black text) as follows: Mississippi, MS; Alabama, AL; Georgia, GA; Tennessee, TN; South Carolina, SC; North Carolina, NC; Virginia, VA; and West Virginia, WV.
Insects 06 00524 g001

2.3. Evaluation of Performance and Refinement of the Interpretive Framework

To assesses accuracy of the new PCR-RFLP assay, screened specimens were assigned to one of the five focal species via molecular phylogenetic comparison (described below) to Lim and Forschler’s [2] set of morphologically and genetically verified reference specimens of eastern Reticulitermes spp. (GenBank accessions: R. flavipes, EU689009; R. virginicus, EU689027; R. hageni, EU689026; R. malletei JF796227; and R. nelsonae, EU689013). First, a ~650-bp fragment of the mtCOII gene was amplified using the same reaction mixture and thermal cycling conditions as described above, but using primers 5'-AGAGCWTCACCTATTATAGAAC-3' [23] and 5'-GTTTAAGAGACCAGTACTTG-3' [11], and a 50 °C annealing temperature. PCR products were purified using ExoSAP-IT® (Affymetrix, Santa Clara, CA, USA), and sequenced on an Applied Biosystems 3730x Genetic Analyzer at Yale University. Next, chromatograms were edited and aligned in GENEIOUS v6.1.6 [24]. To confirm that data from true mtDNA had been obtained, rather than nuclear-mitochondrial pseudogenes which can be common in invertebrates [25], sequences were translated into amino acids and compared to accessions in NCBI’s nucleotide and protein databases via the BLAST search function [26].
Phylogenetic comparison of non-redundant mtCOII sequences from the 55 new (this study) vs. five reference [2] Reticulitermes specimens was performed with MEGA using two different optimality criteria: maximum likelihood (ML) and maximum parsimony (MP). For the ML analysis, we used the best-fit model of nucleotide substitution identified using jModelTest 2 [27], empirical base frequencies, a Neighbor Joining starting tree, and nearest-neighbor-interchange branch swapping. MP analysis used 10 random addition starting trees, and tree-bisection-regrafting branch swapping. The pool of equally parsimonious trees was summarized as a 50% majority-rule consensus tree. For both optimality criteria, node support was assessed via 500 bootstrap replicates, and no out-group was included given that our main focus was on clustering of sequences, not on polarity of the branching process across the tree. Species identification of new specimens was based on their phylogenetic clustering with a reference sequence. As a working definition, the most inclusive and well-supported clade (bootstrap support >70% [28]) that contained only one reference sequence was considered to represent that particular Reticulitermes species.
For our test panel of 55 Reticulitermes termites, performance of the PCR-RFLP assay was evaluated in two ways. First, the proportion of unambiguous vs. ambiguous species assignments, given the expected banding patterns derived from GenBank accessions, was calculated. Second, we quantified the level of agreement between RFLP- vs. sequence-based species assignments. We then reconciled differences between RFLP- vs. DNA sequence-based species assignments by refining the interpretive framework to accommodate novel banding patterns seen during application of the PCR-RFLP assay.

3. Results

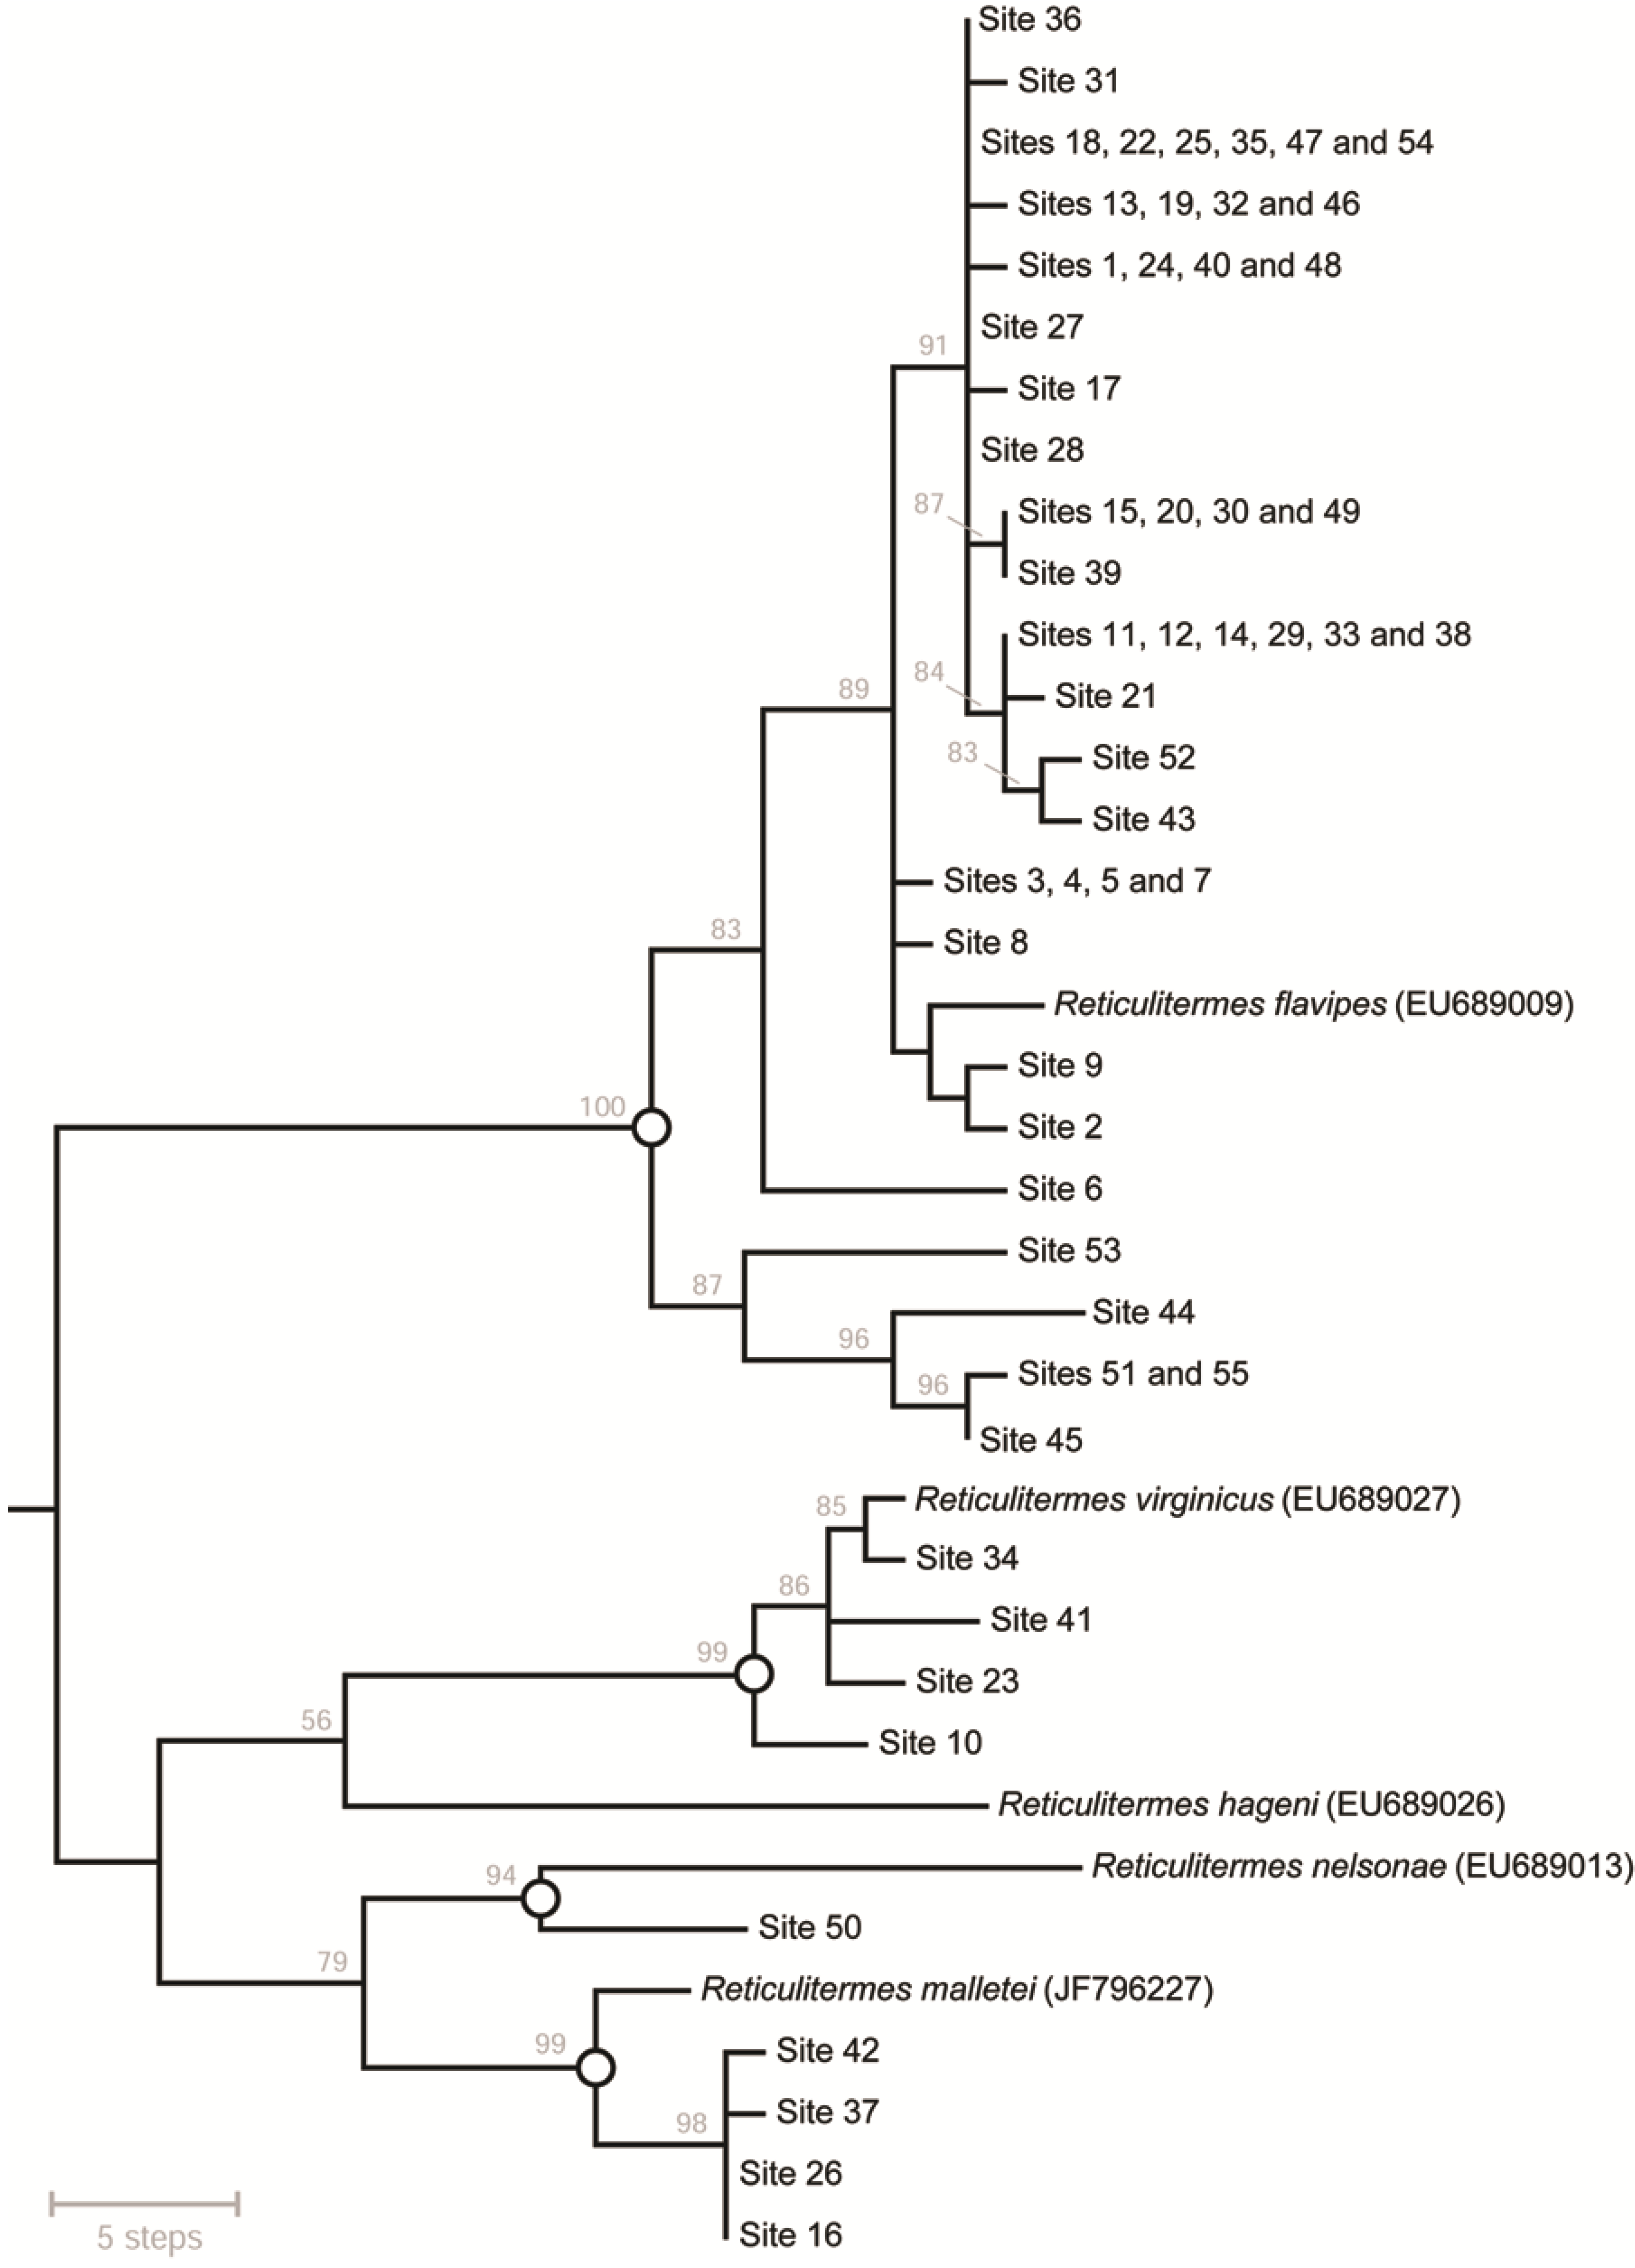
3.1. Database Mining and PCR-RFLP Assay Design

There were 132 GenBank accessions that met the conditions for inclusion in designing the new PCR-RFLP assay. However, representation of the five focal species was asymmetrical (i.e., 99 R. flavipes; 14 R. virginicus; 8 R. nelsonae; 7 R. hageni; and 4 R. malletei; Table S2). Based on the aligned consensus sequences (658-bp), 10 polymorphic sites that were potentially diagnostic of species were identified, and six could be resolved using commercially-available restriction enzymes (Table S3). We targeted four of these with three restriction enzymes: Rsa I, Taq I, and Msp I. The PCR primers that we designed (RetCo2-F and RetCo2-R) amplify a 376-bp mtCOII fragment that contained these recognition sites. Expected banding patterns, based on in silico digestion of GenBank accessions, were relatively simple (i.e., maximum of three cut sites). Furthermore, fragments were of sufficiently different electrophoretic mobility that they could be resolved using standard agarose gels (i.e., minimum size differences of 12-, 10- and 37-bp for Rsa I, Taq I and Msp I, respectively, for fragments that are at least 50-bp long; Table S4).

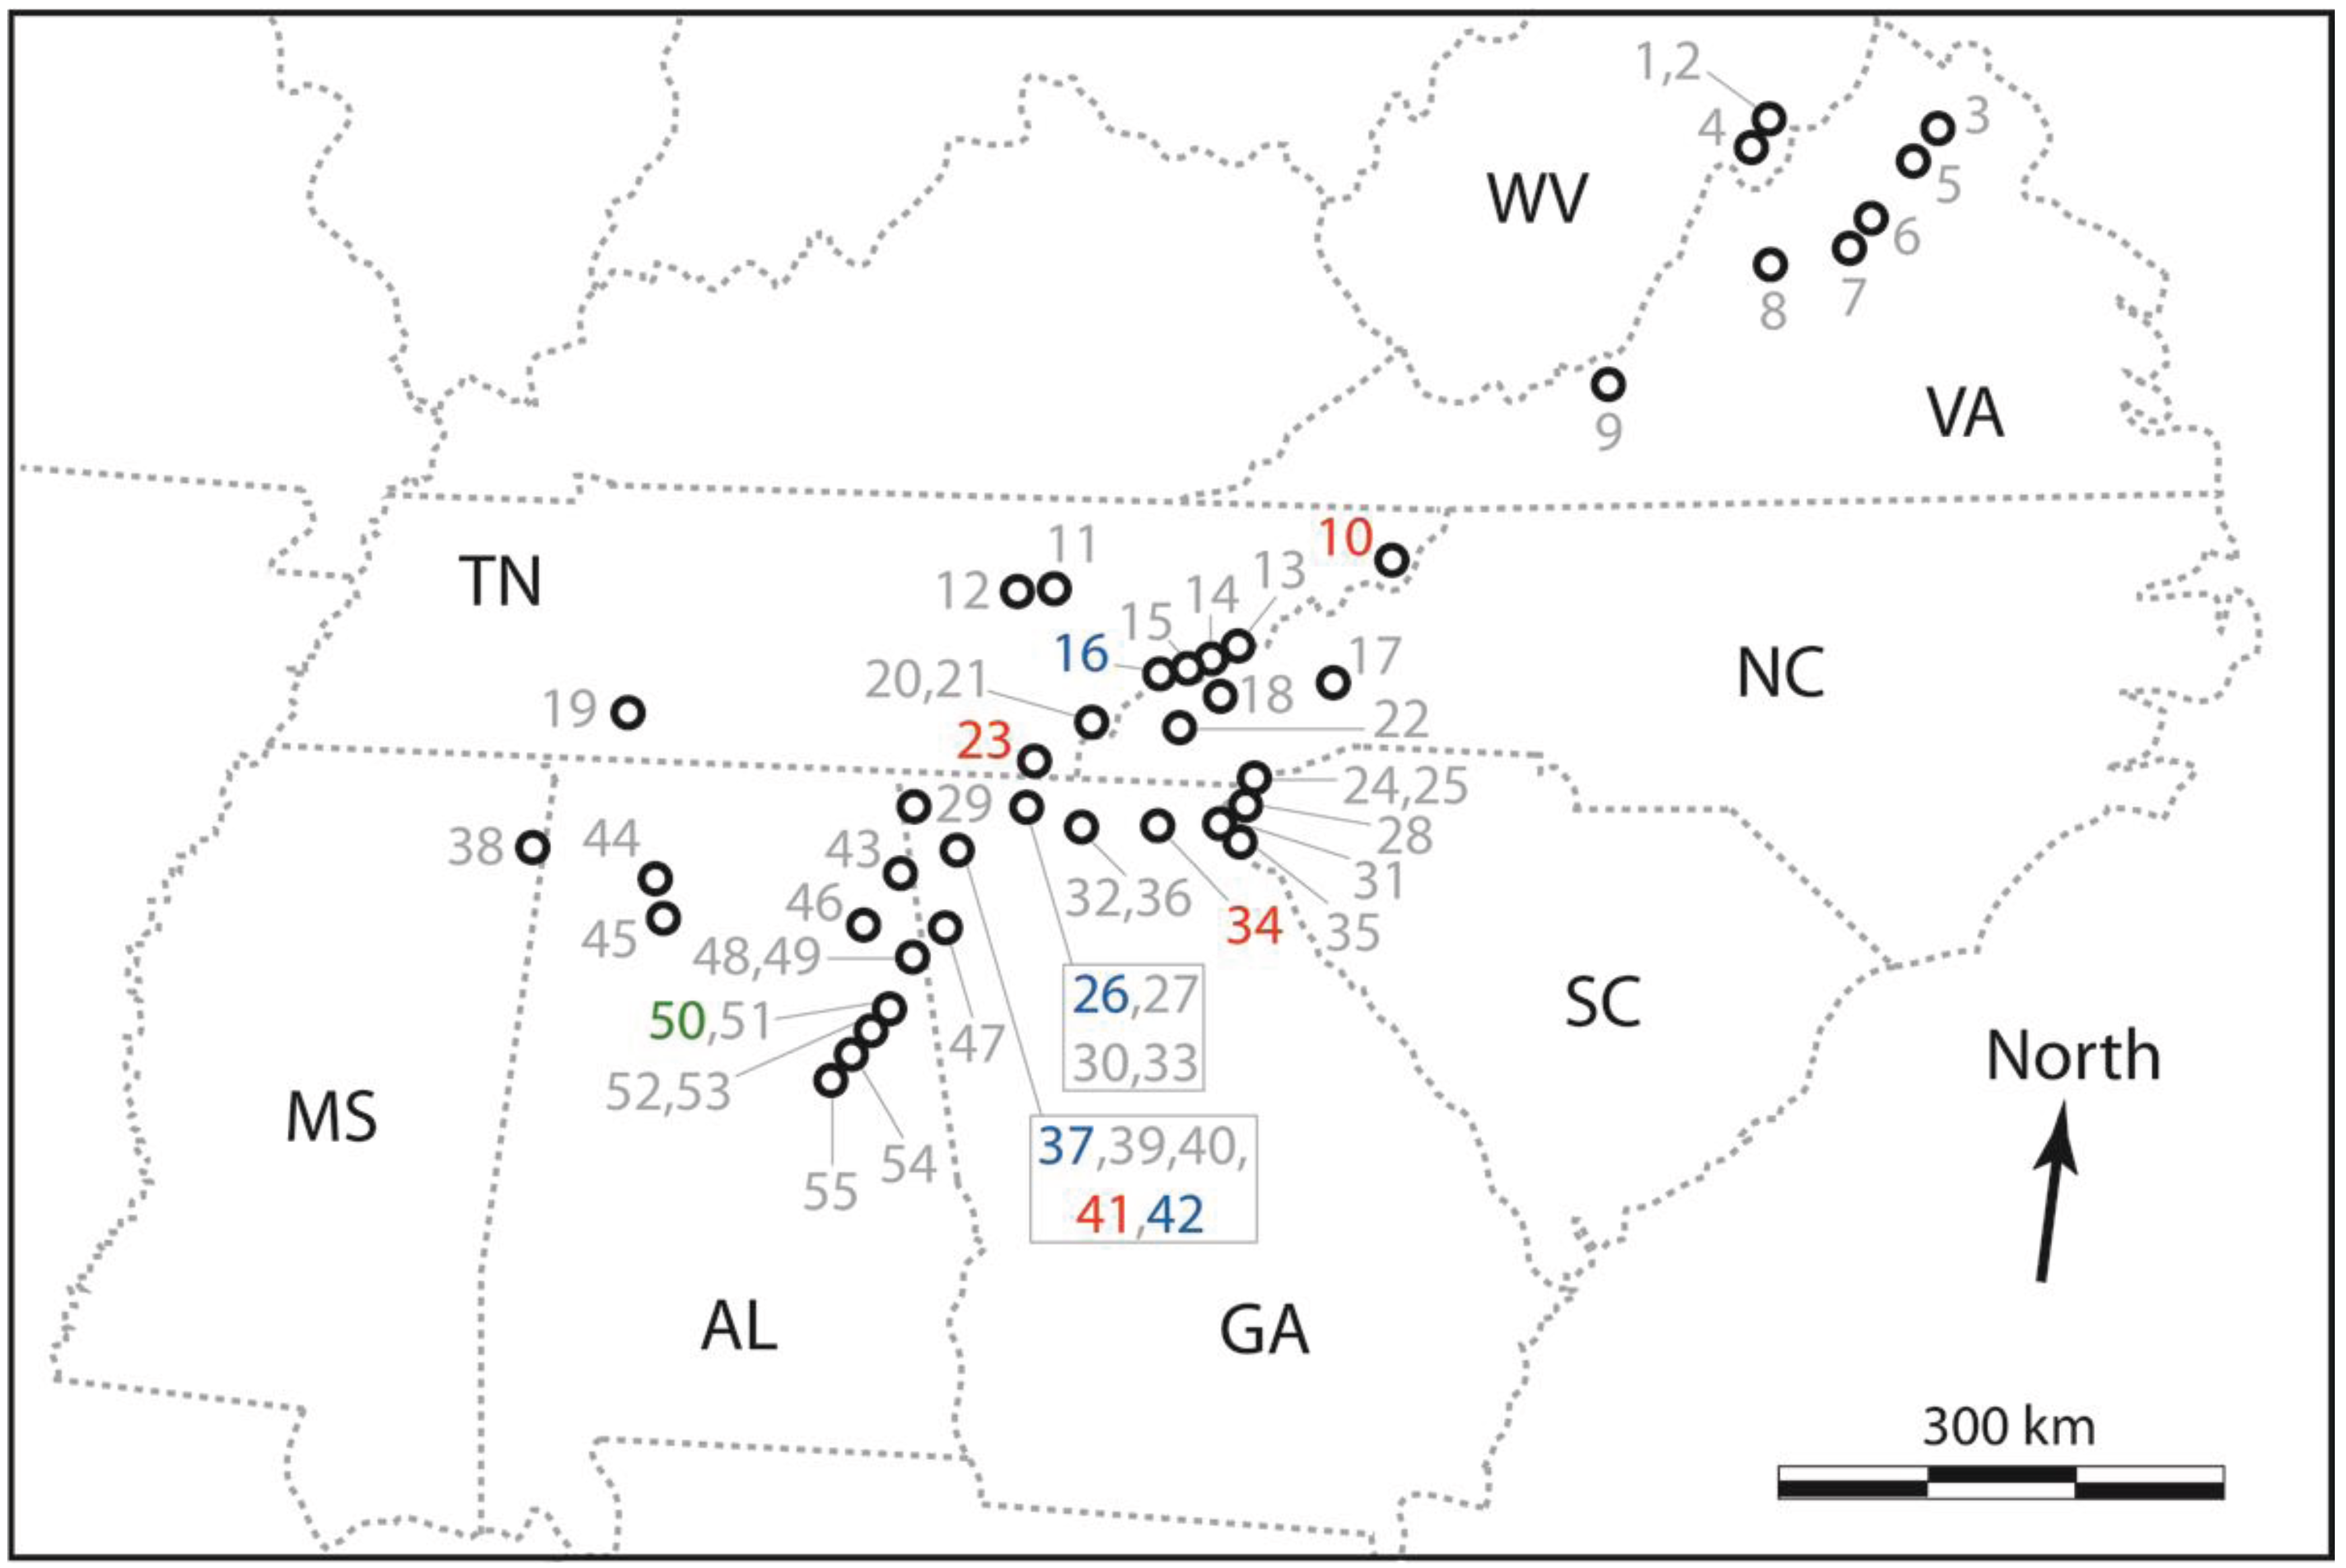
3.2. Empirical Application of the PCR-RFLP Assay to Novel Samples

From the 55 Reticulitermes termites sampled from the Southern Appalachian Mountains (Figure 1; Table S1), the PCR-RFLP assay and interpretive framework designed from “training data” obtained from GenBank (Table S4) identified 37 R. flavipes, four R. virginicus, and four R. malletei. The remaining 10 specimens (18%) had an ambiguous species assignment. Ambiguities were attributable either to an unexpected three-enzyme combination of otherwise predicted banding patterns (n = 2 samples, each different from the other), or the unexpected absence of single-enzyme cut site (n = 8 samples, same missing cut site).

3.3. Evaluation of Performance and Refinement of the Interpretive Framework

For the all Southern Appalachian Reticulitermes termites assayed via PCR-RFLP, a 607-bp mtCOII sequence alignment comprising 88 variable sites was generated (GenBank accessions: KR870353–KR870407). DNA sequences were AT-rich (63%), no premature stop codons were detected, the majority of substitutions (85.2%) were synonymous, and BLAST searches returned close matches to arthropod mtCOII. Taken together, this indicated that true mtDNA had been sequenced. Thirty two non-redundant haplotypes were identified. Phylogenetic comparison with reference sequences from five eastern United States Reticulitermes termite species [2] was based on 106 variable sites (65 were parsimony-informative). For MP analysis, eight equally parsimonious trees (length = 166 steps) were obtained Figure 2. For ML analysis, the best-fit model of nucleotide substitution was HKY + I, and the best tree had a log likelihood score of −lnL = −1719.475 (Figure S1). Both optimality criteria produced the same outcomes with respect to species-level identification of Southern Appalachian specimens.
The majority (n = 46) of Southern Appalachian samples were phylogenetically assigned to R. flavipes. Remaining samples were comprised of R. virginicus and R. malletei, each represented by four specimens, plus one R. nelsonae sample (R. hageni was not present in our test panel). For R. flavipes, R. virginicus and R. malletei, species assignment was unambiguous; mean DNA sequence similarity between reference sequences versus the Southern Appalachian samples in their clade was 99%. Conversely, some uncertainty was associated with identification of R. nelsonae; the reference sequence showed lower (97%) mean DNA sequence similarity with the one Southern Appalachian sample assigned to this taxon. Thus, in this particular case we cautiously consider phylogenetic species identification to be tentative.
Figure 2. Phylogenetic relationships among Reticulitermes mtCOII sequences from 55 new and five reference specimens (n = 37 non-redundant haplotypes; 607-bp alignment), estimated using Maximum Parsimony. Shown here is a 50% majority-rule consensus tree of eight equally-parsimonious trees (length = 166 steps). Tip labels indicate the geographic location(s) from which a termite with a given DNA sequence haplotype was sampled (Figure 2; Table S1). Numbers above nodes are bootstrap support values. Open circles on nodes mark the most inclusive well-support clades that contain only one reference taxon (the same groups were recovered using Maximum Likelihood; Figure S1).
Insects 06 00524 g002
Comparison of PCR-RFLP versus phylogenetic species identification showed that the original interpretive framework (Table S4) had very low type I error, as no false positives were generated. However, for R. flavipes, type II error (defined here as uncertain species identification) was 19.6%. As noted above, this was due to either an unexpected three-enzyme combination of otherwise predicted banding patterns, or the unexpected absence of a single-enzyme cut site. If we tentatively accept that one R. nelsonae was present in our test panel of Southern Appalachian samples, then for that taxon, the assay would be considered to have a type II error of 100% given that this specimen had an ambiguous PCR-RFLP species assignment.
In light of the new mtCOII sequence data contained within our test panel, we refined the interpretive framework associated PCR-RFLP banding patterns so as to accommodate previously unreported DNA sequence polymorphisms. These modifications entailed expanding the suite of expected banding patterns for one restriction enzyme for two taxa (i.e., Taq I for R. flavipes, and Msp I for R. nelsonae). As a result, all known type II error was eliminated. The refined interpretive framework is presented in Table 1.
Table 1. Refined interpretive framework for identifying eastern United States Reticulitermes species using PCR-RFLP, applied to the mtCOII gene. Expected fragment sizes produced by three restriction digests (performed one-at-a-time) for each of five taxa are represented by check marks. While ≥2 banding patterns are possible for a given restriction enzyme in some taxa, all three-enzyme combinations are species-specific.
Restriction EnzymeFragmentSpecies
Sizes (bp)R. flavipesR. hageniR. malleteiR. nelsonaeR. virginicus
Rsa I175, 201
48, 127, 201
86, 115, 175
Taq I376
153, 223
183, 193
67, 126, 183
30, 67, 126, 153
Msp I376
37, 339 *
77, 299
37, 40, 299
* For R. flavipes, fragment sizes may instead be 38-bp and 338-bp, but since the 1-bp differences compared to those reported in the table are indistinguishable, only the shorter fragments are listed.

4. Discussion

We developed a cost- and time-efficient three-enzyme PCR-RFLP assay that successfully identifies four of the five co-occurring species of eastern United States Reticulitermes (R. hageni was absent from the test panel, and thus accuracy could not be fully assessed; Table 1). This represents an advance on previous work, in part owing to: (1) our ability to leverage what is now a large body of publically available mtDNA sequence data, (2) our approach of deliberately separating two phases of the design process (training data vs. test data), and (3) the inclusion of recently described species (R. nelsonae).
Recent entomological applications of PCR-RFLP to resolving known mtDNA polymorphisms that aid in species identification have focused on the mtCOI gene (e.g., Coleoptera [29], Hemiptera [30], Hymenoptera [31], and Lepidoptera [32]). For Reticulitermes termites, however, there is currently a far greater representation of mtCOII sequences in public databases. Also, based on data from Cameron and Whiting’s [33] comparison of complete mitochondrial genomes from R. flavipes and R. virginicus, net sequence divergence (i.e., interspecific differences minus intraspecific differences) is greater for mtCOII than for mtCOI (mean of 6.15% versus 5.76%). Thus, the mtCOII gene should be efficient for species identification in this group.
When PCR-RFLP is used for mtDNA-based species identification in insect groups, studies often identify species-specific SNPs (i.e., fixed nucleotide differences between taxa), which simplify interpretation of PCR-RFLP banding patterns. Notwithstanding the utility of mtCOII for Reticulitermes species identification [3], intraspecific polymorphism was still quite high. For example, the R. flavipes consensus sequence (i.e., based on 99 accessions in the GenBank database; Table S3) contained 111 variables sites (17% of the 658-bp alignment). Previous studies have also reported that Reticulitermes mtDNA exhibits high polymorphism. For example, Luchetti et al. [34] suggested that the mtCOII substitution rate may far exceed Brower’s [35] standard arthropod rate for cytochrome oxidase genes of ~2.3% sequence divergence between a pair of lineages per million years. Subsequently, Cameron and Whiting [33] extended findings of high substitution rates to the entire mtDNA genome of Reticulitermes. The main consequence for PCR-RFLP assay design is that, in this group, species-specific SNPs may be uncommon. However, this can be overcome by focusing instead on DNA sequence haplotypes (i.e., a series of physically linked SNPs).
The present study benefited from a large public database of Reticulitermes mtCOII sequences. Nonetheless, additional intraspecific variation was discovered in Southern Appalachian termite samples. Based on the initial interpretive framework (Table S4), the proportion of ambiguous species assignments serves as a measure of the extent to which polymorphism in the 376-bp mtCOII fragment, as it exists in natural populations, was not represented in the public DNA sequence database. Somewhat surprisingly, this type II error was quite pronounced for R. flavipes, despite the species being represented by 99 GenBank accessions spanning a geographic area encompassing >10 states. An earlier study by Szalanski et al. [3] focused on molecular diagnostics of Reticulitermes species using PCR-RFLP and included some of the same species in our set (i.e., R. flavipes, R. hageni, and R. virginicus), but was designed on a much smaller subset of sequences (n = 15 vs. n = 120 in the present study, considering only the shared species). Accordingly, advances provided by the PCR-RFLP assay reported here is warrants consideration.
The Szalanski et al. [3] PCR-RFLP assay was based on two mtDNA genes (COII and 16SrRNA) amplified individually, each digested with two different restriction enzymes. For comparative purposes, we focused on mtCOII and performed an in silico application of their assay to our consensus sequences for R. flavipes, R. hageni, and R. virginicus (Table S3, but with the alignment trimmed to 379-bp, and digested with Hinf I and Taq I). We found that identification of R. flavipes may be more problematic than the authors originally anticipated. For example, owing to previously unappreciated polymorphism at two Hinf I recognition sites (their positions 97 and 184), R. flavipes would generate the same mtCOII banding patterns as R. hageni and R. virginicus. Similarly, R. flavipes would be indistinguishable from the other two species due to polymorphism at a Taq I recognition site (their position 292). However, because Szalanski et al.’s [3] assay included a second gene, their assay would mostly likely lead to an ambiguous species assignment (cf. misidentification). Similar issues are likely to affect many PCR-RFLP assays, given the common underlying assumption that all extant polymorphism has been fully characterized. As this will almost never be true, we recommend sequencing of a subset of specimens coupled with phylogenetic comparison to reference specimens, even if PCR-RFLP species identification appears unambiguous. From an applied perspective, this could be focused on specimens from areas where previous sampling has been sparse (i.e., outside of the Southern Appalachians, and/or those that are poorly represented in GenBank), or wherever two or more Reticulitermes species are suspected to be sympatric.
The PCR-RFLP assay presented here provides a useful tool for studies of Reticulitermes species in the eastern United States. For example, phylogeographic investigations of spatial patterns of genetic diversity rely on dense sampling of individuals over a relatively broad geographic area [36,37], but a fundamental prerequisite is that only conspecifics are included in downstream analyses. In this respect, Reticulitermes termites have been challenging study organisms. However, once species identifications can be readily achieved, dead-wood associated forest invertebrates may be particularly good models for understanding organismal responses to past landscape-level environmental change [16,38,39,40], and for identifying montane biodiversity habitat refuges [41]. Previous mtDNA-based surveys of R. flavipes from parts of the eastern United States have revealed interesting phylogeographic patterns that demand further investigation [42,43]. Our PCR-RFLP assay should facilitate extensions of that work.
Wood-feeding insects such as Reticulitermes termites make important contributions to decomposition and nutrient cycling processes in forests [1], yet these ecosystem service providers have poorly known species distributions [35]. The new PCR-RFLP assay will help to redress this. For example, our sampling in the Southern Appalachian Mountains and surrounding areas appears to have extended the known range of R. nelsonae. Previously, this species was known only from Georgia, North Carolina, and Florida [2]. Assuming that our phylogenetic identification of this species is accurate (Figure 2; Figure S1), it appears that R. nelsonae also occurs in Alabama (Talladega National Forest, site 50; Figure 1; Table S1). When additional occurrence data have been accumulated, that information could be coupled with remote sensing or other environmental data to generate species distribution models [44] or to quantify degree of niche overlap [45]. Thus, the new PCR-RFLP assay could also help determine whether the five Reticulitermes species are ecologically differentiated.

5. Conclusions

Reticulitermes termites are functionally important ecosystem engineers. The new molecular diagnostic tool for identification of eastern United States Reticulitermes species facilitates new lines of investigation by providing a means by which to rapidly classify “unknown” samples prior to downstream analyses. The PCR-RFLP assay can be implemented without specialist equipment or expertise, and is cost-efficient. As public DNA sequence databases continue to be populated with new data from Reticulitermes species, periodic re-evaluation and refinement may be necessary. For now, however, the PCR-RFLP assay reported here should be broadly useful.

Supplementary Files

Supplementary File 1

Acknowledgments

This project was funded by an American Philosophical Society Franklin research grant, a Conservation and Research Foundation grant, and a University of Mississippi College of Liberal Arts Summer Research grant and start-up funds to Ryan C. Garrick. Scientific collection permits were provided to Ryan C. Garrick by the Alabama Department of Conservation and Natural Resources (Talladega National Forest), Georgia Department of Natural Resources (John’s Mountain Wildlife Management Area; permit # 29-WBH-12-16), Mississippi Department of Wildlife, Fisheries and Parks (Tishomingo State Park), United States Department of Agriculture Forest Service (Talladega National Forest, William B. Bankhead National Forest, Chattahoochee-Oconee National Forest, and Monongahela National Forest), and United States National Park Service (Great Smoky Mountains National Park, permit # GRSM-2012-SCI-2242, and Shenandoah National Park, permit # SHEN-2012-SCI-0015). R.E. Symula and E.W. Collier assisted with some fieldwork, B.P. Noonan provided access to lab space during the initial phase of this project, and DNA sequencing was performed by Yale University’s DNA Analysis Facility on Science Hill.

Author Contributions

Ryan C. Garrick designed the study, contributed to fieldwork and molecular work, performed analyses and drafted the paper. Benjamin D. Collins and Rachel N. Yi contributed to molecular work. Rodney J. Dyer contributed to fieldwork, and Chaz Hyseni contributed to molecular and fieldwork. All authors read and approved the final manuscript.

Conflicts of Interest

The authors declare no conflict of interest.

References

  1. Ulyshen, M.D. Interacting effects of insects and flooding on wood decomposition. PLoS ONE 2014, 9, e101867. [Google Scholar] [CrossRef] [PubMed]
  2. Lim, S.Y.; Forschler, B.T. Reticulitermes nelsonae, a new species of subterranean termite (Rhinotermitidae) from the southeastern United States. Insects 2012, 3, 62–90. [Google Scholar] [CrossRef]
  3. Szalanski, A.L.; Austin, J.W.; Owens, C.B. Identification of Reticulitermes spp. (Isoptera: Reticulitermatidae) from south central United States by PCR-RFLP. J. Econ. Entomol. 2003, 96, 1514–1519. [Google Scholar] [CrossRef] [PubMed]
  4. Vargo, E.L. Hierarchical analysis of colony and population genetic structure of the eastern subterranean termite, Reticulitermes flavipes, using two classes of molecular markers. Evolution 2003, 57, 2805–2818. [Google Scholar] [CrossRef] [PubMed]
  5. Vargo, E.L.; Husseneder, C. Biology of subterranean termites: Insights from molecular studies of Reticulitermes and Coptotermes. Annu. Rev. Entomol. 2009, 54, 379–403. [Google Scholar] [CrossRef] [PubMed]
  6. Hogg, I.D.; Hebert, P.D.N. Biological identification of springtails (Hexapoda: Collembola) from the Canadian Arctic, using mitochondrial DNA barcodes. Can. J. Zool. 2004, 82, 749–754. [Google Scholar] [CrossRef]
  7. Hajibabaei, M.; Janzen, D.H.; Burns, J.M.; Hallwachs, W.; Hebert, P.D.N. DNA barcodes distinguish species of tropical Lepidoptera. Proc. Natl. Acad. Sci. USA 2006, 103, 968–971. [Google Scholar] [CrossRef] [PubMed]
  8. Sheffield, C.S.; Hebert, P.D.; Kevan, P.G.; Packer, L. DNA barcoding a regional bee (Hymenoptera: Apoidea) fauna and its potential for ecological studies. Mol. Ecol. Resour. 2009, 9, 196–207. [Google Scholar] [CrossRef] [PubMed]
  9. Avise, J.C.; Arnold, J.; Ball, R.M.; Bermingham, E.; Lamb, T.; Neigel, J.E.; Reeb, C.A.; Saunders, N.C. Intraspecific phylogeography: The mitochondrial DNA bridge between population genetics and systematics. Annu. Rev. Ecol. Syst. 1987, 18, 489–522. [Google Scholar] [CrossRef]
  10. Folmer, O.; Black, M.; Hoeh, W.; Lutz, R.; Vrijenhoek, R. DNA primers for amplification of mitochondrial cytochrome c oxidase subunit I from diverse metazoan invertebrates. Mol. Mar. Biol. Biotechnol. 1994, 3, 294–299. [Google Scholar] [PubMed]
  11. Simon, C.; Frati, F.; Beckenbach, A.; Crespi, B.; Liu, H.; Flook, P. Evolution, weighting, and phylogenetic utility of mitochondrial gene sequences and a compilation of conserved polymerase chain reaction primers. Ann. Entomol. Soc. Am. 1994, 87, 651–701. [Google Scholar] [CrossRef]
  12. Baker, C.S.; Cipriano, F.; Palumbi, S.R. Molecular genetic identification of whale and dolphin products from commercial markets in Korea and Japan. Mol. Ecol. 1996, 5, 671–685. [Google Scholar] [CrossRef]
  13. Hebert, P.D.N.; Cywinska, A.; Ball, S.L.; deWaard, J.R. Biological identifications through DNA barcodes. Proc. R. Soc. Lond. B Biol. Sci. 2003, 270, 313–321. [Google Scholar] [CrossRef] [PubMed]
  14. Jarman, S.N.; Deagle, B.E.; Gales, N.J. Group-specific polymerase chain reaction for DNA-based analysis of species diversity and identity in dietary samples. Mol. Ecol. 2004, 13, 1313–1322. [Google Scholar] [CrossRef] [PubMed]
  15. Garrick, R.C.; Meadows, C.A.; Nicolas, A.N.; Nason, J.D.; Dyer, R.J. A set of polymorphic nuclear intron markers for conservation genetics and phylogeography of Euphorbia species (Pedilanthus clade). Conserv. Genet. 2008, 9, 1673–1676. [Google Scholar] [CrossRef]
  16. Garrick, R.C.; Rowell, D.M.; Simmons, C.S.; Hillis, D.M.; Sunnucks, P. Fine-scale phylogeographic congruence despite demographic incongruence in two low-mobility saproxylic springtails. Evolution 2008, 62, 1103–1118. [Google Scholar] [CrossRef] [PubMed]
  17. Garrick, R.C.; Meadows, C.A.; Nason, J.D.; Cognato, A.I.; Dyer, R.J. Variable nuclear markers for a Sonoran Desert bark beetle, Araptus attenuatus Wood (Curculionidae: Scolytinae), with applications to related genera. Conserv. Genet. 2009, 10, 1177–1179. [Google Scholar] [CrossRef]
  18. Garrick, R.C.; Nason, J.D.; Fernández-Manjarrés, J.F.; Dyer, R.J. Ecological coassociations influence species’ responses to past climatic change: An example from a Sonoran Desert bark beetle. Mol. Ecol. 2013, 22, 3345–3361. [Google Scholar] [CrossRef] [PubMed]
  19. Lancaster, M.L.; Gemmell, N.J.; Negro, S.; Goldsworthy, S.; Sunnucks, P. Ménage à trois on Macquarie Island: Hybridization among three species of fur seal (Arctocephalus spp.) following historical population extinction. Mol. Ecol. 2006, 15, 3681–3692. [Google Scholar] [CrossRef] [PubMed]
  20. Wang, C.; Zhou, X.; Li, S.; Schwinghammer, M.; Scharf, M.E.; Buczkowski, G.; Bennett, G.W. Survey and identification of termites (Isoptera: Rhinotermitidae) in Indiana. Ann. Entomol. Soc. Am. 2009, 102, 1029–1036. [Google Scholar] [CrossRef]
  21. Tamura, K.; Stecher, G.; Peterson, D.; Filipski, A.; Kumar, S. MEGA6: Molecular Evolutionary Genetics Analysis version 6.0. Mol. Biol. Evol. 2013, 30, 2725–2729. [Google Scholar] [CrossRef] [PubMed]
  22. Vincze, T.; Posfai, J.; Roberts, R.J. NEBcutter: A program to cleave DNA with restriction enzymes. Nucleic Acids Res. 2003, 31, 3688–3691. [Google Scholar] [CrossRef] [PubMed]
  23. Park, Y.C.; Maekawa, K.; Matsumoto, T.; Santoni, R.; Choe, J.C. Molecular phylogeny and biogeography of the Korean woodroaches Cryptocercus spp. Mol. Phylogenetics Evol. 2004, 30, 450–464. [Google Scholar] [CrossRef]
  24. Kearse, M.; Moir, R.; Wilson, A.; Stones-Havas, S.; Cheung, M.; Sturrock, S.; Buxton, S.; Cooper, A.; Markowitz, S.; Duran, C.; et al. Geneious Basic: An integrated and extendable desktop software platform for the organization and analysis of sequence data. Bioinformatics 2012, 28, 1647–1649. [Google Scholar] [CrossRef] [PubMed]
  25. Sunnucks, P.; Hales, D.F. Numerous transposed sequences of mitochondrial cytochrome oxidase I–II in aphids of the genus Sitobion (Hemiptera: Aphididae). Mol. Biol. Evol. 1996, 13, 510–524. [Google Scholar] [CrossRef] [PubMed]
  26. Altschul, S.F.; Gish, W.; Miller, W.; Myers, E.W.; Lipman, D.J. Basic local alignment search tool. J. Mol. Biol. 1990, 215, 403–410. [Google Scholar] [CrossRef]
  27. Darriba, D.; Taboada, G.L.; Doallo, R.; Posada, D. jModelTest 2: More models, new heuristics and parallel computing. Nat. Methods 2012, 9, 772. [Google Scholar] [CrossRef] [PubMed]
  28. Hillis, D.M.; Bull, J.J. An empirical test of bootstrapping as a method for assessing confidence in phylogenetic analysis. Syst. Biol. 1993, 42, 182–192. [Google Scholar] [CrossRef]
  29. Germain, J.-F.; Chatot, C.; Meusnier, I.; Artige, E.; Rasplus, J.-Y.; Cruaud, A. Molecular identification of Epitrix potato flea beetles (Coleoptera: Chrysomelidae) in Europe and North America. Bull. Entomol. Res. 2013, 103, 354–362. [Google Scholar] [CrossRef] [PubMed]
  30. Ovalle, T.M.; Parsa, S.; Hernández, M.P.; Becerra Lopez-Lavalle, L.A. Reliable molecular identification of nine tropical whitefly species. Ecol. Evol. 2014, 4, 3778–3787. [Google Scholar] [CrossRef] [PubMed]
  31. Vesterlund, S.-R.; Sorvari, J.; Vasemägi, A. Molecular identification of cryptic bumblebee species from degraded samples using PCR-RFLP approach. Mol. Ecol. Resour. 2014, 14, 122–126. [Google Scholar] [CrossRef] [PubMed]
  32. Arimoto, M.; Iwaizumi, R. Identification of Japanese Lymantria species (Lepidoptera: Lymantriidae) based on PCR-RFLP analysis of mitochondrial DNA. Appl. Entomol. Zool. 2014, 49, 159–169. [Google Scholar] [CrossRef]
  33. Cameron, S.L.; Whiting, M.F. Mitochondrial genomic comparisons of the subterranean termites from the Genus Reticulitermes (Insecta: Isoptera: Rhinotermitidae). Genome 2007, 50, 188–202. [Google Scholar] [PubMed]
  34. Luchetti, A.; Mantovani, B.; Marini, M. Mitochondrial evolutionary rate and speciation in termites: Data on European Reticulitermes taxa (Isoptera: Rhinotermitidae). Insectes Soc. 2005, 52, 218–221. [Google Scholar] [CrossRef]
  35. Brower, A.V.Z. Rapid morphological radiation and convergence among races of the butterfly Heliconius erato inferred from patterns of mitochondrial DNA evolution. Proc. Natl. Acad. Sci. USA 1994, 91, 6491–6495. [Google Scholar] [CrossRef] [PubMed]
  36. Garrick, R.C.; Caccone, A.; Sunnucks, P. Inference of population history by coupling exploratory and model-driven phylogeographic analyses. Int. J. Mol. Sci. 2010, 11, 1190–1227. [Google Scholar] [CrossRef] [PubMed]
  37. Garrick, R.C.; Bonatelli, I.A.; Hyseni, C.; Morales, A.; Pelletier, T.A.; Perez, M.F.; Rice, E.; Satler, J.D.; Symula, R.E.; Thomé, M.T.; et al. The evolution of phylogeographic data sets. Mol. Ecol. 2015, 24, 1164–1171. [Google Scholar] [CrossRef] [PubMed]
  38. Sunnucks, P.; Blacket, M.J.; Taylor, J.M.; Sands, C.J.; Ciavaglia, S.A.; Garrick, R.C.; Tait, N.N.; Rowell, D.M.; Pavlova, A. A tale of two flatties: Different responses of two terrestrial flatworms to past environmental climatic fluctuations at Tallaganda in montane southeastern Australia. Mol. Ecol. 2006, 15, 4513–4531. [Google Scholar] [CrossRef] [PubMed]
  39. Garrick, R.C.; Rowell, D.M.; Sunnucks, P. Phylogeography of saproxylic and forest floor invertebrates from Tallaganda, south-eastern Australia. Insects 2012, 3, 270–294. [Google Scholar] [CrossRef]
  40. Bull, J.K.; Sands, C.J.; Garrick, R.C.; Gardner, M.G.; Tait, N.N.; Briscoe, D.A.; Rowell, D.M.; Sunnucks, P. Environmental complexity and biodiversity: The multi-layered evolutionary history of a log-dwelling velvet worm in montane temperate Australia. PLoS ONE 2013, 8, e84559. [Google Scholar] [CrossRef] [PubMed] [Green Version]
  41. Garrick, R.C. Montane refuges and topographic complexity generate and maintain invertebrate biodiversity: Recurring themes across space and time. J. Insect Conserv. 2011, 15, 469–478. [Google Scholar] [CrossRef]
  42. Szalanski, A.L.; Austin, J.W.; McKern, J.A.; Scheffrahn, R.H.; Owens, C.B.; Messenger, M.T. Molecular phylogeography of Reticulitermes (Isoptera: Rhinotermitidae) termites from Florida. Sociobiology 2008, 52, 619–632. [Google Scholar]
  43. Perdereau, E.; Bagnères, A.-G.; Bankhead-Dronnet, S.; Dupont, S.; Zimmermann, M.; Vargo, E.L.; Dedeine, F. Global genetic analysis reveals the putative native source of the invasive termite, Reticulitermes flavipes, in France. Mol. Ecol. 2013, 22, 1105–1119. [Google Scholar] [CrossRef] [PubMed]
  44. Elith, J.; Leathwick, J.R. Species distribution models: Ecological explanation and prediction across space and time. Annu. Rev. Ecol. Evol. Syst. 2009, 40, 677–697. [Google Scholar] [CrossRef]
  45. Edwards, D.L.; Garrick, R.C.; Tapia, W.; Caccone, A. Cryptic structure and niche divergence within threatened Galápagos giant tortoises from southern Isabela Island. Conserv. Genet. 2014, 15, 1357–1369. [Google Scholar] [CrossRef]

