Article

Integrative Taxonomy Clarifies the Taxonomic Status of the Morphologically Intermediate Form Between Tropidothorax cruciger and T. sinensis (Hemiptera: Lygaeidae)


1
School of Public Health, North China University of Science and Technology, Tangshan 063210, China
2
Institute of Entomology, College of Life Sciences, Nankai University, 94 Weijin Road, Tianjin 300071, China
3
Department of Neuroscience, Faculty of Life Sciences, University College London, London WC1H 0AP, UK
*
Authors to whom correspondence should be addressed.
These authors contributed equally to this work.
Insects 2026, 17(1), 37; https://doi.org/10.3390/insects17010037
Submission received: 19 November 2025 / Revised: 24 December 2025 / Accepted: 25 December 2025 / Published: 26 December 2025
(This article belongs to the Section Insect Systematics, Phylogeny and Evolution)

Simple Summary

The presence of the “intermediate form” between Tropidothorax cruciger and T. sinensis has complicated the identification of these two species. In this study, we performed an integrative taxonomy combining morphological features with molecular and ecological data. The taxonomic status of the “intermediate form” and the species boundaries between T. cruciger and T. sinensis were clarified. The “intermediate form” should be recognized as a morphological variant of T. cruciger. A clear barcode gap was found between interspecific and intraspecific genetic distances of T. cruciger and T. sinensis. Our study provides a robust framework for the accurate delimitation of these two species.

Abstract

(1) Background: The identification of Tropidothorax cruciger and T. sinensis is often complicated by the presence of the “intermediate form”. Due to the lack of molecular data, the taxonomic status of the “intermediate form” and the species boundaries between T. cruciger and T. sinensis remain uncertain; (2) Methods: In this study, we integrated morphological, molecular, and ecological data to delimit species boundaries of these two species using multiple species delimitation approaches; (3) Results: Most species delimitation analyses based on the cytochrome c oxidase subunit I (COI) fragment suggested that T. cruciger and the “intermediate form” comprised a single species, with T. sinensis representing a separate species. This delimitation result was also supported by the analyses of BFD* and genetic clustering based on genome-wide SNPs. Under this species delimitation scenario, a clear-cut barcode gap was discovered between the interspecific and intraspecific genetic distances. In addition, environmental-related analyses showed highly similar ecological requirements of T. cruciger and the “intermediate form”, supporting their recognition as a single species; (4) Conclusions: This study clarifies the taxonomic status of the “intermediate form” and the species boundaries between T. cruciger and T. sinensis, which is essential for further studies of ecology and evolution of these species.

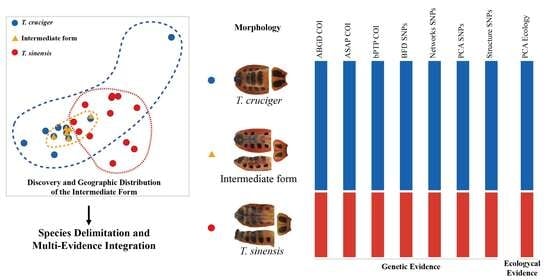
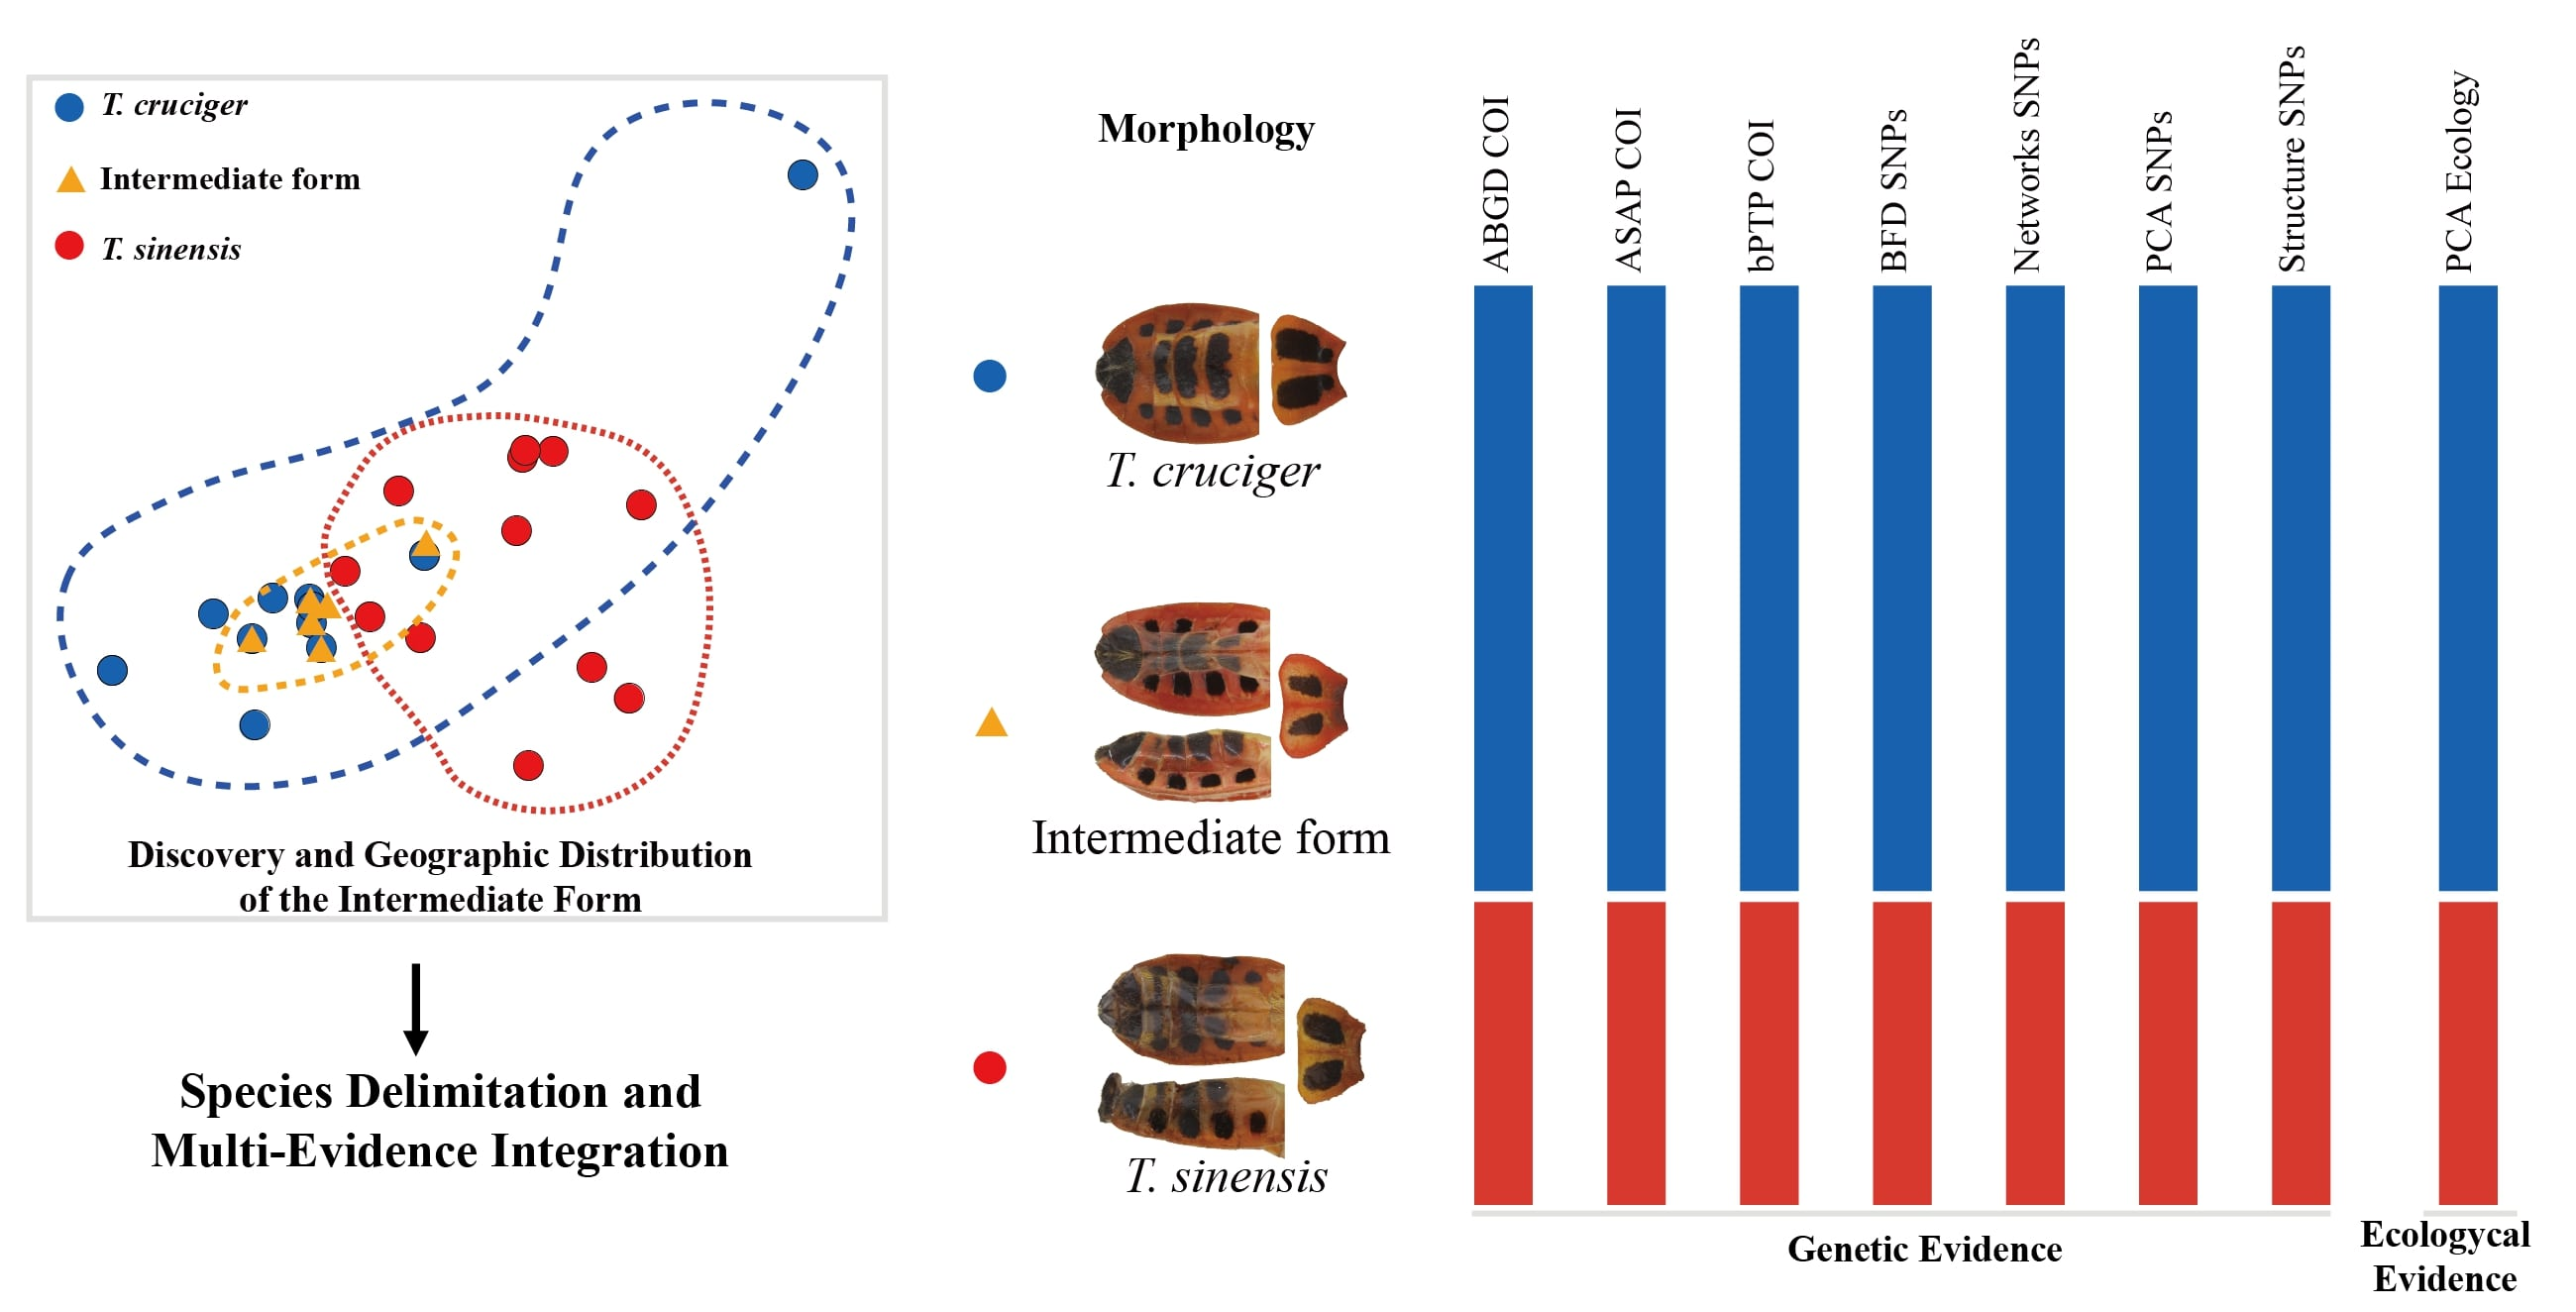
Graphical Abstract

1. Introduction

Species are the fundamental biological units, and the accurate delimitation of species is the primary step in the study of biodiversity, systematics and evolution [1,2,3]. Morphology-based taxonomy classifies species based on external morphological features or reproductive structures, which is the cornerstone of taxonomic science [4,5]. However, morphology-based taxonomy often faces challenges in accurately delimiting species boundaries for closely related species with similar appearances [6,7,8,9]. Moreover, in groups with high intraspecific variation, relying solely on morphological traits may lead to the over-splitting of species [10,11]. In such cases, advanced molecular techniques and modern tools can be very helpful. By analyzing DNA sequence variation, molecular-based species delimitation approaches can provide preliminary taxonomic hypotheses and compensate for the limitations of traditional morphology-based taxonomy [12,13,14,15]. In recent years, the employment of molecular-based delimitation methods has been increasingly recognized as an essential tool in taxonomy and systematics and has played a significant role in clarifying species boundaries, especially in groups characterized by high levels of intraspecific variation [16,17,18,19,20,21,22].
The most commonly used molecular markers include the mitochondrial genes, nuclear gene fragments, and genome-wide single-nucleotide polymorphisms (SNPs) [23,24,25]. Mitochondrial genes, specifically the COI gene fragment used as the standard animal DNA barcode, are known to be powerful molecular markers for delimiting species boundaries. The single-locus barcoding approach serves as a valuable tool for the preliminary delimitation of species boundaries in poorly known taxa, and as a key supplement to traditional morphology-based taxonomy in morphologically conserved taxa [26,27,28]. Recently, next-generation sequencing technologies have enabled the generation of vast amounts of genetic data—such as thousands of genome-wide SNPs—greatly enhancing the study of insect systematics [29]. Due to the abundance of genetic information, genome-wide SNPs have been widely employed to infer phylogenetic relationships and to delimit species among closely related taxa [30,31,32]. Double-digest restriction site-associated DNA sequencing (ddRAD-seq), which combines enzymatic fragmentation of genomic DNA with high-throughput sequencing, is a commonly used technique to generate a large number of genome-wide SNPs in non-model taxa [33]. This approach has proven effective for delimiting species boundaries among closely related species [21,34,35].
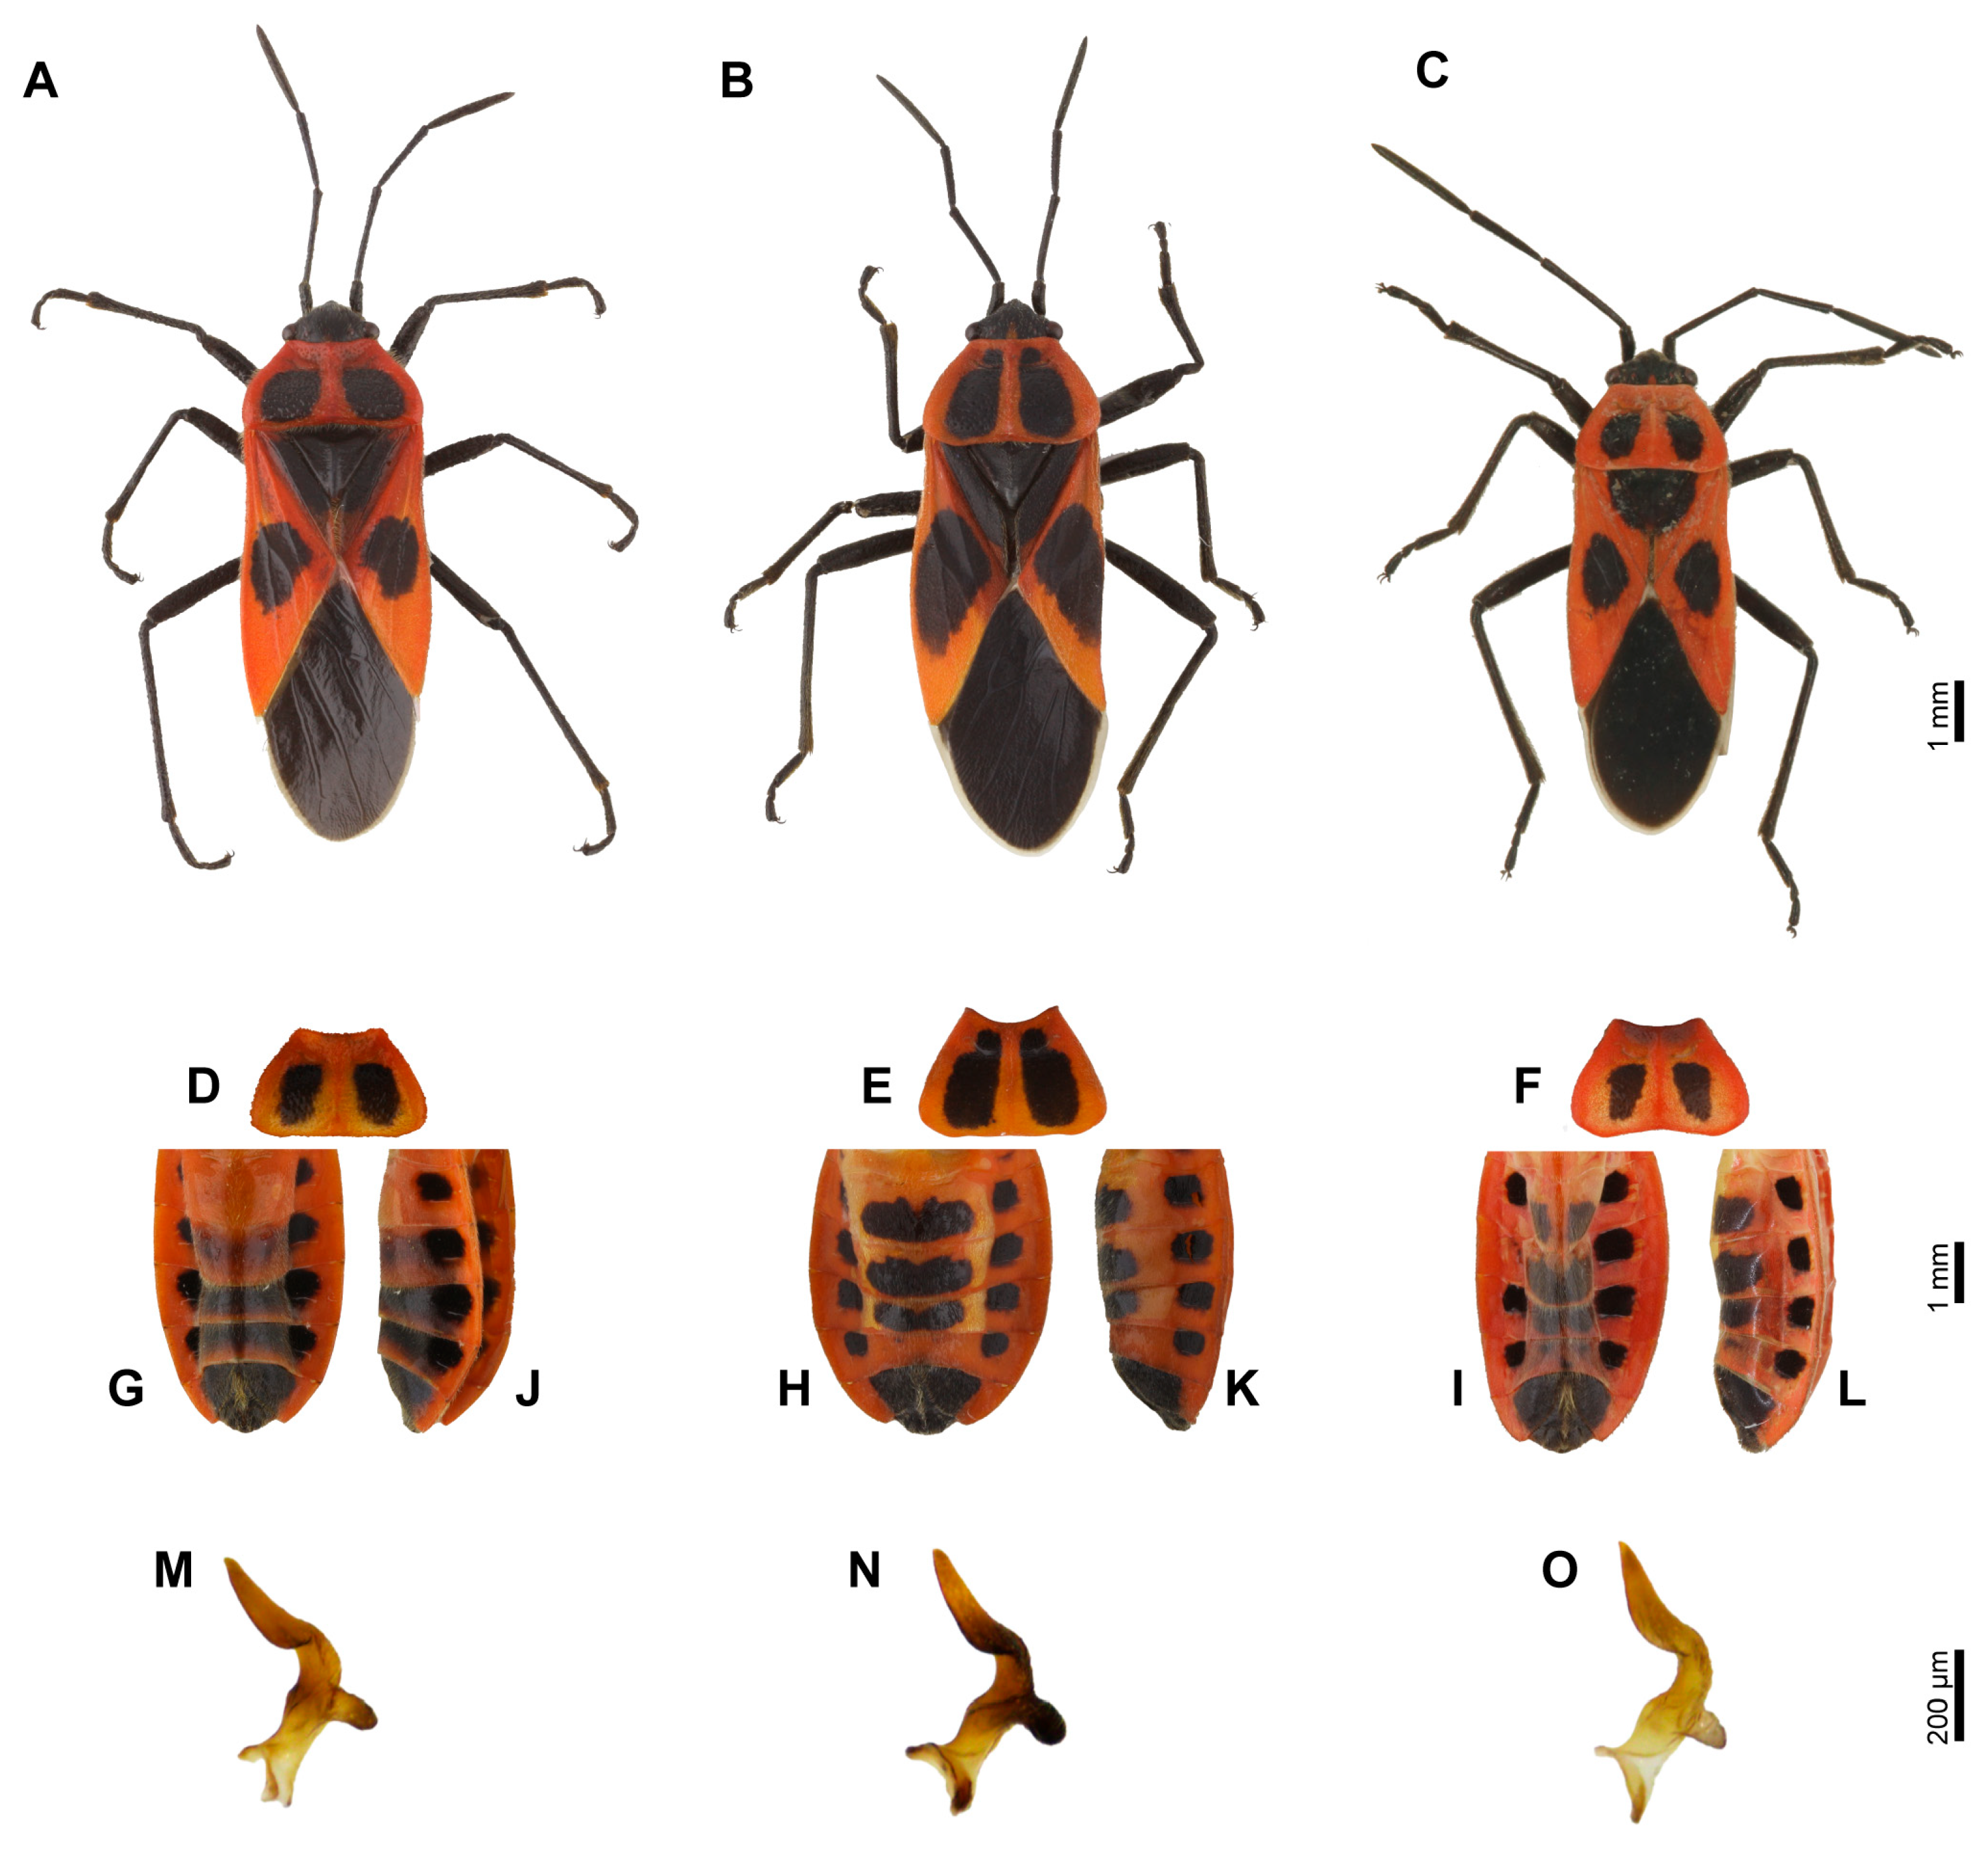
The genus Tropidothorax Bergroth, 1894 is mainly distributed in the Oriental region, with a total of 11 recorded species [36]. Among them, Tropidothorax cruciger (Motschulsky, 1860) and Tropidothorax sinensis (Reuter, 1888) are similar in morphology [37,38]. They can be distinguished based on the dark pattern on the pronotum and coriaceous part of hemelytra and the separation between the central black stripe and the lateral black spots on the abdomen [39,40]. However, the identification of these two species is often complicated by the presence of the “intermediate form”, which exhibits ventral characteristics similar to T. cruciger and dorsal characteristics resembling T. sinensis (Figure 1). Based on morphological features alone, individuals of this “intermediate form” cannot be reliably assigned to either T. cruciger or T. sinensis. To date, taxonomic studies of T. sinensis and the “intermediate form” have relied exclusively on morphological data, with no integration of molecular evidence. As a result, the taxonomic status of the “intermediate form” and the species boundaries between T. cruciger and T. sinensis remain unresolved.
In this study, morphological characteristics were used as an initial guide for species identification. We subsequently conducted species delimitation analyses based on both the COI fragment and genome-wide SNPs, in addition to niche comparison. The objectives of this study are (1) to clarify the taxonomic status of the “intermediate form” between T. cruciger and T. sinensis and (2) to delineate precise species boundaries between T. cruciger and T. sinensis.

2. Materials and Methods

2.1. Sampling and DNA Extraction

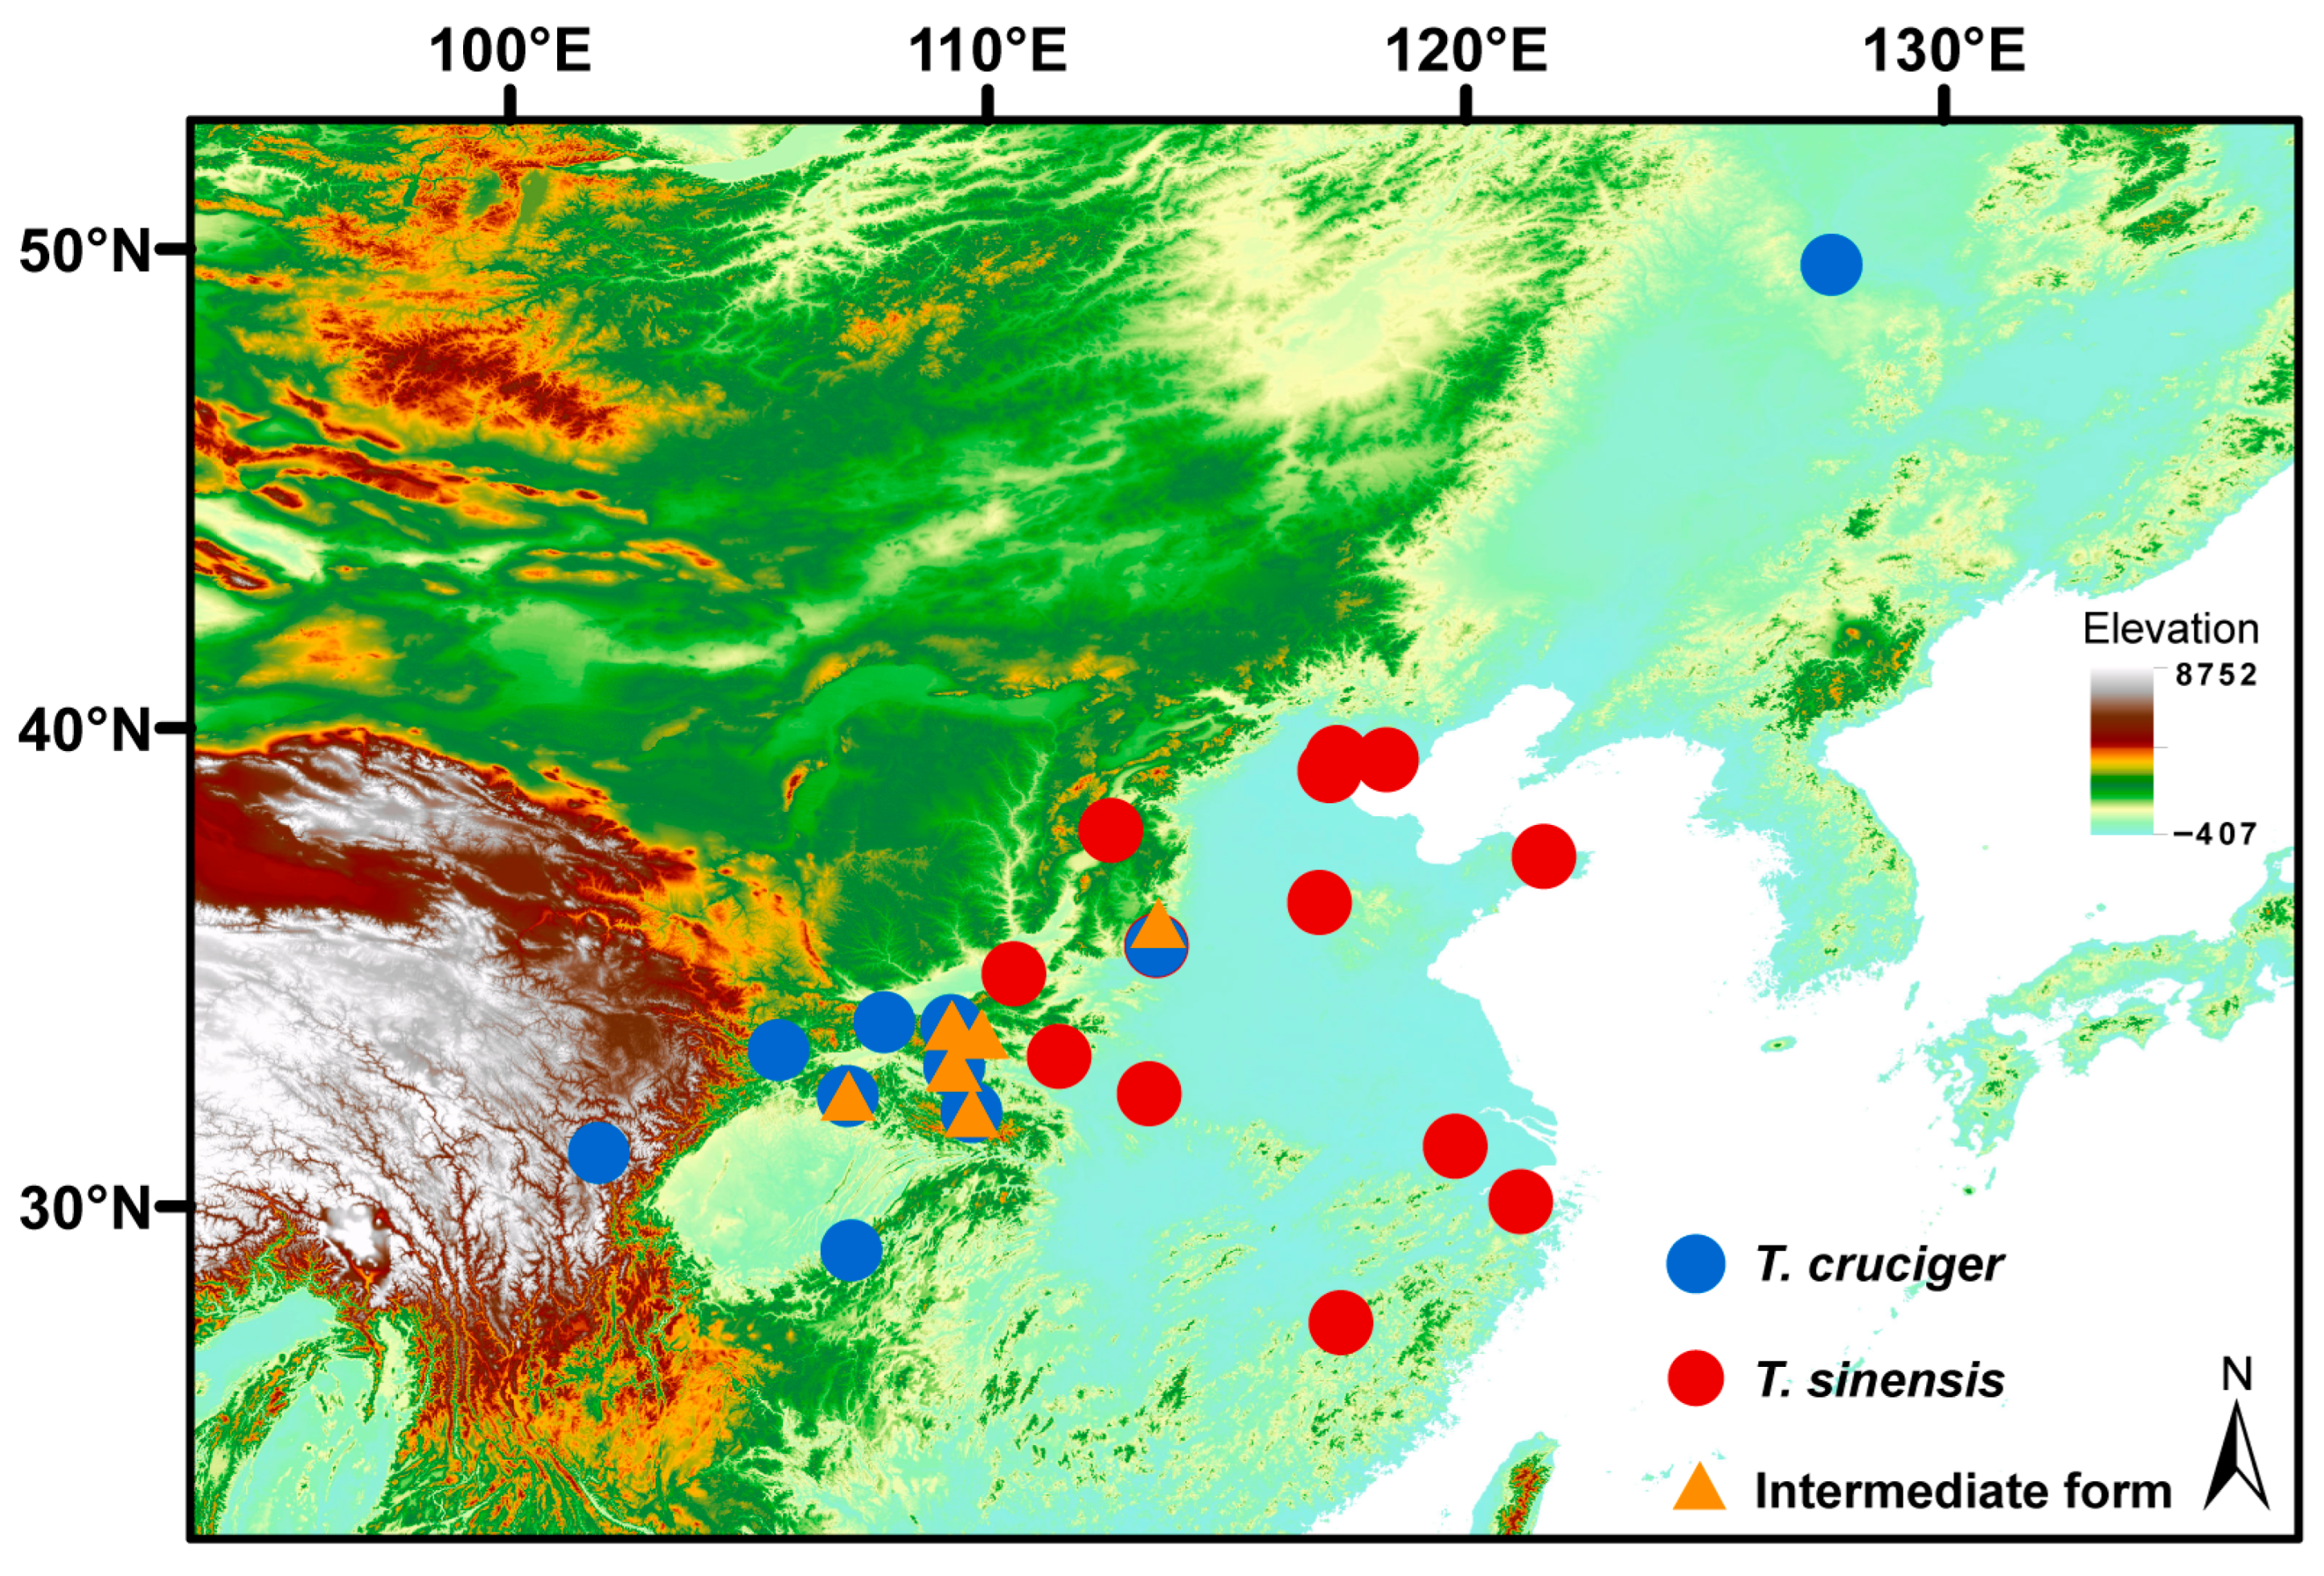
A total of 96 individuals belonging to T. cruciger (35), T. sinensis (41) and the “intermediate form” (20) were collected and analysed in this study (Figure 2, Table S1). Specimens were identified using morphological taxonomic keys [39,40]. All specimens were preserved in 100% ethanol and stored at −20 °C at the Institute of Entomology at Nankai University (Tianjin, China). Total genomic DNA was extracted from the thoracic muscle using a Universal Genomic DNA Kit (CWBIO, Beijing, China). Detailed information of samples and localities is provided in Table S1.

2.2. Acquisition of Molecular Datasets

All samples were sequenced for the COI fragment using the universal primers LCO1490 and HCO2198 [26]. The PCR procedure consisted of an initial denaturation step at 94 °C for 2 min, followed by 33 cycles of 30 s at 94 °C, 30 s at 50 °C, and 45 s at 72 °C. Finally, a final extension was performed at 72 °C for 8 min. PCR products were sequenced using Sanger sequencing at the Beijing Genomics Institute (BGI). Sequences were aligned using the MAFFT algorithm on the EMBL-EBI website (https://www.ebi.ac.uk/jdispatcher/msa/mafft, accessed on 1 November 2023) [41]. Finally, we generated a COI dataset consisting of 645 nucleotide sites obtained from 96 individuals.
A total of 78 samples were selected for ddRAD-seq. The ddRAD libraries were prepared using the protocol described by Peterson et al. (2012) [33] with minor adjustments detailed below. A total of 600 ng of DNA from each sample was double-digested with EcoRI and MspI restriction enzymes. Ligation products were pooled and then purified with AMPure XP Beads. Purified products were amplified with 8–10 cycles using PCR with Illumina indexed primers. Finally, the amplified products were purified and size-selected for fragments between 250 and 600 bp using the Pippin Prep system. Each library was quantified using an Agilent 2100 Bioanalyzer (Agilent, San Jose, California, United States) and sequenced using the Illumina NovaSeq X Plus platform.
Raw reads were demultiplexed and processed using the ipyrad v.0.9.42 pipeline [42]. We used the de novo assembly method with a pair-ddRAD datatype. Bases with Phred scores below 33 were replaced by Ns, and any reads with more than 5 Ns were removed. A clustering threshold of 0.85 was used to identify homologous reads. Five bases were trimmed from the beginning and end of R1 and R2 reads to unify the length of reads. Five bases were also trimmed from the edges of the final aligned loci. The remaining parameters were set to default values. Finally, the dataset was filtered to retain only loci present in at least 90% of individuals, generating a ddRAD SNP dataset with 78 individuals and 52,348 SNPs. To avoid linkage across sites within the same locus, one random SNP was sampled from each locus, and a ddRAD USNP dataset with 78 individuals and 2064 unlinked SNPs was generated.

2.3. Species Delimitation Analyses Based on COI Fragment

We employed four species delimitation methods based on the COI dataset: Automatic Barcode Gap Discovery (ABGD) [43], Assemble Species by Automatic Partitioning (ASAP) [44], Bayesian Poisson Tree Processes (bPTP) [45] and Generalized Mixed Yule Coalescent model (GMYC) [46,47]. ABGD analysis was conducted on the web server (https://bioinfo.mnhn.fr/abi/public/abgd/abgdweb.html, accessed on 6 November 2025) using the Kimura 2-P (K80) distance model and others keep default. ASAP analysis was performed on the web server (https://bioinfo.mnhn.fr/abi/public/asap, accessed on 6 November 2025) with the Kimura 2-P (K80) distance model. A non-ultrametric tree as the input file for the bPTP analysis was reconstructed using IQ-TREE 2.2.0 [48] without an outgroup. Then, bPTP analysis was conducted on the species delimitation web server for bPTP (https://species.h-its.org/ptp/, accessed on 6 November 2025). An ultrametric tree as the input file for GMYC analysis was reconstructed using BEAST 2.6.6 [49] without an outgroup under a Yule model prior and a strict clock model. The Markov chain Monte Carlo (MCMC) chains were run for 1 million generations, sampling every 10,000 generations. Tracer 1.7 [50] was used to assess the convergence of runs. Consensus trees were generated by TreeAnnotator 2.6.6 [49], with a burn-in percentage at 10%. Then, GMYC analysis was performed on the web server (http://species.h-its.org/gmyc/, accessed on 6 November 2025) under a single-threshold method. In addition, intra- and interspecific genetic distances based on the COI dataset were calculated using MEGA X [51] under the Kimura-2-parameter (K2P) nucleotide substitution model.

2.4. Species Delimitation Analyses Based on Genome-Wide SNPs Data

The Bayes Factor Delimitation (BFD*) method [52] implemented in SNAPP [53] and BEAST v2.6.6 [49], based on the ddRAD USNP dataset, was used to compare possible species delimitation hypotheses. A total of three possible species delimitation models were compared based on the marginal likelihood estimate (MLE), and the detailed description for each model is provided in Table S2. The MLE for each model was obtained using a path-sampling analysis with 50 steps, a chain length of 1,000,000 generations and a 10% burn-in. The calculation of Bayes factors (BFs) and ranking of different models followed the guidelines outlined in the BFD* tutorial.
In addition, we employed three methods to infer genetic clustering and admixture. Phylogenetic networks were constructed based on the ddRAD SNP dataset using the neighbour-net method based on pairwise uncorrected p distances among samples, which was implemented in SplitsTree 4.14.5 [54]. Principal component analysis (PCA) was performed using the R package adegenet 2.1.10 [55] based on the ddRAD USNP dataset. Bayesian clustering was performed in STRUCTURE 2.3.4 [56] based on the ddRAD USNP dataset. The program was run under an admixture model with a burn-in of 100,000 generations and a run length of 500,000 generations. K values from 1 to 10 were examined, with ten replicate runs for each K value. The best K value was evaluated using STRUCTURE HARVESTER 0.6.94 [57] with the Delta K method. CLUMPP 1.1.2 [58] was used to summarize runs for each K value. A plot was constructed with DISTRUCT 1.1 [59].

2.5. Principal Component Analysis of Environmental Variables

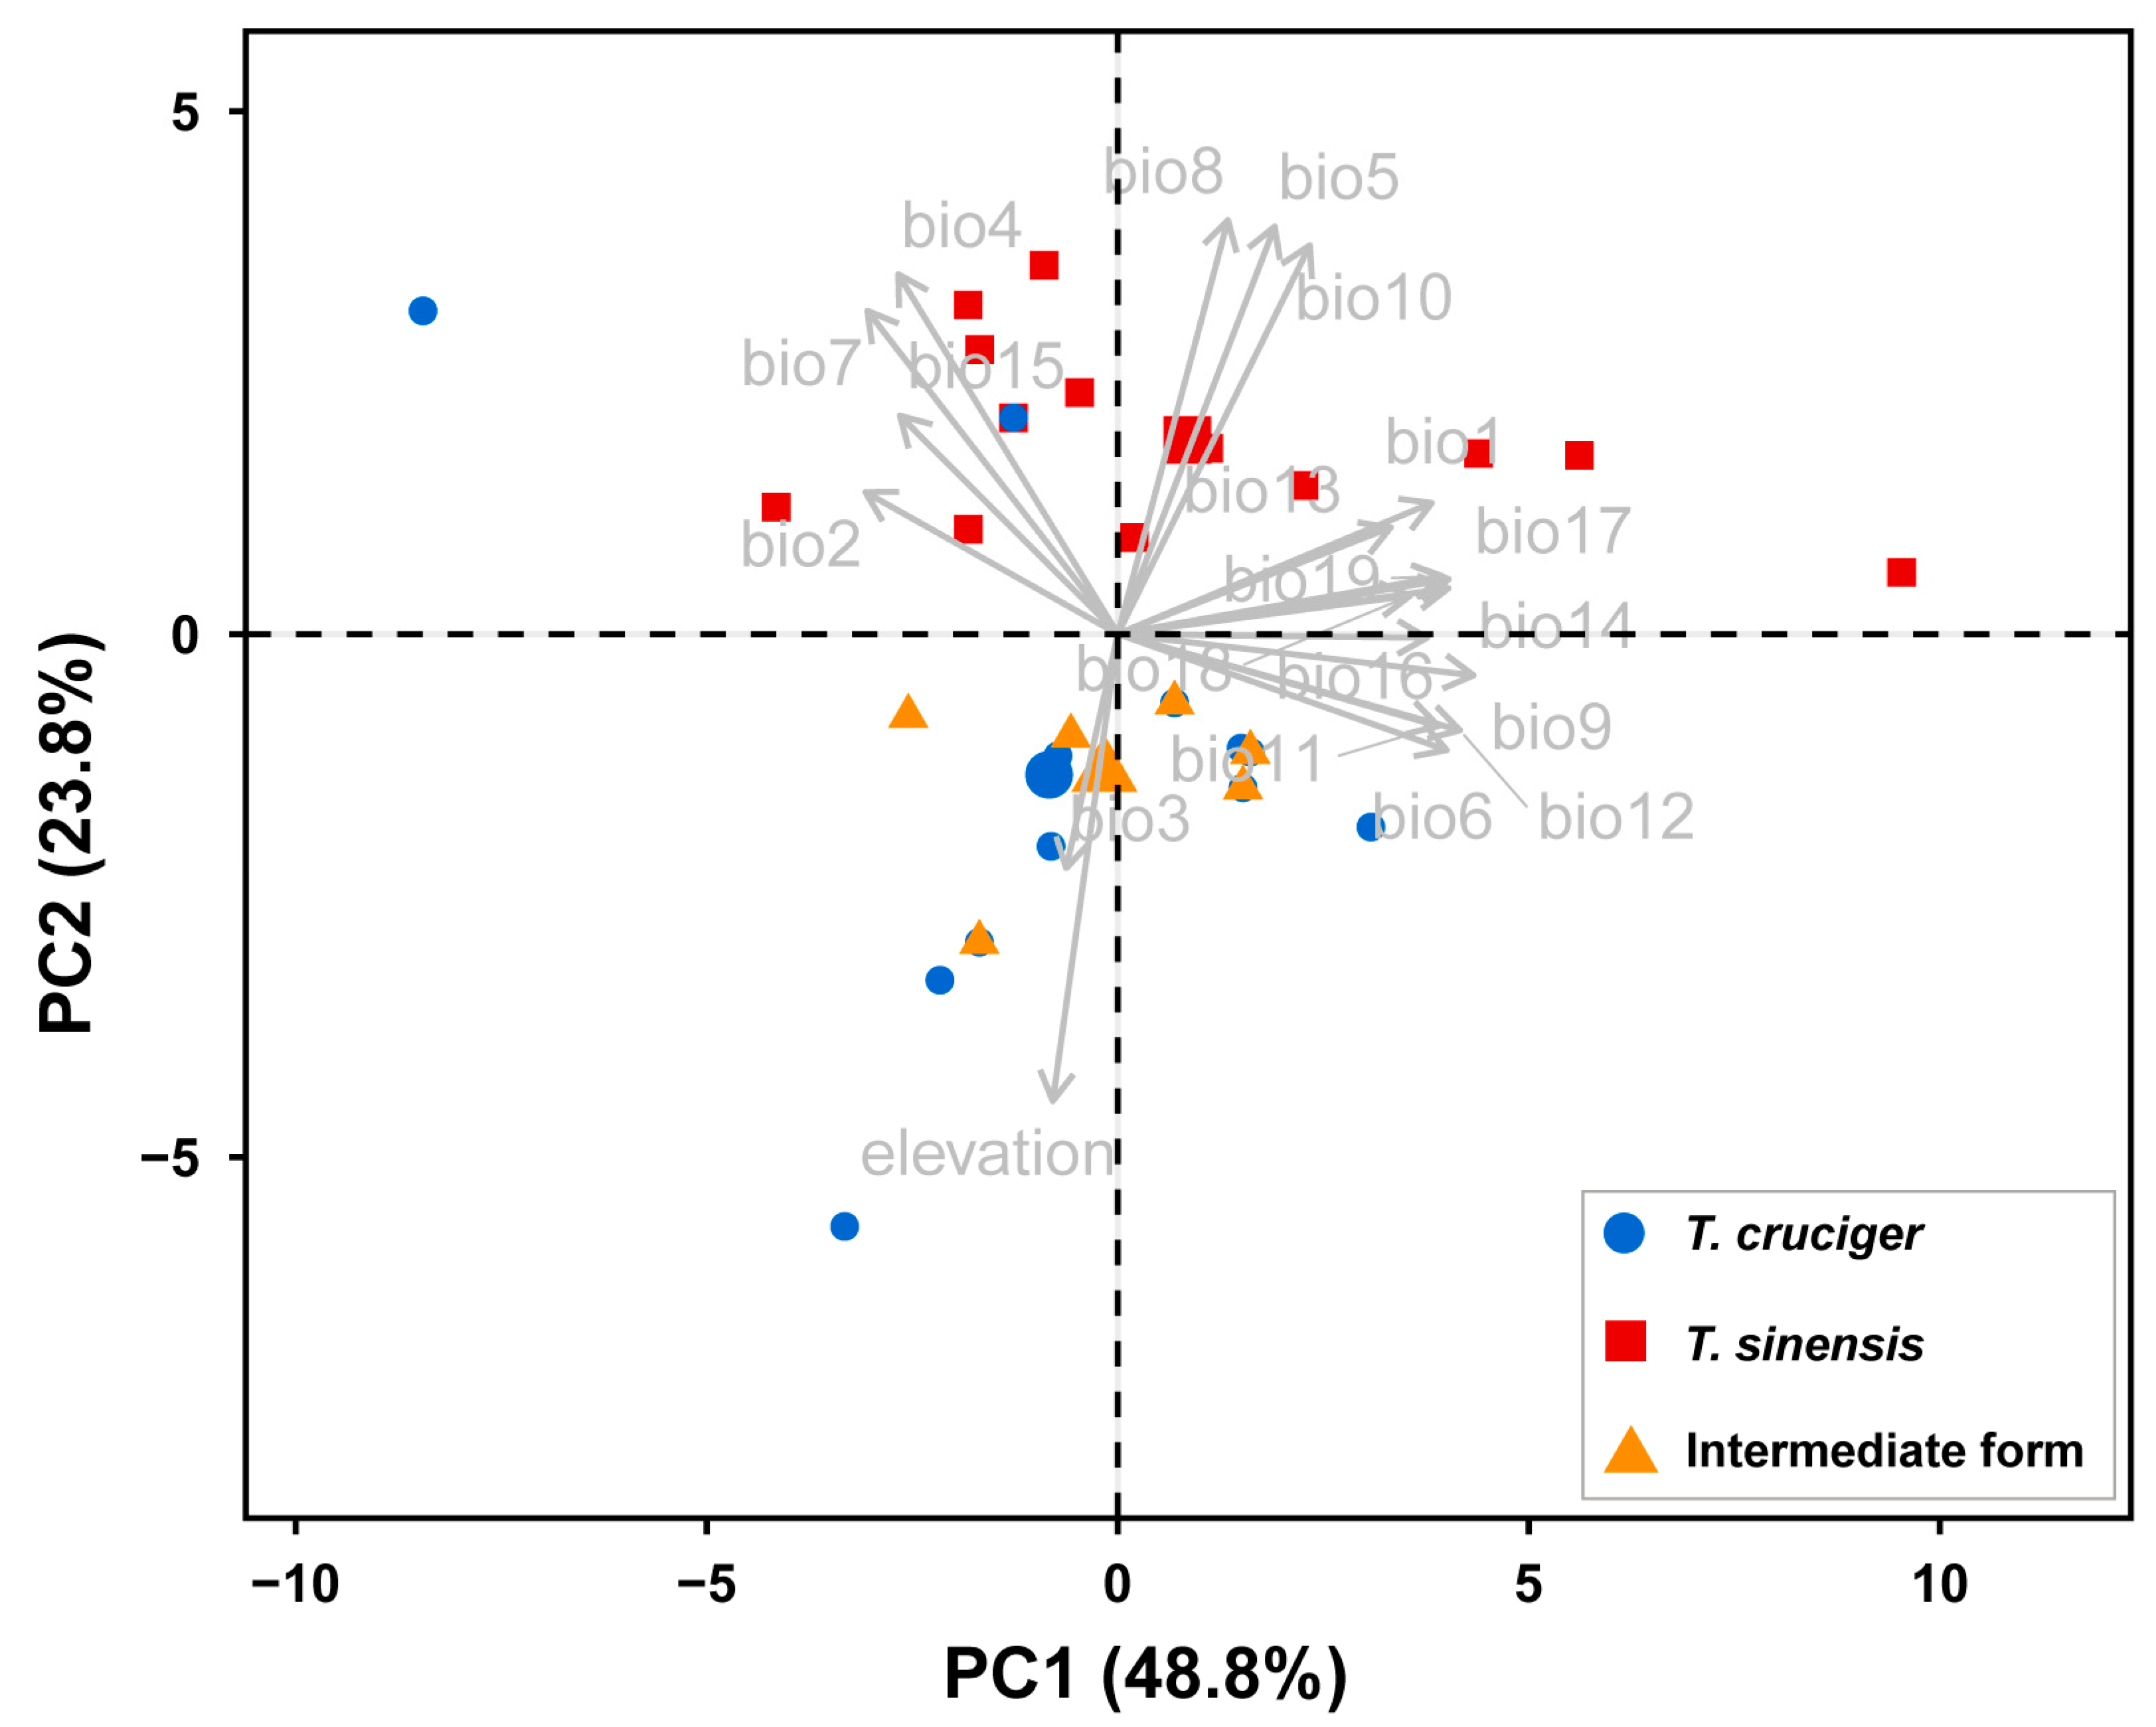
We compared the niches among T. cruciger, T. sinensis and the “intermediate form” based on 19 climatic variables and elevation. The 19 climatic variables and elevation were extracted from the WorldClim database (http://www.worldclim.org/, accessed on 13 May 2024) using the R package raster 3.6.32 [60]. Then, the extracted climatic variables and elevation were analysed by principal component analysis using the R package FactoMineR 2.12 [61].

3. Results

3.1. Datasets

For the COI dataset, a total of 82 polymorphic sites were detected from 96 individuals, including 72 parsimony informative sites and 10 singleton variable sites. For the ddRAD dataset, a total of 492,964,084 raw reads were generated from 78 individuals. After low-quality reads were filtered out, 490,868,842 reads were retained, ranging from 998,191 to 20,246,157 and averaging 6,293,190 reads per sample. After de novo assembly and SNP calling, our two final datasets (dataset file names: ddRAD SNP dataset and ddRAD USNP dataset) consisted of 2064 loci, 52,348 SNPs and 2064 unlinked SNPs, with 6.86% missing sites.

3.2. Species Delimitation Results Based on COI Fragment

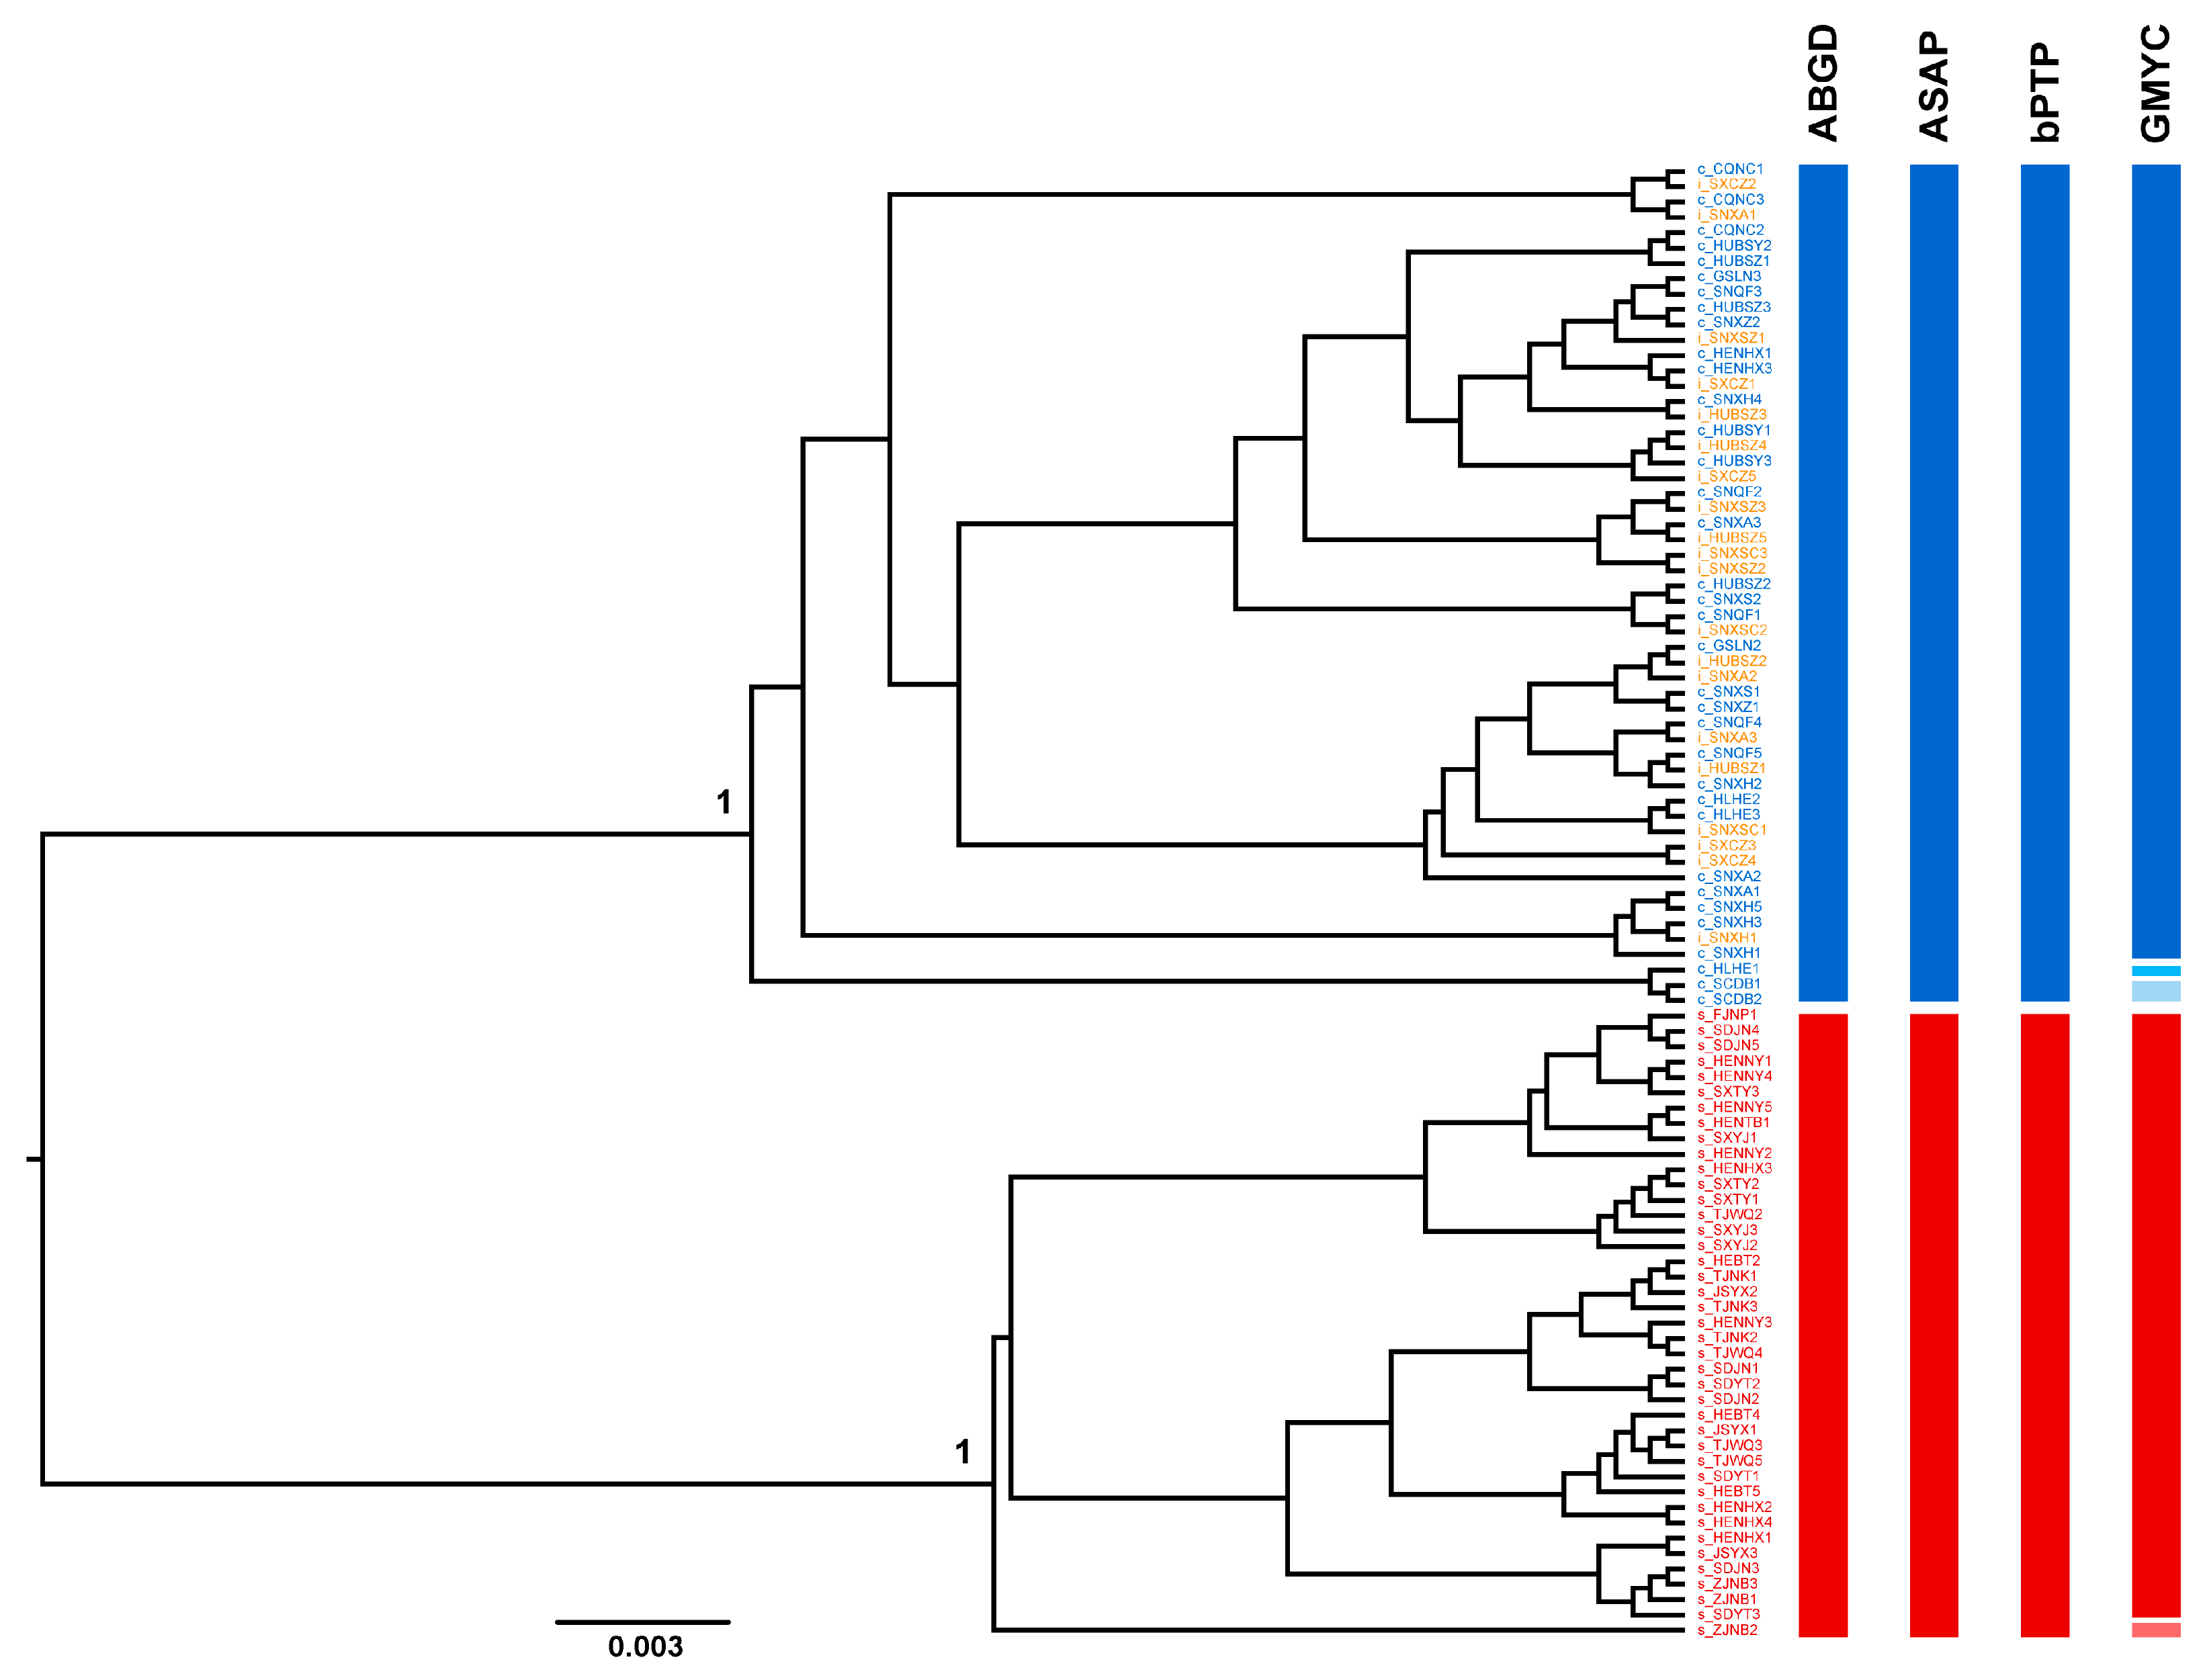
Based on the COI dataset, most species delimitation methods consistently identified two distinct groups (Figure 3). One group comprised all individuals of T. cruciger and the “intermediate form”, while the other included all individuals of T. sinensis. This grouping pattern was strongly supported by the phylogenetic tree, which recovered each group as a highly supported monophyletic clade. Both distance-based methods (ABGD and ASAP) yielded two molecular operational taxonomic units (MOTUs), corresponding exactly to these two groups (Tables S3 and S4). The bPTP analysis further supported this delimitation scenario (Table S5). In contrast, the GMYC analysis retrieved five MOTUs, and details regarding the individuals in each MOTU are provided in Figure 3 and Figure S1.
The intraspecific genetic distances of T. cruciger, T. sinensis, “intermediate form” and T. cruciger + “intermediate form” were 0–2.38%, 0–2.06%, 0–0.78% and 0–2.38%, respectively. The interspecific genetic distance between T. cruciger and the “intermediate form” was 0.28%, which is significantly smaller than the genetic distances between T. cruciger and T. sinensis (9.26%) and between T. sinensis and the “intermediate form” (9.17%) (Table 1).

3.3. Species Delimitation Results Based on Genome-Wide SNPs Data

The BFD* analysis of the ddRAD USNP dataset showed that Model A (Two species: T. cruciger and the “intermediate form” comprise a single species; T. sinensis represents a separate species) obtained the highest MLE (Table S2). The BF values were larger than 10 (Table S2), indicating that Model A was strongly supported.
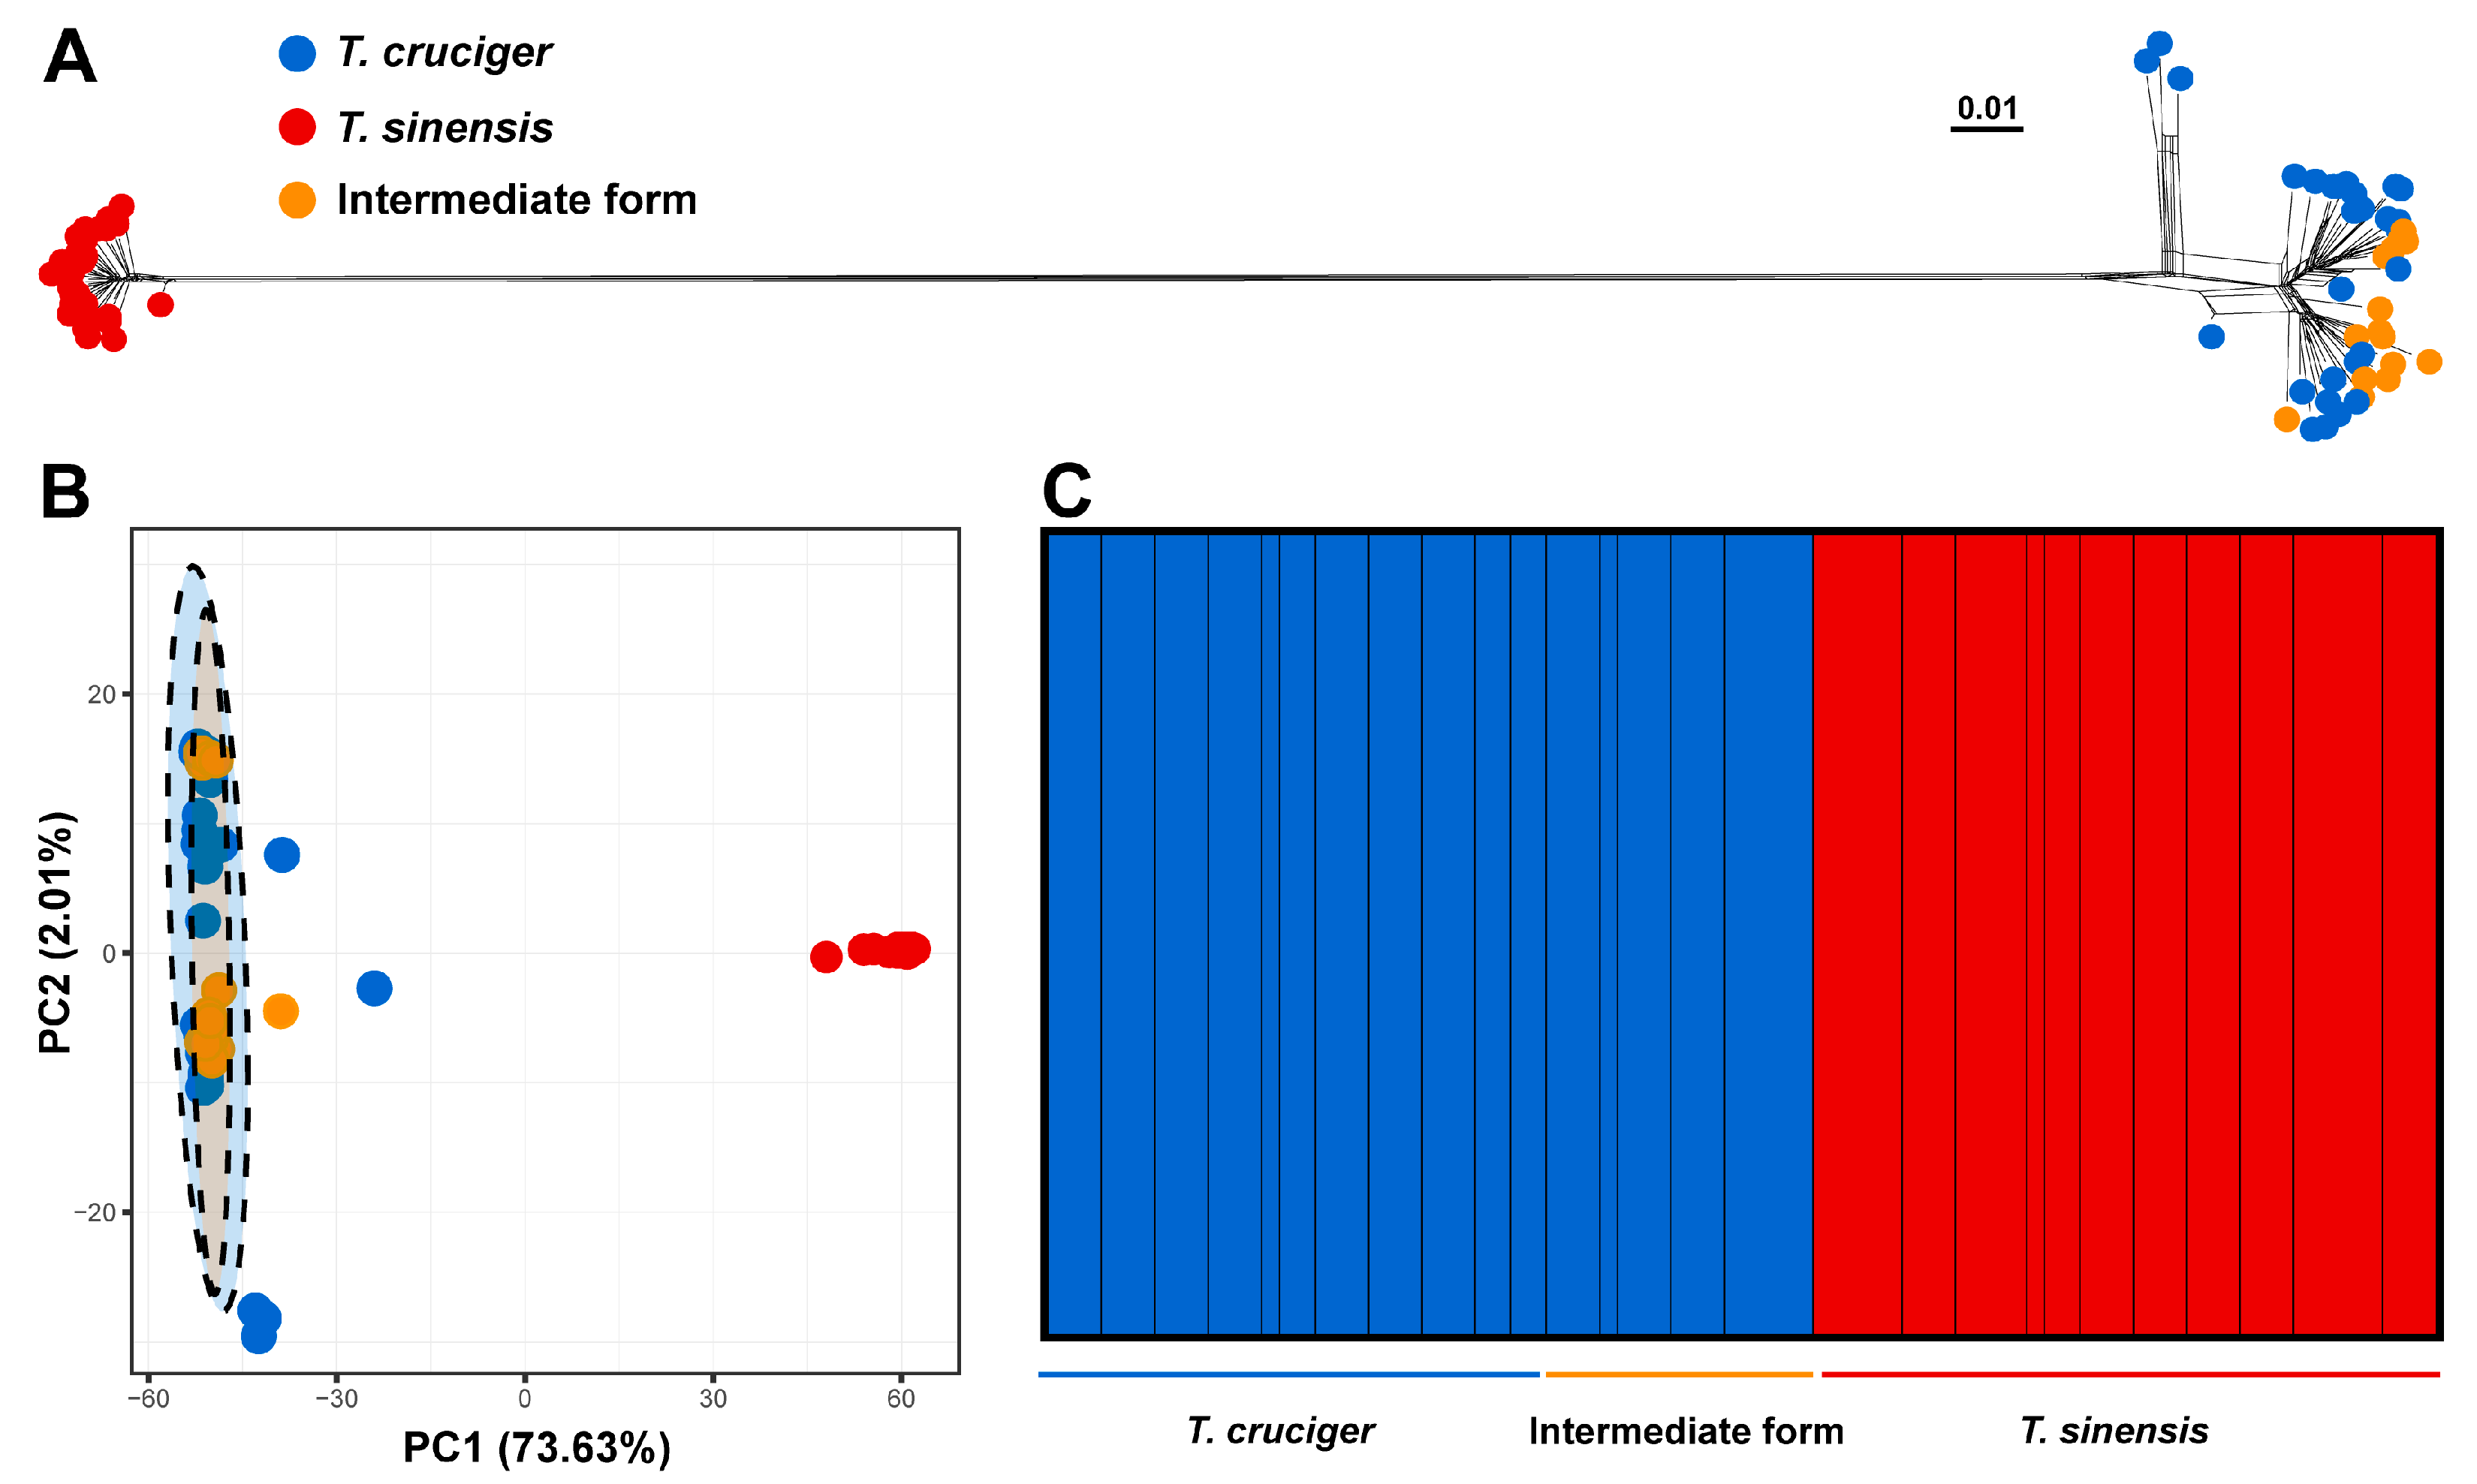
The phylogenetic networks based on the ddRAD SNP dataset and the PCA based on the ddRAD USNP dataset consistently revealed two distinct genetic clusters. One cluster comprised T. cruciger and the “intermediate form”, while the other consisted of T. sinensis (Figure 4). In the PCA, the first and second principal components represented 73.63% and 2.01% of the genetic variation, respectively (Figure 4). The optimal K value in the STRUCTURE analysis was identified as 2 (Figure S2). When K = 2, individual assignments to clusters were consistent with the groupings observed in the phylogenetic networks and PCA. No genetic admixture was detected between T. cruciger + “intermediate form” and T. sinensis (Figure 4).

3.4. Principal Component Analysis of Environmental Variables

In the PCA of 19 climatic variables and elevation, the first two components explained 72.6% of the overall variance. According to the variable contribution values, PC1 was mainly associated with mean temperature of the driest quarter (BIO9), annual precipitation (BIO12), and precipitation of the driest quarter (BIO17), whereas PC2 was mainly associated with elevation, mean temperature of the wettest quarter (BIO8), and maximum temperature of the warmest month (BIO5). The PCA results showed that T. cruciger and the “intermediate form” clustered together with respect to PC1 and PC2, indicating their similar environmental space. In contrast, T. sinensis can be separated from both T. cruciger and the “intermediate form”, with the exception of one site in T. cruciger (Figure 5).

4. Discussion

In this study, we initially identified species based on morphological taxonomic keys. Although T. cruciger and T. sinensis are morphologically similar, they can be distinguished by specific traits such as the dark pattern on the pronotum and coriaceous part of hemelytra, as well as the separation between the median black band and the lateral black spots on the abdomen [40]. As expected, these morphological traits allow for clear and straightforward discrimination between the two species. However, we encountered a group of specimens representing an “intermediate form” that exhibits morphological similarities to one or the other species to varying degrees. In these intermediate specimens, the black spots on pronotum and coriaceous part of hemelytra are small to medium in size—characteristic of T. sinensis—whereas the separation between the central black stripe and lateral black spots on the abdomen aligns with traits typical of T. cruciger (Figure 1). Based solely on morphological features, it is difficult to assign these intermediate forms definitively to either T. cruciger or T. sinensis.
To address the above issue, we conducted species delimitation analyses using both the COI fragment and genome-wide SNPs. Most distance-based and tree-based species delimitation methods (ABGD, ASAP, bPTP) using the COI fragment suggested that T. cruciger and the “intermediate form” comprise a single species, with T. sinensis representing a distinct species. The GMYC analysis based on the COI fragment retrieved five MOTUs, resulting in the over-splitting of both T. cruciger and T. sinensis. This is consistent with the known tendency of the GMYC method to over-split species, which often arises from low genetic divergence between lineages, overlapping intra- and interspecific genetic distances, or the absence of reciprocal monophyly [62,63]. The interspecific genetic distance between T. cruciger and the “intermediate form” is only 0.28%, which is significantly smaller than that between T. cruciger and T. sinensis (9.26%) and between T. sinensis and the “intermediate form” (9.17%). Furthermore, the maximum intraspecific distances observed in T. cruciger (2.38%) and T. sinensis (2.06%) both exceed the interspecific distance between T. cruciger and the “intermediate form” (0.28%). Notably, when individuals of T. cruciger and the “intermediate form” are considered as a single species, a distinct barcode gap emerges between interspecific and intraspecific genetic distances. The taxonomic status of the “intermediate form” was also confirmed using genome-wide SNP data. BFD* analysis based on the ddRAD USNP dataset strongly supported the two-species model, with the combination of T. cruciger and the “intermediate form” as one species and T. sinensis as the other, yielding the highest MLE. Population genetic clustering analyses using phylogenetic networks, PCA and STRUCTURE also revealed two distinct genetic clusters. One cluster comprised T. cruciger and the “intermediate form”, while the other consisted exclusively of T. sinensis. In addition, environmental-related analyses also showed that T. cruciger and the “intermediate form” clustered together, consistent with their highly similar ecological requirements and supporting their classification as a single species.
Based on the results of species delimitation obtained in this study, we clarify the taxonomic status of the “intermediate form” between T. cruciger and T. sinensis. It is concluded that this “intermediate form” should be recognized as a morphological variant of T. cruciger.

5. Conclusions

In this study, we conducted an integrative taxonomic analysis of two species, T. cruciger and T. sinensis, by combining morphological traits, molecular-based species delimitation and ecological niche comparison. Species identification has been complicated by the presence of the “intermediate form”, which is difficult to assign unequivocally to either T. cruciger or T. sinensis based on morphology alone. Results from species delimitation using both the COI fragment and genome-wide SNPs, together with environmental-related analysis, strongly supported that T. cruciger and the “intermediate form” represent a single species, while T. sinensis constitutes a distinct species. Under this species delimitation scenario, a clear barcode gap was observed between interspecific and intraspecific genetic distances.

Supplementary Materials

The following supporting information can be downloaded at https://www.mdpi.com/article/10.3390/insects17010037/s1. Table S1. Sample information of T. cruciger, T. sinensis and the “intermediate form” in the present study. Table S2. Comparison of different species delimitation models. Table S3. Species delimitation results using the ABGD method based on the COI dataset. Table S4. Species delimitation results using the ASAP method based on the COI dataset. Table S5. Species delimitation results using the bPTP method based on the COI dataset. Figure S1. Species delimitation results using the GMYC method based on the COI dataset. (A) Species defined by single threshold GMYC model. (B) The X-axis represents time, the Y-axis represents the number of branches, and the red vertical line represents the conversion time of the population and species. (C) The X-axis represents time, and the Y-axis represents the log-likelihood value of the single threshold GMYC model. Figure S2. Rate of change of likelihood (Delta K) across multiple runs of STRUCTURE.

Author Contributions

C.Z. and X.Z. conceived the research. C.Z., X.Z. and Y.W. collected samples. X.Z., Y.Z. and Y.W. performed laboratory work. X.Z. and Y.Z. conducted analyses. C.Z. drafted the manuscript. C.Z. and W.B. revised the manuscript. All authors have read and agreed to the published version of the manuscript.

Funding

This research was funded by the National Natural Science Foundation of China (32100346, 32130014) and the Youth Scholars Promotion Plan of North China University of Science and Technology (QNTJ202408).

Data Availability Statement

Individual RAD sequences files are available in GenBank (accession numbers: SAMN53285687–SAMN53285764). COI sequences generated in the present study are available in GenBank (accession numbers: PX518918–PX519013).

Acknowledgments

We sincerely thank the editors and reviewers for their valuable suggestions and comments on this study.

Conflicts of Interest

The authors declare no conflicts of interest.

Abbreviations

The following abbreviations are used in this manuscript:
COICytochrome c oxidase subunit I
BFD*Bayes Factor Delimitation
ddRADDouble-digest restriction site-associated DNA

References

  1. De Queiroz, K. A unified concept of species and its consequences for the future of taxonomy. Proc. Calif. Acad. Sci. 2005, 56, 196–215. [Google Scholar]
  2. Aldhebiani, A.Y. Species concept and speciation. Saudi J. Biol. Sci. 2018, 25, 437–440. [Google Scholar] [CrossRef]
  3. Mehdi, H.; Reza, O.; Jason, G. Biodiversity, a review of the concept, measurement, opportunities, and challenges. J. Wildl. Biodivers. 2020, 4, 26–39. [Google Scholar]
  4. Dunn, C.P. Keeping taxonomy based in morphology. Trends Ecol. Evol. 2003, 18, 270–271. [Google Scholar] [CrossRef]
  5. Saraswati, P.K.; Srinivasan, M.S. Morphology, taxonomy and concepts of species. In Micropaleontology; Springer: Cham, Switzerland, 2016. [Google Scholar]
  6. MacLeod, N.; Canty, R.J.; Polaszek, A.; Beaulieu, J. Morphology-based identification of Bemisia tabaci cryptic species puparia via embedded group-contrast convolution neural network analysis. Syst. Biol. 2022, 71, 1095–1109. [Google Scholar] [CrossRef]
  7. Zhu, X.; Zheng, C.; Dong, X.; Zhang, H.; Ye, Z.; Xue, H.; Bu, W. Species boundary and phylogeographical pattern provide new insights into the management efforts of Megacopta cribraria (Hemiptera: Plataspidae), a bean bug invading North America. Pest Manag. Sci. 2022, 78, 4871–4881. [Google Scholar] [CrossRef]
  8. Dong, X.; Zhang, H.; Zhu, X.; Wang, K.; Xue, H.; Ye, Z.; Zheng, C.; Bu, W. Mitochondrial introgression and mito-nuclear discordance obscured the closely related species boundaries in Cletus Stål from China (Heteroptera: Coreidae). Mol. Phylogenet Evol. 2023, 184, 107802. [Google Scholar] [CrossRef] [PubMed]
  9. Pan, X.; Peng, B.; Wang, X.; Chen, Z.; Cheng, H.; Liao, R.; Huang, C.; Li, J.; Liu, S. Species delimitation within a taxonomically complex group: An example from the genus Apodemus (Rodentia: Muridae). Mol. Phylogenet. Evol. 2025, 215, 108483. [Google Scholar] [CrossRef]
  10. Chambers, E.A.; Hillis, D.M. The multispecies coalescent over-splits species in the case of geographically widespread taxa. Syst. Biol. 2020, 69, 184–193. [Google Scholar] [CrossRef]
  11. Piñeros, V.J.; del R. Pedraza-Marrón, C.; Betancourt-Resendes, I.; Calderón-Cortés, N.; Betancur-R, R.; Domínguez-Domínguez, O. Genome-wide species delimitation analyses of a silverside fish species complex in central Mexico indicate taxonomic over-splitting. BMC Ecol. Evol. 2022, 22, 108. [Google Scholar] [CrossRef]
  12. Gao, W.N.; Zhang, Q.; Xue, X.F. An integrative species delimitation approach uncovers eriophyoid mite Diptilomiopus ligustri species complex (Acariformes: Eriophyoidea). Zool. Scr. 2024, 54, 219–231. [Google Scholar] [CrossRef]
  13. Wiens, J.J. Species delimitation: New approaches for discovering diversity. Syst. Biol. 2007, 56, 875–878. [Google Scholar] [CrossRef]
  14. Devitt, T.J.; Wright, A.M.; Cannatella, D.C.; Hillis, D.M. Species delimitation in endangered groundwater salamanders: Implications for aquifer management and biodiversity conservation. Proc. Natl. Acad. Sci. USA 2019, 116, 2624–2633. [Google Scholar] [CrossRef]
  15. Gorring, P.S.; Farrell, B.D. Evaluating species boundaries using coalescent delimitation in pine-killing Monochamus (Coleoptera: Cerambycidae) sawyer beetles. Mol. Phylogenet. Evol. 2023, 184, 107777. [Google Scholar] [CrossRef]
  16. Pedraza-Marrón, C.D.R.; Silva, R.; Deeds, J.; Van Belleghem, S.M.; Mastretta-Yanes, A.; Domínguez-Domínguez, O.; Rivero-Vega, R.A.; Lutackas, L.; Murie, D.; Parkyn, D.; et al. Genomics overrules mitochondrial DNA, siding with morphology on a controversial case of species delimitation. Proc. R. Soc. B 2019, 286, 20182924. [Google Scholar] [CrossRef]
  17. Quattrini, A.M.; Wu, T.; Soong, K.; Jeng, M.-S.; Benayahu, Y.; McFadden, C.S. A next generation approach to species delimitation reveals the role of hybridization in a cryptic species complex of corals. BMC Evol. Biol. 2019, 19, 116. [Google Scholar] [CrossRef] [PubMed]
  18. Zheng, C.; Ye, Z.; Zhu, X.; Zhang, H.; Dong, X.; Chen, P.; Bu, W. Integrative taxonomy uncovers hidden species diversity in the rheophilic genus Potamometra (Hemiptera: Gerridae). Zool. Scr. 2019, 49, 174–186. [Google Scholar] [CrossRef]
  19. Dong, X.; Yi, W.; Zheng, C.; Zhu, X.; Wang, S.; Xue, H.; Ye, Z.; Bu, W. Species delimitation of rice seed bugs complex: Insights from mitochondrial genomes and ddRAD−seq data. Zool. Scr. 2021, 51, 185–198. [Google Scholar] [CrossRef]
  20. Wu, Y.; Hipp, A.L.; Fargo, G.; Stith, N.; Ricklefs, R.E. Improving species delimitation for effective conservation: A case study in the endemic maple−leaf oak (Quercus acerifolia). New Phytol. 2023, 238, 1278–1293. [Google Scholar] [CrossRef]
  21. Wang, Y.; Zhu, X.; Dong, X.; Wang, K.; Yang, R.; Zheng, C.; Bu, W. Species boundaries and phylogenetics of Aelia stink bugs (Hemiptera: Pentatomidae) in China, with notes on mito−nuclear discordance. Zool. Scr. 2024, 54, 196–212. [Google Scholar] [CrossRef]
  22. Wei, X.; Cui, X.; Yuan, F.; Zhou, K.; Zhou, L.; Zhao, C.; Guo, S.; Shang, C.; Zhang, Z. Species delimitation in the Populus laurifolia complex (Salicaceae) based on phylogenetic and morphometric evidence. Front. Plant Sci. 2025, 16, 1518122. [Google Scholar] [CrossRef]
  23. Turani, M.; Valdés, Á.; Malaquias, M.A.E. Molecular phylogeny of the marine snail genus Haminoea (Gastropoda, Cephalaspidea): A framework to study marine diversity and speciation. Zool. Scr. 2023, 53, 52–77. [Google Scholar] [CrossRef]
  24. Musher, L.J.; Del-Rio, G.; Marcondes, R.S.; Brumfield, R.T.; Bravo, G.A.; Thom, G.; Burbrink, F. Geogenomic predictors of genetree heterogeneity explain phylogeographic and introgression history: A case study in an amazonian bird (Thamnophilus aethiops). Syst. Biol. 2024, 73, 36–52. [Google Scholar] [CrossRef] [PubMed]
  25. Zheng, C.; Zhu, X.; Wang, Y.; Dong, X.; Yang, R.; Tang, Z.; Bu, W. Mitogenomes provide insights into the species boundaries and phylogenetic relationships among three Dolycoris sloe bugs (Hemiptera: Pentatomidae) from China. Insects 2024, 15, 134. [Google Scholar] [CrossRef] [PubMed]
  26. Folmer, O.; Black, M.; Hoeh, W.; Lutz, R.; Vrijenhoek, R. DNA primers for amplification of mitochondrial cytochrome c oxidase subunit I from diverse metazoan invertebrates. Mol. Mar. Biol. Biotechnol. 1994, 3, 294–299. [Google Scholar]
  27. Nyman, T.; Wutke, S.; Koivisto, E.; Klemola, T.; Shaw, M.R.; Andersson, T.; Haraldseide, H.; Hagen, S.B.; Nakadai, R.; Ruohomaki, K. A curated DNA barcode reference library for parasitoids of northern European cyclically outbreaking geometrid moths. Ecol. Evol. 2022, 12, e9525. [Google Scholar] [CrossRef]
  28. Zito, A.; Rigon, T.; Dunson, D.B. Inferring taxonomic placement from DNA barcoding aiding in discovery of new taxa. Methods Ecol. Evol. 2022, 14, 529–542. [Google Scholar] [CrossRef]
  29. Johnson, K.P. Putting the genome in insect phylogenomics. Curr. Opin. Insect Sci. 2019, 36, 111–117. [Google Scholar] [CrossRef] [PubMed]
  30. Otero, A.; Barcenas-Peña, A.; Lumbsch, H.T.; Grewe, F. Reference−based RADseq unravels the evolutionary history of polar species in ‘the Crux Lichenologorum’ genus Usnea (Parmeliaceae, Ascomycota). J. Fungi 2023, 9, 99. [Google Scholar] [CrossRef]
  31. Dong, X.; Zhu, X.; Tang, Z.; Yi, W.; Xue, H.; Ye, Z.; Zheng, C.; Bu, W. Phylogeography and local environmental adaptation in the differentiation of Leptocorisa sister species in East Asia. J. Syst. Evol. 2024, 63, 345–358. [Google Scholar] [CrossRef]
  32. Du, K.; Ricci, J.M.B.; Lu, Y.; Garcia-Olazabal, M.; Walter, R.B.; Warren, W.C.; Dodge, T.O.; Schumer, M.; Park, H.; Meyer, A.; et al. Phylogenomic analyses of all species of swordtail fishes (genus Xiphophorus) show that hybridization preceded speciation. Nat. Commun. 2024, 15, 6609. [Google Scholar] [CrossRef]
  33. Peterson, B.K.; Weber, J.N.; Kay, E.H.; Fisher, H.S.; Hoekstra, H.E. Double digest RADseq: An inexpensive method for de novo SNP discovery and genotyping in model and non-model species. PLoS ONE 2012, 7, e37135. [Google Scholar] [CrossRef]
  34. Masharing, N.; Sodhi, M.; Chanda, D.; Singh, I.; Vivek, P.; Tiwari, M.; Kumari, P.; Mukesh, M. ddRAD sequencing based genotyping of six indigenous dairy cattle breeds of India to infer existing genetic diversity and population structure. Sci. Rep. 2023, 13, 9379. [Google Scholar] [CrossRef]
  35. Taylor, R.S.; Bramwell, A.C.; Clemente-Carvalho, R.; Cairns, N.A.; Bonier, F.; Dares, K.; Lougheed, S.C. Cytonuclear discordance in the crowned-sparrows, Zonotrichia atricapilla and Zonotrichia leucophrys. Mol. Phylogenet. Evol. 2021, 162, 107216. [Google Scholar] [CrossRef]
  36. Bergroth, E.E. Rhynchota Aethiopica II. Ann. Soc. ent. Belg. 1894, 38, 535–547. [Google Scholar]
  37. Motschulsky, V. Catalogue des insectes rapportés des environs du fleuve Amour depuis la Schilka jusqu’à Nikolaëvsk, examinés et énumérés. Bull. Soc. Imp. Nat. Moscou 1860, 32, 487–507. [Google Scholar]
  38. Reuter, O.M. Hemiptera Sinensia enumeravit ac novas species descripsit. Rev. d’Ent. 1888, 7, 63–69. [Google Scholar]
  39. Hsiao, T.Y.; Ren, S.Z.; Zheng, L.Y.; Jing, H.L.; Zou, H.G.; Liu, S.L. A Handbook for the Determination of the Chinese Hemiptera-Heteroptera, II; Science Press: Beijing, China, 1981. [Google Scholar]
  40. Lee, C.E.; Miyamoto, S.; Kerzhner, I.M. Additions and corrections to the list of Korean Heteroptera. Nat. Life 1994, 24, 1–34. [Google Scholar]
  41. Madeira, F.; Madhusoodanan, N.; Lee, J.; Eusebi, A.; Niewielska, A.; Tivey, A.R.N.; Lopez, R.; Butcher, S. The EMBL-EBI Job Dispatcher sequence analysis tools framework in 2024. Nucleic Acids Res. 2024, 52, W521–W525. [Google Scholar] [CrossRef] [PubMed]
  42. Eaton, D.A.; Overcast, I. Ipyrad: Interactive assembly and analysis of RADseq datasets. Bioinformatics 2020, 36, 2592–2594. [Google Scholar] [CrossRef] [PubMed]
  43. Puillandre, N.; Lambert, A.; Brouillet, S.; Achaz, G. ABGD, Automatic Barcode Gap Discovery for primary species delimitation. Mol. Ecol. 2012, 21, 1864–1877. [Google Scholar] [CrossRef]
  44. Puillandre, N.; Brouillet, S.; Achaz, G. ASAP: Assemble species by automatic partitioning. Mol. Ecol. Resour. 2021, 21, 609–620. [Google Scholar] [CrossRef]
  45. Zhang, J.; Kapli, P.; Pavlidis, P.; Stamatakis, A. A general species delimitation method with applications to phylogenetic placements. Bioinformatics 2013, 29, 2869–2876. [Google Scholar] [CrossRef]
  46. Fujisawa, T.; Barraclough, T.G. Delimiting species using single-locus data and the Generalized Mixed Yule Coalescent approach: A revised method and evaluation on simulated data sets. Syst. Biol. 2013, 62, 707–724. [Google Scholar] [CrossRef]
  47. Pons, J.; Barraclough, T.G.; Gomez-Zurita, J.; Cardoso, A.; Duran, D.P.; Hazell, S.; Kamoun, S.; Sumlin, W.D.; Vogler, A.P. Sequence-based species delimitation for the DNA taxonomy of undescribed insects. Syst. Biol. 2006, 55, 595–609. [Google Scholar] [CrossRef] [PubMed]
  48. Nguyen, L.T.; Schmidt, H.A.; von Haeseler, A.; Minh, B.Q. IQ-TREE: A fast and effective stochastic algorithm for estimating maximum-likelihood phylogenies. Mol. Biol. Evol. 2015, 32, 268–274. [Google Scholar] [CrossRef] [PubMed]
  49. Bouckaert, R.; Heled, J.; Kuhnert, D.; Vaughan, T.; Wu, C.H.; Xie, D.; Suchard, M.A.; Rambaut, A.; Drummond, A.J. BEAST 2: A software platform for Bayesian evolutionary analysis. PLoS Comput. Biol. 2014, 10, e1003537. [Google Scholar] [CrossRef] [PubMed]
  50. Rambaut, A.; Drummond, A.J.; Xie, D.; Baele, G.; Suchard, M.A. Posterior summarization in Bayesian phylogenetics using Tracer 1.7. Syst. Biol. 2018, 67, 901–904. [Google Scholar] [CrossRef]
  51. Kumar, S.; Stecher, G.; Li, M.; Knyaz, C.; Tamura, K. MEGA X: Molecular evolutionary genetics analysis across computing platforms. Mol. Biol. Evol. 2018, 35, 1547–1549. [Google Scholar] [CrossRef]
  52. Leache, A.D.; Fujita, M.K.; Minin, V.N.; Bouckaert, R.R. Species delimitation using genome-wide SNP data. Syst. Biol. 2014, 63, 534–542. [Google Scholar] [CrossRef]
  53. Bryant, D.; Bouckaert, R.; Felsenstein, J.; Rosenberg, N.A.; RoyChoudhury, A. Inferring species trees directly from biallelic genetic markers: Bypassing gene trees in a full coalescent analysis. Mol. Biol. Evol. 2012, 29, 1917–1932. [Google Scholar] [CrossRef]
  54. Huson, D.H.; Bryant, D. Application of phylogenetic networks in evolutionary studies. Mol. Biol. Evol. 2006, 23, 254–267. [Google Scholar] [CrossRef]
  55. Jombart, T. Adegenet: A R package for the multivariate analysis of genetic markers. Bioinformatics 2008, 24, 1403–1405. [Google Scholar] [CrossRef] [PubMed]
  56. Pritchard, J.K.; Stephens, M.; Donnelly, P. Inference of population structure using multilocus genotype data. Genetics 2000, 155, 945–959. [Google Scholar] [CrossRef]
  57. Earl, D.A.; vonHoldt, B.M. STRUCTURE HARVESTER: A website and program for visualizing STRUCTURE output and implementing the Evanno method. Conserv. Genet. Resour. 2011, 4, 359–361. [Google Scholar] [CrossRef]
  58. Jakobsson, M.; Rosenberg, N.A. CLUMPP: A cluster matching and permutation program for dealing with label switching and multimodality in analysis of population structure. Bioinformatics 2007, 23, 1801–1806. [Google Scholar] [CrossRef] [PubMed]
  59. Rosenberg, N.A. distruct: A program for the graphical display of population structure. Mol. Ecol. Notes 2003, 4, 137–138. [Google Scholar] [CrossRef]
  60. Hijmans, R.J. Geographic Analysis and Modeling with Raster Data, R package version 3.6-11; R Core Team: Vienna, Austria, 2020. [Google Scholar]
  61. Lê, S.; Josse, J.; Husson, F. FactoMineR: An R package for multivariate analysis. J. Stat. Softw. 2008, 25, 1–8. [Google Scholar] [CrossRef]
  62. Talavera, G.; Dincă, V.; Vila, R.; Paradis, E. Factors affecting species delimitations with the GMYC model: Insights from a butterfly survey. Methods Ecol. Evol. 2013, 4, 1101–1110. [Google Scholar] [CrossRef]
  63. Pentinsaari, M.; Vos, R.; Mutanen, M. Algorithmic single-locus species delimitation: Effects of sampling effort, variation and nonmonophyly in four methods and 1870 species of beetles. Mol. Ecol. Resour. 2016, 17, 393–404. [Google Scholar] [CrossRef]
Figure 1. Morphological comparison between T. sinensis, T. cruciger, and the “intermediate form”. (AC) Dorsal views of T. sinensis (female), T. cruciger (female), and the “intermediate form” (male); (DF) dorsal views of the pronotum of T. sinensis (female), T. cruciger (female), and the “intermediate form” (female); (GI) ventral views of the partial abdominal segments of T. sinensis (female), T. cruciger (female), and the “intermediate form” (female); (JL) lateral views of the partial abdominal segments of T. sinensis (female), T. cruciger (female), and the “intermediate form” (female); (MO) dorsal view of left parameres of T. sinensis, T. cruciger, and the “intermediate form”.
Insects 17 00037 g001
Figure 2. Geographical map of the sampling sites. The blue dots represent T. cruciger, the red dots represent T. sinensis, and the orange dots represent the “intermediate form”.
Insects 17 00037 g002
Figure 3. Summary of species delimitation results based on the COI fragment. The ultrametric tree on the left was reconstructed using BEAST. The columns on the right are the results of four molecular delimitation methods (ABGD, ASAP, bPTP and GMYC). The putative species inferred by the molecular delimitation method are shown in different colors.
Insects 17 00037 g003
Figure 4. Genetic clustering results based on genome-wide SNPs. (A) Phylogenetic networks based on the ddRAD SNP dataset. (B) PCA based on the ddRAD USNP dataset. (C) STRUCTURE analysis based on the ddRAD USNP dataset (the best value K = 2).
Insects 17 00037 g004
Figure 5. Principal component analysis (PCA) of environmental factors associated with T. sinensis, T. cruciger, and the “intermediate form”.
Insects 17 00037 g005
Table 1. Intraspecific and interspecific genetic distances based on the COI dataset. Abbreviations: TC, T. cruciger; TS, T. sinensis; TI, the “intermediate form”.
GeneIntraspecific Distance (%)Interspecific Distance (%)
TCTSTITC + TITC − TSTC − TITS − TI
COI0–2.38%0–2.06%0–0.78%0–2.38%9.26%0.28%9.17%
Disclaimer/Publisher’s Note: The statements, opinions and data contained in all publications are solely those of the individual author(s) and contributor(s) and not of MDPI and/or the editor(s). MDPI and/or the editor(s) disclaim responsibility for any injury to people or property resulting from any ideas, methods, instructions or products referred to in the content.