Article

Assessing the Population Structure and Invasion Risk in Suitable Areas of the Rice Pest Leptocorisa acuta (Hemiptera: Alydidae)

1
School of Life Science, Shanxi Normal University, Taiyuan 030031, China
2
Institute of Entomology, College of Life Sciences, Nankai University, Tianjin 300071, China
3
Department of Biology, Xinzhou Normal University, Xinzhou 034000, China
*
Author to whom correspondence should be addressed.
Insects 2025, 16(9), 949; https://doi.org/10.3390/insects16090949
Submission received: 6 August 2025 / Revised: 4 September 2025 / Accepted: 8 September 2025 / Published: 10 September 2025
(This article belongs to the Section Insect Pest and Vector Management)

Simple Summary

Leptocorisa acuta is a serious pest that damages rice crops in many parts of Asia. Because rice is a key food source for much of the world, understanding the biology and spread of this insect is important. In this study, we used genetic data from 18 populations across China and Southeast Asia to assess the population structure and dispersal ability of L. acuta. We found that this pest shows little genetic difference across regions, suggesting it can move and spread easily. We also used ecological modeling to predict where it might spread in the future. Our results show that the pest is a potentially invasive pest in the Americas, including parts of North, Central, and South America. This highlights the need for early monitoring and prevention efforts in regions where rice is widely grown and where the environment is suitable for the pest to establish.

Abstract

Rice (Oryza sativa) provides a major food resource worldwide, playing an important role in the global economy. Leptocorisa acuta (Hemiptera: Alydidae), commonly known as the rice seed bug, is a major pest of paddy crops in many rice-growing regions and it is considered a potential invasive pest in the United States. Here, we investigated the genetic structure and demographic history of 18 populations sampled from China and southeast Asia using double-digest restriction site-associated DNA sequencing (ddRAD-seq). Then, we performed niche modeling based on occurrence records under current and future climate scenarios. Our analyses suggested that the lack of genetic structure among populations of L. acuta is related to recent diversification, strong flight, and dispersal capability, leading to a high level of gene flow. The demographic history was not strongly affected by the last glacial maximum. Ecological niche modeling predicts that future suitable areas will expand in Asia and America, relative to the current conditions. The ecological niche results demonstrated that L. acuta is a potentially invasive pest to the United States (mainly Florida and nearby areas) under current and future scenarios. Moreover, the moderately and highly suitable areas will increase in America (primarily located in North America, namely Florida and nearby areas, and Mexico), Central American and Caribbean countries, and some regions of South America. Some South American countries have extensive rice crops and broadly suitable habitats that may indicate a higher invasion risk. Through population genetics, our study supports the strong dispersal capacity of this insect pest and calls for vigilance against its invasion in some countries in the Americas.

1. Introduction

Rice (Oryza sativa) is the world’s most important food crop and is cultivated in more than 100 countries (accessed on 10 May 2023, http://www.fao.org/faostat/en/#data), mainly in monsoon Asia, and is distributed across a wide latitudinal range, spanning the tropical and temperate zones [1]. Rice seed bugs are one of the few pests that feed directly on developing rice spikelets in the field [2,3]. Leptocorisa acuta (Thunberg, 1783) (Hemiptera: Alydidae) is the most widely distributed species of rice seed bugs in Asia and Oceania [4,5]. L. acuta can be found on many crop plants of the family Poaceae, especially rice, and it is an economically important rice pest in rice-producing countries [6,7,8,9]. L. acuta is very common in India (known as the Gandhi bug), Sarawak, and New Guinea, and is present throughout the year [4]. L. acuta feeds on rice, leading to losses caused by empty spikelets, small and misshapen kernels, and pecky kernels with unsavory black spots [10,11]. In addition, L. acuta is a potentially invasive pest in the United States because of its widespread distribution in many rice-producing countries (accessed on 12 October 2022, https://edis.ifas.ufl.edu/publication/IN1067).
Most (97%) of the recorded host plants fed upon by nymphs or adults were grasses (Poaceae), and the remaining were sedges (Cyperaceae) [12]. These hosts are especially vulnerable to L. acuta just after the adults emerge from dormancy and during the period before rice flowering. Rice was more attractive than wild grasses to L. acuta [13], and L. acuta laid more eggs on rice than on other hosts [14]. After rice has been harvested, adults must find alternative food sources until a second rice crop begins to flower.
Nymphs and adults feed by inserting their needlelike mouthparts into new leaves, stems, and developing grains, which causes the most economically important damage to rice crops [15]. Leptocorisa acuta is known to transmit bacteria and fungi, which are the cause of bacterial leaf blight and sheath rot disease [16,17,18]. Sheath rot disease harms the panicles of rice plants and causes underdeveloped or damaged rice grains. In severe cases, the infected plant may not produce rice grains [16]. Currently, the application of chemical insecticides is the primary strategy to control L. acuta [19].
There can be up to five generations of L. acuta under favorable conditions [18]. The duration of five nymph instars is approximately 21 d on rice [12,18] and they are most abundant under conditions of 26.7–27.8 °C and approximately 80% relative humidity [20]. In addition, L. acuta can disperse long distances from grasslands during the off-season to seasonal rice fields suggests the possibility that it has a high flight ability [21]. At present, there are many studies on its harm and control measures, but no molecular genetic markers have been used to study its genetic structure and phylogeographic pattern, and the invasion potential of L. acuta are less understood.
Here, we aimed to characterize the genetic structure, demographic history, and invasion potential of L. acuta. We sampled L. acuta specimens across a large geographical range, and we used nuclear single nucleotide polymorphism (SNP) markers generated by double-digest restriction site-associated DNA sequencing (ddRAD-seq) to gain insights into the current population genetic structure of L. acuta and its historical demography. In addition, we used known occurrences for ecological niche modeling to predict species distribution and infer the risk of invasion into the Americas. Considering the importance of this crop as a worldwide food, our work contributes to understanding the evolutionary history and invasion potential of this pest from population genetics and helps to establish control measures in strategic locations.

2. Materials and Methods

2.1. Sample Collection and DNA Extraction

A total of 83 adult L. acuta were collected from 18 localities (both males and females were included in the sampling) where rice is widely cultivated and affected by the pest (Figure 1; Table 1). All samples were preserved in 100% ethanol in the wild and stored at −20 °C in a freezer. Genomic DNA was obtained from each insect using a Universal Genomic DNA Kit (CWBIO, China) according to the manufacturer’s protocol. The DNA and voucher specimens were deposited at the College of Life Sciences at Nankai University, Tianjin, China (NKU). In addition, rice (Oryza sativa) cropland maps were generated from the IRRI Dataverse (accessed on 1 June 2023, https://dataverse.harvard.edu/dataset.xhtml?persistentId=doi:10.7910/DVN/JE6R2R) and [22].

2.2. ddRAD Sequencing and Data Processing

ddRAD-seq library was prepared to obtain nuclear SNPs following Peterson’s protocol [23]. Briefly, 200–500 ng of DNA was digested using the EcoRI and MspI restriction enzymes (New England Biolabs). The digested DNA fragments were ligated with a unique 5 bp barcode and Illumina adapter. Then, the ligated DNA samples with the same index were pooled and size-selected (200–600 bp) on a Pippin Prep size selector (Sage Science, Beverly, MA, USA) followed by PCR amplification with 8–10 cycles. Amplified DNA fragments from each sample were purified using AMPure XP magnetic beads (Beckman Coulter Inc., Indianapolis, IN, USA) and quantified with an Agilent 2100 bioanalyzer (Agilent Technologies, Santa Clara, CA, USA). The library was sequenced on the Illumina NovaSeq 6000 platform to generate 150 bp paired-end reads.
We used an ipyrad v. 0.9.42 pipeline [24] to demultiplex and assign reads to individuals based on barcodes and then performed subsequent analysis. For the ipyrad parameters, the minimum read depth was set to 6 for calling consensus sequences, and a clustering threshold of 85% was applied for de novo assembly. A final dataset (SNP_80) was generated, with a maximum of 20% missing data per locus allowed across individuals. A USNP_80 dataset was also output to avoid linkage within the same locus for downstream analysis. The sequencing data were deposited in the GenBank database (BioProject accession number: PRJNA1026486).

2.3. Population Genetics Analyses

The genetic diversity and population genetic structure were measured based on the SNP_80 dataset (containing 174,797 SNPs). The observed heterozygosity (HO), expected heterozygosity (HE), and nucleotide diversity (π) were calculated in Arlequin 3.5 [25]. Pairwise genetic differentiation statistic (FST) values were estimated in the hierfstat package [26] and corresponding estimate of the gene flow (Nm) is approximated by (1/FST−1)/4 [27,28]. Phylogenetic relationship was performed using the Neighbor-Net method, implemented in SplitsTree v4.14.5 [29].
We used the Bayesian clustering method STRUCTURE v.2.3.4 [30] to assess the level of population structure. Ten replicates were conducted for each K value from 1 to 10 and each run was performed for 500,000 iterations following 100,000 iterations as burn-in. We used STRUCTURE HARVESTER [31] to assess the most likely value of K using the delta K method [32]. Isolation by distance (IBD) was performed by examining the correlation between genetic distance and geographical distance using the Mantel test, implemented in the R package Adegenet 2.1.3 [33] with 10,000 permutations. In addition, we used the Stairway plot method [34], which is reliable for speculating the demographic history over long periods, to investigate the population demographic history of L. acuta utilizing a one-dimensional unfolded site frequency spectrum (SFS) generated by the easySFS script (accessed on 15 August 2022, https://github.com/isaacovercast/easySFS).

2.4. Ecological Niche Modeling

The maximum entropy algorithm implemented in MaxEnt software 3.4.1 [35] was selected to predict the suitability and evaluate the impacts of environmental factors on the distribution of L. acuta. MaxEnt makes inferences by comparing presence points with background points (for which the presence is not known) and has been widely employed because of its small sample size requirements and superior predictive performance [35,36,37]. We downloaded 19 bioclimatic variables from the WorldClim database (http://www.worldclim.org) accessed on 27 September 2023 and gathered 125 occurrences from our fieldwork and the Global Biodiversity Information Facility (GBIF) database (https://www.gbif.org/) and accessed on 10 May 2023. After spatial thinning, 83 occurrence records were left within a 20 km radius. The relative contribution and importance of each variable was evaluated using the Jackknife method by comparing the regularized training gain. To identify the optimal model parameters, five feature classes (FCs: linear (L); linear quadratic (LQ); hinge (H); linear quadratic hinge (LQH) and linear quadratic hinge product (LQHP)) were tested with regularization multiplier (RM) ranging from 0.5 to 4.0 in increments of 0.5 in the Wallace package [38]. Then, to eliminate multi-collinearity and improve the model performance before modeling, the Pearson correlation coefficient was used to assess the correlations among bioclimatic variables, in which |r| ≥ 0.80 was considered to indicate highly correlated variables. Model generation was iterated 15 times, and 75% of the data were randomly selected as a training set with 25% as the testing set. Model performance was evaluated by the receiver operating characteristic (ROC) curve and the value of the area under the ROC curve (AUC) [23]. AUC values range from 0 to 1, with values greater than 0.5 indicating a better performance than employing random selection. A threshold of the maximum training sensitivity plus specificity (MTSPS) was chosen to define the suitable and unsuitable regions of L. acuta [39,40].
To generate the potential distribution of L. acuta under future climate conditions, we projected the models into the 2050s (average for 2041–2060) and 2070s (average for 2061–2080) in scenarios of low (SSP 126) and high (SSP 585) greenhouse gas emission, available from the WorldClim database. To improve reliability, all future predictions were calculated based on three different global circulation models (GCMs) from Coupled Model Intercomparison Project Phase 6 (CMIP6), including the Canadian Earth System Model version 5 (CanESM5), the Institute Pierre-Simon Laplace coupled model version 6 (IPSLCM6A-LR), and the Max Planck Institute for Meteorology Earth System Model (MPI-ESM1-2-LR), each of which represents different climate sensitivities to future climate change projections [41].

3. Results

3.1. Nuclear Genetic Diversity and the Lack of Population Structure

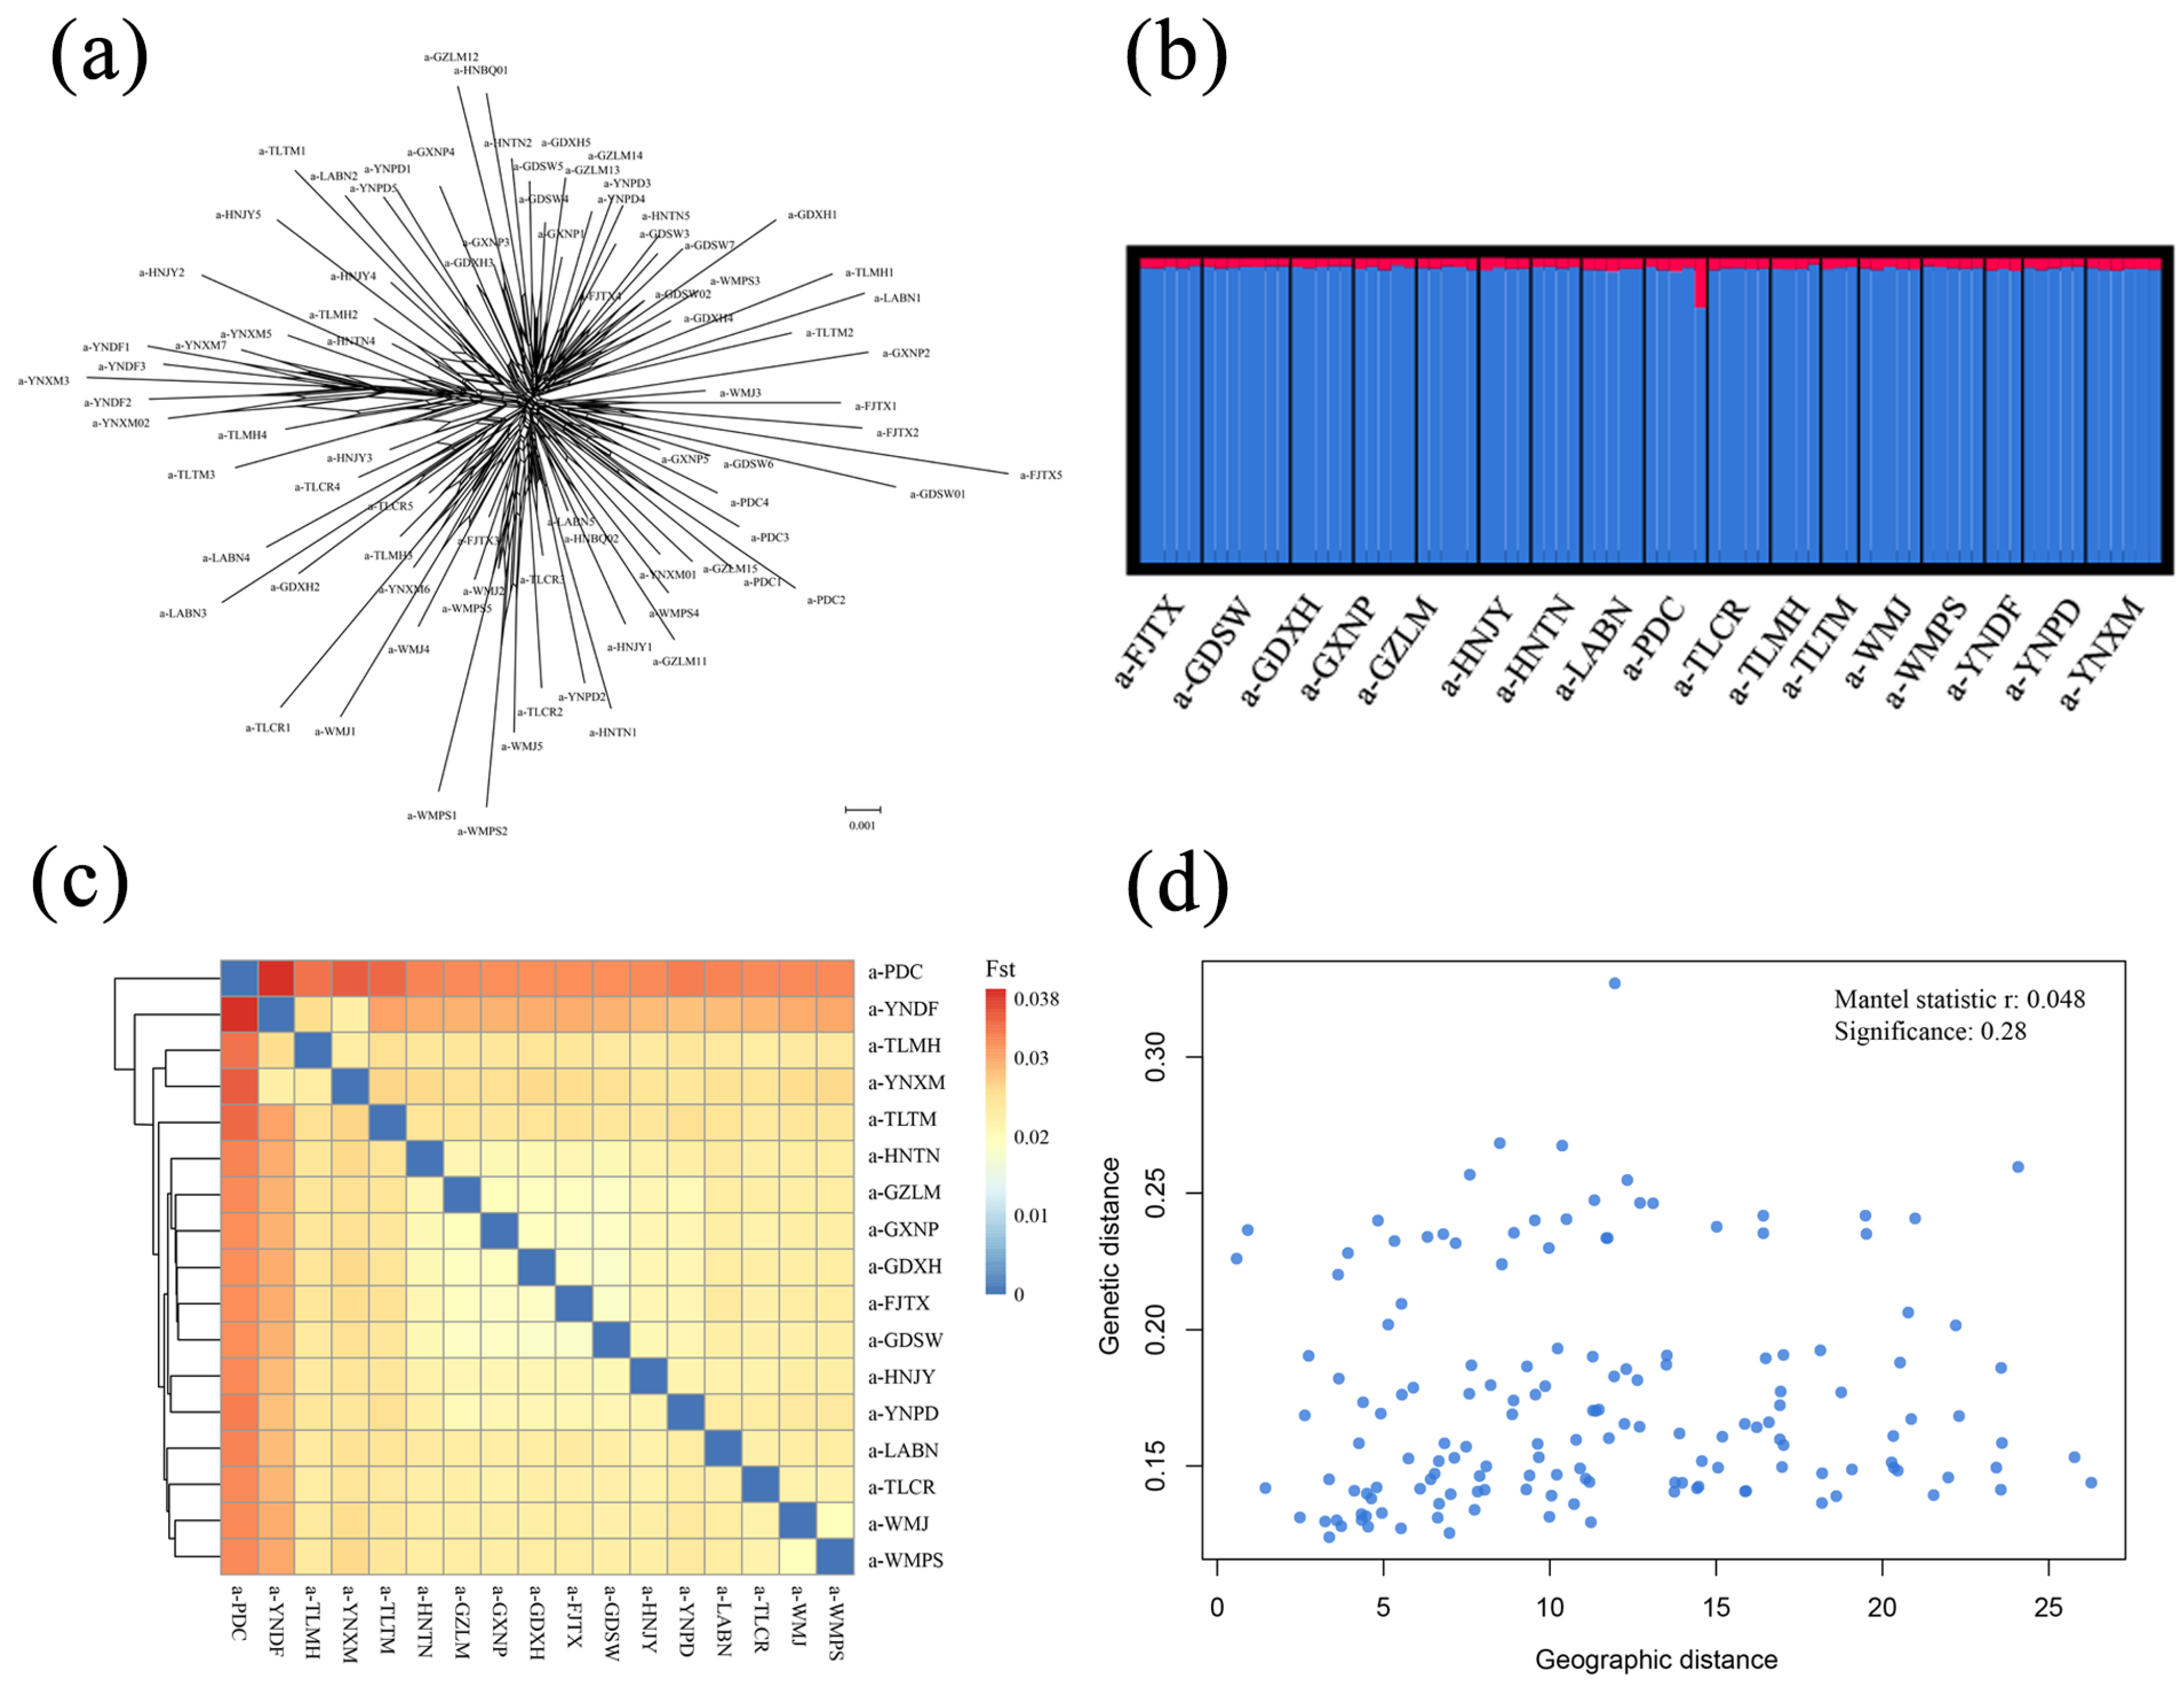
We obtained a total of 615,464,758 reads, with an average of 7,415,238 demultiplexed reads per specimen after removing low-quality reads (Table S1). Genetic diversity was calculated for populations containing more than 3 samples. The populations showed similar levels of nucleotide diversity (π), ranging from 0.0208 to 0.0241 (Table 1). The average expected and observed heterozygosity per locus were calculated (HE ranged from 0.2521 to 0.4138, and Ho ranged from 0.2165 to 0.3660) (Table 1). The Neighbor-Net tree did not show significant population subgroups based on the ddRAD dataset (Figure 2a). The pairwise Fst showed little genetic differentiation among populations (ranging from 0.0183 to 0.0387; Figure 2c; Table S2). And the level of gene flow exceeds the threshold (Nm > 1), which also indicates gene flow between these populations (Figure S1, Nm ranged from 6.2037 to 13.4270), at which the rates of gene flow could offset population differentiation [29]. For population genetic structure, the Bayesian cluster analysis showed the best K = 2 (Figure S2), and all geographic populations contained similar genetic components (Figure 2b). Our IBD test indicated no significant correlations between genetic differentiation (FST)/(1 − FST) and geographical distances (r = 0.048, p = 0.28) among populations (Figure 2d). The stairway plot analysis suggested that the effective population size (Ne) of L. acuta increased rapidly during the last glacial maximum (LGM, ~25–19 kya) [42] (Figure S3).

3.2. The Current and Future Potentially Suitable Areas for L. acuta

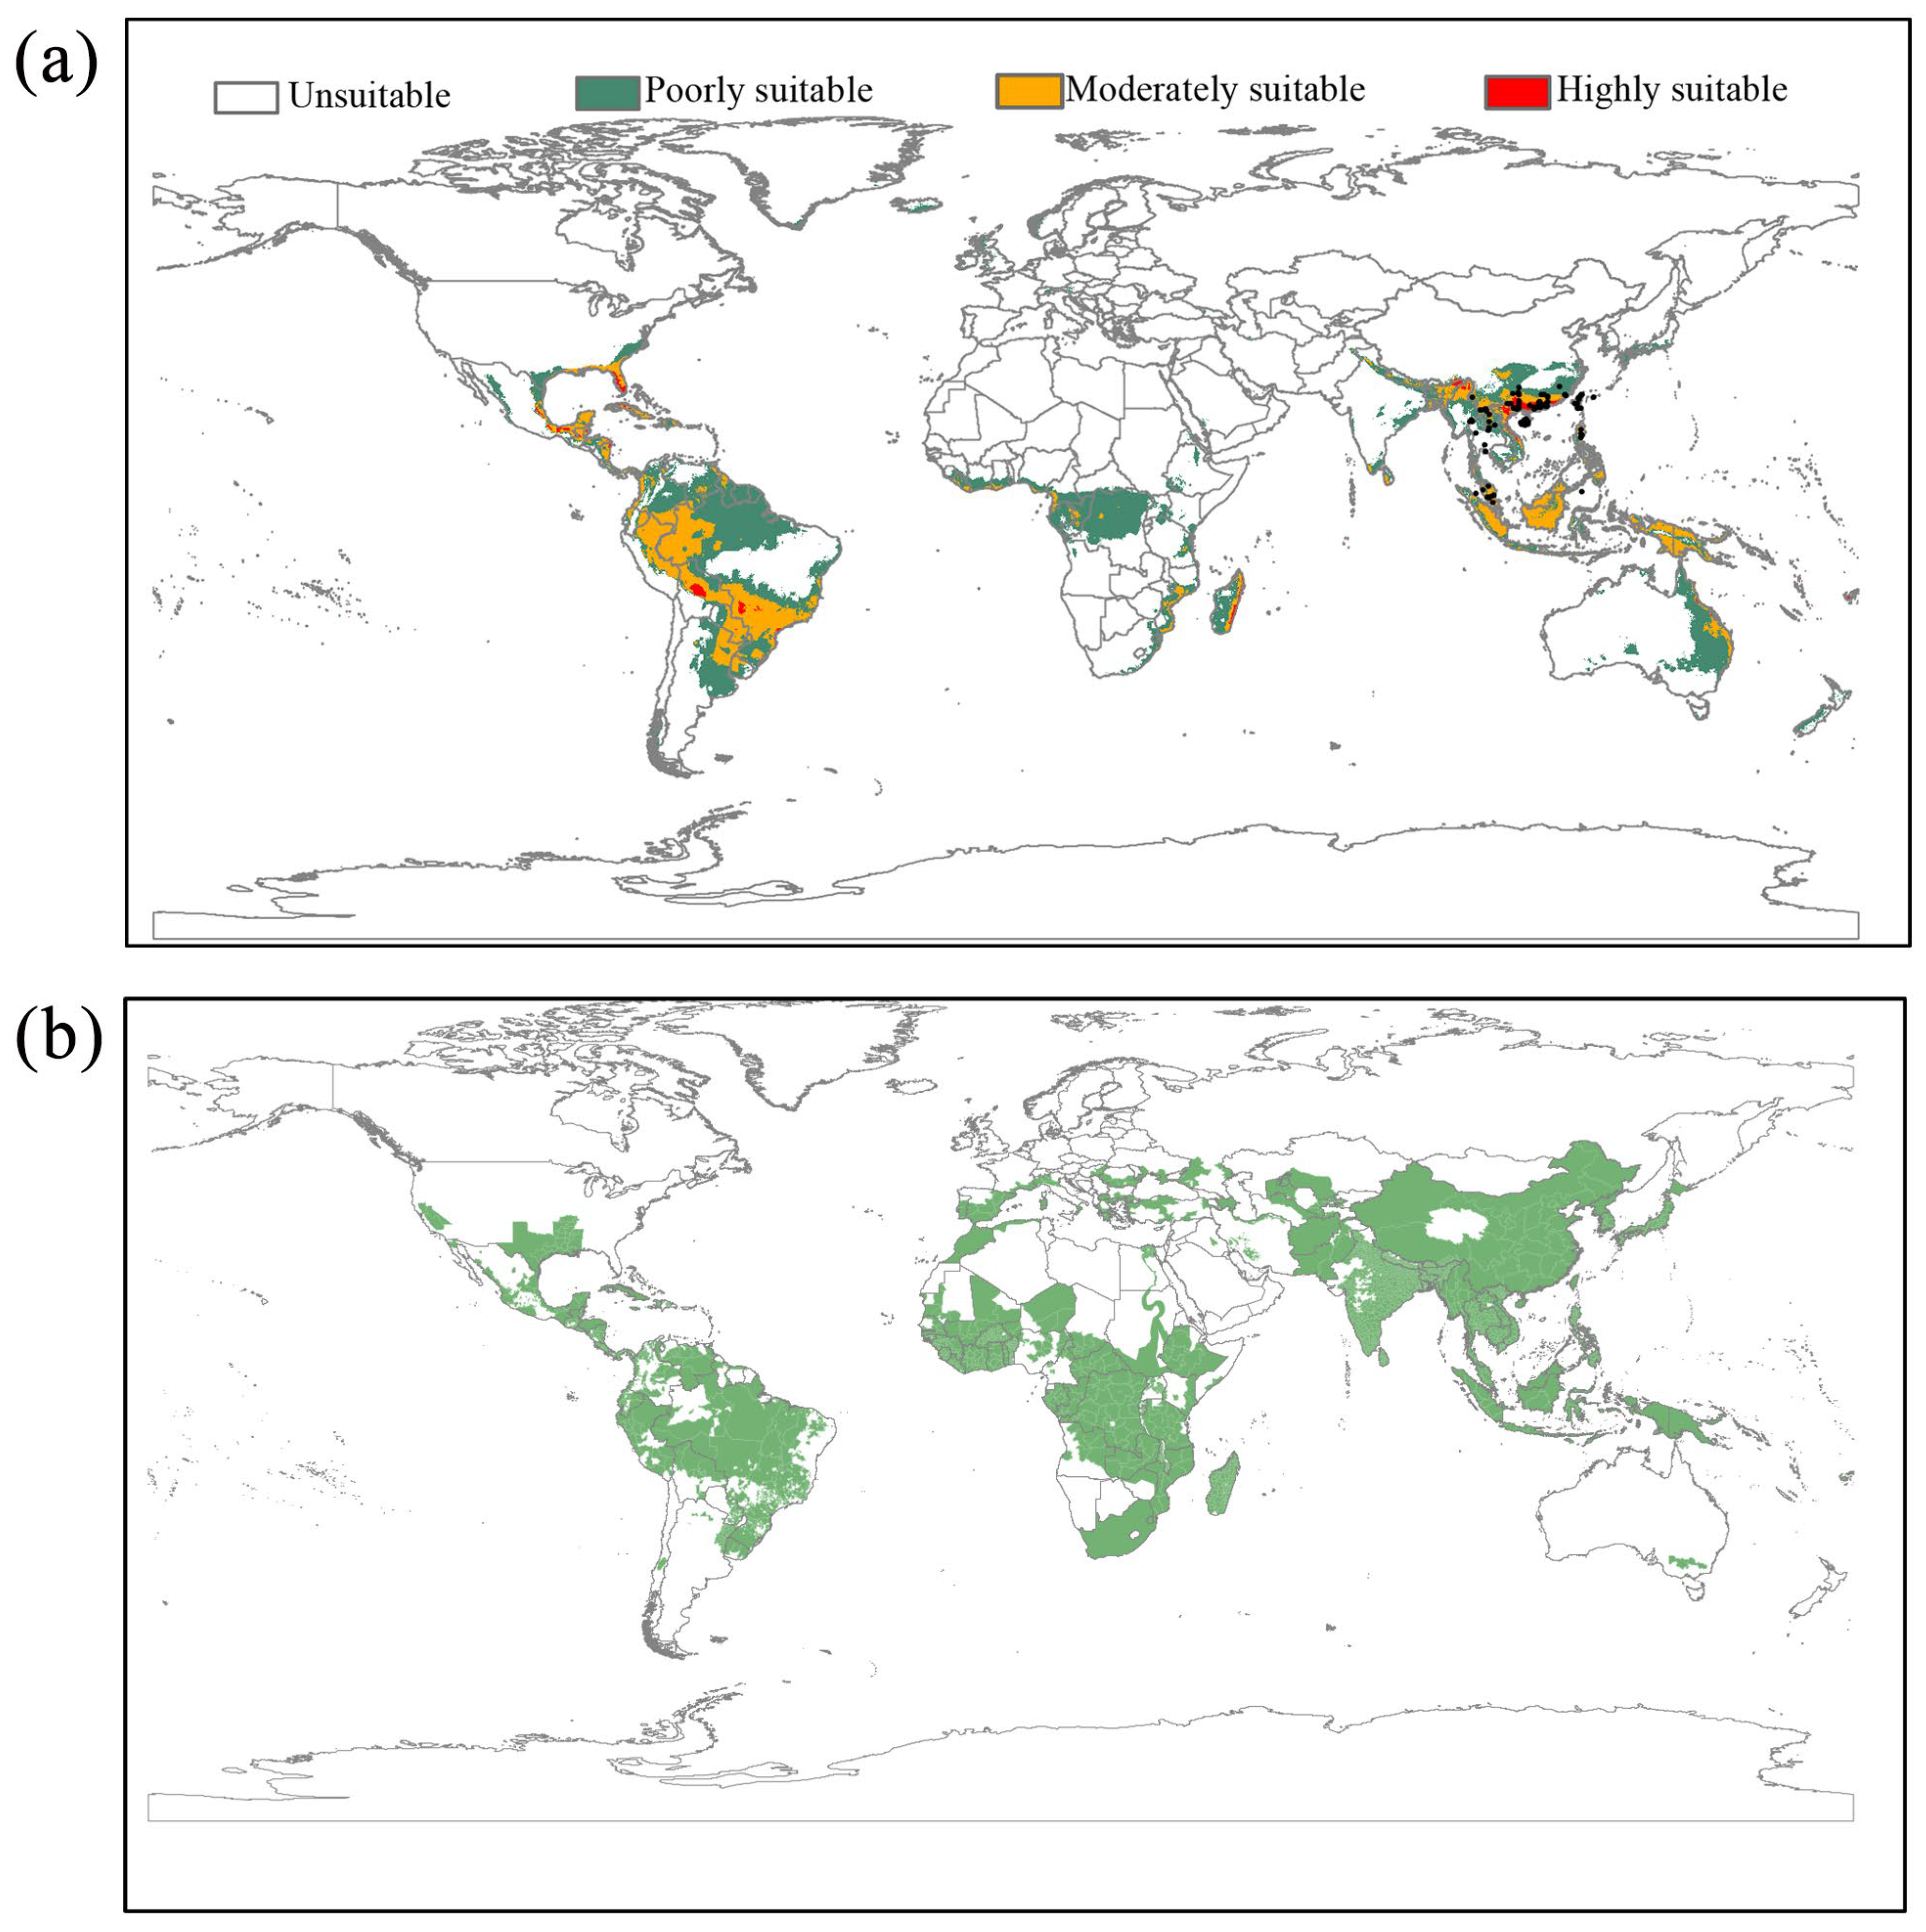
According to Pearson’s correlation coefficient and contributions of variable (Table S3), seven environmental variables (BIO2, BIO4, BIO5, BIO8, BIO12, BIO14, and BIO18) were selected for the modeling. The response curves of environmental curves are shown in Figure S4. The parameter combination of FC = H and RM = 4 was chosen to calibrate the habitat suitability model in MaxEnt. A model with an AUC > 0.8 indicates good model performance [43]. The logistic output generated by MaxEnt can be interpreted as an estimate of the relative probability of species distribution in geographical space, with values that vary from 0 (lowest probability) to 1 (highest probability) [36]. The map with current habitat suitability scores for L. acuta at the global scale is shown in Figure 3. According to the threshold of MTSPS (0.198), the current distribution model of L. acuta indicates suitable areas in North America (east coast of the United States, the coastal regions of Mexico), Central American and Caribbean countries, broad regions of South America, and parts of Africa (coastal and central regions) (Figure 3a). Although L. acuta has not yet been reported anywhere other than Asia and the Oceanic countries, the niche model indicates favorable climatic conditions in these locations.
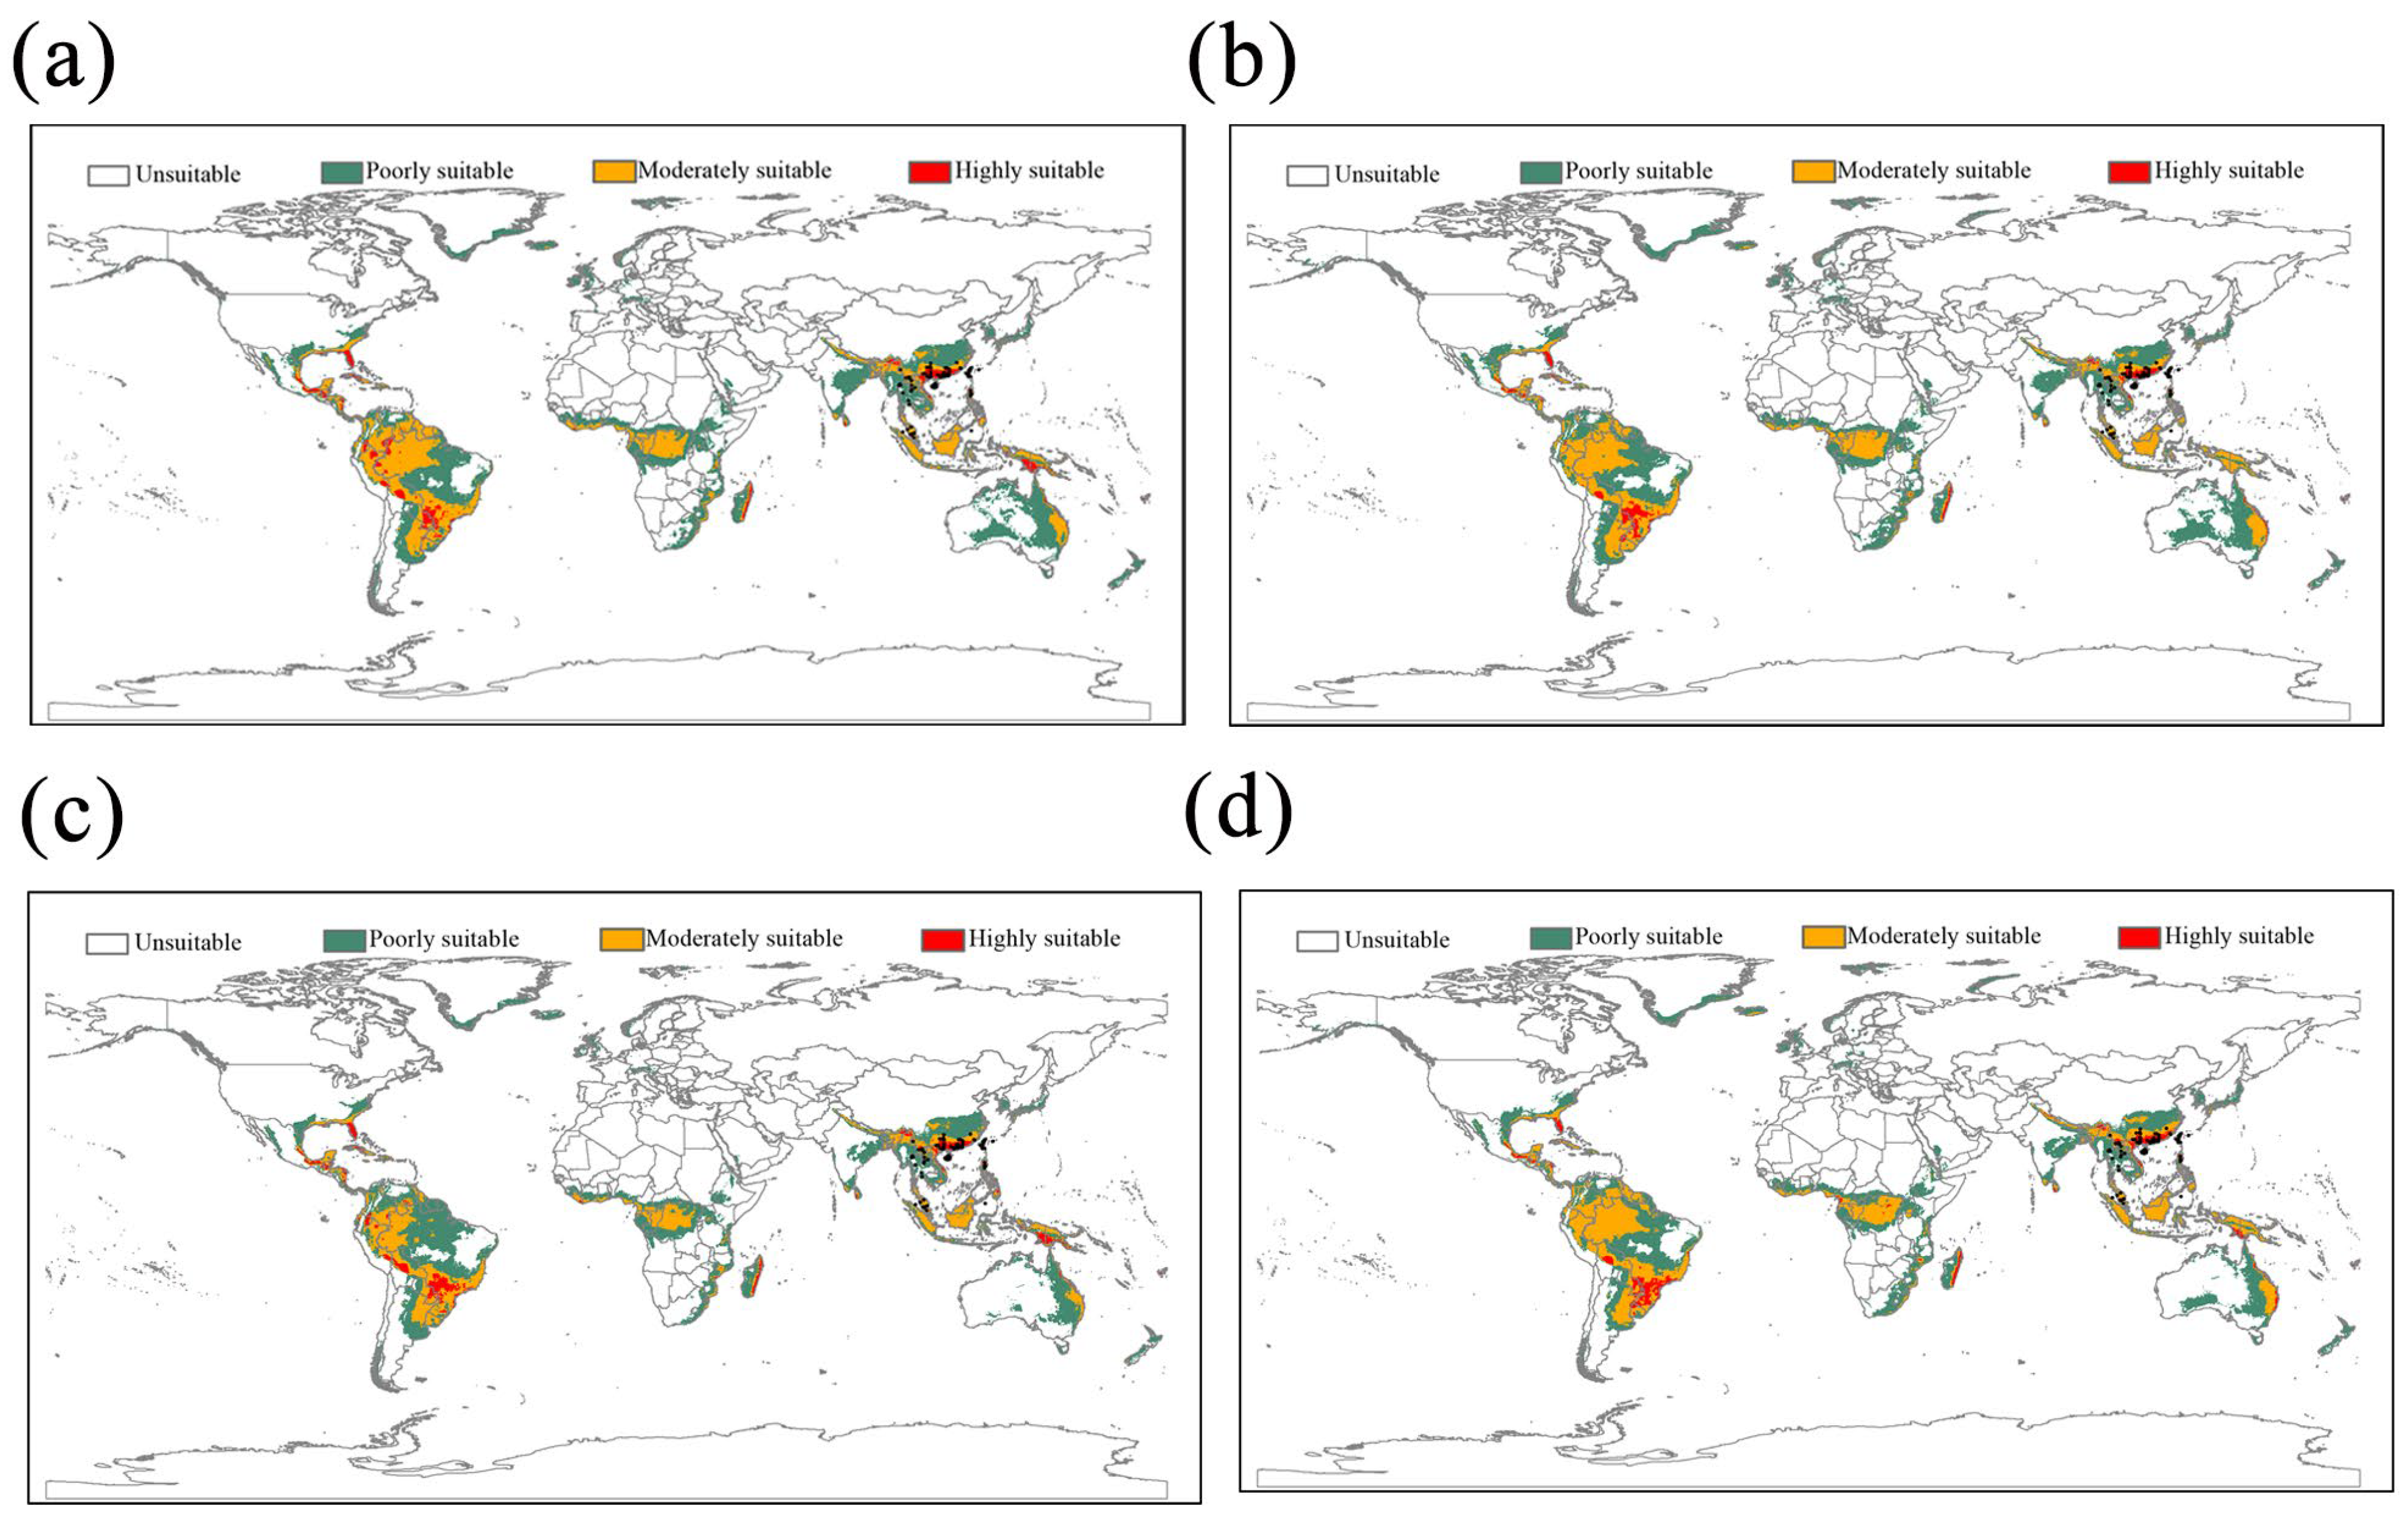
For future ecological modeling, MaxEnt analyses were accurate for both SSP scenarios (mean AUC of 0.833 [±0.08]). The suitable areas for L. acuta will expand northward in Asia, and the predicted suitable areas in America will also expand under the two climate change scenarios (Figure 4). Moreover, the areas with moderate and high suitability will increase in the Americas, primarily located in the United States (mainly Florida and nearby areas), Central American and Caribbean countries, and wide regions of South America (Figure 4). Rice crops are grown in many countries around the world, and are widely distributed in Asia, Europe, Central and South America, Africa, and Oceania (Figure 3b). Under current and future climate conditions, the suitable habitats of L. acuta overlap considerably with areas of rice cultivation.

4. Discussion

4.1. Genetic Diversity and Population Genetic Structure

Rice domestication had an enormous impact on the people of East, Southeast, and South Asia [44]. Accurate analysis of the genetic structure of a rice pest is of great importance for understanding the pest’s evolutionary history and implementing pest control strategies. To our knowledge, our study is the first to use a genome-wide SNPs to resolve the genetic relationships among populations of L. acuta in China and Southeast Asia, the major rice-producing countries. Studies have shown that analyzing thousands of markers provides a fine-scale resolution in the measurement of genetic differentiation among populations [45,46,47].
We conducted genetic diversity statistics to find the variation trend of genetic diversity in the populations. Recently colonized populations may possess decreased genetic diversity, heterozygosity and genetic differentiation [48,49,50,51]. However, no decreased trend among statistics was observed in our analyses (Table 1). Neighbor-net tree, Structure and FST analyses based on the nuclear SNPs datasets revealed low genetic differentiation, no obvious population subgroups and homogeneous genetic components within species may be due to frequent interpopulation gene flow (Figure 2). Furthermore, Nm estimates indicated that high levels of gene flow among populations in China and Southeast Asia were insufficient to prevent population differentiation under migration–drift equilibrium. One of our most surprising results is the finding that the distant oceanic islands of the Philippines have homogeneous genetic component with mainland China (Figure 2b). Most island populations are monophyletic and early-divergent populations with deep genetic structures [52]. However, no subgroups could occur in species with very recent diversification and long-term gene flow between populations across this region, though we have indeed found more apparent genetic differentiation between the Philippines islands (the population a-PDC) and other populations than other combinations of L. acuta (Figure 2c). Despite the fact that the collected samples span a period of 10 years, the genetic diversity of the population did not show an association with earlier or later sampling times, indicating this time span is relatively short in the evolutionary history of species and is not enough to have an impact on genetic diversity.
L. acuta has a high flight ability and can disperse long distances to find rice in flower [14,53]. Migration usually increases gene flow and reduces genetic differentiation among populations [54,55,56,57]. The presence of alternative hosts within the dispersal distance of adults sustained high adult populations between rice crops [53]. Strong dispersal ability, extensive host use, and large effective population size also affect the lack of population genetic structure. In addition, the population expansion of L. acuta was not strongly affected by the LGM (Figure S3), which is consistent with studies of multiple species in East Asia [58,59,60]. In East Asia, many species grew steadily throughout the LGM, as environmental changes appeared to be moderate during the climate oscillations [61].

4.2. Potentially Suitable Habitat and Invasion Areas

The availability of shared information systems around the world makes it easier to obtain information on the geographical distribution of several organisms [62]. For those species that have historically attracted attention, there are many experts in the world, so the occurrence and distribution data shared in the databases are reliable. In our study, we integrated occurrence records to perform global niche modeling of L. acuta based on bioclimatic variables. In Asia, the predicted currently suitable habitat covers a vast geographic range, including most rice cultivation regions, showing identical or larger distribution scales than those in taxonomic studies [4,53,63]. The modeling results showed that there are potentially suitable regions in North America (notably the east coast of the United States and the coastal regions of Mexico), Central American and Caribbean countries, and wide regions of South America and Africa (coastal and central regions) (Figure 3a). The models show that suitable habitats will expand for projections of climate change scenarios by the 2050s and 2070s (Figure 4, Figure S5). In particular, the moderately and highly suitable areas will increase in America (Figure 4). The ecological niche results demonstrated that L. acuta is a potentially invasive pest to the United States (mainly Florida and nearby areas). Due to the large acreage of rice grown in America (Figure 4b), we call for vigilance against the invasion of this pest. The results also suggest that global warming may affect the distributions of insects depending on their ecological needs.

4.3. Implications for Management

Rice is one of the most important foods in the world, providing a major source of energy for more than half of the world’s population and playing a substantial role in the global economy [64]. L. acuta has attracted wide attention for its reported high economic yield losses in many countries [17,65,66]. Our study revealed the phylogeography and invasion risk of L. acuta by population genetics and ecological modeling approaches. Their high dispersal ability, wide host use, and large population size make L. acuta a difficult pest to fully control. L. acuta was more abundant in rice-growing areas surrounded by alternative grass hosts for several generations before rice flowering [13]. Thus, controlling the surrounding weeds will have some effect on reducing this pest. In addition, we suggest that attention should be given to preventing the invasion of L. acuta due to the observed increase in moderately and highly suitable areas in America. The definition of habitat suitability levels could provide insights into making priority areas of pest control. In particular, some South American countries have large rice crops and suitable habitats that may indicate a higher invasion risk.

4.4. Integrated Conclusions

By combining evidence from population genetics, demographic history, and ecological niche modeling, our study provides an integrated understanding of the invasion potential of L. acuta. The genetic analyses revealed low levels of differentiation and homogeneous genetic components among populations, which can be attributed to strong dispersal ability, frequent gene flow, and wide host use. Demographic inference suggested that populations were not strongly affected by the Last Glacial Maximum, indicating historical stability and persistence of large effective population size. Together, these findings are consistent with the species’ high capacity for dispersal and colonization. Ecological niche modeling further demonstrated that, under current and future climate scenarios, L. acuta has potentially suitable habitats far beyond its present distribution, particularly in the Americas and Africa, where rice is extensively cultivated. Taken together, these results highlight the high invasion risk posed by L. acuta and emphasize the need for vigilance and preventive strategies in regions with expanding suitable habitats.

Supplementary Materials

The following supporting information can be downloaded at https://www.mdpi.com/article/10.3390/insects16090949/s1. Figure S1: The heat map of interpopulation gene flow; Figure S2: The K values by Structure Harvester; Figure S3: Historical demographic changes; Figure S4: The response curves of each environmental variable; Figure S5: The predicted suitable area of Leptocorisa acuta; Table S1: Reads number of per sample generated by ddRAD-seq; Table S2: Pairwise genetic differentiation statistics (FST); Table S3: The relative contributions of the environmental variables.

Author Contributions

X.D.: Conceptualization; investigation; methodology; data curation; formal analysis; writing—review and editing; writing—original draft. X.Z.: methodology; investigation; writing—original draft. Z.T.: Conceptualization; formal analysis; investigation. W.Y.: methodology; investigation. W.B.: Conceptualization; Validation; writing—review and editing; funding acquisition. All authors have read and agreed to the published version of the manuscript.

Funding

This research was supported by the National Natural Science Foundation of China (32130014, 31820103013).

Data Availability Statement

The raw reads are available at the Sequence Read Archive (SRA) of NCBI under the BioProject accession number PRJNA1026486.

Conflicts of Interest

The authors declare no conflicts of interest.

References

  1. Huang, X.; Kurata, N.; Wei, X.; Wang, Z.X.; Wang, A.; Zhao, Q.; Zhao, Y.; Liu, K.; Lu, H.; Li, W.; et al. A map of rice genome variation reveals the origin of cultivated rice. Nature 2012, 490, 497–501. [Google Scholar] [CrossRef] [PubMed]
  2. Kalshoven, L.G.E.; Laan, P.A. Pests of Crops in Indonesia; P.T. Ichtian Bann-Van Hoeve: Jakarta, Indonesia, 1981. [Google Scholar]
  3. Litsinger, J.; Gyawali, B.; Wilde, G. Feeding behaviour of the rice bug Leptocorisa oratorius (F.) (Hemiptera: Alydidae). J. Plant Prot. Trop. 1998, 11, 23–35. [Google Scholar]
  4. Ahmad, I. The Leptocorisinae (Heteroptera: Alydidae) of the world. Bulletin of the British Museum of Natural History, 19 October 1965; Volume 5, (Entomological Supplement). [Google Scholar]
  5. Hasegawa, H. Distribution and taxonomy of rice bugs in Southeast Asia. Trop. Agric. 1971, 5, 229–234. [Google Scholar]
  6. Halteren, P.v.; Sama, S. Damage caused by the rice bug Leptocorisa acuta in South Sulawesi, Indonesia. Rice Entomol. Newsl. 1976, 4, 34. [Google Scholar]
  7. Velusamy, R.; Janaki, I.P.; Jayaraj, S. Control of rice gundhi bug, Leptocorisa acuta (Thunberg) (Coreidae, Hemiptera). Madras Agric. J. 1977, 64, 274. [Google Scholar]
  8. Chen, Z. The occurence sic of Leptocorisa acuta Thunberg and its control. Entomol. Knowl. 1992, 29, 328–331. [Google Scholar]
  9. Schaefer, C.W.; Panizzi, A.R. Heteroptera of Economic Importance, 1st ed.; CRC Press: Boca Raton, FL, USA, 2000. [Google Scholar] [CrossRef]
  10. Sen, A.C.; Chaudhuri, D.P. Incidence of rice gundhy bug and steps for its control. Indian J. Entomol. 1961, 21, 287–288. [Google Scholar]
  11. Banerjee, P.K.; Chatterjee, P.B. Pests of hill rice in West Bengal, India. Int. Rice Res. Newsl. 1982, 7, 12–14. [Google Scholar]
  12. Corbett, G.H. The Bionomics and Control of Leptocorisa acuta Thunb. with Notes on Other Leptocorisa spp. in Malaya; Department of Agriculture S.S. & F.M.S.: Quezon City, Philippines, 1930; pp. 40–42. [Google Scholar]
  13. Sands, D.P.A. The Biology and Ecology of Leptocorisa (Hemiptera: Alydidae) in Papua New Guinea; Research Bulletin, Department of Primary Industry: Port Moresby, New Guinea, 1977; p. 104. [Google Scholar]
  14. Rothschild, G.H.L. Some notes on the effects of rice ear-bugs on grain yields. Trop. Agric. 1970, 47, 145–149. [Google Scholar]
  15. Mohiuddin, M.S.; Rao, Y.P.; Mohan, S.K.; Verma, J.P. Role of Leptocorisa acuta Thun. in the spread of bacterial blight of rice. Curr. Sci. 1976, 45, 426–427. [Google Scholar]
  16. Lakshmanan, P.; Mohan, S.K.; Velusamy, R. Role of earhead bug (Leptocorisa acuta) feeding on sheath rot disease caused by Sarocladium oryzae in Oryza sativa in India. Phytoparasitica 1992, 20, 107–112. [Google Scholar] [CrossRef]
  17. Vivekananthan, R.; Rabindran, R. Endorsement of factors associated with the development of sheath rot pathogen in rice. Madras Agric. J. 2008, 95, 61–70. [Google Scholar]
  18. Uichanco, L. The rice bug, Leptocorisa acuta Thunberg, in the Philippines. Philipp. Agric. Rev. 1921, 14, 87–112. [Google Scholar]
  19. Kay, I.R.; Brown, J.D.; Mayer, R.J. Insecticidal control of Eysarcoris trimaculatus (Distant) (Heteroptera: Pentatomidae) and Leptocorisa acuta (Thunberg) (Heteroptera: Alydidae) on rice in north Queensland, Australia. Crop Prot. 1993, 12, 310–314. [Google Scholar] [CrossRef]
  20. Pathak, M.D.; Khan, Z.H. Insect Pests of Rice; International Rice Research Institute (IRRI): Los Banos, Philippines, 1994; pp. 37–38. [Google Scholar]
  21. Reynolds, D.; Mukhopadhyay, S.; Riley, J.; Das, B.; Nath, P.; Mandal, S. Seasonal variation in windborne movement of insect pests over northeast India. Int. J. Pest Manag. 1999, 45, 195–205. [Google Scholar] [CrossRef]
  22. Laborte, A.G.; Gutierrez, M.A.; Balanza, J.G.; Saito, K.; Zwart, S.J.; Boschetti, M.; Murty, M.V.R.; Villano, L.; Aunario, J.K.; Reinke, R.; et al. RiceAtlas, a spatial database of global rice calendars and production. Sci. Data 2017, 4, 170074. [Google Scholar] [CrossRef] [PubMed]
  23. Peterson, B.K.; Weber, J.N.; Kay, E.H.; Fisher, H.S.; Hoekstra, H.E. Double digest RADseq: An inexpensive method for de novo SNP discovery and genotyping in model and non-model species. PLoS ONE 2012, 7, e37135. [Google Scholar] [CrossRef] [PubMed]
  24. Eaton, D.A.R.; Overcast, I. ipyrad: Interactive assembly and analysis of RADseq datasets. Bioinformatics 2020, 36, 2592–2594. [Google Scholar] [CrossRef]
  25. Excoffier, L.; Lischer, H.E. Arlequin suite ver 3.5: A new series of programs to perform population genetics analyses under Linux and Windows. Mol. Ecol. Resour. 2010, 10, 564–567. [Google Scholar] [CrossRef]
  26. Goudet, J.; Jombart, T. R package, version 0.04-22; Hierfstat: Estimation and Tests of Hierarchical F-Statistics. 2015. Available online: https://github.com/jgx65/hierfstat (accessed on 9 September 2024).
  27. Wright, S. Evolution and the genetics of populations. In Experimental Results and Evolutionary Deductions; University of Chicago Press: Chicago, IL, USA, 1984. [Google Scholar]
  28. Slatkin, M. Gene flow and the geographic structure of natural populations. Science 1987, 236, 787–792. [Google Scholar] [CrossRef]
  29. Huson, D.H.; Bryant, D. Application of phylogenetic networks in evolutionary studies. Mol. Biol. Evol. 2006, 23, 254–267. [Google Scholar] [CrossRef]
  30. Pritchard, J.K.; Stephens, M.; Donnelly, P. Inference of population structure using multilocus genotype data. Genetics 2000, 155, 945–959. [Google Scholar] [CrossRef] [PubMed]
  31. Earl, D.A.; vonHoldt, B.M. Structure Harvester: A website and program for visualizing Structure output and implementing the Evanno method. Conserv. Genet. Resour. 2011, 4, 359–361. [Google Scholar] [CrossRef]
  32. Evanno, G.; Regnaut, S.; Goudet, J. Detecting the number of clusters of individuals using the software Structure: A simulation study. Mol. Ecol. 2005, 14, 2611–2620. [Google Scholar] [CrossRef] [PubMed]
  33. Jombart, T. Adegenet: A R package for the multivariate analysis of genetic markers. Bioinformatics 2008, 24, 1403–1405. [Google Scholar] [CrossRef] [PubMed]
  34. Liu, X.; Fu, Y.X. Exploring population size changes using SNP frequency spectra. Nat. Genet. 2015, 47, 555–559. [Google Scholar] [CrossRef]
  35. Phillips, S.J.; Anderson, R.P.; Schapire, R.E. Maximum entropy modeling of species geographic distributions. Ecol. Model. 2006, 190, 231–259. [Google Scholar] [CrossRef]
  36. Elith, J.; Graham, C.H.; Anderson, R.P.; Dudík, M.; Ferrier, S.; Guisan, A.; Hijmans, R.J.; Huettmann, F.; Leathwick, J.R.; Lehmann, A.; et al. Novel methods improve prediction of species’ distributions from occurrence data. Ecography 2006, 29, 129–151. [Google Scholar] [CrossRef]
  37. Wisz, M.S.; Hijmans, R.J.; Li, J.; Peterson, A.T.; Graham, C.H.; Guisan, A.; NCEAS Predicting Species Distributions Working Group. Effects of sample size on the performance of species distribution models. Divers. Distrib. 2008, 14, 763–773. [Google Scholar] [CrossRef]
  38. Kass, J.M.; Vilela, B.; Aiello-Lammens, M.E.; Muscarella, R.; Merow, C.; Anderson, R.P. Wallace: A flexible platform for reproducible modeling of species niches and distributions built for community expansion. Methods Ecol. Evol. 2018, 9, 1151–1156. [Google Scholar] [CrossRef]
  39. Liu, C.; Newell, G.; White, M. On the selection of thresholds for predicting species occurrence with presence-only data. Ecol. Evol. 2016, 6, 337–348. [Google Scholar] [CrossRef] [PubMed]
  40. Xue, Y.; Lin, C.; Wang, Y.; Zhang, Y.; Ji, L. Ecological niche complexity of invasive and native cryptic species of the Bemisia tabaci species complex in China. J. Pest Sci. 2022, 95, 1245–1259. [Google Scholar] [CrossRef]
  41. Guisan, A.; Tingley, R.; Baumgartner, J.B.; Naujokaitis-Lewis, I.; Sutcliffe, P.R.; Tulloch, A.I.; Regan, T.J.; Brotons, L.; Mcdonald-Madden, E.; Mantyka-Pringle, C.; et al. Predicting species distributions for conservation decisions. Ecol. Lett. 2013, 16, 1424–1435. [Google Scholar] [CrossRef]
  42. Clark, P.U.; Dyke, A.S.; Shakun, J.D.; Carlson, A.E.; Clark, J.; Wohlfarth, B.; Mitrovica, J.X.; Hostetler, S.W.; McCabe, A.M. The last glacial maximum. Science 2009, 325, 710–714. [Google Scholar] [CrossRef] [PubMed]
  43. Swets, J.A. Measuring the accuracy of diagnostic systems. Science 1988, 240, 1285–1293. [Google Scholar] [CrossRef]
  44. Gutaker, R.M.; Groen, S.C.; Bellis, E.S.; Choi, J.Y.; Pires, I.S.; Bocinsky, R.K.; Slayton, E.R.; Wilkins, O.; Castillo, C.C.; Negrão, S.; et al. Genomic history and ecology of the geographic spread of rice. Nat. Plants 2020, 6, 492–502. [Google Scholar] [CrossRef]
  45. Emerson, K.J.; Merz, C.R.; Catchen, J.M.; Hohenlohe, P.A.; Cresko, W.A.; Bradshaw, W.E.; Holzapfel, C.M. Resolving postglacial phylogeography using high-throughput sequencing. Proc. Natl. Acad. Sci. USA 2010, 107, 16196–16200. [Google Scholar] [CrossRef]
  46. Rašić, G.; Filipović, I.; Weeks, A.R.; Hoffmann, A.A. Genome-wide SNPs lead to strong signals of geographic structure and relatedness patterns in the major arbovirus vector, Aedes aegypti. BMC Genom. 2014, 15, 275. [Google Scholar] [CrossRef]
  47. Zhou, X.Y.; Ding, Y.; Zhou, J.Y.; Sun, K.K.; Matsukura, K.; Zhang, H.; Chen, L.; Hong, X.; Sun, J. Genetic evidence of transoceanic migration of the small brown planthopper between China and Japan. Pest Manag. Sci. 2022, 78, 2909–2920. [Google Scholar] [CrossRef] [PubMed]
  48. Excoffier, L.; Foll, M.; Petit, R.J. Genetic consequences of range expansions. Annu. Rev. Ecol. Evol. Syst. 2009, 40, 481–501. [Google Scholar] [CrossRef]
  49. Kerdelhué, C.; Zane, L.; Simonato, M.; Salvato, P.; Rousselet, J.; Roques, A.; Battisti, A. Quaternary history and contemporary patterns in a currently expanding species. BMC Evol. Biol. 2009, 9, 220. [Google Scholar] [CrossRef]
  50. Jezkova, T.; Olah-Hemmings, V.; Riddle, B.R. Niche shifting in response to warming climate after the last glacial maximum: Inference from genetic data and niche assessments in the chisel-toothed kangaroo rat (Dipodomys microps). Glob. Change Biol. 2011, 17, 3486–3502. [Google Scholar] [CrossRef]
  51. Zhang, L.; Cai, W.; Luo, J.; Zhang, S.; Li, W.; Wang, C.; Lv, L.; Cui, J. Population genetic structure and expansion patterns of the cotton pest Adelphocoris fasciaticollis. J. Pest Sci. 2017, 91, 539–550. [Google Scholar] [CrossRef]
  52. Ye, Y.J.; Huang, J.P.; Nguyen, H.N.; Villanueva, R.J.T.; Amarga, A.K.S.; Tseng, H.-Y.; Beutel, R. Comparative Phylogeography in the Taiwan–Luzon Volcanic Belt Indicates Fast Diversification History of Pachyrhynchus Weevils (Coleoptera: Curculionidae). Insect Syst. Evol. 2022, 6, 4. [Google Scholar] [CrossRef]
  53. Litsinger, J.A.; Barrion, A.T.; Canapi, B.L.; Libetario, E.M.; Pantua, P.C.; Cruz, C.G.; Apostol, R.; Lumaban, M.D.; Bandon, J.; Macatula, R. Leptocorisa rice seed bugs (Hemiptera: Alydidae) in Asia: A review. Philipp. Entomol. 2015, 29, 1–103. [Google Scholar]
  54. Fu, X.; Liu, Y.; Li, C.; Lu, Y.; Li, Y.; Wu, K. Seasonal migration of Apolygus lucorum (Hemiptera: Miridae) over the Bohai Sea in northern China. J. Econ. Entomol. 2014, 107, 1399–1410. [Google Scholar] [CrossRef] [PubMed]
  55. Endersby, N.M.; Mckechnie, S.W.; Vogel, H.; Gahan, L.J.; Baxter, S.W.; Ridland, P.M.; Weeks, A.R. Microsatellites isolated from diamondback moth, Plutella xylostella (L.), for studies of dispersal in Australian populations. Mol. Ecol. Notes 2005, 5, 51–53. [Google Scholar] [CrossRef]
  56. Lyons, J.I.; Pierce, A.A.; Barribeau, S.M.; Sternberg, E.D.; Mongue, A.J.; De Roode, J.C. Lack of genetic differentiation between monarch butterflies with divergent migration destinations. Mol. Ecol. 2012, 21, 3433–3444. [Google Scholar] [CrossRef]
  57. Chen, M.Z.; Cao, L.J.; Li, B.Y.; Chen, J.C.; Gong, Y.J.; Yang, Q.; Schmidt, T.L.; Yue, L.; Zhu, J.; Li, H.; et al. Migration trajectories of the diamondback moth Plutella xylostella in China inferred from population genomic variation. Pest Manag. Sci. 2021, 77, 1683–1693. [Google Scholar] [CrossRef]
  58. Gao, B.; Yu, L.; Qu, Y.; Song, G.; Dai, C.; Zhang, R.; Yin, Z.; Wang, K.; Gao, X.; Li, S.-H.; et al. An unstructured phylogeographic pattern with extensive gene flow in an endemic bird of south China: Collared finchbill (Spizixos semitorques). Int. J. Mol. Sci. 2011, 12, 3635–3647. [Google Scholar] [CrossRef]
  59. Hu, C.; Pan, T.; Wu, Y.; Zhang, C.; Chen, W.; Chang, Q. Spatial genetic structure and historical demography of East Asian wild boar. Anim. Genet. 2020, 51, 557–567. [Google Scholar] [CrossRef]
  60. Song, G.; Zhang, R.; Machado-Stredel, F.; Alström, P.; Johansson, U.; Irestedt, M. Great journey of Great Tits (Parus major group): Origin, diversification and historical demographics of a broadly distributed bird lineage. J. Biogeogr. 2020, 47, 1585–1598. [Google Scholar] [CrossRef]
  61. Weaver, A.J.; Eby, M.; Fanning, A.F.; Wiebe, E.C. Simulated influence of carbon dioxide, orbital forcing and ice sheets on the climate of the Last Glacial Maximum. Nature 1998, 394, 847–853. [Google Scholar] [CrossRef]
  62. Jetz, W.; McPherson, J.M.; Guralnick, R.P. Integrating biodiversity distribution knowledge: Toward a global map of life. Trends Ecol. Evol. 2012, 27, 151–159. [Google Scholar] [CrossRef] [PubMed]
  63. Hsiao, T.Y.; Ren, S.Z.; Zheng, L.Y. A Handbook for the Determination of the Chinese Hemiptera-Heteroptera; Science Press: Beijing, China, 1977; Volume 1, pp. 268–279. [Google Scholar]
  64. Hamilton, M. When rice shakes the world. In The Importance of the First Grain to World Economic and Political Stability; Advantage Media: Charleston, SC, USA, 2014. [Google Scholar]
  65. Lefroy, H.M. The Rice Bug (Leptocorisa varicornis, Fabr); Memoirs of the Department of Agriculture, Indian Entomology Series; Superintendent of Government Printing: Calcutta, India, 1908; Volume 2, pp. 1–13. [Google Scholar]
  66. Van der Goot, P. De walang sangit (Leptocorisa acuta Thunb) als viand van het rystgewas in Indonesia. Mededelingen van het Algemeen Proefstation voor den Landbouw [The “walang sangit” (rice bug, Leptocorisa acuta Thunb.), a pest of the rice crop in Indonesia.] Communications of the General Agricultural Research Station. (in Dutch, with English summary), Buitenzorg, Java. 1949; p. 66. [Google Scholar]
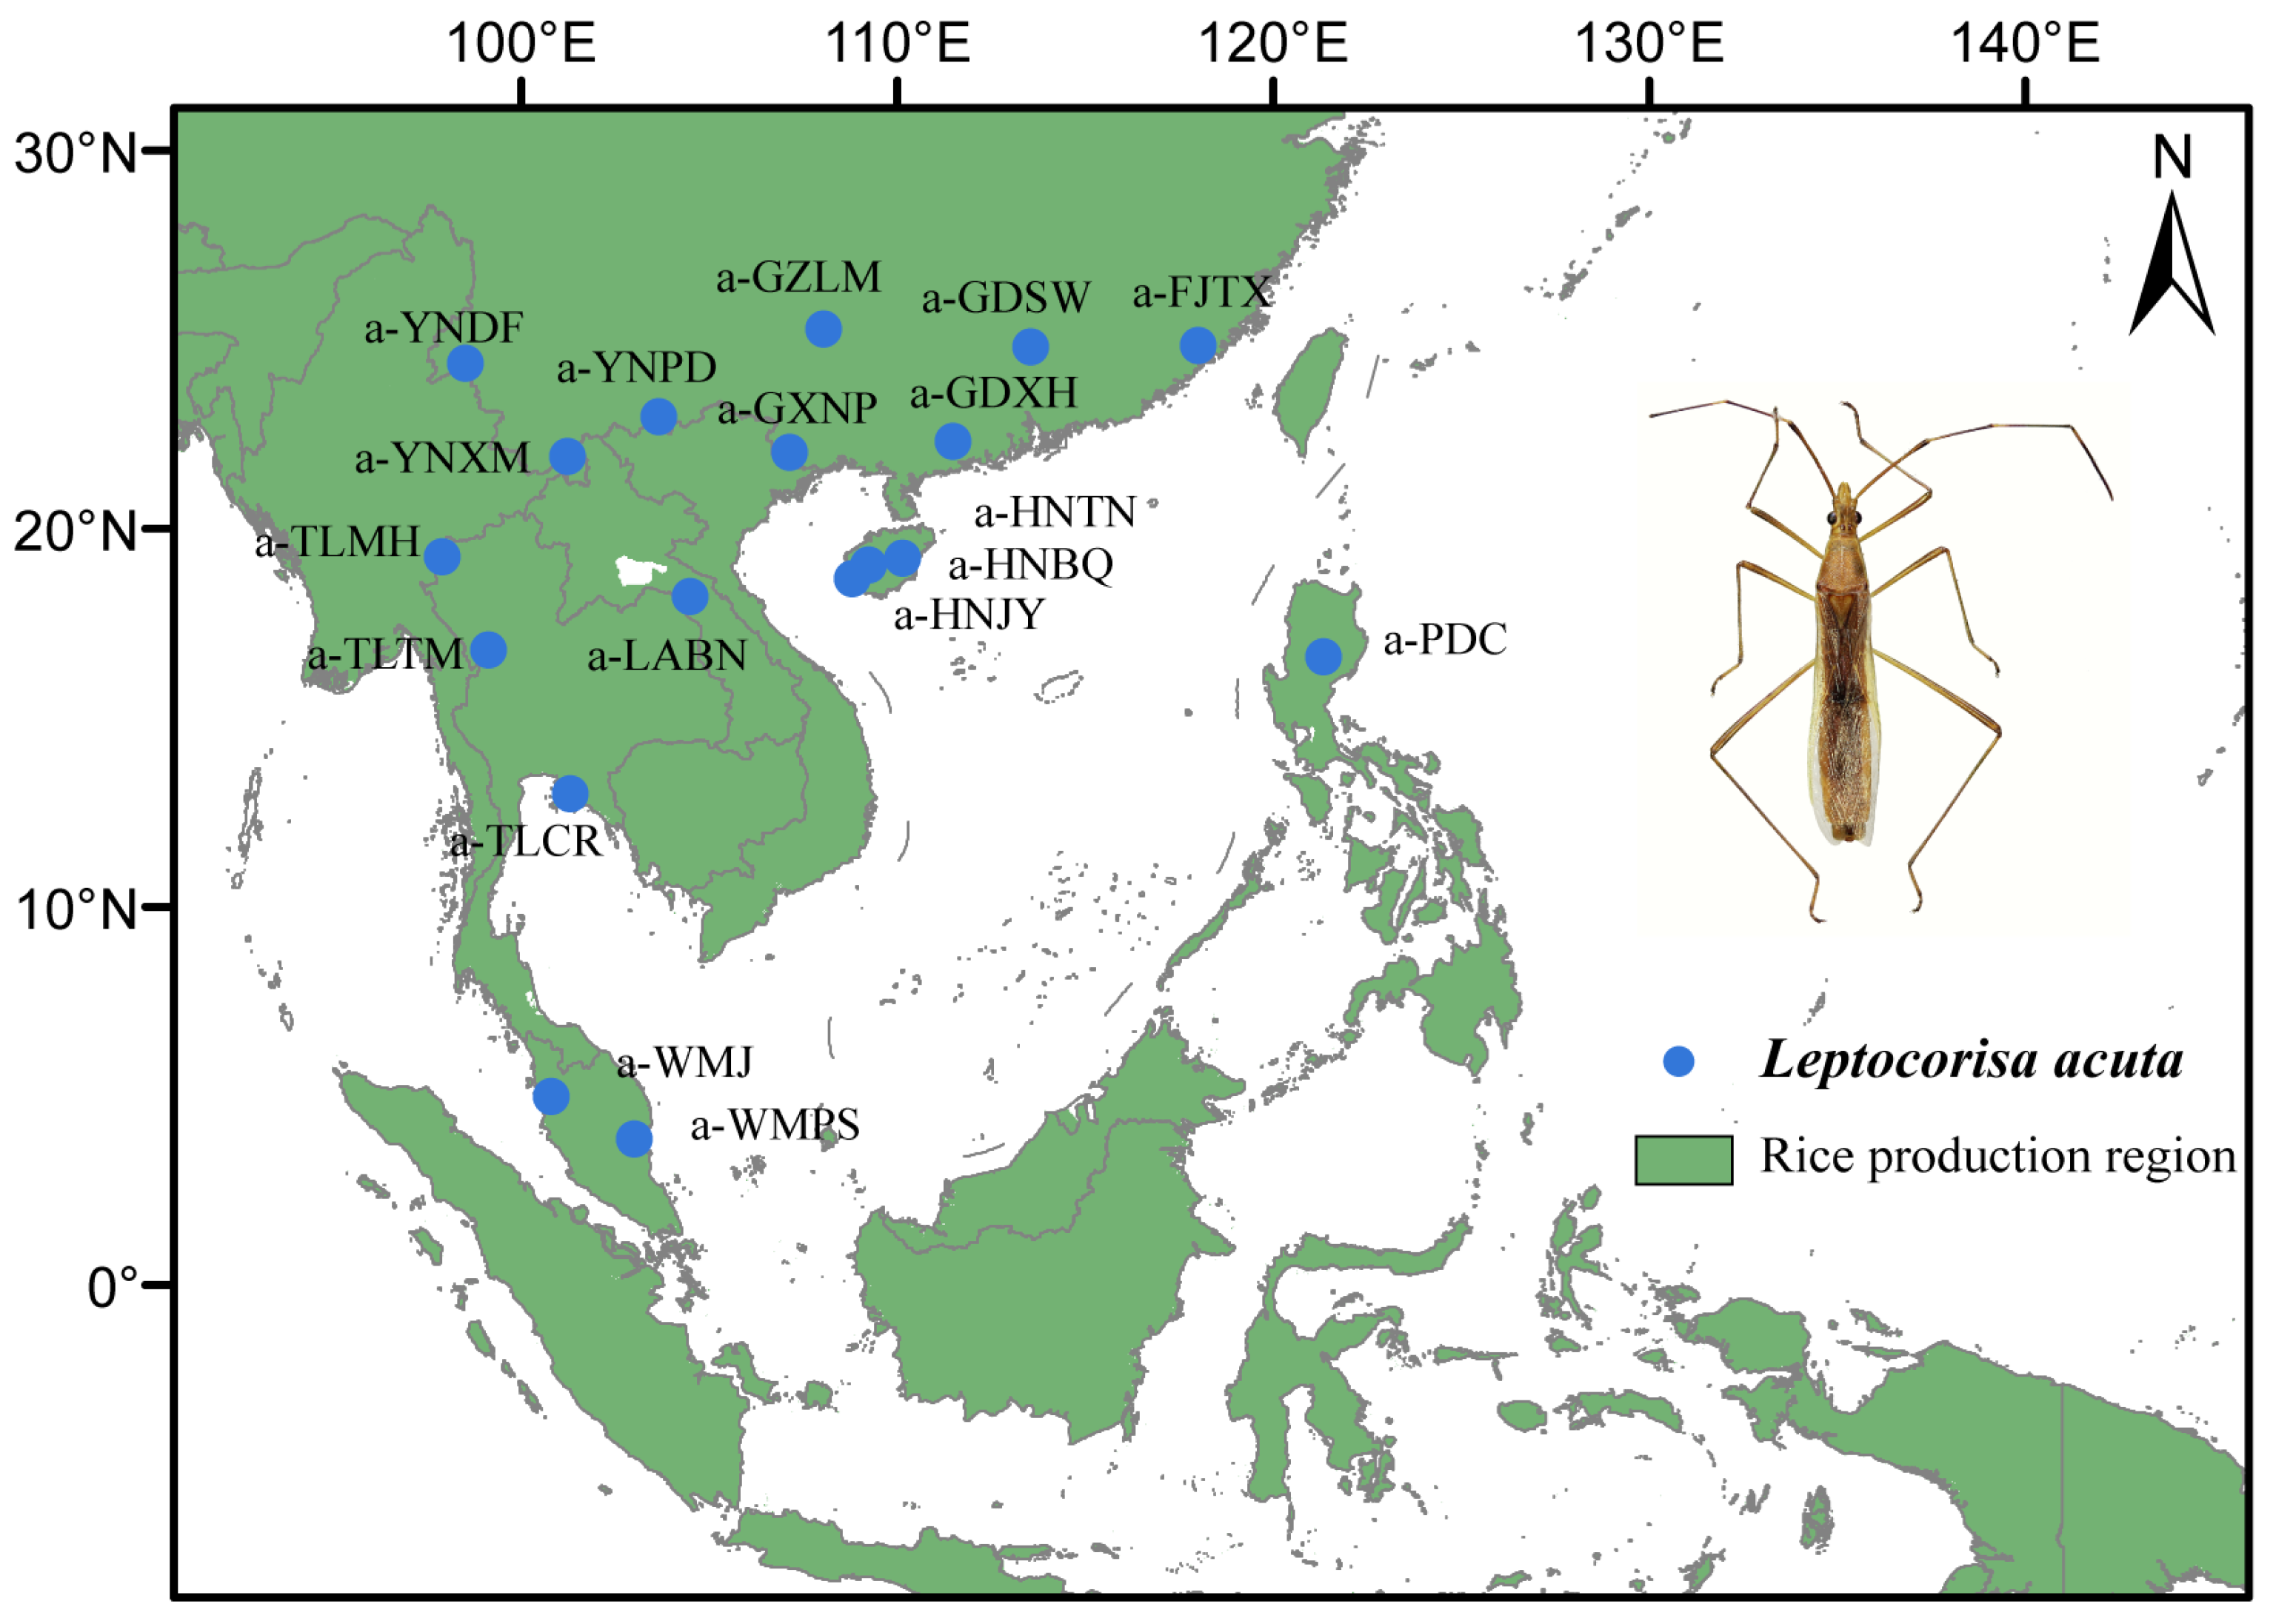
Figure 1. Maps of sampling locations of Leptocorisa acuta used in our study.
Insects 16 00949 g001
Figure 2. Population genetics analysis results based on double-digest restriction site-associated DNA data of Leptocorisa acuta in Asia. (a) Phylogenetic topology based on 174,797 SNPs by the neighbor-net method does not show population subdivision. (b) Bayesian genetic cluster inferred by Structure (K = 2). Each individual is represented by a vertical bar. (c) Pairwise FST values among populations estimated from SNPs. (d) The Mantel test of isolation by distance (IBD) showed the pairwise correlation between genetic and geographic distance among populations of L. acuta.
Insects 16 00949 g002
Figure 3. (a) Modeled habitat suitability of Leptocorisa acuta by the MaxEnt model under current environmental conditions. The black points in the figure represent the occurrence used for modelling. (b) The maps of current worldwide rice (Oryza sativa) distribution and rice-producing regions covered in RiceAtlas.
Insects 16 00949 g003
Figure 4. Modeled habitat suitability of Leptocorisa acuta under future climate conditions for low Shared Socio-economic Pathways (SSP 126) and high (SSP 585) scenarios in the 2050s (a,b) and in the 2070s (c,d) with 83 occurrence records (black points).
Insects 16 00949 g004
Table 1. Summary of the locality information used in ddRAD sequencing analyses and population genetic diversity of Leptocorisa acuta based on the SNP_80 dataset. π, nucleotide diversity; HO, observed heterozygosity; HE, expected heterozygosity.
Pop CodeNCollection DateLongitude (°E)Latitude (°N)SNP_80 Dataset
πHOHE
a-FJTX525 May 2016118.0424.850.02340.24300.2957
a-GDSW72 Aug 2018113.5724.820.02080.35260.3609
a-GDXH517 Jul 2019111.4922.320.02300.25620.2915
a-GXNP512 Aug 2020107.1622.040.02290.25350.2903
a-GZLM59 Aug 2014108.0625.290.02230.25620.2890
a-HNBQ228 Jul 2017109.2719.08
a-HNJY51 Aug 2017108.8218.700.02360.25110.2962
a-HNTN427 Jul 2017110.1719.230.02290.29600.3275
a-LABN511 Aug 2019104.5118.240.02310.25070.2821
a-PDC419 Dec 2019121.3516.630.02240.29070.3374
a-TLCR510 Jul 2018101.3413.030.02280.24490.2849
a-TLMH430 Aug 201897.9319.290.02300.29070.3287
a-TLTM35 Jul 201899.1416.830.02410.34740.4044
a-WMJ513 Apr 2019100.815.010.02240.25200.2876
a-WMPS519 Apr 2019103.033.890.02250.25080.2905
a-YNDF310 Jun 201698.5624.390.02220.36600.4138
a-YNPD54 Aug 2020103.6922.970.02290.24810.2897
a-YNXM625 Aug 2010101.2721.940.02080.21650.2521
Disclaimer/Publisher’s Note: The statements, opinions and data contained in all publications are solely those of the individual author(s) and contributor(s) and not of MDPI and/or the editor(s). MDPI and/or the editor(s) disclaim responsibility for any injury to people or property resulting from any ideas, methods, instructions or products referred to in the content.