Article

Species Delimitation and Cryptic Diversity in Rheotanytarsus Thienemann & Bause, 1913 (Diptera: Chironomidae) Based on DNA Barcoding

by
Yuan Yao
1,2,
Jia-Yu Chen
1,2,
Xiao-Ling Gong
1,
Chen-Hong Li
1,2,
Zheng Liu
3,* and
Xiao-Long Lin
1,2,*
1
Engineering Research Center of Environmental DNA and Ecological Water Health Assessment, Shanghai Ocean University, Shanghai 201306, China
2
Shanghai Universities Key Laboratory of Marine Animal Taxonomy and Evolution, Shanghai Ocean University, Shanghai 201306, China
3
Geological Museum of China, Beijing 100083, China
*
Authors to whom correspondence should be addressed.
Insects 2025, 16(4), 370; https://doi.org/10.3390/insects16040370
Submission received: 12 February 2025 / Revised: 27 March 2025 / Accepted: 28 March 2025 / Published: 1 April 2025
(This article belongs to the Section Insect Systematics, Phylogeny and Evolution)

Simple Summary

The genus Rheotanytarsus consists of small aquatic species valuable as indicators of undisturbed ecosystems. However, morphology-based specimen identification poses challenges, and matching life stages is difficult. This study aimed to improve the understanding of Rheotanytarsus species by combining traditional morphological examination with DNA barcoding, a technique that uses genetic information to distinguish species. We analyzed 911 DNA samples from both newly collected data and screened public databases, inferring that they belong to 69 different species. Our findings show that some species may be cryptic, meaning they are genetically distinct but morphologically similar. This research also provides a clearer framework for identifying these insects across different life stages, which will help in future studies of aquatic ecosystems. By enhancing species identification, our work significantly contributes to biodiversity monitoring and environmental conservation efforts. Specifically, this study improves the ability to track and protect aquatic insect populations, which are vital to ecosystem health and function. Additionally, the findings offer valuable tools for ecosystem management, particularly in assessing the impacts of environmental changes on aquatic biodiversity.

Abstract

The genus Rheotanytarsus Thienemann & Bause, 1913 (Diptera: Chironomidae) currently includes more than 120 recognized species worldwide, but precise species-level identification based solely on morphology remains challenging. Pronounced morphological differences among life stages and the time-consuming inefficiency of rearing larvae further complicate life-stage matching in this genus. In this study, we assessed species diversity by integrating morphological examination and DNA barcoding, analyzing 911 DNA barcodes from newly collected samples and a public database. Based on these results, we further constructed a relatively complete life-history framework. Our results show that 911 Rheotanytarsus DNA barcodes belong to 69 putative species. The maximum intraspecific divergence reached 7.35% in R. pentapoda, and the average minimal interspecific distance was 11.44%. Substantial intraspecific divergence in certain species complexes suggests the presence of cryptic species. Therefore, to resolve these potential cryptic species issues, more extensive sampling and morphological examination of specimens from geographically distant regions—supplemented by nuclear and ecological data—are required.

1. Introduction

The Chironomidae (Diptera) is one of the most abundant groups of aquatic insects in freshwater ecosystems, including over 7000 described species [1,2,3]. Chironomid larvae are widely distributed across rivers, lakes, wetlands, and other aquatic habitats worldwide [4,5,6]. Larvae exhibit a broad dietary spectrum, utilizing resources ranging from coarse particulate organic matter to dissolved organic substances, and play a pivotal role in nutrient cycling and energy transfer, significantly contributing to ecological functions [7,8,9,10,11]. Due to their widespread distribution, high species diversity, and responsiveness to environmental changes, chironomid larvae serve as key indicator organisms for freshwater assessments, playing crucial roles in pollution detection and ecosystem health evaluations [12,13,14]. However, while many chironomid genera have been extensively studied, some remain relatively underexplored, with persistent gaps in their taxonomic and ecological characterizations [15].
The genus Rheotanytarsus Thienemann & Bause, 1913, belonging to the tribe Tanytarsini within Chironominae, is represented by a highly diverse number of species; 120 have been described, distributed across all zoogeographic regions worldwide (except the Antarctic) [16,17,18,19,20,21,22]. Their immature stages predominantly inhabit lotic environments [22]. Notably, several species demonstrate exceptional adaptability to acidic waters, heavy metal contamination, and organic enrichment [20]. In contrast, the larvae of other species are closely associated with high dissolved oxygen levels and low phosphate concentrations, making them reliable indicators of pristine water quality [23]. Rheotanytarsus larvae frequently co-occur with taxa indicative of high-quality water, underscoring their potential as environmental bioindicators [20,22,24,25]. The taxonomy of this genus relies heavily on the morphological characteristics of adult male genitalia—features prone to deformation during slide preparation [19,26,27]—thus limiting the use of immature stages in environmental assessments. Moreover, pronounced morphological differences among life stages complicate the task of matching individuals [20,28], while the time-consuming and low-success rearing of larvae further limits reports on immature stages [22,29]. This hinders the full ecological understanding of the genus and limits its application in biological monitoring programs.
DNA barcoding [30,31] enhances the accuracy of identifying unknown specimens and linking life stages [32,33,34,35,36,37,38,39,40] while complementing traditional morphological methods by addressing limitations in species delimitation based on synapomorphic traits. The creation of a comprehensive barcode reference library further enriches traditional morphology, providing critical insights that deepen our understanding of biodiversity, thereby advancing integrative taxonomy [41,42]. However, issues such as heteroplasmy, nuclear mitochondrial pseudogenes (NUMTs), interspecific hybridization, and incomplete lineage sorting (ILS) limit the application of DNA barcoding in species identification [43,44]. In recent years, multilocus and phylogenomic approaches have gained increasing attention in species identification due to their ability to provide more comprehensive genetic information [45,46,47,48]. Nevertheless, DNA barcoding, as a low-cost and rapid tool, still holds significant value in large-scale preliminary identification and environmental DNA studies [49,50,51,52]. The Barcode of Life Data System (BOLD) [53], accessible at https://www.boldsystems.org/, is the world’s largest DNA barcode reference library. It serves as an essential platform for species data storage and aiding specimen identification [30,31,43,53,54,55]. In fact, DNA barcoding has contributed to taxonomic advances in several problematic taxa within Chironomidae [28,56,57,58,59,60]. Thus, for the genus Rheotanytarsus, for which genetic data are relatively scarce, DNA barcoding serves as an effective tool to enhance taxonomic resolution and facilitate life-history matching. However, research on DNA barcoding within this genus remains limited [61,62], and the quality of publicly available data is inconsistent. Consequently, further standardization is urgently needed to advance taxonomic progress and support its broader application in biodiversity assessments.
This study focuses on the genus Rheotanytarsus, integrating newly collected and publicly available DNA barcodes to address the significant molecular data gap for this genus, offering substantial practical value. This study establishes the following specific objectives: employ DNA barcoding to detect misidentifications and cryptic species potentially overlooked by traditional morphological methods; link larval, pupal, and adult stages to resolve identification challenges for immature stages and accelerate their morphological description; and contribute high-quality, standardized data to the global COI DNA barcode reference library for Rheotanytarsus, supporting subsequent molecular phylogenetic studies and taxonomic revisions. These objectives will provide a robust foundation for ecological applications and taxonomic research on Rheotanytarsus.

2. Materials and Methods

The newly added 157 specimens in this study were collected over the past decade (2008–2022) across multiple provinces in China and Namibia. During the collection process, light traps and sweep nets were used to capture adult stages, while D-nets and drift nets were employed to collect immature stages [58]. Following collection, all specimens were immediately transferred to ethanol (75% for adults, 95% for immatures) and maintained at −4 °C under dark conditions. Over recent years, we have gradually obtained DNA barcodes for all specimens. During this process, to preserve the integrity of specimens for subsequent morphological observations and to prevent DNA cross-contamination, DNA extraction and COI amplification were performed using the legs or thoracic muscles of adult specimens and the thoracic and abdominal muscles of larvae after gut removal. Molecular experiments and sequence processing followed established protocols [28,57,59], and the data were subsequently uploaded to BOLD. All specimens were slide-mounted in Euparal following standard protocols [63], with critical morphological structures preserved for taxonomic identification, morphometric measurements, and detailed descriptions based on established taxonomic revisions [22,64,65]. Partial results of these analyses have been published in prior studies [21,26,61,62,66]. All vouchers were deposited in the College of Fisheries and Life Science, Shanghai Ocean University, Shanghai, China.
In addition to newly acquired data, COI sequences ≥500 bp from BOLD were retained for Rheotanytarsus after excluding sequences with stop codons, BOLD-flagged quality issues, or lacking valid BINs taxonomically assigned to the genus. Data were accessed 18 November 2023. This search included datasets from two recent studies [61,62], totaling 754 sequences. Combined with the 157 newly generated sequences, this brought the total to 911 sequences. All sequences were consolidated and added to a dataset titled “Global Rheotanytarsus COI barcodes (DS-2023RCOI)” in BOLD.
All COI sequences in the dataset were downloaded in sequence page order, and alignment was performed using the BOLD Aligner. Residual primer sequences (e.g., 3′-end ′TGATTTTTT′ motif) were trimmed in Geneious Prime 2024.0.5. (https://www.geneious.com (accessed on 19 November 2024)). Following quality trimming, all retained sequences maintained ≥500 bp length in the core barcode region. Multiple sequence alignment was conducted using MUSCLE 5.1 [67] under default parameters, with the resulting alignment used to construct both Neighbor-Joining (NJ) [68] and Maximum Likelihood (ML) [69] phylogenetic trees. To ensure the robustness of species delimitation results, a combination of pairwise distance-based and phylogeny-based methods was employed. Specifically, ABGD (Automatic Barcode Gap Discovery) [70] and Neighbor-Joining (NJ) [68] analyses were used as distance-based methods, while mPTP [71] and GMYC [72] were applied as phylogeny-based techniques. For the ABGD analysis (https://bioinfo.mnhn.fr/abi/public/abgd/abgdweb.html (accessed on 19 November 2024)), the K2P model [73] was implemented with a relative gap width (X) of 1.0 and prior intraspecific divergence values ranging from 0.005 to 0.1. NJ trees were constructed in MEGA v.11 [74] using K2P distances to ensure comparability with most other DNA barcode studies on insects, with node support evaluated through 1000 bootstrap replicates. For the mPTP analysis, a maximum-likelihood (ML) tree was generated in IQ-TREE v.2.3.6 under the GTR+F+R6 model, exported in Newick format, and analyzed on the mPTP web server (https://mptp.h-its.org/#/tree (accessed on 16 March 2025)) to delimit species. For the GMYC analysis, ultrametric trees were generated in BEAST v. 2.7.6 [75] using a strict clock and HKY substitution model, with an MCMC chain length of 20 million generations. Convergence was verified using TRACER v.1. 7.2 [76], confirming that all effective sample size (ESS) values exceeded 200, validating the reliability of the results. The consensus trees were generated after discarding 10% of trees as burn-in.
Taxonomic nomenclature primarily followed morphologically validated specimens. For the 735 public sequences lacking voucher verification, outdated or invalid names were revised to reflect corresponding morphological taxa based on their clustering with validated clades. Sequences forming composite clades or exhibiting atypical intraspecific divergence were flagged and further analyzed; for groups with high or unusual intraspecific divergence, Fst values were calculated using Arlequin 3.5.2.2 [77] to assess the significance of genetic differentiation, with input files generated by DnaSP6 [78] under default settings, and these results were discussed in the context of geographic distributions and published genitalia images to evaluate potential cryptic diversity or misidentifications.

3. Results

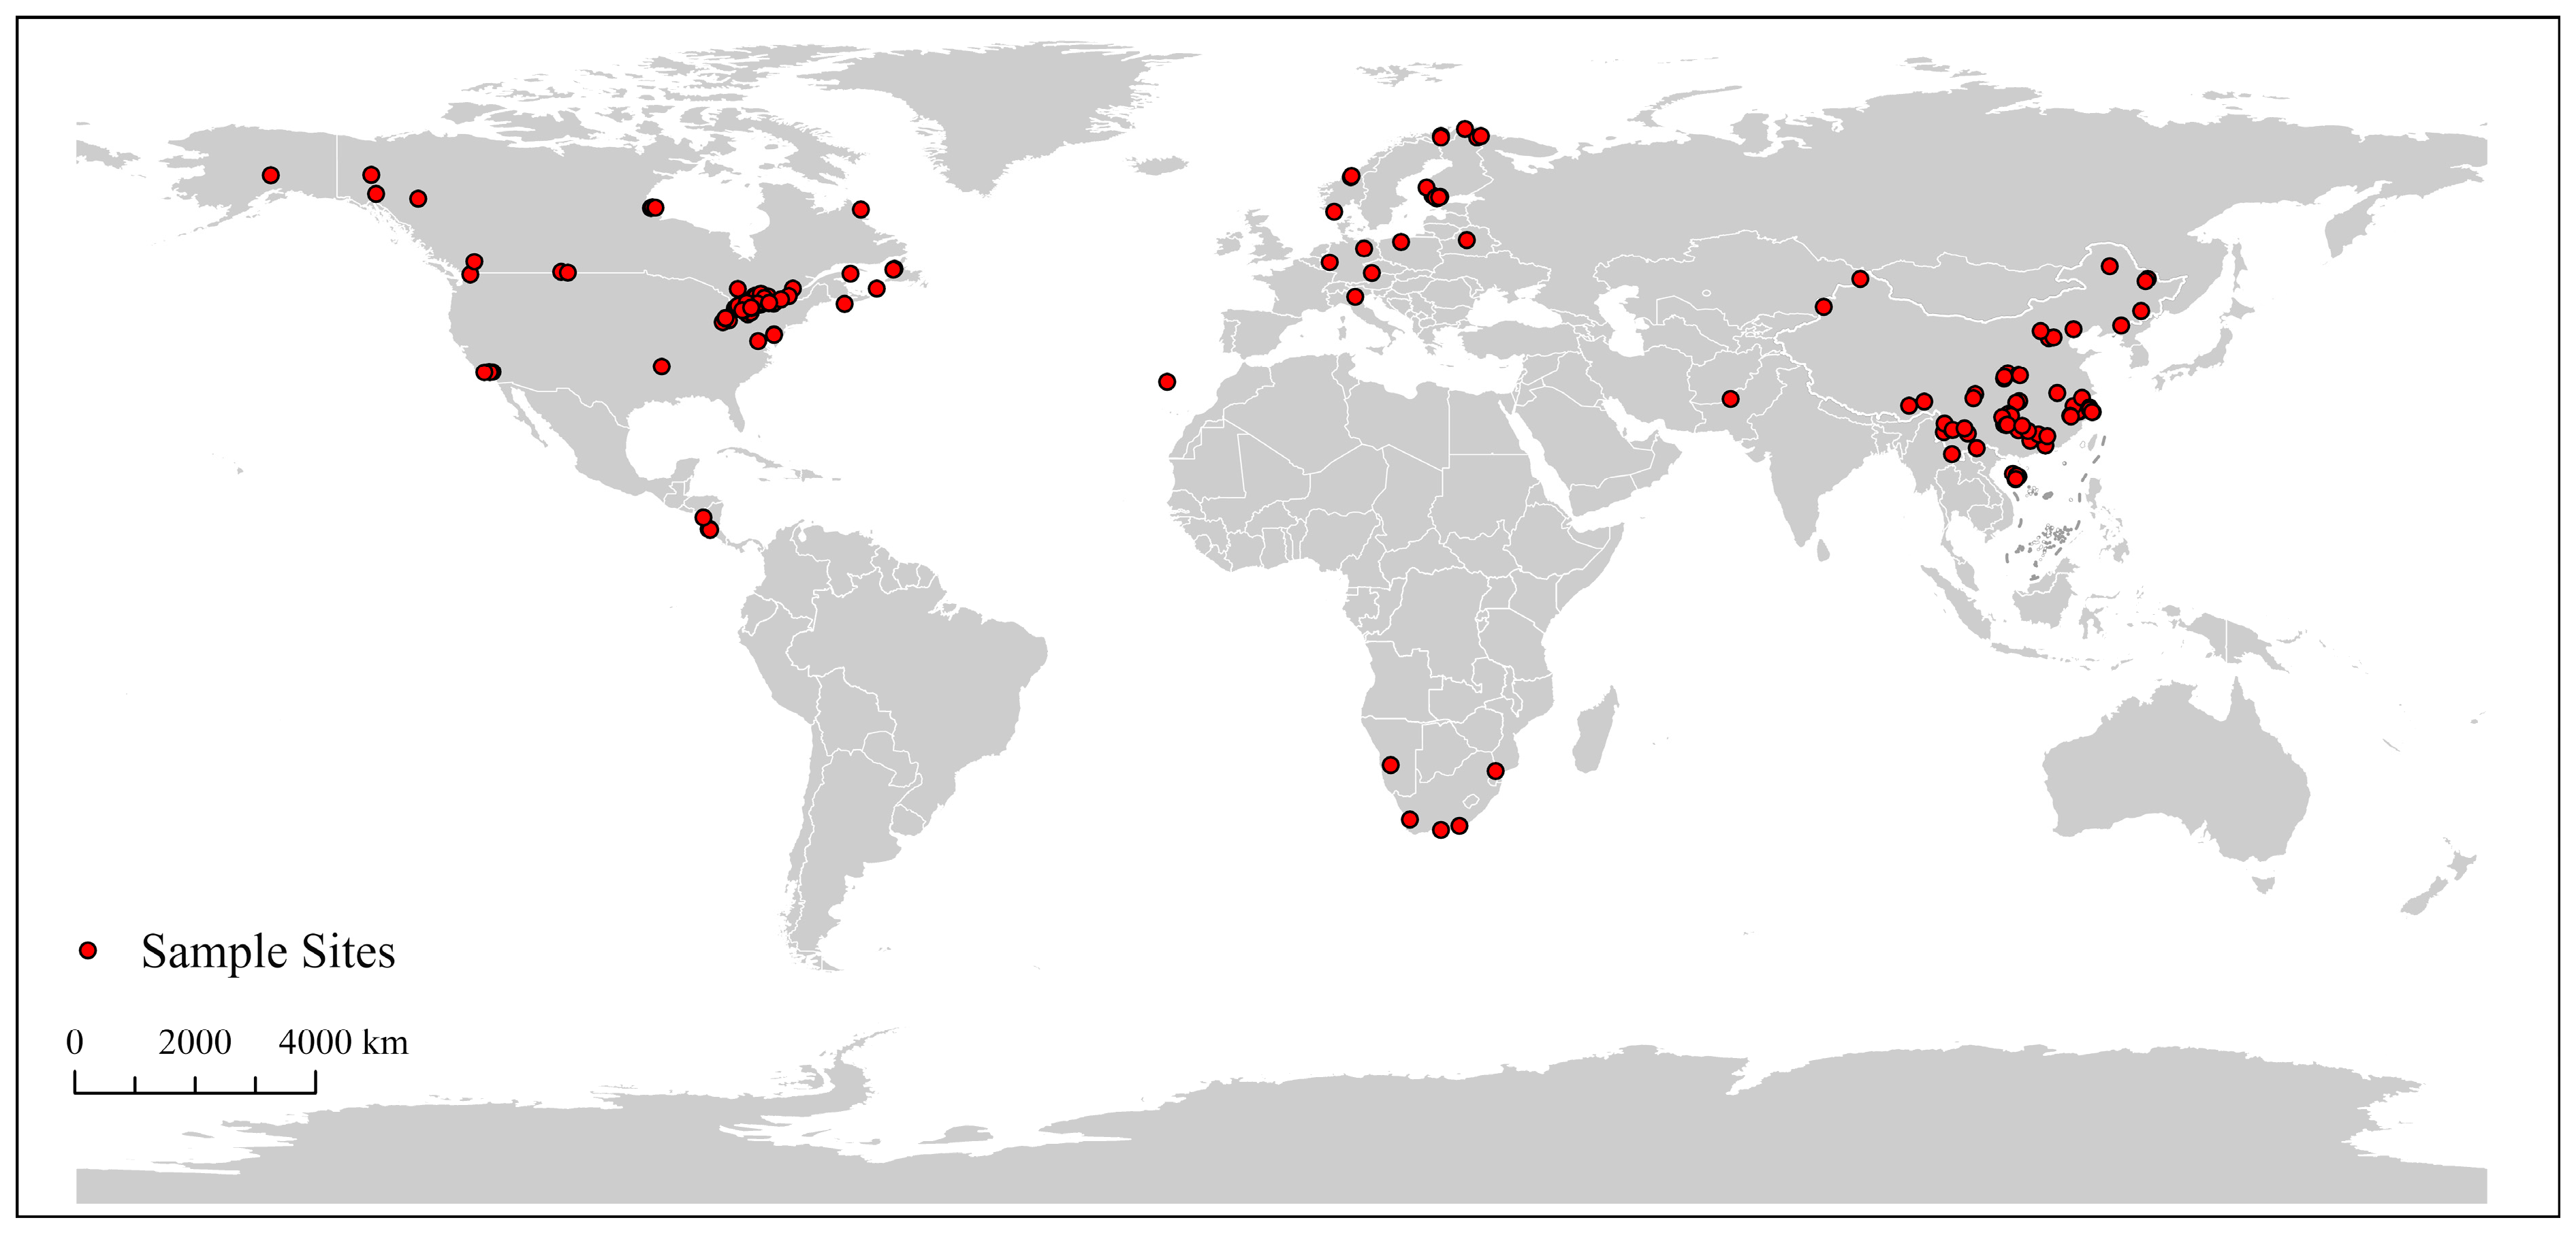
3.1. Dataset Characteristics and Global Distribution

The 911 sequences have an average length of 617 bp, with 557 sequences (61.1%) measuring at least 600 bp, demonstrating the high completeness of the dataset. The dataset includes 109 Barcode Index Numbers (BINs), with sequences per BIN ranging from 1 to 175. Most BINs contain relatively few sequences, reflecting regional disparities in species sampling. BINs with 1–2 sequences are primarily from Southeast Asia, whereas those with more than 20 sequences are predominantly from North America and Europe, underscoring more systematic collection efforts in these regions.
The dataset encompasses three levels of taxonomic identification: Category I (Latin binomials), Category II (provisional names, e.g., Rheotanytarsus sp. TE01), and Category III (genus-level identification). A preliminary review of 754 publicly available COI sequences, combined with existing studies, identified annotation errors in 12 sequences (approximately 1.6%) under Category I. Among these, five erroneous barcodes associated with the muscicola species group have already been corrected in relevant revisions [61]. Although Rheotanytarsus erignus has been cited by submitters from multiple countries, it is not officially listed in databases such as the Catalogue of Life, ZooBank, or ITIS [16,22]. Therefore, the barcodes linked to this name were reclassified as Category III. Additionally, as Rheotanytarsus distinctissimus is a synonym of R. pellucidus, three sequences originally identified as R. distinctissimus were corrected [79].
From our newly collected data, morphological identification assigned 76 barcodes to Category I and 81 barcodes to Category II (labeled Rheotanytarsus sp. 1XL through sp. 24XL). In total, the dataset contained 364 Category I barcodes, 102 Category II barcodes, and 445 Category III barcodes. Of these, Category I barcodes covered 25 described species, exhibiting considerable variation in the number of individuals per species. Some species were represented by only a single individual, whereas as many as 196 individuals were annotated as Rheotanytarsus ringei (see Table S1). Category II barcodes encompassed 29 provisional names, with some annotations including the species group name (e.g., Rheotanytarsus exiguus group sp. 1SMRD073013-THBL038). These specimens may possess key morphological traits relevant to their respective species groups, providing valuable references for future taxonomic studies.
Barcode annotation levels vary significantly among countries, reflecting disparities in research resources, sampling strategies, and focal priorities. The dataset comprises specimens from 15 countries (Table 1 and Figure 1), covering most biogeographic regions where Rheotanytarsus occurs. Among Norway’s 219 sequences, 209 are Category I barcodes, accounting for an impressive 95.4%. In contrast, Canada’s 286 sequences include as many as 248 Category III barcodes, representing 86.7%. Norway, China, and the United States exhibit more active barcode research efforts compared to other countries. By contrast, barcode research activity in the Southern Hemisphere is relatively limited, with insufficient specimen collection and barcode annotation efforts.

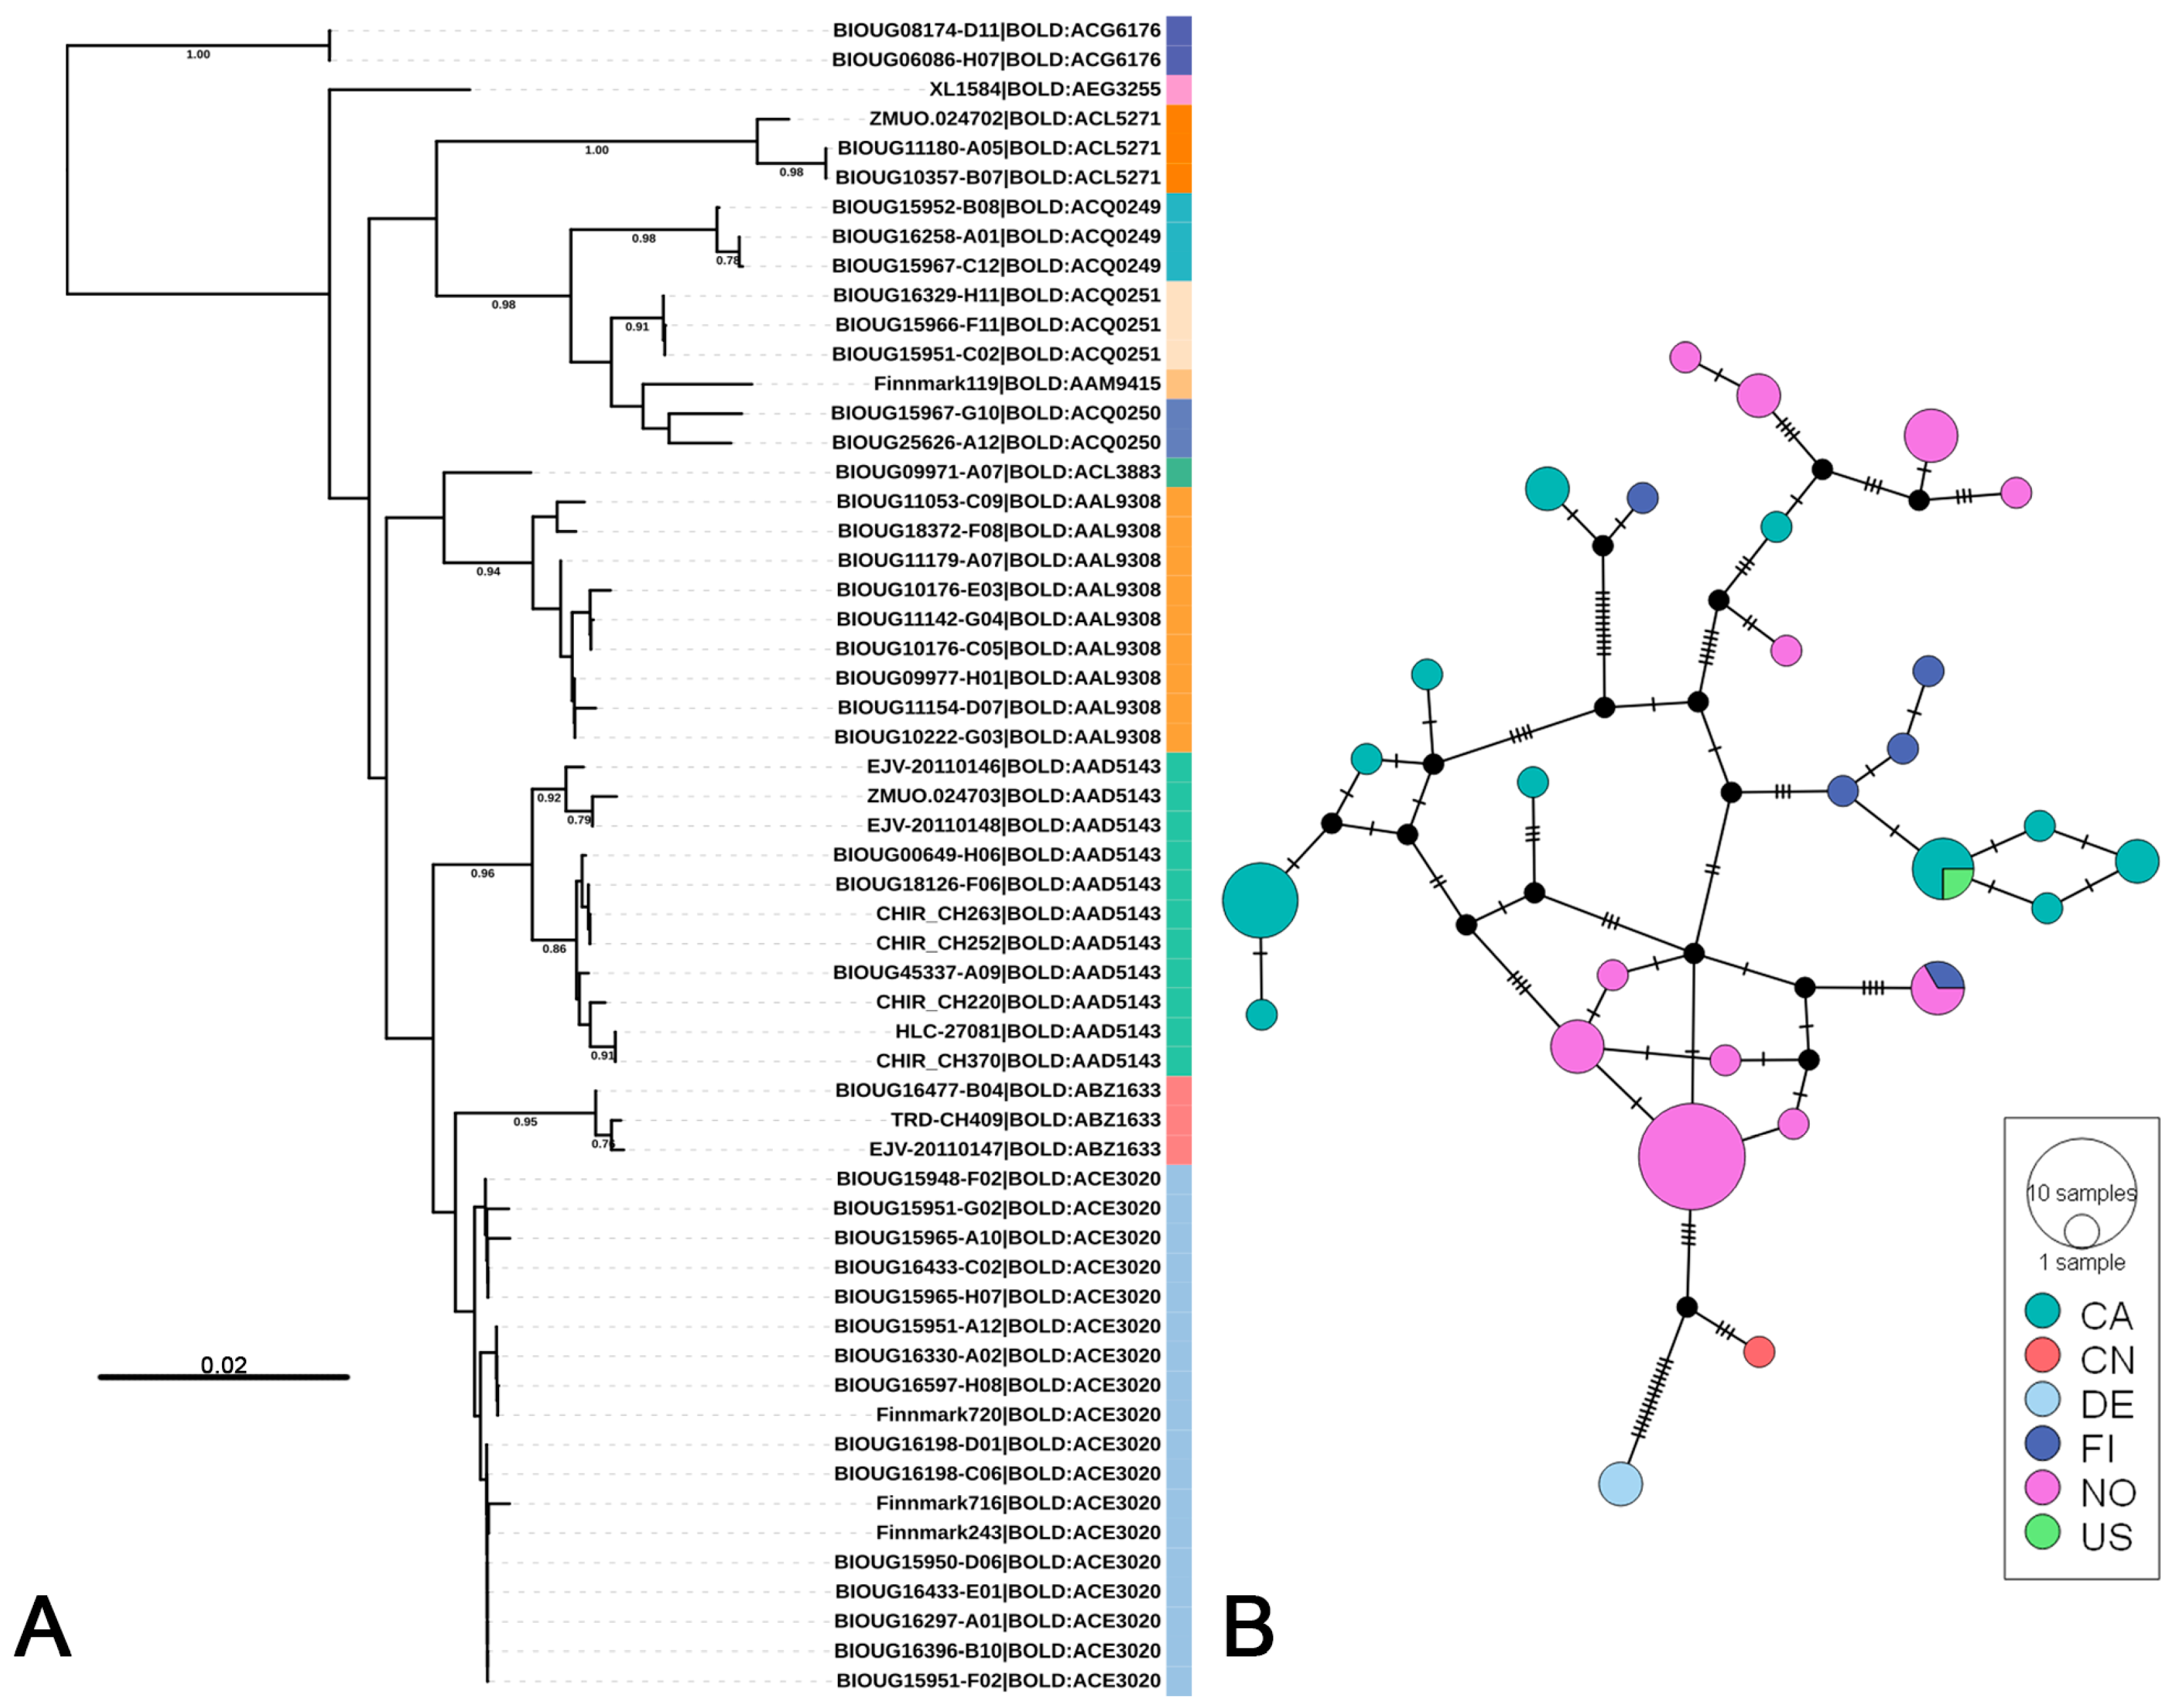
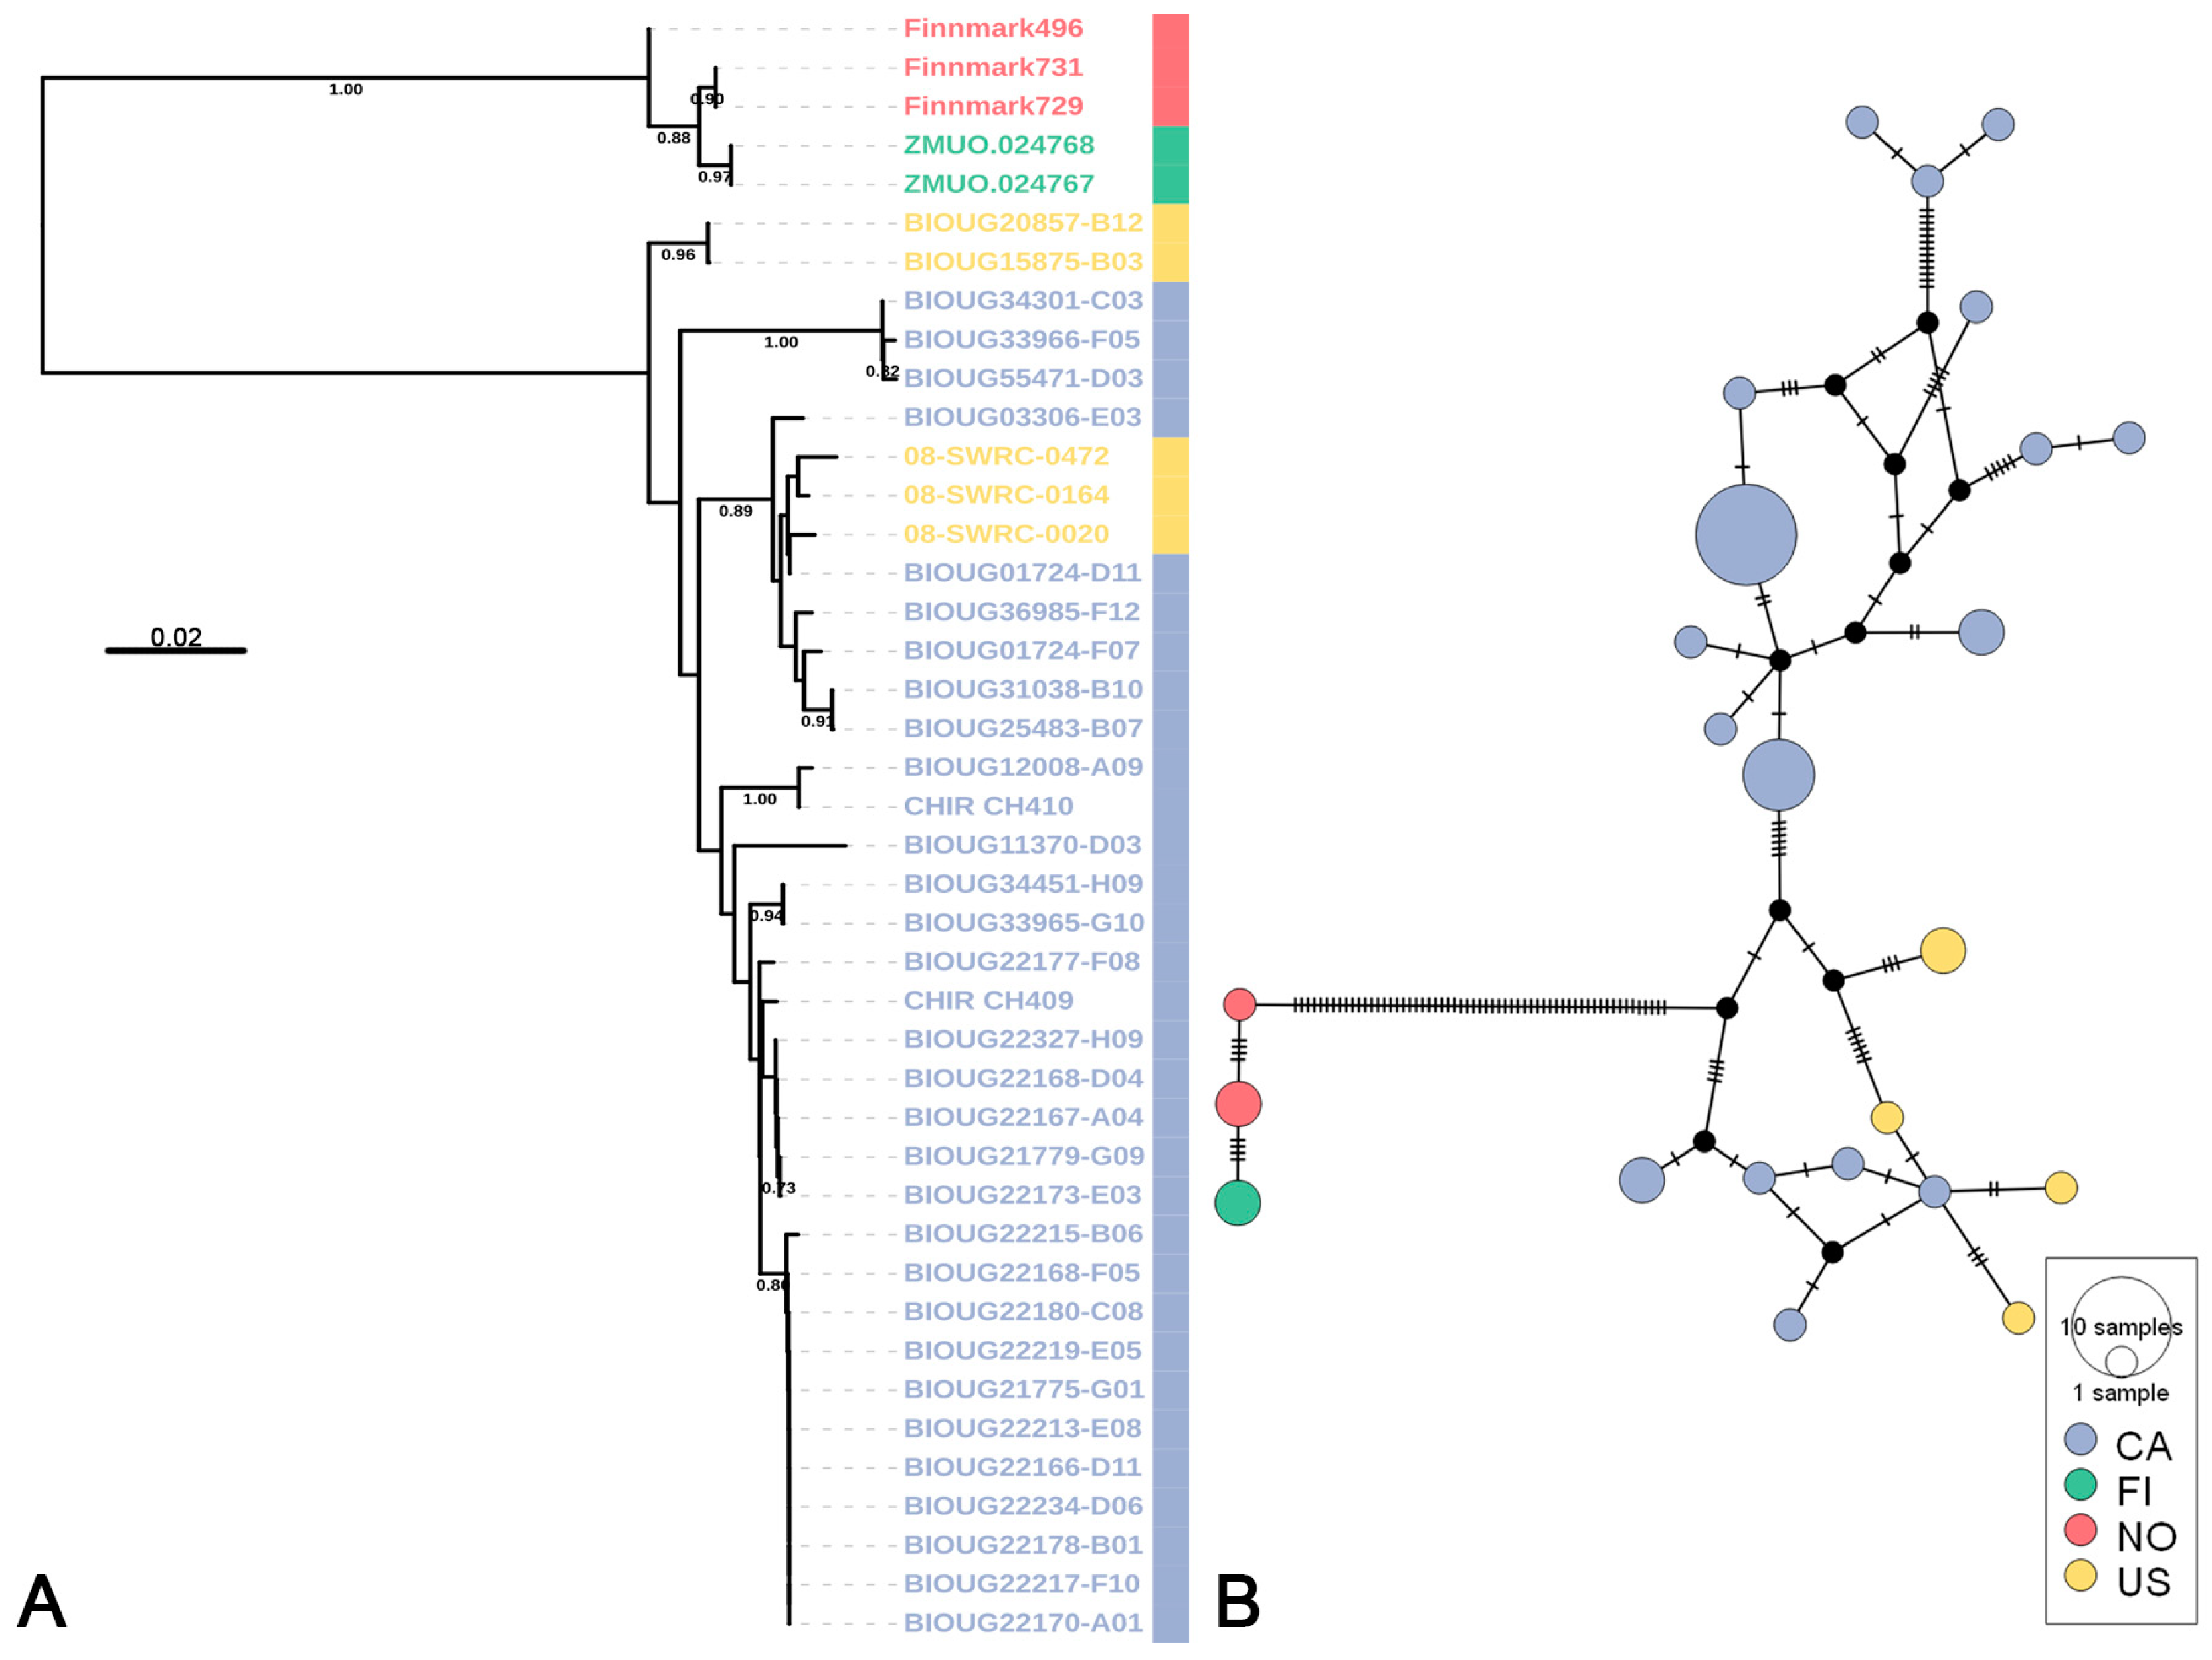
3.2. Putative Species Delimitation and Genetic Divergence

Different species delimitation methods generated varying numbers of molecular operational taxonomic units (mOTUs). The ABGD analysis identified 71 mOTUs (Figure 2), separating Rheotanytarsus sp. 8XL and R. baihualingensis into distinct mOTUs. The NJ tree (Figure S1) clustered 911 DNA barcodes into 69 clades, with the vast majority of non-singleton clades having bootstrap values greater than 70%. Additionally, all newly collected morphospecies—verified by detailed morphological analysis—formed monophyletic groups. In the ML tree (Figure S2), most Category I and Category II barcodes formed monophyletic structures, whereas Rheotanytarsus adjectus and R. miaoae displayed paraphyletic patterns. The mPTP analysis delineated 73 mOTUs, splitting Rheotanytarsus sp. 8XL, Rheotanytarsus sp. 18XL, and R. ashei each into two mOTUs, while combining R. oss, Rheotanytarsus sp. 22XL, Rheotanytarsus sp. 23XL, and Rheotanytarsus sp. 24XL into one mOTU, and grouping R. adjectus and R. miaoae as a single mOTU. The GMYC analysis recognized 84 mOTUs (Figure S3), dividing Rheotanytarsus sp. 3XL, Rheotanytarsus sp. 8XL, R. ashei, R. baihualingensis, and R. yamamotoi each into two mOTUs. In public databases, barcodes labeled Rheotanytarsus pentapoda were fragmented into multiple mOTUs by both mPTP and GMYC methods, while sequences tagged as R. curtistylus, R. illiesi, R. muscicola, R. pellucidus, and R. ringei consistently failed to form a single mOTU across all analyses.
Apart from the previously mentioned non-monophyletic species and certain erroneous annotations discovered in the preliminary inspection, we also observed overlapping morphological identifications in two separate lineages: one containing R. pentapoda and R. illiesi, and another containing R. muscicola and R. curtistylus (the latter sharing a BIN, BOLD:ACR3994). According to the revised classification of the muscicola species group, some of these non-monophyletic issues can be corrected (Table S1) [61]. However, anomalously high intraspecific divergences (20.10% and 15.24%) remained in Rheotanytarsus pellucidus and R. ringei.
After addressing potential cryptic species complexes, the dataset contained a total of 69 putative species (see Figure 3 and subsequent sections for details). Among these, 13 species contained only Category III barcodes, so we consequently revised the species names of the sequences in these clades from Rheotanytarsus sp. 1 to sp. 13 (Figure S1 and Table S1). Regarding genetic divergence, 22 species had a maximum intraspecific divergence below 2%, 18 were between 2% and 4%, 6 were between 4% and 6%, and 3 exceeded 6%. On average, the maximum intraspecific divergence was 2.43%, with the highest (7.35%) observed in R. pentapoda. These observations are limited by the distribution of specimens (see Discussion for details). In terms of interspecific differences, 5 species showed a minimum interspecific divergence of 6–7%, while 62 exceeded 7%. The largest interspecific genetic divergence, 24.27%, occurred between Rheotanytarsus sp. 4XL and Rheotanytarsus sp. 8, whereas the smallest, 5.77%, was detected between Rheotanytarsus sp. 2 and Rheotanytarsus sp. 9. Overall, the average minimum interspecific divergence was 11.44%.

3.3. Life-Stage Association and Distribution

According to the Data Spreadsheets in BOLD, we compiled life-history information for each putative species (Figure S1 and Table S2). In total, 20 species (30%) achieved successful life-stage matching, and these generally had larger sample sizes. For instance, Rheotanytarsus ringei (BOLD:AAF7635) was represented by 195 individuals. Among the 18 species matched for both adult and immature stages, 11 had a confirmed match between adult males and larvae. These successfully matched species provide a strong basis for subsequent integrative taxonomic studies.
By contrast, 39 species were represented solely by adults, including 32 species with adult males. Eight species consisted only of immature-stage samples: five species had larval sequences exclusively, while one species was recorded only at the pupal stage. Compared with the species that achieved complete life-stage matches, these single-stage species had relatively low sample sizes, most with no more than five specimens.
Overall, the barcoding records for Rheotanytarsus exhibit an uneven life-stage distribution, with most species documented primarily in the adult stage (especially males) and much scarcer data from the immature stages. This pattern likely reflects sampling biases or difficulty in collecting certain life stages. Filling these gaps through additional life-stage data and new records will help improve our understanding of Rheotanytarsus diversity and biology.

4. Discussion

4.1. Appropriate Delimitation Methods and Threshold Value

Single-marker species delimitation approaches demonstrate substantial methodological diversity, with accuracy being context-dependent based on dataset characteristics, necessitating both strategic selection and integrative implementation to compensate for individual method constraints [49,52,60]. Broadly, species delimitation methods based on short molecular markers can be categorized into two types: those based on genetic distance and those relying on phylogenetic criteria [54]. Our dataset displays typical limitations of single-marker studies, with singletons accounting for 30.99% (22 species) and doubletons for 15.49% (11 species)—a pattern reflecting incomplete sampling across certain lineages. These sampling gaps necessitate combining multiple delimitation methods to counteract single-method biases and minimize erroneous outcomes.
As shown in the Results, GMYC and mPTP produced mOTUs that conflicted with morphological hypotheses (particularly those confirmed by specimen examinations). This discrepancy primarily stems from the sensitivity of phylogeny-based methods to recent speciation events and undersampling, which collectively undermine phylogenetic resolution in COI datasets [39,80] For example, the ML tree shows paraphyly between Rheotanytarsus adjectus and R. miaoae, two morphologically distinct species described recently [26,62], requiring additional evidence to resolve their delimitation. This over-splitting tendency represents a recurrent issue in Chironomidae systematics, as evidenced by analogous discrepancies in Tanytarsus (2790 barcodes) [28] and Polypedilum (3670 barcodes) [57] studies with larger datasets, along with Microtendipes research (952 barcodes) [81] of comparable sampling scope. In contrast, phylogeny-based delimitation shows stronger congruence with morphology in other aquatic insects—for instance, Ephemeroptera demonstrate high GMYC-morphology concordance, suggesting clade-specific applicability of these methods [82].
Among genetic distance-based methods, the BIN system employs 2.2% as the threshold parameter for single linkage clustering [37], a value that aligns well with morphospecies boundaries in diverse animal groups [83]. However, this alignment breaks down in Chironomidae, where the same threshold significantly inflates species counts [28,56,57]. For instance, the clade of Rheotanytarsus pentapoda, comprising 57 individuals, spans 12 BINs in our dataset (Figure 4). ASAP, known for its operational simplicity, is widely used in species delimitation, particularly for large-scale datasets where it exhibits strong applicability; however, it is significantly affected by the number of haplotypes [80,84]. In our preliminary tests, ASAP results broadly corresponded with ABGD outcomes but demonstrated stochasticity and an over-splitting tendency. For instance, BOLD:AAH3858 and BOLD:ACJ8793 were stably merged into a single species by ABGD (Rheotanytarsus sp. 9), yet consistently split by ASAP. This divergence involved overseas specimens that could not be morphologically validated due to unavailable voucher data, rendering their biological interpretation inconclusive. As a foundational effort to address these data limitations, we prioritized ABGD and NJ analyses to propose preliminary species hypotheses while mitigating over-splitting risks.
No universal threshold exists owing to the variability in population sizes and divergence times among taxa [85,86], thus necessitating taxon-specific thresholds to accurately reflect biological reality. Some insects exhibit relatively low intraspecific divergence; for example, beetles and Apoidea commonly show values below 2% [87,88], Ephemeroptera display an average of around 2% [89], and a threshold of 2.5% yields optimal morphological matching in Plecoptera [90]. However, certain taxa show higher levels of intraspecific divergence, such as Psychodidae and Smicridea (Hydropsychidae: Trichoptera), which can reach up to 6% [91,92]. In Chironomidae, similarly high thresholds have been reported: 4–5% for Tanytarsus [28], 5–8% for Polypedilum [57], 4.5–7.7% for Stictochironomus [59], and a minimum interspecific threshold of 9% for Stenochironomus [60]. In this context, informed by our ABGD and NJ analyses alongside morphological validation, we propose a 5.77–7% intraspecific divergence threshold for Rheotanytarsus as suitable for species delimitation using COI barcodes, enabling higher-confidence estimates of putative species diversity. It is important to note that this proposed threshold is a context-specific, preliminary guideline based on our current dataset and analytical methods, and should not be interpreted as a universal standard. Furthermore, recognizing that sampling scope can influence threshold outcomes [93,94,95,96], we recommend broader and denser sampling complemented by additional species identification methods to strengthen the reliability of DNA barcode-based species delimitation.

4.2. Cryptic Species Diversity

Species identification is fundamental to a broad array of biological endeavors, including evolutionary research, conservation planning, and biodiversity assessments [97]. However, cryptic species present considerable challenges to assessing the species diversity of Rheotanytarsus and ensuring the accuracy of specimen identification [98]. In Chironomidae, abnormal COI divergences serve as preliminary indicators for potential cryptic diversity, triggering subsequent multilocus and morphological validation to confirm species status [99]. For instance, barcode studies in Polypedilum and Tanytarsus have supported subsequent species discoveries [56,100,101], and numerous revisions assisted by barcoding also build on COI differences [59,61,62], though exceptions occasionally occur [81,93]. This study offers a detailed discussion of species groups and taxa that are especially difficult to identify morphologically, integrating insights from existing taxonomic research with the anomalous intraspecific divergences observed in this study.
The Rheotanytarsus pellucidus species group is exemplative of the taxonomic ambiguity pervasive within the genus. Morphological delineation within this group is particularly challenging due to limited descriptions of larvae and pupae across its distribution, alongside the conserved diagnostic traits of adult males, most notably the elongate Median Volsellae (MVo) with minimal interspecific variation [21,22,79]. In this study, R. pellucidus formed two distinct clusters in the NJ tree (Figure 5A), corresponding to populations from Europe (Finland and Norway) and North America (Canada and USA), respectively. To further elucidate their phylogeographic relationships, a haplotype network analysis was conducted (Figure 5B) and each population aligned with its corresponding cluster from the NJ tree. Significant genetic differentiation between these lineages is evidenced by a high Fst value of 0.652. Because specimens from other regions cannot be directly examined or morphologically verified, it is currently impossible to determine the precise taxonomic status of these two lineages through direct observation and measurement. Although the DNA barcode distribution of the R. pellucidus species complex, as documented in BOLD, corresponds to its recognized range [22], the complete absence of overlapping haplotypes and specimens from biogeographically intermediate regions underscores a stark genetic-geographic disjunction. This pattern aligns with cryptic speciation hypotheses but necessitates caution: definitive taxonomic resolution will require detailed morphological re-examinations of the MVo microstructures across isolated populations, coupled with multilocus and phylogenomic approaches.
Another example involves Rheotanytarsus ringei, which appears as two separate species in the NJ tree, each corresponding to a single BIN (BOLD:AAF7635 and BOLD:AAW4702). Haplotype network analysis also supports this conclusion (Figure S4). The pronounced genetic divergence between these lineages is further substantiated by an Fst value of 0.687. The marked discrepancy in the number of individuals (195 vs. 5) may reflect differences in sampling frequency or the distribution patterns of the target regions. For both lineages, some individuals have complete morphological images and detailed genitalia slide photographs uploaded to BOLD. Although the two groups share similar body coloration, they show notable differences in the anal tergal bands, gonostyli, and length of the MVo. The first group closely aligns with the original description of R. ringei, but further verification is needed because the characteristic notch in the MVo was not observed [102]. According to the original description, the number of hind tibial spurs in R. ringei exhibits intraspecific variation: the type material has two spurs, whereas Finnish specimens have only one, indicating a certain degree of variability [102]. However, most Rheotanytarsus species show stable numbers of posterior tibial spurs, typically two, with only a few exceptions (e.g., R. muscicola has one spur, but consistently) [61,62]. Furthermore, specimens (in BOLD:AAW4702) were collected from Finland and include individuals erroneously labeled as R. muscicola. This observation suggests that the posterior tibial spur count in that lineage is consistently one. Therefore, the second lineage (BOLD:AAW4702) may represent a cryptic species morphologically similar to R. ringei but characterized by a single hind tibial spur, implying that the original description could have included cryptic species. To conclusively resolve this taxonomic uncertainty, future investigations should focus on comparing immature stages, with an emphasis on pupal morphology, which may provide diagnostic traits absent in adults.
Overall, our application of DNA barcoding has advanced the taxonomic framework of Rheotanytarsus. While COI data successfully delineated most species—particularly within our newly collected samples—the paraphyly of certain morphospecies (e.g., the R. pellucidus and R. ringei complexes) underscores limitations of single-locus approaches in addressing taxonomic uncertainties. To resolve these ambiguities, especially in cases involving potential cryptic speciation, future studies must prioritize integrating morphological traits across all life stages and employing comprehensive genetic datasets for species delimitation [57,103].

4.3. Summary and Outlook

Our findings highlight the notable diversity of Rheotanytarsus in China, with 44 candidate species documented across major ecoregions. Significantly, 33 of these species constitute the first DNA barcode records from newly collected specimens, accounting for nearly half (47.8%) of all putative species identified—indicating the genus’s understudied diversity. Over half of these species remain insufficiently identified, necessitating more comprehensive studies that integrate both morphological and molecular data to clarify their taxonomic status. It is worth noting that this study encounters certain geographic sampling limitations, as the distributions of most “widespread” species appear to be primarily documented in China, Europe, and North America (Canada–USA; Table S2). These spatial constraints in specimen collection might influence our understanding of the genus’s true diversity patterns, potentially hinting at the presence of additional cryptic lineages that could be revealed through broader biogeographic sampling efforts in the future.
Species represent the fundamental units of biodiversity, and accurate specimen identification is crucial for studies in population genetics, ecology, and physiology [104,105,106,107,108]. Although reproductive isolation is a key measure for delineating species, it is often impractical to verify directly. In Rheotanytarsus, most species are still diagnosed by detailed examinations of adult male genital morphology, considered the “gold standard”. Yet, two major shortcomings arise in practice. First, there is no quantitative approach for measuring intraspecific variation in genitalia; if different individuals’ genital structures appear similar, even substantial variation in other morphological traits may be dismissed as mere intraspecific diversity, potentially obscuring cryptic species. Second, this method constrains the ability to link specimens across life stages, further impeding the reconstruction of complete life histories. In this study, we successfully refined the DNA barcoding database for Rheotanytarsus. Through the systematic application of DNA barcoding techniques, we addressed three key objectives: firstly, enhancing specimen identification and supporting species discovery; secondly, enabling life-stage associations for specimens beyond adult males; and finally, illustrating the potential of molecular methods to complement and address some of the limitations inherent in traditional taxonomic approaches.
While multilocus and phylogenomic approaches theoretically provide enhanced phylogenetic resolution, their implementation in Rheotanytarsus remains constrained by the insufficient genomic resources. This methodological limitation underscores the continued necessity of prioritizing COI barcoding as a first-step diagnostic tool in this taxon. Although the COI barcode demonstrates considerable utility in facilitating species discovery and delimitation within Chironomidae, its limitations as a single mitochondrial marker warrant careful consideration [109]. Firstly, hybridization between closely related species—a phenomenon confirmed within Chironomidae [110,111,112]—can lead to mitochondrial gene introgression, thereby disrupting assessments of species diversity. For instance, in the study of Diamesa, discrepancies between morphological identification and COI-based Bayesian clustering in certain individuals have been attributed to hybridization [93]. Secondly, in rapidly radiating taxa, ILS may diminish the resolving power of COI [113], resulting in conflicts between morphological and gene tree topologies [114]. Inter-laboratory identification discrepancies also merit attention, as they may compromise the reliability and validity of reference databases, subsequently affecting practical applications [99,115,116]. Although NUMTs have not been reported in Chironomidae [117] and genomic studies indicate their occurrence is significantly lower than in other insect groups [118], rigorous sequence quality control remains essential. In summary, scalable techniques are needed to identify and address the diversity challenges posed by “dark taxa” [119]. In the context of the rapid advancement of next-generation DNA sequencing, integrating additional genetic information—particularly nuclear genes—is crucial to resolving relationships among individuals and populations [97]. Simultaneously, standardizing morphological descriptions across all life stages, providing high-quality images, and leveraging emerging machine-assisted identification technologies can enhance specimen identification efficiency [120,121]. Equally important, for widely distributed and diverse taxa, accelerating global collaboration and the exploration of ecological traits—supported at minimum by the sharing of voucher specimen images [116]—is vital to improving the recognition of cryptic species and the resolution of rapidly radiating groups.

5. Conclusions

This study addresses the longstanding shortage of genetic data on Rheotanytarsus by employing DNA barcoding to advance its taxonomic understanding, thereby significantly enriching the existing barcode reference library and establishing a robust foundation for future specimen identification and precise aquatic ecosystem monitoring. Drawing on multiple analytical tools and morphological methods, this study allocated 911 DNA barcodes to 69 putative species and performed life-stage matching for certain taxa, thereby laying the groundwork for subsequent life-history reconstructions. Currently, R. pentapoda exhibits the widest distribution, whereas East Asia harbors the highest species diversity. In some species complexes, pronounced genetic divergence among individuals may indicate the presence of cryptic species, necessitating the integration of nuclear gene data, morphological traits across different life stages, and ecological information for deeper investigation. Geographic biases and life-stage gaps limit ecological inferences and may obscure true diversity patterns. While we propose that a 5.77–7% genetic threshold is more suitable for species delimitation within Rheotanytarsus, following the exclusion of cryptic species, its broader applicability requires rigorous testing in geographically underrepresented regions. Documenting Rheotanytarsus diversity demands a sustained endeavor—combining meticulous fieldwork, iterative species validation, and open-data sharing—to collectively unravel the genus’s evolutionary history and ecological roles across global scales. To address these gaps, future efforts must prioritize standardized sampling in underexplored biomes, holistic documentation of pupal and larval diagnostic traits, and consortium-driven data sharing to harmonize molecular, ecological, and morphological metadata. Collectively, these strategies will position Rheotanytarsus as a model for integrative taxonomy, directly enhancing the precision of freshwater biomonitoring.

Supplementary Materials

The following supporting information can be downloaded at: https://www.mdpi.com/article/10.3390/insects16040370/s1, Figure S1: Neighbor-Joining tree constructed using the K2P model based on 911 COI barcodes. Clades of different species are marked with cyclic colors for differentiation. The scale bar represents K2P genetic distances, and numbers on branches indicate bootstrap support values (>70%) based on 1000 replicates. Solid blue circles represent specimens in immature stages, while hollow blue circles represent adult specimens. Figure S2: Maximum Likelihood (ML) tree inferred in IQ-TREE v.2.3.6 under the GTR+F+R6 model. Clades of the final putative species are marked with cyclic colors for differentiation. Numbers on branches indicate bootstrap support values (>70%) based on 1000 replicates. Figure S3: Species delimitation analysis of Rheotanytarsus using the GMYC single-threshold model. A. Lineage-through-time plot derived from the COI ultrametric tree. The red vertical line marks the transition threshold between interspecific cladogenesis and intraspecific coalescence. B. Likelihood profile of the GMYC model showing the transition peak (red dashed line) between speciation and coalescent processes. C. Ultrametric tree reconstructed in BEAST under a strict clock and HKY substitution model. Red clusters denote putative species delimited by GMYC, while black lines indicate singleton lineages. Figure S4: Genetic structure of Rheotanytarsus ringei. A. Neighbor-Joining tree based on K2P genetic distances, with the scale bar representing K2P genetic distances. Numbers on branches indicate bootstrap support values (>70%) based on 1000 replicates. B. TCS network based on the COI sequences of R. ringei, where node size indicates sample size. Colors in both panels represent different geographic origins (Finland—FI, Norway—NO, Poland—PL, Portugal—PT). Table S1: Dataset of 911 DNA barcodes for the genus Rheotanytarsus. Table S2: Individual counts based on the species delimitation results of this study, categorized by country, life stage, and BIN.

Author Contributions

Conceptualization, all authors; methodology, Y.Y. and J.-Y.C.; software, Y.Y.; validation, Y.Y. and J.-Y.C.; resources, X.-L.L.; data curation, Y.Y. and X.-L.L.; writing—original draft preparation, Y.Y.; writing—review and editing, X.-L.L. and C.-H.L.; visualization, Y.Y.; supervision, X.-L.L., X.-L.G., C.-H.L. and Z.L.; project administration, X.-L.L.; funding acquisition, Z.L. All authors have read and agreed to the published version of the manuscript.

Funding

This research was funded by the Ministry of Natural Resources’ High-Level Scientific and Technological Innovation Talent Cultivation Program (12110600000018003910), the research start-up fund project for young teachers of Shanghai Ocean University (A2-2006-23-200303), the National Natural Science Foundation of China (31900344) and the National Natural Science Foundation of China (41502021).

Data Availability Statement

A list of all species, specimens, their individual images, georeferences, primers, sequences, and other relevant laboratory data of all Rheotanytarsus specimens are available through the public dataset “Global Rheotanytarsus COI barcodes (DS-2023RCOI)” in the Barcode of Life Data System (http://www.boldsystems.org).

Acknowledgments

We are grateful to the Canadian Centre for DNA Barcoding (CCDB, Guelph, Ontario, Canada) for DNA sequencing. We also acknowledge the Namibian National Commission on Research, Science, and Technology (NCRST) and the Ministry of Environment, Forestry, and Tourism for granting permits to collect and export specimens under the Nagoya Protocol.

Conflicts of Interest

The authors declare no conflicts of interest.

References

  1. Pape, T.; Blagoderov, V.; Mostovski, M.B. Order Diptera Linnaeus, 1758. In: Zhang, Z.-Q.(Ed.) Animal biodiversity: An outline of higher-level classification and survey of taxonomic richness. Zootaxa 2011, 3148, 222–229. [Google Scholar] [CrossRef]
  2. Courtney, G.W.; Pape, T.; Skevington, J.H.; Sinclair, B.J. Biodiversity of diptera. In Insect Biodiversity: Science and Society; Wiley: Hoboken, NJ, USA, 2017; pp. 229–278. [Google Scholar] [CrossRef]
  3. Hazra, N.; Saha, G.K.; Mazumdar, A.; Chaudhuri, P.K. Records of chironomids of the tribe Pentaneurini (Diptera: Chironomidae) in the Eastern Himalayas of India. Ann. Soc. Entomol. Fr. 2011, 47, 330–339. [Google Scholar] [CrossRef]
  4. Nicacio, G.; Juen, L. Chironomids as indicators in freshwater ecosystems: An assessment of the literature. Insect Conserv. Divers. 2015, 8, 393–403. [Google Scholar] [CrossRef]
  5. Ferrington, L.C. Global diversity of non-biting midges (Chironomidae; Insecta-Diptera) in freshwater. Hydrobiologia 2008, 595, 447–455. [Google Scholar] [CrossRef]
  6. Hayford, B.L.; Sublette, J.E.; Herrmann, S.J. Distribution of Chironomids (Diptera: Chironomidae) and Ceratopogonids (Diptera: Ceratopogonidae) along a Colorado Thermal Spring Effluent. J. Kansas Entomol. Soc. 1995, 68, 77–92. [Google Scholar]
  7. Karima, Z. Chironomidae: Biology, ecology and systematics. In Wonders Diptera—Charact Divers Significance World’s Ecosyst; IntechOpen: Rijeka, Croatia, 2021. [Google Scholar] [CrossRef]
  8. Armitage, P.D.; Cranston, P.S.; Pinder, L.C.V. The Chironomidae: Biology and Ecology of Non-Biting Midges; Chapman & Hall: London, UK, 1995; 572p. [Google Scholar]
  9. Bothwell, M.L.; Sherbot, D.M.; Pollock, C.M. Ecosystem response to solar ultraviolet-B radiation: Influence of trophic-level interactions. Science 1994, 265, 97–100. [Google Scholar] [CrossRef]
  10. Lobinske, R.J.; Cichra, C.E.; Ali, A. Predation by bluegill (Lepomis macrochirus) on larval Chironomidae (Diptera) in relation to midge standing crop in two central Florida lake. Fla. Entomol. 2002, 85, 372–375. [Google Scholar] [CrossRef]
  11. Fard, M.S.; Pasmans, F.; Adriaensen, C.; Du Laing, G.; Janssens, G.P.J.; Martel, A. Chironomidae Bloodworms Larvae as Aquatic Amphibian Food. Zoo. Biol. 2014, 33, 221–227. [Google Scholar] [CrossRef]
  12. Raunio, J.; Heino, J.; Paasivirta, L. Non-biting midges in biodiversity conservation and environmental assessment: Findings from boreal freshwater ecosystems. Ecol. Indic. 2011, 11, 1057–1064. [Google Scholar] [CrossRef]
  13. Cañedo-Argüelles, M.; Bogan, M.T.; Lytle, D.A.; Prat, N. Are Chironomidae (Diptera) good indicators of water scarcity? Dryland streams as a case study. Ecol. Indic. 2016, 71, 155–162. [Google Scholar] [CrossRef]
  14. Molineri, C.; Tejerina, E.G.; Torrejón, S.E.; Pero, E.J.; Hankel, G.E. Indicative value of different taxonomic levels of Chironomidae for assessing the water quality. Ecol. Indic. 2020, 108, 105703. [Google Scholar] [CrossRef]
  15. Lencioni, V.; Cranston, P.S.; Makarchenko, E. Recent advances in the study of Chironomidae: An overview. J. Limnol. 2018, 77, 1–6. [Google Scholar] [CrossRef]
  16. Kyerematen, R.A.; Andersen, T. Rheotanytarsus Thienemann et Bause (Diptera: Chironomidae) from Central America and Mexico. Stud. Neotrop. Fauna E 2002, 37, 23–51. [Google Scholar] [CrossRef]
  17. Kyerematen, R.A.; Andersen, T.; Saether, O.A. A review of Oriental Rheotanytarsus Thienemann & Bause, with descriptions of some new species (Insecta, Diptera, Chironomidae). Spixiana 2000, 23, 225–258. [Google Scholar]
  18. Kyerematen, R.A.; Sæther, O.A. A review of Afrotropical Rheotanytarsus Thienemann et Bause, 1913 (Diptera: Chironomidae). Tijdschr Ent 2000, 143, 27–70. [Google Scholar] [CrossRef]
  19. Moubayed-Breil, J.; Kettani, K. Description of Rheotanytarsus langtoni sp. n. from the Rif of north-western Morocco [Diptera, Chironomidae, Tanytarsini]. Ephemera 2018, 19, 83–94. [Google Scholar]
  20. Cranston, P.S. Revision of Australian Rheotanytarsus Thienemann & Bause (Diptera: Chironomidae), with emphasis on immature stages. Invertebr. Syst. 1997, 11, 705–734. [Google Scholar] [CrossRef]
  21. Liu, W.-B.; Yao, Y.; Chang, T.; Yan, C.-C.; Lin, X.-L. Contribution to the knowledge of Rheotanytarsus pellucidus species group from China (Diptera, Chironomidae): Three new and one newly recorded species. Zootaxa 2022, 5188, 145–156. [Google Scholar] [CrossRef]
  22. Sæther, O.A.; Kyerematen, R.A. Towards phylogeny and zoogography of the genus Rheotanytarsus Thienemann et Bause, 1913 (Diptera: Chironomidae). Tijdschrift voor Entomologie 2001, 144, 73–117. [Google Scholar] [CrossRef]
  23. Cortelezzi, A.; Simoy, M.V.; Siri, A.; Donato, M.; Cepeda, R.E.; Marinelli, C.B.; Berkunsky, I. New insights on bioindicator value of Chironomids by using occupancy modelling. Ecol. Indic. 2020, 117, 106619. [Google Scholar] [CrossRef]
  24. Prat, N. A case of phoresis of midges on Zygoptera. CHIRONOMUS J. Chironomidae Res. 2022, 35, 43. [Google Scholar] [CrossRef]
  25. Dosdall, L.; Mason, P.; Lehmkuhl, D. First records of phoretic Chironomidae (Diptera) associated with nymphs of Pteronarcys dorsata (Say)(Plecoptera: Pteronarcyidae). Can. Entomol. 1986, 118, 511–515. [Google Scholar] [CrossRef]
  26. Li, S.; Wang, R.-H.; Yao, Y.; Sun, B.-J.; Lin, X.-L. Review of the Rheotanytarsus acerbus species group from China (Diptera: Chironomidae). Zool. Syst. 2024, 49, 343–351. [Google Scholar] [CrossRef]
  27. Langton, P.H.A.; Patrick, D. Rheotanytarsus rioensis (Diptera: Chironomidae), a new species of the pentapoda group from the Canary Islands. Br. J. Entomol. Nat. Hist. 1995, 8, 11–17. [Google Scholar]
  28. Lin, X.-L.; Stur, E.; Ekrem, T. Exploring genetic divergence in a species-rich insect genus using 2790 DNA barcodes. PLoS ONE 2015, 10, e0138993. [Google Scholar] [CrossRef]
  29. Morse, J.C. Biodiversity of aquatic insects. In Insect Biodiversity: Science and Society; Wiley: Hoboken, NJ, USA, 2017; pp. 205–227. [Google Scholar] [CrossRef]
  30. Hebert, P.D.; Cywinska, A.; Ball, S.L.; DeWaard, J.R. Biological identifications through DNA barcodes. Proc. R. Soc. Lond. Ser. B Biol. Sci. 2003, 270, 313–321. [Google Scholar] [CrossRef]
  31. Hebert, P.D.; Ratnasingham, S.; De Waard, J.R. Barcoding animal life: Cytochrome c oxidase subunit 1 divergences among closely related species. Proc. R. Soc. Lond. Ser. B Biol. Sci. 2003, 270, S96–S99. [Google Scholar] [CrossRef] [PubMed]
  32. Hebert, P.D.; Stoeckle, M.Y.; Zemlak, T.S.; Francis, C.M. Identification of birds through DNA barcodes. PLoS Biol. 2004, 2, e312. [Google Scholar] [CrossRef]
  33. DeSalle, R.; Egan, M.G.; Siddall, M. The unholy trinity: Taxonomy, species delimitation and DNA barcoding. Philos. Trans. R. Soc. B Biol. Sci. 2005, 360, 1905–1916. [Google Scholar] [CrossRef]
  34. Hebert, P.D.N.; Ratnasingham, S.; Zakharov, E.V.; Telfer, A.C.; Levesque-Beaudin, V.; Milton, M.A.; Pedersen, S.; Jannetta, P.; Dewaard, J.R. Counting animal species with DNA barcodes: Canadian insects. Philos. Trans. R. Soc. B Biol. Sci. 2016, 371, 20150333. [Google Scholar] [CrossRef]
  35. Chimeno, C.; Hausmann, A.; Schmidt, S.; Raupach, M.J.; Doczkal, D.; Baranov, V.; Hübner, J.; Höcherl, A.; Albrecht, R.; Jaschhof, M.; et al. Peering into the darkness: DNA barcoding reveals surprisingly high diversity of unknown species of Diptera (Insecta) in Germany. Insects 2022, 13, 82. [Google Scholar] [CrossRef]
  36. Srivathsan, A.; Ang, Y.; Heraty, J.M.; Hwang, W.S.; Jusoh, W.F.; Kutty, S.N.; Puniamoorthy, J.; Yeo, D.; Roslin, T.; Meier, R. Convergence of dominance and neglect in flying insect diversity. Nat. Ecol. Evol. 2023, 7, 1012–1021. [Google Scholar] [CrossRef]
  37. Ratnasingham, S.; Hebert, P.D. A DNA-based registry for all animal species: The Barcode Index Number (BIN) system. PLoS ONE 2013, 8, e66213. [Google Scholar] [CrossRef]
  38. Lai, Y.; Li, K.; Liu, X. Comprehensive DNA barcode reference library and optimization of genetic divergence threshold facilitate the exploration of species diversity of green lacewings (Neuroptera: Chrysopidae). Insect Sci. 2024, 31, 613–632. [Google Scholar] [CrossRef]
  39. Lai, Y.; Liu, Y.; Liu, X. Elevational diversity patterns of green lacewings (Neuroptera: Chrysopidae) uncovered with DNA barcoding in a biodiversity hotspot of Southwest China. Front. Ecol. Evol. 2021, 9, 778686. [Google Scholar] [CrossRef]
  40. Lin, X.-L.; Yu, H.-J.; Wang, Q.; Bu, W.-J.; Wang, X.-H. DNA barcodes and morphology confirm a new species of Rheocricotopus (Psilocricotopus) orientalis group (Diptera: Chironomidae). Zootaxa 2020, 4768, 282–290. [Google Scholar] [CrossRef]
  41. Meusnier, I.; Singer, G.A.; Landry, J.-F.; Hickey, D.A.; Hebert, P.D.; Hajibabaei, M. A universal DNA mini-barcode for biodiversity analysis. BMC Genom. 2008, 9, 1–4. [Google Scholar] [CrossRef]
  42. Hajibabaei, M.; Smith, M.A.; Janzen, D.H.; Rodriguez, J.J.; Whitfield, J.B.; Hebert, P.D. A minimalist barcode can identify a specimen whose DNA is degraded. Mol. Ecol. Notes 2006, 6, 959–964. [Google Scholar] [CrossRef]
  43. Bucklin, A.; Steinke, D.; Blanco-Bercial, L. DNA barcoding of marine metazoa. Annu. Rev. Mar. Sci. 2011, 3, 471–508. [Google Scholar] [CrossRef]
  44. Willyard, A.; Cronn, R.; Liston, A. Reticulate evolution and incomplete lineage sorting among the ponderosa pines. Mol. Phylogenetics Evol. 2009, 52, 498–511. [Google Scholar] [CrossRef]
  45. Dupuis, J.R.; Roe, A.D.; Sperling FA, H. Multi-locus species delimitation in closely related animals and fungi: One marker is not enough. Mol. Ecol. 2012, 21, 4422–4436. [Google Scholar] [CrossRef] [PubMed]
  46. Satler, J.D.; Carstens, B.C.; Hedin, M. Multilocus Species Delimitation in a Complex of Morphologically Conserved Trapdoor Spiders (Mygalomorphae, Antrodiaetidae, Aliatypus). Syst. Biol. 2013, 62, 805–823. [Google Scholar] [CrossRef] [PubMed]
  47. Prebus, M.M. Phylogenomic species delimitation in the ants of the Temnothorax salvini group (Hymenoptera: Formicidae): An integrative approach. Syst. Entomol. 2021, 46, 307–326. [Google Scholar] [CrossRef]
  48. Kim, D.; Taylor, A.T.; Near, T.J. Phylogenomics and species delimitation of the economically important Black Basses (Micropterus). Sci. Rep. 2022, 12, 9113. [Google Scholar] [CrossRef]
  49. Gostel, M.R.; Kress, W.J. The expanding role of DNA barcodes: Indispensable tools for ecology, evolution, and conservation. Diversity 2022, 14, 213. [Google Scholar] [CrossRef]
  50. Packer, L.; Gibbs, J.; Sheffield, C.; Hanner, R. DNA barcoding and the mediocrity of morphology. Mol. Ecol. Resour. 2009, 9, 42–50. [Google Scholar] [CrossRef]
  51. Taberlet, P.; Bonin, A.; Zinger, L.; Coissac, E. Environmental DNA: For Biodiversity Research and Monitoring; Oxford University Press: Oxford, UK, 2018. [Google Scholar] [CrossRef]
  52. Virgilio, M.; Backeljau, T.; Nevado, B.; De Meyer, M. Comparative performances of DNA barcoding across insect orders. BMC Bioinform. 2010, 11, 1–10. [Google Scholar] [CrossRef]
  53. Ratnasingham, S.; Hebert, P.D. BOLD: The Barcode of Life Data System (http://www.barcodinglife.org). Mol. Ecol. Notes 2007, 7, 355–364. [Google Scholar] [CrossRef]
  54. Fontaneto, D.; Flot, J.-F.; Tang, C.Q. Guidelines for DNA taxonomy, with a focus on the meiofauna. Mar. Biodivers. 2015, 45, 433–451. [Google Scholar] [CrossRef]
  55. Ratnasingham, S.; Wei, C.; Chan, D.; Agda, J.; Agda, J.; Ballesteros-Mejia, L.; Boutou, H.A.; El Bastami, Z.M.; Ma, E.; Manjunath, R.; et al. BOLD v4: A Centralized Bioinformatics Platform for DNA-Based Biodiversity Data. In DNA Barcoding. Methods in Molecular Biology, 2744th ed.; DeSalle, R., Ed.; Humana: New York, NY, USA, 2024; pp. 403–441. [Google Scholar]
  56. Lin, X.-L.; Stur, E.; Ekrem, T. DNA barcodes and morphology reveal unrecognized species in Chironomidae (Diptera). Insect Syst. Evol. 2018, 49, 329–398. [Google Scholar] [CrossRef]
  57. Song, C.; Lin, X.-L.; Wang, Q.; Wang, X.-H. DNA barcodes successfully delimit morphospecies in a superdiverse insect genus. Zool. Scr. 2018, 47, 311–324. [Google Scholar] [CrossRef]
  58. Lin, X.-L.; Mo, L.-D.; Bu, W.-J.; Wang, X.-H. The first comprehensive DNA barcode reference library of Chinese Tanytarsus (Diptera: Chironomidae) for environmental DNA metabarcoding. Divers. Distrib. 2021, 27, 1932–1941. [Google Scholar] [CrossRef]
  59. Song, C.; Chen, G.; Wang, L.; Lei, T.; Qi, X. DNA Barcoding Supports “Color-Pattern’’-Based Species of Stictochironomus from China (Diptera: Chironomidae). Insects 2024, 15, 179. [Google Scholar] [CrossRef]
  60. Wang, H.; Xu, H.-F.; Li, C.-H.; Zhang, H.-X.; Zhang, Y.-P.; Sun, B.-J.; Lin, X.-L. Towards a Comprehensive DNA Barcode Library of Stenochironomus Kieffer, 1919 (Diptera: Chironomidae) from China. Diversity 2024, 16, 257. [Google Scholar] [CrossRef]
  61. Qi, X.; Yao, Y.; Liu, W.-B.; Yan, C.-C.; Wang, X.-H.; Lin, X.-L. Review of the Rheotanytarsus muscicola species group from China (Diptera: Chironomidae). Diversity 2022, 14, 383. [Google Scholar] [CrossRef]
  62. Li, S.-Y.; Yao, Y.; Sun, L.; Ling, H.-N.; Jin, W.-D.; Lin, X.-L. DNA barcodes and morphology reveal new species within the Rheotanytarsus guineensis species group from China (Diptera: Chironomidae). Arch. Insect Biochem. Physiol. 2023, 114, e22060. [Google Scholar] [CrossRef]
  63. Sæther, O.A. Some Nearctic Podonominae, Diamesinae, and Orthocladiinae (Diptera: Chironomidae). In Bulletin of the Fisheries Research Board of Canada; Fisheries Research Board of Canada: Vancouver, BC, USA, 1969; Volume 170, pp. 1–154. Available online: https://books.google.co.uk/books?id=1jAntAEACAAJ (accessed on 12 January 2025).
  64. Wang, X.-H.; Guo, Y.-H. A review of the genus Rheotanytarsus Thienemann & Bause from China (Diptera: Chironomidae: Tanytarsini). Zootaxa 2004, 650, 1–19. [Google Scholar] [CrossRef]
  65. Moubayed-Breil, J.; Langton, P.H.; Ashe, P. Rheotanytarsus dactylophoreus, a new mountain species from streams in the Eastern Pyrenees and Corsica (Diptera: Chironomidae). Fauna Nor. 2012, 31, 167. [Google Scholar] [CrossRef]
  66. Yao, Y.; Liu, W.-B.; Wang, X.-H.; Lin, X.-L. Rheotanytarsus baihualingensis and R. diaoluoensis (Diptera: Chironomidae), Two New Species from Oriental China. Ann. Zool. Fenn. 2022, 59, 149–154. [Google Scholar] [CrossRef]
  67. Edgar, R.C. MUSCLE: Multiple sequence alignment with high accuracy and high throughput. Nucleic Acids Res. 2004, 32, 1792–1797. [Google Scholar] [CrossRef]
  68. Saitou, N.; Nei, M. The neighbor-joining method: A new method for reconstructing phylogenetic trees. Mol. Biol. Evol. 1987, 4, 406–425. [Google Scholar] [CrossRef] [PubMed]
  69. Felsenstein, J. Evolutionary trees from DNA sequences: A maximum likelihood approach. J. Mol. Evol. 1981, 17, 368–376. [Google Scholar] [CrossRef]
  70. Puillandre, N.; Lambert, A.; Brouillet, S.; Achaz, G. ABGD, Automatic Barcode Gap Discovery for primary species delimitation. Mol. Ecol. 2012, 21, 1864–1877. [Google Scholar] [CrossRef] [PubMed]
  71. Kapli, P.; Lutteropp, S.; Zhang, J.; Kobert, K.; Pavlidis, P.; Stamatakis, A.; Flouri, T. Multi-rate Poisson tree processes for single-locus species delimitation under maximum likelihood and Markov chain Monte Carlo. Bioinformatics 2017, 33, 1630–1638. [Google Scholar] [CrossRef]
  72. Pons, J.; Barraclough, T.G.; Gomez-Zurita, J.; Cardoso, A.; Duran, D.P.; Hazell, S.; Kamoun, S.; Sumlin, W.D.; Vogler, A.P. Sequence-Based Species Delimitation for the DNA Taxonomy of Undescribed Insects. Syst. Biol. 2006, 55, 595–609. [Google Scholar] [CrossRef] [PubMed]
  73. Kimura, M. A simple method for estimating evolutionary rates of base substitutions through comparative studies of nucleotide sequences. J. Mol. Evol. 1980, 16, 111–120. [Google Scholar] [CrossRef]
  74. Tamura, K.; Stecher, G.; Kumar, S. MEGA11: Molecular evolutionary genetics analysis version 11. Mol. Biol. Evol. 2021, 38, 3022–3027. [Google Scholar] [CrossRef]
  75. Bouckaert, R.; Vaughan, T.G.; Barido-Sottani, J.; Duchêne, S.; Fourment, M.; Gavryushkina, A.; Heled, J.; Jones, G.; Kühnert, D.; De Maio, N.; et al. BEAST 2.5: An advanced software platform for Bayesian evolutionary analysis. PLoS Comput. Biol. 2019, 15, 1006650. [Google Scholar] [CrossRef]
  76. Rambaut, A.; Drummond, A.J.; Xie, D.; Baele, G.; Suchard, M.A. Posterior Summarization in Bayesian Phylogenetics Using Tracer 1.7. Syst. Biol. 2018, 67, 901–904. [Google Scholar] [CrossRef]
  77. Excoffier, L.; Lischer HE, L. Arlequin suite ver 3.5: A new series of programs to perform population genetics analyses under Linux and Windows. Mol. Ecol. Resour. 2010, 10, 564–567. [Google Scholar] [CrossRef]
  78. Rozas, J.; Ferrer-Mata, A.; Sánchez-DelBarrio, J.C.; Guirao-Rico, S.; Librado, P.; Ramos-Onsins, S.E.; Sánchez-Gracia, A. DnaSP 6: DNA Sequence Polymorphism Analysis of Large Data Sets. Mol. Biol. Evol. 2017, 34, 3299–3302. [Google Scholar] [CrossRef]
  79. Kyerematen, R.A.; Sæther, O.A.; Andersenn, T. A review of the Rheotanytarsus pellucidus group (Diptera: Chironomidae). In Proceedings of the Late 20th Century Research on Chironomidae: An Anthology from the 13th International Symposium on Chironomidae, Freiburg, Germany, 5–9 September 1997; Shaker: Maastricht, Germany, 2000. [Google Scholar]
  80. Puillandre, N.; Brouillet, S.; Achaz, G. ASAP: Assemble species by automatic partitioning. Mol. Ecol. Resour. 2021, 21, 609–620. [Google Scholar] [CrossRef] [PubMed]
  81. Song, C.; Wang, L.; Lei, T.; Qi, X. New Color-Patterned Species of Microtendipes Kieffer, 1913 (Diptera: Chironomidae) and a Deep Intraspecific Divergence of Species by DNA Barcodes. Insects 2023, 14, 227. [Google Scholar] [CrossRef]
  82. Monaghan, M.T.; Wild, R.; Elliot, M.; Fujisawa, T.; Balke, M.; Inward, D.J.; Lees, D.C.; Ranaivosolo, R.; Eggleton, P.; Barraclough, T.G.; et al. Accelerated Species Inventory on Madagascar Using Coalescent-Based Models of Species Delineation. Syst. Biol. 2009, 58, 298–311. [Google Scholar] [CrossRef] [PubMed]
  83. Young, M.R.; Behan-Pelletier, V.M.; Hebert PD, N. Revealing the Hyperdiverse Mite Fauna of Subarctic Canada through DNA Barcoding. PLoS ONE 2012, 7, e0048755. [Google Scholar] [CrossRef]
  84. Yin, Y.; Hu, Y.; Shao, Z.-K.; Yao, L.-F.; Li, N.; Hebert PD, N.; Xue, X.-F. Factors affecting the accuracy of molecular delimitation in minute herbivorous mites (Acari: Eriophyoidea). Zool. Scr. 2023, 52, 531–542. [Google Scholar] [CrossRef]
  85. Yang, Z.; Rannala, B. Bayesian species identification under the multispecies coalescent provides significant improvements to DNA barcoding analyses. Mol. Ecol. 2017, 26, 3028–3036. [Google Scholar] [CrossRef]
  86. Havermans, C.; Nagy, Z.T.; Sonet, G.; De Broyer, C.; Martin, P. DNA barcoding reveals new insights into the diversity of Antarctic species of Orchomene sensu lato (Crustacea: Amphipoda: Lysianassoidea). Deep. Sea Res. Part. II Top. Stud. Oceanogr. 2011, 58, 230–241. [Google Scholar] [CrossRef]
  87. Schmidt, S.; Schmid-Egger, C.; Morinière, J.; Haszprunar, G.; Hebert, P.D.N. DNA barcoding largely supports 250 years of classical taxonomy: Identifications for Central European bees (Hymenoptera, Apoidea partim). Mol. Ecol. Resour. 2015, 15, 985–1000. [Google Scholar] [CrossRef]
  88. Monaghan, M.T.; Balke, M.; Gregory, T.R.; Vogler, A.P. DNA-based species delineation in tropical beetles using mitochondrial and nuclear markers. Philos. Trans. R. Soc. B Biol. Sci. 2005, 360, 1925–1933. [Google Scholar] [CrossRef]
  89. Webb, J.M.; Jacobus, L.M.; Funk, D.H.; Zhou, X.; Kondratieff, B.; Geraci, C.J.; DeWalt, R.E.; Baird, D.J.; Richard, B.; Phillips, I.; et al. A DNA Barcode Library for North American Ephemeroptera: Progress and Prospects. PLoS ONE 2012, 7, e0038063. [Google Scholar] [CrossRef]
  90. Hlebec, D.; Sivec, I.; Podnar, M.; Kučinić, M. DNA barcoding for biodiversity assessment: Croatian stoneflies (Insecta: Plecoptera). PeerJ 2022, 10, 13213. [Google Scholar] [CrossRef]
  91. Nzelu, C.O.; Cáceres, A.G.; Arrunátegui-Jiménez, M.J.; Lañas-Rosas, M.F.; Yañez-Trujillano, H.H.; Luna-Caipo, D.V.; Holguín-Mauricci, C.E.; Katakura, K.; Hashiguchi, Y.; Kato, H. DNA barcoding for identification of sand fly species (Diptera: Psychodidae) from leishmaniasis-endemic areas of Peru. Acta Trop. 2015, 145, 45–51. [Google Scholar] [CrossRef] [PubMed]
  92. Pauls, S.U.; Blahnik, R.J.; Zhou, X.; Wardwell, C.T.; Holzenthal, R.W. DNA barcode data confirm new species and reveal cryptic diversity in Chilean Smicridea (Smicridea) (Trichoptera:Hydropsychidae). J. N. Am. Benthol. Soc. 2010, 29, 1058–1074. [Google Scholar] [CrossRef]
  93. Montagna, M.; Mereghetti, V.; Lencioni, V.; Rossaro, B. Integrated Taxonomy and DNA Barcoding of Alpine Midges (Diptera: Chironomidae). PLoS ONE 2016, 11, e0149673. [Google Scholar] [CrossRef]
  94. Kang, H.J.; Baek, M.J.; Kang, J.H.; Bae, Y.J. Diversity and DNA Barcode Analysis of Chironomids (Diptera: Chironomidae) from Large Rivers in South Korea. Insects 2022, 13, 346. [Google Scholar] [CrossRef]
  95. Gadawski, P.; Montagna, M.; Rossaro, B.; Giłka, W.; Pešić, V.; Grabowski, M.; Magoga, G. DNA barcoding of Chironomidae from the Lake Skadar region: Reference library and a comparative analysis of the European fauna. Divers. Distrib. 2022, 28, 2838–2857. [Google Scholar] [CrossRef]
  96. Kondo, N.I.; Ueno, R.; Ohbayashi, K.; Golygina, V.V.; Takamura, K. DNA barcoding supports reclassification of Japanese Chironomus species (Diptera: Chironomidae). Entomol. Sci. 2016, 19, 337–350. [Google Scholar] [CrossRef]
  97. Vences, M.; Miralles, A.; Dufresnes, C. Next-generation species delimitation and taxonomy: Implications for biogeography. J. Biogeogr. 2024, 51, 1709–1722. [Google Scholar] [CrossRef]
  98. Bickford, D.; Lohman, D.J.; Sodhi, N.S.; Ng, P.K.; Meier, R.; Winker, K.; Ingram, K.K.; Das, I. Cryptic species as a window on diversity and conservation. Trends Ecol. Evol. 2007, 22, 148–155. [Google Scholar] [CrossRef]
  99. Chimeno, C.; Rulik, B.; Manfrin, A.; Kalinkat, G.; Hölker, F.; Baranov, V. Facing the infinity: Tackling large samples of challenging Chironomidae (Diptera) with an integrative approach. PeerJ 2023, 11, 15336. [Google Scholar] [CrossRef]
  100. Chen, J.; Zhang, R. Two new species of subgenus Tripodura Towns (Diptera, Chironomidae, Polypedilum) from Oriental China. Zootaxa 2021, 5072, 191–199. [Google Scholar] [CrossRef] [PubMed]
  101. Liu, W.-B.; Yao, Y.; Yan, C.-C.; Wang, X.-H.; Lin, X.-L. A New Species of Polypedilum (Cerobregma) (Diptera, Chironomidae) from Oriental China. ZooKeys 2021, 1011, 139–148. [Google Scholar] [CrossRef] [PubMed]
  102. Lehmann, J. Revision der europäischen Arten (Imagines♂♂ und Puppen♂♂) der Gattung Rheotanytarsus BAUSE (Diptera, Chironomidae). Zool. Anz. 1970, 185, 343–378. [Google Scholar]
  103. Slatkin, M. Gene Flow and the Geographic Structure of Natural Populations. Science 1987, 236, 787–792. [Google Scholar] [CrossRef]
  104. Chua, P.Y.; Bourlat, S.J.; Ferguson, C.; Korlevic, P.; Zhao, L.; Ekrem, T.; Meier, R.; Lawniczak, M.K. Future of DNA-based insect monitoring. Trends Genet. 2023, 39, 531–544. [Google Scholar] [CrossRef]
  105. Wagner, D.L.; Grames, E.M.; Forister, M.L.; Berenbaum, M.R.; Stopak, D. Insect decline in the Anthropocene: Death by a thousand cuts. Proc. Natl. Acad. Sci. USA 2021, 118, e2023989118. [Google Scholar] [CrossRef]
  106. Wong, M.K.; Didham, R.K. Global meta-analysis reveals overall higher nocturnal than diurnal activity in insect communities. Nat. Commun. 2024, 15, 3236. [Google Scholar] [CrossRef]
  107. Raitif, J.; Roussel, J.-M.; Olmos, M.; Piscart, C.; Plantegenest, M. Assessing spatial deposition of aquatic subsidies by insects emerging from agricultural streams. Sci. Total Environ. 2022, 837, 155686. [Google Scholar] [CrossRef]
  108. Wilson, J.-J.; Sing, K.-W.; Floyd, R.M.; Hebert, P.D.N. DNA Barcodes and Insect Biodiversity. In Insect Biodiversity; Wiley: Hoboken, NJ, USA, 2017; pp. 575–592. [Google Scholar]
  109. Moritz, C.; Cicero, C. DNA Barcoding: Promise and Pitfalls. PLoS Biol. 2004, 2, e0020354. [Google Scholar] [CrossRef]
  110. Pedrosa, J.A.M.; Cocchiararo, B.; Verdelhos, T.; Soares, A.M.V.M.; Pestana, J.L.T.; Nowak, C. Population genetic structure and hybridization patterns in the cryptic sister species Chironomus riparius and Chironomus piger across differentially polluted freshwater systems. Ecotox Environ. Safe 2017, 141, 280–289. [Google Scholar] [CrossRef]
  111. Michailova, P. Cytogenetic analysis of a hybrid, Glyptotendipes pallens Mg. ×Glyptotendipes glaucus Mg. (Diptera, Chironomidae): Evolutionary considerations. J. Zool. Syst. Evol. Res. 1998, 36, 185–189. [Google Scholar] [CrossRef]
  112. Polukonova, N.V.; Beljanina, S.I. On the Possibility of Hybridogenesis in the Origin of Midge Chironomus usenicus Loginova et Beljanina (Chironomidae, Diptera). Russ. J. Genet. 2002, 38, 1385–1390. [Google Scholar] [CrossRef]
  113. Monaghan, M.T.; Balke, M.; Pons, J.; Vogler, A.P. Beyond barcodes: Complex DNA taxonomy of a South Pacific Island radiation. Proc. R. Soc. B Biol. Sci. 2005, 273, 887–893. [Google Scholar] [CrossRef]
  114. Feng, S.; Bai, M.; Rivas-González, I.; Li, C.; Liu, S.; Tong, Y.; Yang, H.; Chen, G.; Xie, D.; Sears, K.E.; et al. Incomplete lineage sorting and phenotypic evolution in marsupials. Cell 2022, 185, 1646–1660.e18. [Google Scholar] [CrossRef]
  115. Collins, R.A.; Cruickshank, R.H. The seven deadly sins of DNA barcoding. Mol. Ecol. Resour. 2013, 13, 969–975. [Google Scholar] [CrossRef]
  116. Bianchi, F.M.; Gonçalves, L.T. Getting science priorities straight: How to increase the reliability of specimen identification? Biol. Lett. 2021, 17, 20200874. [Google Scholar] [CrossRef]
  117. Gadawski, P. Species Diversity and Origin of Non-Biting Midges (Chironomidae) from a Geologically Young Lake and Its Old Spring System. PhD Thesis, University of Lodz, Łódź, Poland, 2020. [Google Scholar]
  118. Hebert, P.D.N.; Bock, D.G.; Prosser, S.W.J. Interrogating 1000 insect genomes for NUMTs: A risk assessment for estimates of species richness. PLoS ONE 2023, 18, e0286620. [Google Scholar] [CrossRef]
  119. Hartop, E.; Srivathsan, A.; Ronquist, F.; Meier, R. Towards Large-Scale Integrative Taxonomy (LIT): Resolving the Data Conundrum for Dark Taxa. Syst. Biol. 2022, 71, 1404–1422. [Google Scholar] [CrossRef]
  120. Van Klink, R.; August, T.; Bas, Y.; Bodesheim, P.; Bonn, A.; Fossøy, F.; Høye, T.T.; Jongejans, E.; Menz, M.H.; Miraldo, A.; et al. Emerging technologies revolutionise insect ecology and monitoring. Trends Ecol. Evol. 2022, 37, 872–885. [Google Scholar] [CrossRef]
  121. Milošević, D.; Milosavljević, A.; Predić, B.; Medeiros, A.S.; Savić-Zdravković, D.; Piperac, M.S.; Kostić, T.; Spasić, F.; Leese, F. Application of deep learning in aquatic bioassessment: Towards automated identification of non-biting midges. Sci. Total Environ. 2020, 711, 135160. [Google Scholar] [CrossRef] [PubMed]
Figure 1. Distribution map of Rheotanytarsus based on the library of this study.
Insects 16 00370 g001
Figure 2. Frequency distribution of genetic distances (A) and ranked genetic distance curve (B) from the ABGD analysis of COI sequences for Rheotanytarsus.
Insects 16 00370 g002
Figure 3. Summary of genetic distances for 69 species (K2P model): red squares (max intraspecific), purple crosses (min interspecific), blue circles (max interspecific); species codes as in Table 1.
Insects 16 00370 g003
Figure 4. Genetic structure of Rheotanytarsus pentapoda. (A) NJ tree based on K2P genetic distances, with distinct BINs highlighted in different colors. The scale bar represents K2P genetic distances. Numbers on branches indicate bootstrap support values (>70%) based on 1000 replicates. (B) TCS network based on the COI sequences of R. pentapoda, where node size indicates sample size and colors represent different geographic origins (CA—Canada, CN—China, DE—Germany, FI—Finland, NO—Norway, US—United States).
Insects 16 00370 g004
Figure 5. Genetic structure of Rheotanytarsus pellucidus. (A) NJ tree based on K2P genetic distances, with the scale bar representing K2P genetic distances. Numbers on branches indicate bootstrap support values (>70%) based on 1000 replicates. (B) TCS network based on the COI sequences of R. pellucidus, where node size indicates sample size. Colors in both panels represent different geographic origins (CA—Canada, FI—Finland, NO—Norway, US—United States).
Insects 16 00370 g005
Table 1. Specimen Counts, Recorded Countries, and BINs for Species of the Genus Rheotanytarsus.
Order *Species IdentificationSpecimensTotal CountriesTotal BINs
1Rheotanytarsus sp. 1211
2Rheotanytarsus pellucidus3726
3Rheotanytarsus sp. 25511
4Rheotanytarsus pentapoda57612
5Rheotanytarsus sp. 33533
6Rheotanytarsus ringei19531
7Rheotanytarsus sp. 4311
8Rheotanytarsus ashei1713
9Rheotanytarsus sp. 5XL211
10Rheotanytarsus sp. 55112
11Rheotanytarsus sp. 63811
12Rheotanytarsus sp. 7111
13Rheotanytarsus yamamotoi2017
14Rheotanytarsus diaoluoensis111
15Rheotanytarsus sp. 11XL311
16Rheotanytarsus baihualingensis312
17Rheotanytarsus muscicola4552
18Rheotanytarsus curtistylus111
19Rheotanytarsus oss111
20Rheotanytarsus vallenduuki111
21Rheotanytarsus ferringtoni511
22Rheotanytarsus sp. 19XL2811
23Rheotanytarsus sp. 3XL111
24Rheotanytarsus guoae211
25Rheotanytarsus sp. 6XL311
26Rheotanytarsus fluminis211
27Rheotanytarsus sp. 2XL1141
28Rheotanytarsus photophilus511
29Rheotanytarsus sp. 17XL211
30Rheotanytarsus sp. 13XL411
31Rheotanytarsus yueqingensis311
32Rheotanytarsus sp. 9XL111
33Rheotanytarsus sp. 12XL111
34Rheotanytarsus miaoae111
35Rheotanytarsus sp. 20XL311
36Rheotanytarsus sp. 14XL911
37Rheotanytarsus cangshanensis811
38Rheotanytarsus sp. 21XL211
39Rheotanytarsus illiesi613
40Rheotanytarsus qiangi111
41Rheotanytarsus sp. 24XL313
42Rheotanytarsus sp. 8XL111
43Rheotanytarsus sp. 16XL111
44Rheotanytarsus sp. 23XL111
45Rheotanytarsus sp. 15XL311
46Rheotanytarsus adjectus111
47Rheotanytarsus guanacastensis321
48Rheotanytarsus sp. 3TE111
49Rheotanytarsus sp. 2TE521
50Rheotanytarsus pellucidus1312
51Rheotanytarsus sp. TE014011
52Rheotanytarsus sp. 83822
53Rheotanytarsus sp. 94521
54Rheotanytarsus exiguus group sp.111
55Rheotanytarsus sp. 7XL111
56Rheotanytarsus sp. TE-20063121
57Rheotanytarsus sp. 10621
58Rheotanytarsus sp. 11212
59Rheotanytarsus sp. 22XL521
60Rheotanytarsus cf. ringei211
61Rheotanytarsus yui511
62Rheotanytarsus pinderi111
63Rheotanytarsus sp. 4XL111
64Rheotanytarsus sp. 1XL211
65Rheotanytarsus falcipedius511
66Rheotanytarsus sp. 18XL412
67Rheotanytarsus sp. 10XL111
68Rheotanytarsus sp. 121812
69Rheotanytarsus sp. 13513
Total91115109
* The species are arranged in accordance with the NJ tree (Figure S1).
Disclaimer/Publisher’s Note: The statements, opinions and data contained in all publications are solely those of the individual author(s) and contributor(s) and not of MDPI and/or the editor(s). MDPI and/or the editor(s) disclaim responsibility for any injury to people or property resulting from any ideas, methods, instructions or products referred to in the content.

