Article

Forecasting the Impact of Climate Change on Apis dorsata (Fabricius, 1793) Habitat and Distribution in Pakistan

1
Guangdong Key Laboratory of Animal Conservation and Resource Utilization, Institute of Zoology, Guangdong Academy of Sciences, Guangzhou 510260, China
2
School of Ecology and Nature Conservation, Beijing Forestry University, Beijing 100083, China
3
Department of Zoology, Institute of Molecular Biology and Biotechnology, University of Lahore, Lahore 54000, Pakistan
4
Center of Biotechnology and Microbiology, University of Swat, Swat 19120, Pakistan
5
Department of Zoology, Kohat University of Science and Technology, Kohat 26000, Pakistan
*
Author to whom correspondence should be addressed.
Insects 2025, 16(3), 289; https://doi.org/10.3390/insects16030289
Submission received: 17 December 2024 / Revised: 4 March 2025 / Accepted: 6 March 2025 / Published: 11 March 2025
(This article belongs to the Section Social Insects and Apiculture)

Simple Summary

Climate change is threatening pollinators like Apis dorsata (the giant honey bee), which are vital for ecosystems and agriculture. This study mapped the current habitat and future distribution of A. dorsata in Pakistan using field surveys and climate models. Currently, 23% of our study area is suitable for the species, but future climate scenarios predict a significant loss of habitat, especially in northern high-altitude regions. By 2061–2080, up to 79% of suitable habitat could disappear under extreme climate conditions. These findings highlight the urgent need for conservation efforts to protect A. dorsata and the beekeeping industry in Pakistan.

Abstract

Climate change has led to global biodiversity loss, severely impacting all species, including essential pollinators like bees, which are highly sensitive to environmental changes. Like other bee species, A. dorsata is also not immune to climate change. This study evaluated the habitat suitability of A. dorsata under climate change in Pakistan by utilizing two years of occurrence and distribution data to develop a Maximum Entropy (MaxEnt) model for forecasting current and future habitat distribution. Future habitat projections for 2050 and 2070 were based on two shared socioeconomic pathways (SSP245 and SSP585) using the CNRM-CM6-1 and EPI-ESM1-2-HR-1 global circulation models. Eight bioclimatic variables (Bio1, Bio4, Bio5, Bio8, Bio10, Bio12, Bio18, and Bio19) were selected for modeling, and among the selected variables, the mean temperature of the wettest quarter (Bio8) and precipitation of the warmest quarter (Bio18) showed major contributions to the model building and strongest influence on habitat of A. dorsata. The model estimated 23% of our study area as a suitable habitat for A. dorsata under current climatic conditions, comprising 150,975 km2 of moderately suitable and 49,792 km2 of highly suitable regions. For future climatic scenarios, our model projected significant habitat loss for A. dorsata with a shrinkage and shift towards northern, higher-altitude regions, particularly in Khyber Pakhtunkhwa and the Himalayan foothills. Habitat projections under the extreme climatic scenario (SSP585) are particularly alarming, indicating a substantial loss of the suitable habitat for the A. dorsata of 40% under CNRM-CM6-1 and 79% for EPI-ESM1-2-HR-1 for the 2070 time period. This study emphasizes the critical need for conservation efforts to protect A. dorsata and highlights the species’ role in pollination and supporting the apiculture industry in Pakistan.

1. Introduction

Climate change is affecting every ecosystem [1,2,3,4] and has caused a substantial biodiversity loss [4,5,6]. It has significantly impacted species habitats [7,8] at various local and global geographical scales, leading to habitat degradation and biodiversity loss [9,10,11,12,13]. Habitat degradation driven by climate change is a leading cause for species declines and extinctions [14,15,16,17]. By reducing the available and distribution of suitable habitats [18,19,20,21,22], climate change forces species into less favorable environments [22], severely compromising their survival [4,15,23,24,25,26,27]. These shifts in habitat distribution threaten the survival of diverse life-forms, including plants [28], animals [29], and insects and pollinators [30,31,32,33,34,35]. Pollinators, such as honey bees, are particularly vulnerable due to their reliance on stable environmental conditions and floral resources.
Through pollination, honey bees play a critical role in sustaining global ecosystems [36,37,38]. Therefore, the survival and health of honey bees are essential for agriculture and biodiversity conservation [39,40,41]. Beekeeping also brings economic benefits to rural areas in developing countries like Pakistan, thus alleviating poverty [42]. Honey bees pollinate and make honey and royal jelly, which are used as food and play an essential role in medicines and cosmetics. Other major bee products like bee venom, propolis, pollen, and wax are also very important economically and used in pharmaceutical industries [43,44,45]. Honey bees are of economic importance to humans because they produce honey in substantial amounts compared to other honey bee species. They can yield between 50 and 80 kg of honey per colony, as recorded by [46]. However, wild bee species, such as Apis dorsata, are not domesticated and play a more significant role in pollination than in honey production [47]. Unfortunately, the honey bee population globally faces several challenges, including exposure to chemical pollution [48], emerging pathogens [39] climate change [49], and escalating anthropogenic activities [50,51]. Therefore, understanding the climatic and environmental impacts on honey bee survival and health is essential for conservation and management. Climate change is depleting bee habitats and food supplies, resulting in severe bee population declines [51]. In comparison to managed bees, wild bees are considerably more challenging to conserve due to their limited control over their livelihood and movement pattern [52].
Among the wild honey bees in Pakistan, Apis dorsata (Fabricius, 1793) is one of the most ecologically significant species [53]. A. dorsata, also called the rock honey bee, inhibits the plains and foothills of Pakistan. In mountainous regions, such as the Himalayan highlands, it can be found at 1000 to 1700 m above sea level, and they can even migrate up to 2000 m during seasonal migrations to find new nesting sites or food sources [54]. It frequently builds nests in the air, between 3 and 25 m above ground [55]. Combs of A. dorsata are typically large, measuring 1.5 to 2.1 m wide and 0.6 to 1.2 m tall, which makes them unique among wild bees [56]. It has adapted to regions in Pakistan characterized by tall trees and hilly terrains. A study on diversity and abundance of honey bee species conducted in Murree (the northern mountainous region of Pakistan) [57] concluded that A. dorsata is the most prevalent species in the area. This species is also reported in Rawalpindi, Khaniwal, Lahore, Kasur, Chakwal, Nankana, Attock, Narowal, Haripur, Jhelum, Gujrat, Sialkot, (Punjab), Mirpur, and Bhimber (AJK) [58,59,60].
Species distribution modeling (SDM) offers a valuable tool for studying how environmental conditions and climatic factors influence species habitat and distribution. Many SDMs have been developed for estimating the relationship between environmental factors and species occurrence records and for predicting potential distribution of species, including Maximum Entropy [61], ecological niche factor analysis, Climex Dymex, and bioclimatic modeling. Among these, MaxEnt is one of the most popular methods since it has high precision and strong robustness [62,63,64,65,66,67,68,69,70,71]. Maximum Entropy (MaxEnt) can assess both continuous and categorical data and produce a readily interpretable continuous probabilistic output by using a small sample size with high accuracy and statistical significance.
In Pakistan, agriculture is a cornerstone of the economy, and pollinators like A. dorsata (rock honey bee) are critical for the pollination of cash crops such as fruits, vegetables, and oilseeds. These crops have a combined pollination-dependent production value of USD 1.59 billion, underscoring the economic and nutritional importance of pollinators [72]. However, climate change, deforestation, excessive pesticide use, and other anthropogenic pressures are threatening pollinator populations, contributing to habitat loss and food insecurity [73,74]. Ranked fifth among the most climate-vulnerable nations, Pakistan is highly susceptible to the impacts of climate change [75,76]. Rising annual average temperatures, unprecedented rainfall, glacier shrinkage, and frequent flooding are affecting species and ecosystems across the country [77,78,79,80,81,82,83], contributing to biodiversity loss and species-suitable habitats [71,84,85]. Therefore, this study seeks to assess the effects of rising temperatures and related environmental changes on the habitat suitability of A. dorsata in Pakistan. It is hypothesized that climate-induced temperature increases and environmental shifts will lead to a decline in suitable habitats for A. dorsata.

2. Materials and Methods

2.1. Study Area

Pakistan is geographically very diverse, with the Arabian Sea in the south and the world’s second-highest mountain peak (K2) in the north [86]. The study area lies between 24° and 37° north and 61° and 75° east, over an area of 458,383 km2 (Figure 1). Stretching from the Indian Ocean’s southern coastline to the northern mountain ranges, which rise to an elevation of 7289 m, it encompasses a diverse landscape [87]. The research area’s diversified terrain supports a rich array of biodiversity.

2.2. Occurrence/Presence Data

Field surveys were conducted from 2021 to 2022 across diverse habitats and environmental conditions within the study area to collect data on the presence and distribution of A. dorsata. We conducted questionnaire surveys and interviews with field visits to obtain specific input from local communities, including wildlife experts, residents, and bee keepers. Informed consent was obtained from all study participants before conducting interviews. A questionnaire survey provides reliable information about species status in a particular area [88,89,90]. Furthermore, the previous literature on different ecological aspects of A. dorsata in Pakistan was examined since it offers reliable information about the species distribution and occurrence [91]. Google Earth (http://ditu.google.cn/, accessed on 1 October 2024) was used to ascertain coordinates for presence points extracted from the list of the literature (Supplementary Material Table S1). Additionally, we searched international repositories, including GBIF (Global Biodiversity Information Facility), VertNet, and BIEN (Botanical Information and Ecology Network), to validate and complement our field-collected data. However, no relevant presence points for A. dorsata were found in these datasets. To ensure robust data collection, we cross-verified presence points from three sources: questionnaire interviews, the literature [59,60,92,93,94,95,96,97,98,99,100,101,102,103,104,105,106,107], and field surveys. Field survey points were prioritized for their reliability and accuracy. This meticulous method enhanced data quality and leveraged multiple sources to strengthen the study’s findings.

2.3. Thinning and Partition Occurrence Data Preprocessing of Occurrence/Presence Data

Outliers and duplicate points were removed to reduce the influence of redundancy on model predictions. We obtained a total of 318 occurrence points during the data collection phase. Using the R (version 4.4.1, R Core Team, Vienna, Austria, 2024) package spThin, localities less than 5 km apart were filtered out, resulting in a final dataset of 91 occurrence points used for modeling [108]. Finally, the MaxEnt model employed the rarefied occurrence points’ coordinates (projection WGS 1984). Researchers often partition a single biodiversity dataset into subsets to evaluate the accuracy of a predictive model. Truly independent biodiversity data are often difficult to obtain, so researchers typically validate predictive models using subsets of the same dataset. Occurrence data are divided into two categories: (1) training or calibration data for model development, and (2) testing or evaluation data for model validation [109,110]. We used the R package ENMeval to partition occurrence localities into training and testing datasets. A Jackknife procedure was applied, assigning each occurrence record to a unique group (k = number of localities), a method well-suited for small sample sizes [111,112].

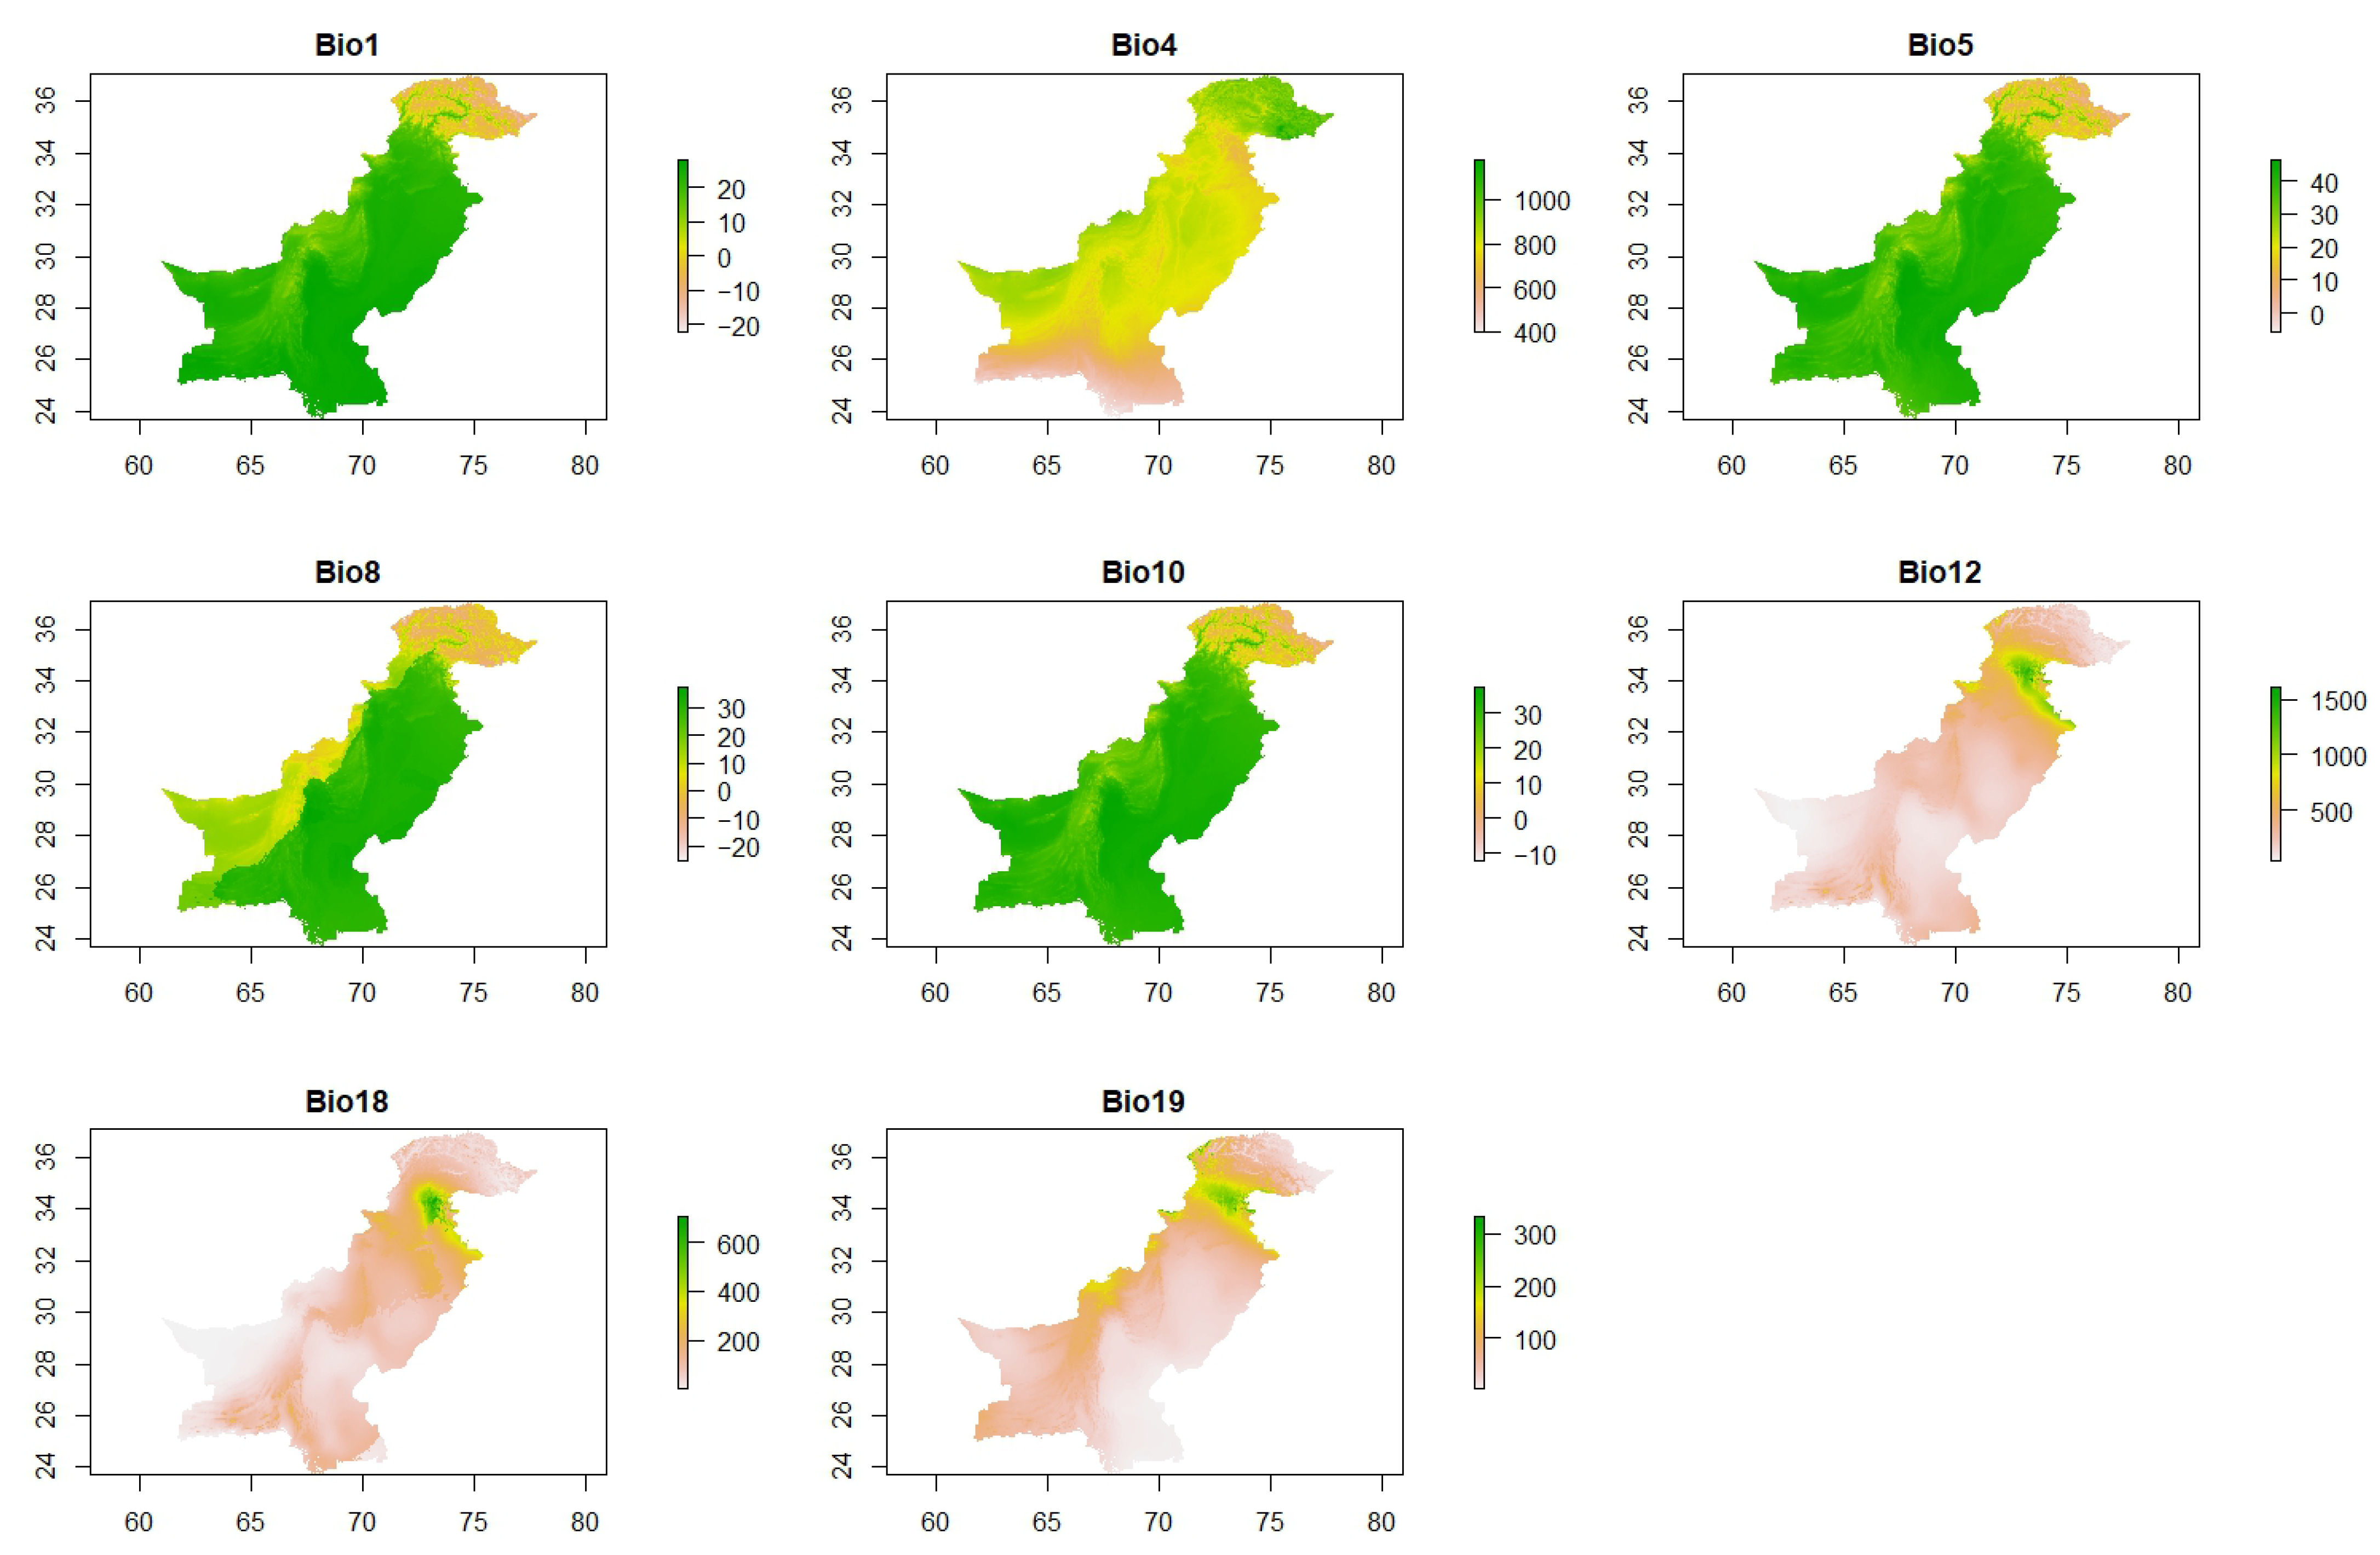
2.4. Selection and Processing of Environmental Variables

Algorithms for niche/distributional modeling need environmental predictor factors and occurrence data [113,114]. In recent years, several global databases of climatic data have emerged [115,116,117,118]. We used the R package geodata [119] to download WorldClim v2.1 (www.worldclim.org) (accessed on 5 October 2024). A total of 19 bioclimatic variables (Supplementary Material Table S2), representing different features of temperature and precipitation, were developed by spatially interpolating monthly data from meteorological stations using elevation as a covariate. The variables in habitat suitability models were carefully chosen due to their significance in influencing distributions of species [120]. WorldClim bioclimatic variables are key to defining species niches [121,122] and are widely applied in species distribution modeling [24,120,122,123]. The bioclimatic variables used in our study, for both the current period and future scenarios, were obtained at a spatial resolution of 2.5 arc minutes.
To ensure data consistency, bioclimatic variables were standardized and aligned to a common coordinate system and resolution. To minimize the risk of model overfitting, variables with minimal contribution (e.g., percentage contributions close to 0 or below 0.25) identified through Jackknife testing were excluded, following guidance from previous studies [124,125]. Given that several bioclimatic variables exhibited spatial correlation, further collinearity tests were conducted to avoid overfitting from highly correlated variables [125,126]. A Pearson Correlation Coefficient threshold of |r| ≥ 0.75 [127] (Supplementary Material Figure S1) was applied to identify and eliminate variables with strong correlations and enhance the model’s predictive performance. Ultimately, eight bioclimatic variables (Figure 2) that exhibited low correlation (|r| < 0.75) were retained for habitat suitability modeling [127]. The selected variables used for modeling are presented in Figure 2.

2.5. Construction of Maximum Entropy (MaxEnt) Model

This study used MaxEnt (v. 3.4.3) [128,129] to identify the suitable habitat available for A. dorsata in the study area. It is an efficient model [62,63,64,65] to assess the potential habitat and distribution of a species in an area [64,85,126,130]. Furthermore, it is particularly suitable when occurrence data consist only of presence points [111,126,131,132,133,134,135], as accurately obtaining absence data remains challenging [64,126,136,137]. It is also effective for small sample sizes [134]. This module utilizes the R packages ENMeval and dismo [119,138] to build and evaluate MaxEnt niche models across various feature class settings and regularization multipliers [139].

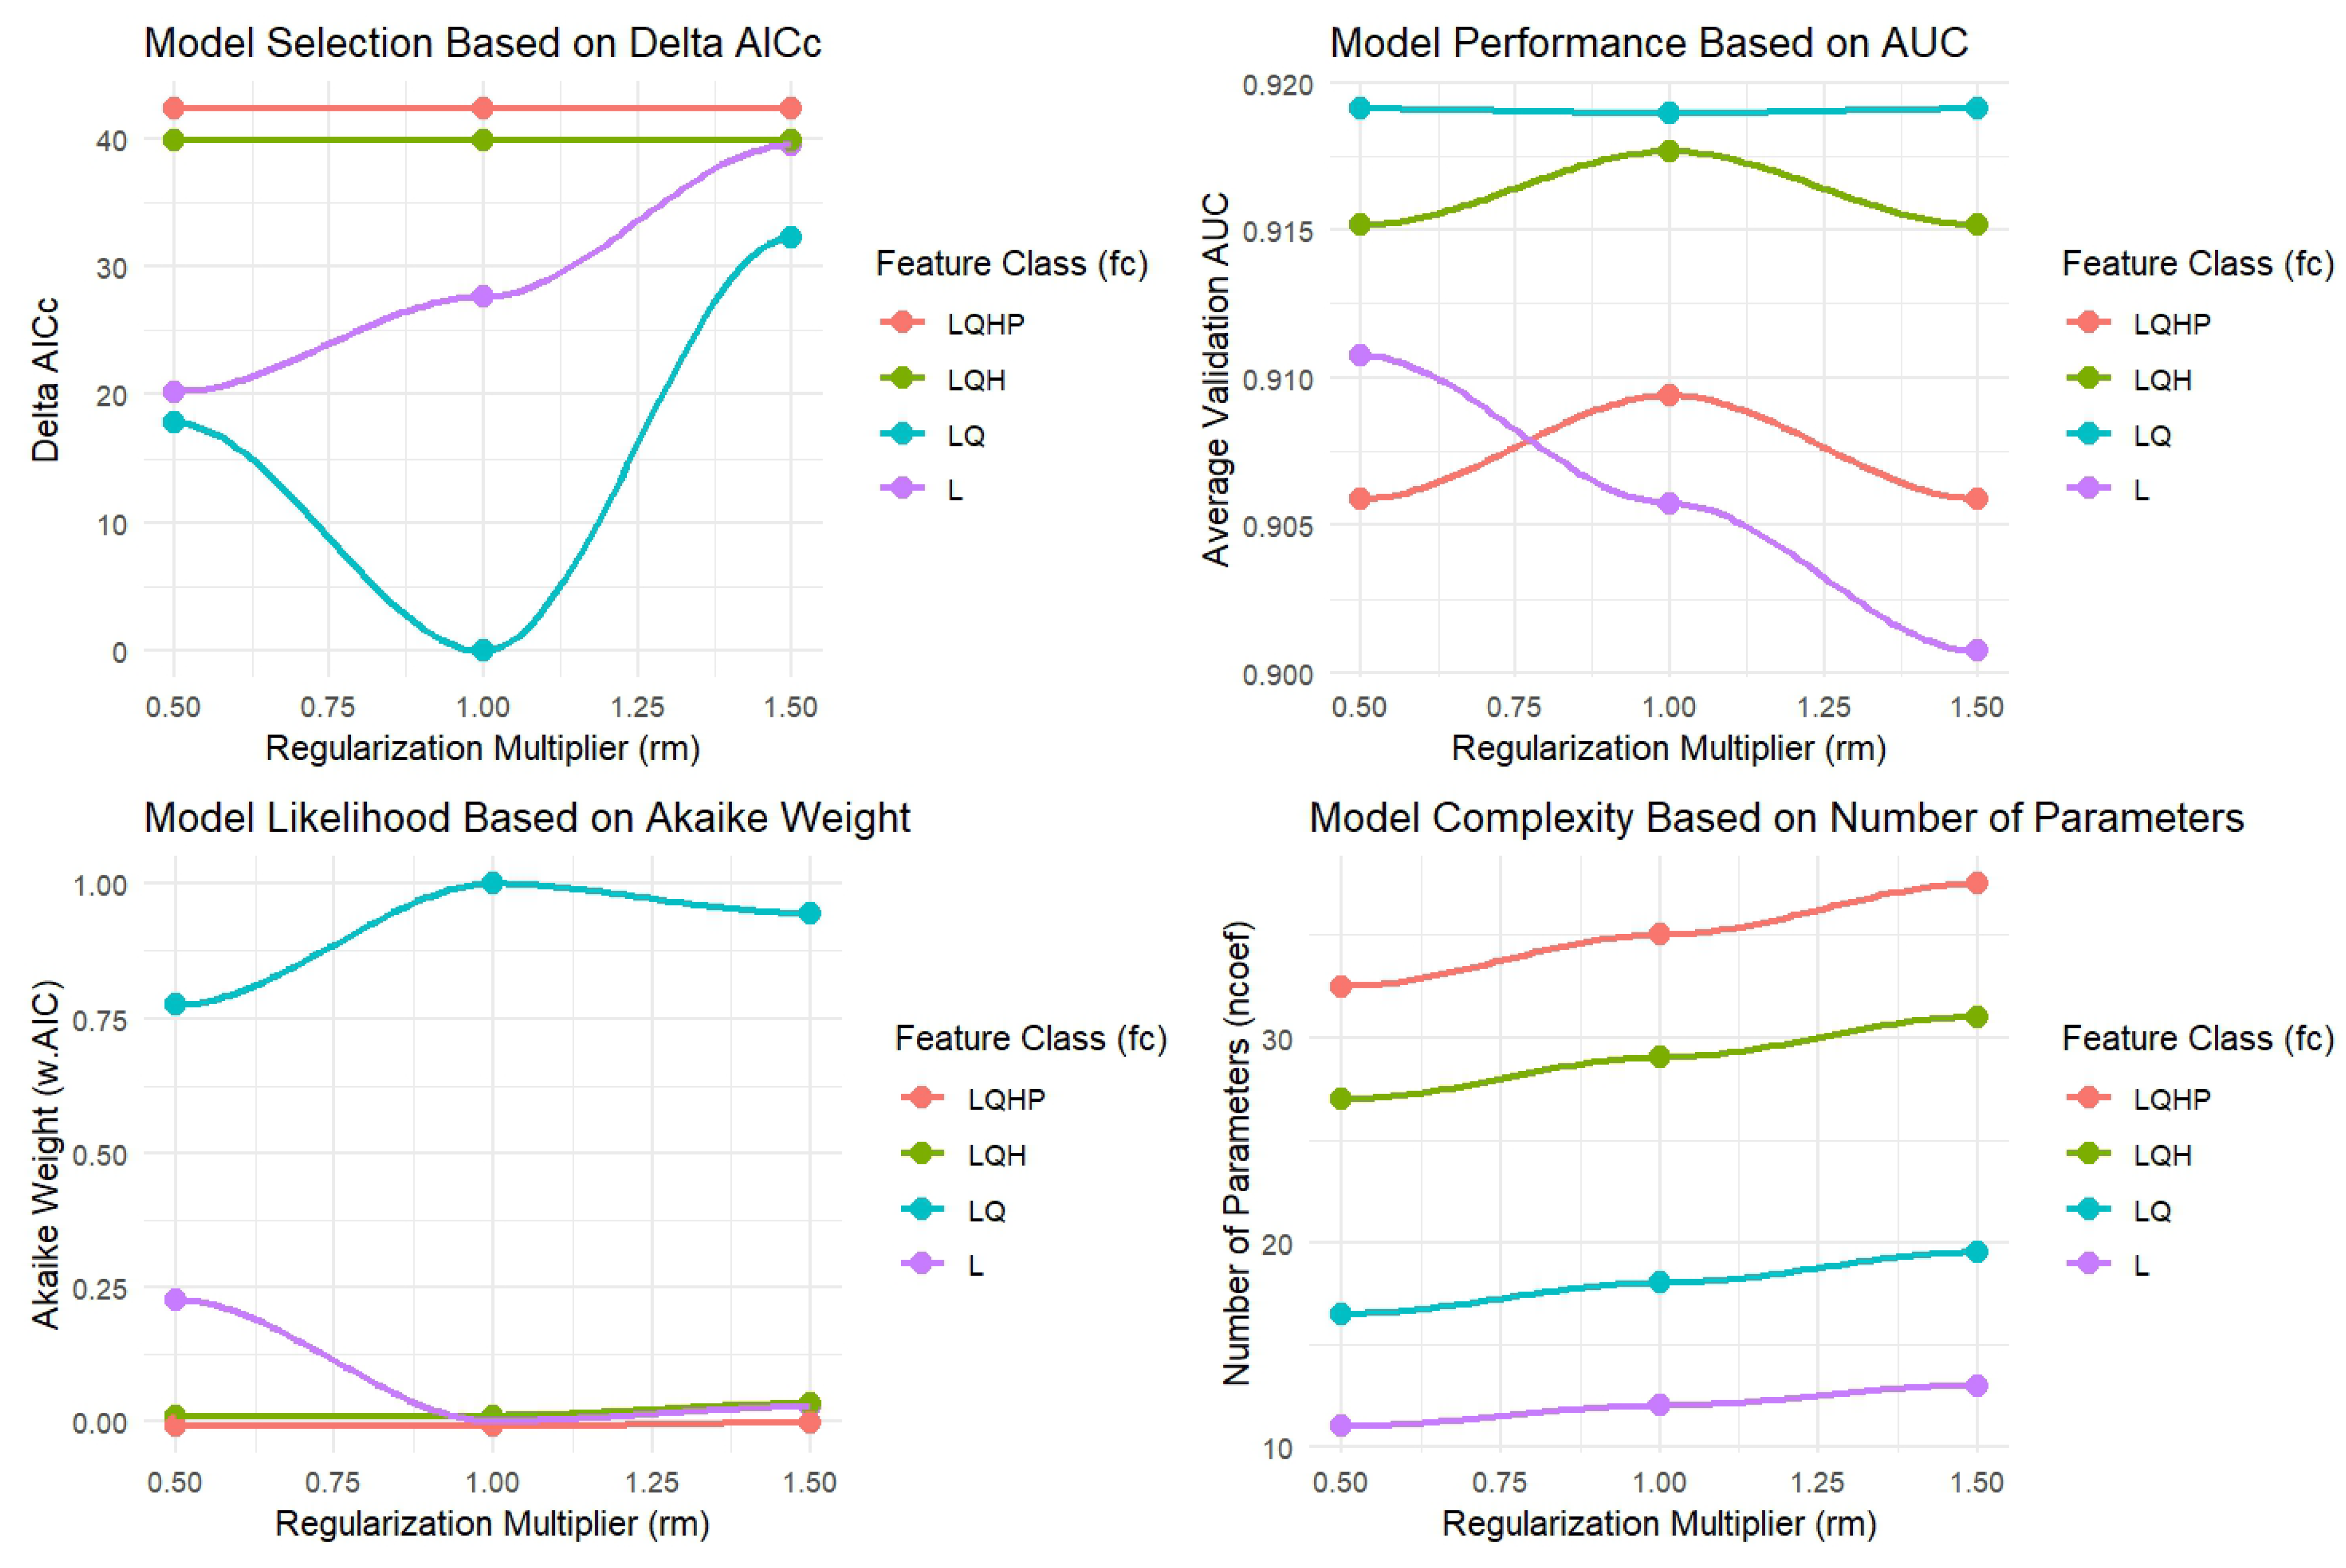
2.6. Model Evaluation and Selection Process

There are several metrics to assess the performance of niche/distributional models. We conducted a systematic tuning process with modifications in feature classes and regularization multipliers to find an optimized configuration of the model that projects A. dorsata habitat suitability using MaxEnt. We ran four feature classes, which are Linear (L), Linear and Quadratic (LQ), Linear, Quadratic, and Hinge (LQH), and Linear, Quadratic, Hinge, and Product (LQHP) for three values for RM: 0.5, 1, and 1.5. Model performance was assessed based on Delta AICc, Akaike weights, Average Validation AUC, and model complexity (measured by the number of parameters). Additionally, following the recommendations of [140], we evaluated test-training AUC differences and omission rates to ensure robust model performance and avoid overfitting. The Jackknife test [64,141,142] was used to determine the percent contribution and relative importance of predictor variables for A. dorsata habitat suitability and distribution, with ENMeval 2.0 [138] facilitating the analysis.

2.7. Future Projection Data

We used data from two global climate models, CNRM-CM6-1 and EPI-ESM1-2-HR-1, to simulate future projections of habitat suitability for A. dorsata. The models correspond to two socioeconomic pathways, SSP245 and SSP585, representing moderate and extreme climate scenarios, respectively. These pathways represent distinct climatic futures shaped by varying greenhouse emissions and socioeconomic developments, making them valuable for assessing potential habitat changes in the study area. We used the functionality of model prediction grids from the R package dismo [143] and geodata for accessing climate data [119]. The CNRM-CM6-1 model, developed by France’s National Center for Meteorological Research, was chosen for its ability to simulate South Asian monsoons and regional climate patterns, both critical for A. dorsata habitats. The EPI-ESM1-2-HR-1 model, from the Institute of Atmospheric Physics in China, provides high-resolution climate simulations that aligns with Pakistan’s diverse topography and climate zones. These models’ regional accuracies make them ideal for studying future habitat projections in Pakistan. Future habitat projections were generated for two time periods: 2041–2060 (2050) and 2061–2080 (2070), using the SSP245 and SSP585 scenarios. These models allow comparisons between moderate and extreme climate futures. The high spatial and temporal resolution of the models ensured accurate predictions of habitat suitability across the study area.

2.8. Division of Potential Suitable Growing Areas for Apis dorsata

The Jenks natural breaks classification technique in GIS was used to reclassify the model simulation results (raster layer). The raster was reclassified using this method by minimizing differences within categories and classes, while increasing differences between them. Based on several studies, this study reclassified the potential species habitat into four classes, including highly suitable (≥0.71), moderately suitable (0.31–0.70), less suitable (0.11–0.30), and unsuitable habitats (≤0.10) [28,71,144].

3. Results

3.1. Model Performance and Selection

Among the tested configurations, LQ with RM:1 emerged as the best-performing model (Figure 3). This configuration had the lowest Delta AICc, indicating a strong model fit with minimal complexity. Additionally, it achieved the highest AUC score (0.91) and a training AUC of 0.94, showing minimal divergence between training and validation datasets, which confirms the model’s robustness. The 10th percentile omission rate was calculated as 0.07, which is well below the commonly accepted threshold of 0.1, further validating the reliability of the selected model. These results, in combination with the Akaike weight (nearly 1.0), indicate that LQ with RM:1 was the optimal model configuration among those tested (LQ, LQH, and LQHP). Notably, LQ with RM:1 also maintained a moderate number of parameters, balancing model performance with interpretability. Based on these results, we selected LQ with RM:1 for current and future projections to ensure robust and generalizable habitat suitability predictions for Apis dorsata.

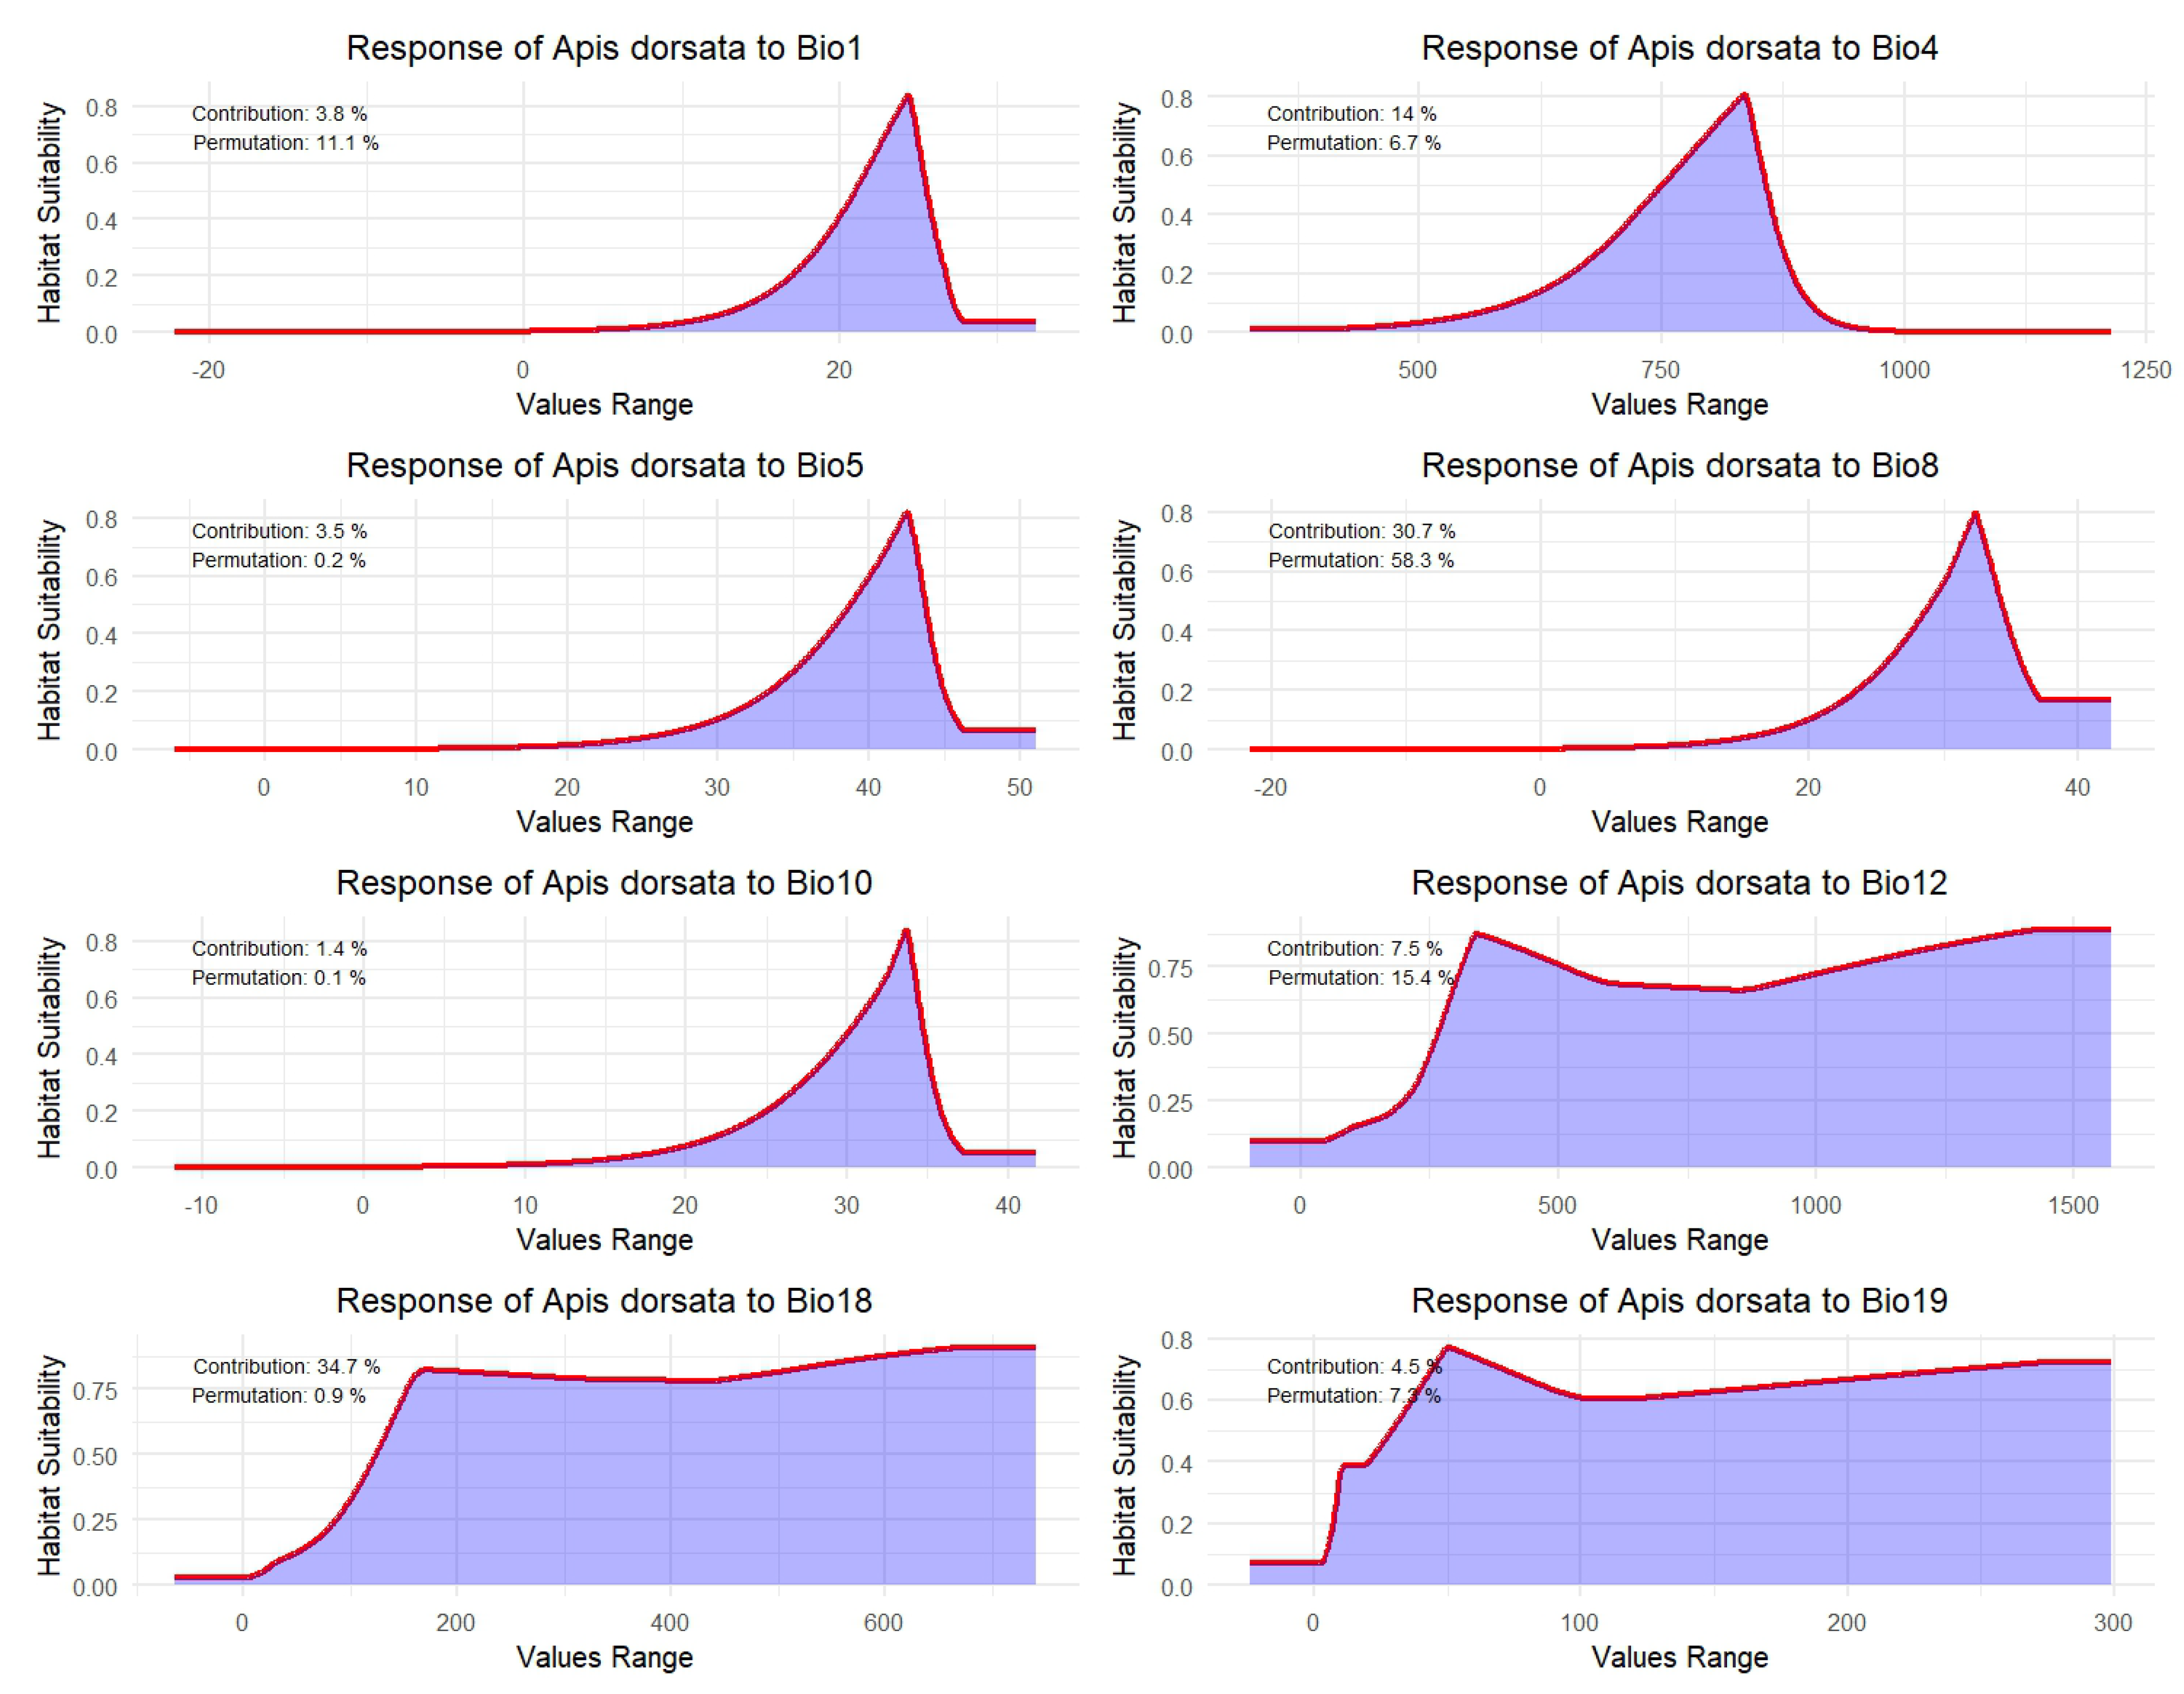
3.2. Response of A. dorsata Habitat Suitability to Key Bioclimatic Variables

The response curves revealed that habitat suitability for A. dorsata generally increases with moderate temperature and precipitation levels but declines at extreme values (Figure 4). For annual mean temperature and temperature seasonality, suitability rises with moderate conditions and drops at higher variability. Similarly, suitability peaks at moderate maximum temperatures and decreases with excessively high temperatures, indicating the species’ preference for moderate warmth. Precipitation patterns showed that A. dorsata favors habitats with moderate annual and seasonal rainfall, with suitability stabilizing or declining at very high levels. These trends highlight the species’ adaptation to balanced, moderate climatic conditions across key temperature and precipitation variables, helping to refine its habitat requirements.
The estimated contribution and permutation importance provide a rank of the environmental variables based on their relative influence on model performance while predicting the habitat suitability of A. dorsata. Among these variables, the precipitation of the wettest quarter (Bio8) and the coldest quarter (Bio18) showed the largest contribution and therefore prove to be highly influential in shaping suitable habitats. Both temperature seasonality and annual mean temperature were important in the case of temperature-related variables, indicating the sensitivity of A. dorsata to both stable and moderate temperature conditions. Other variables like maximum temperature have small values from permutation importance, indicating that though they contribute to the accuracy of the models, they might have lower predictive value in their own right and hence indicate a joint effect of many variables towards robust modeling for habitat suitability.

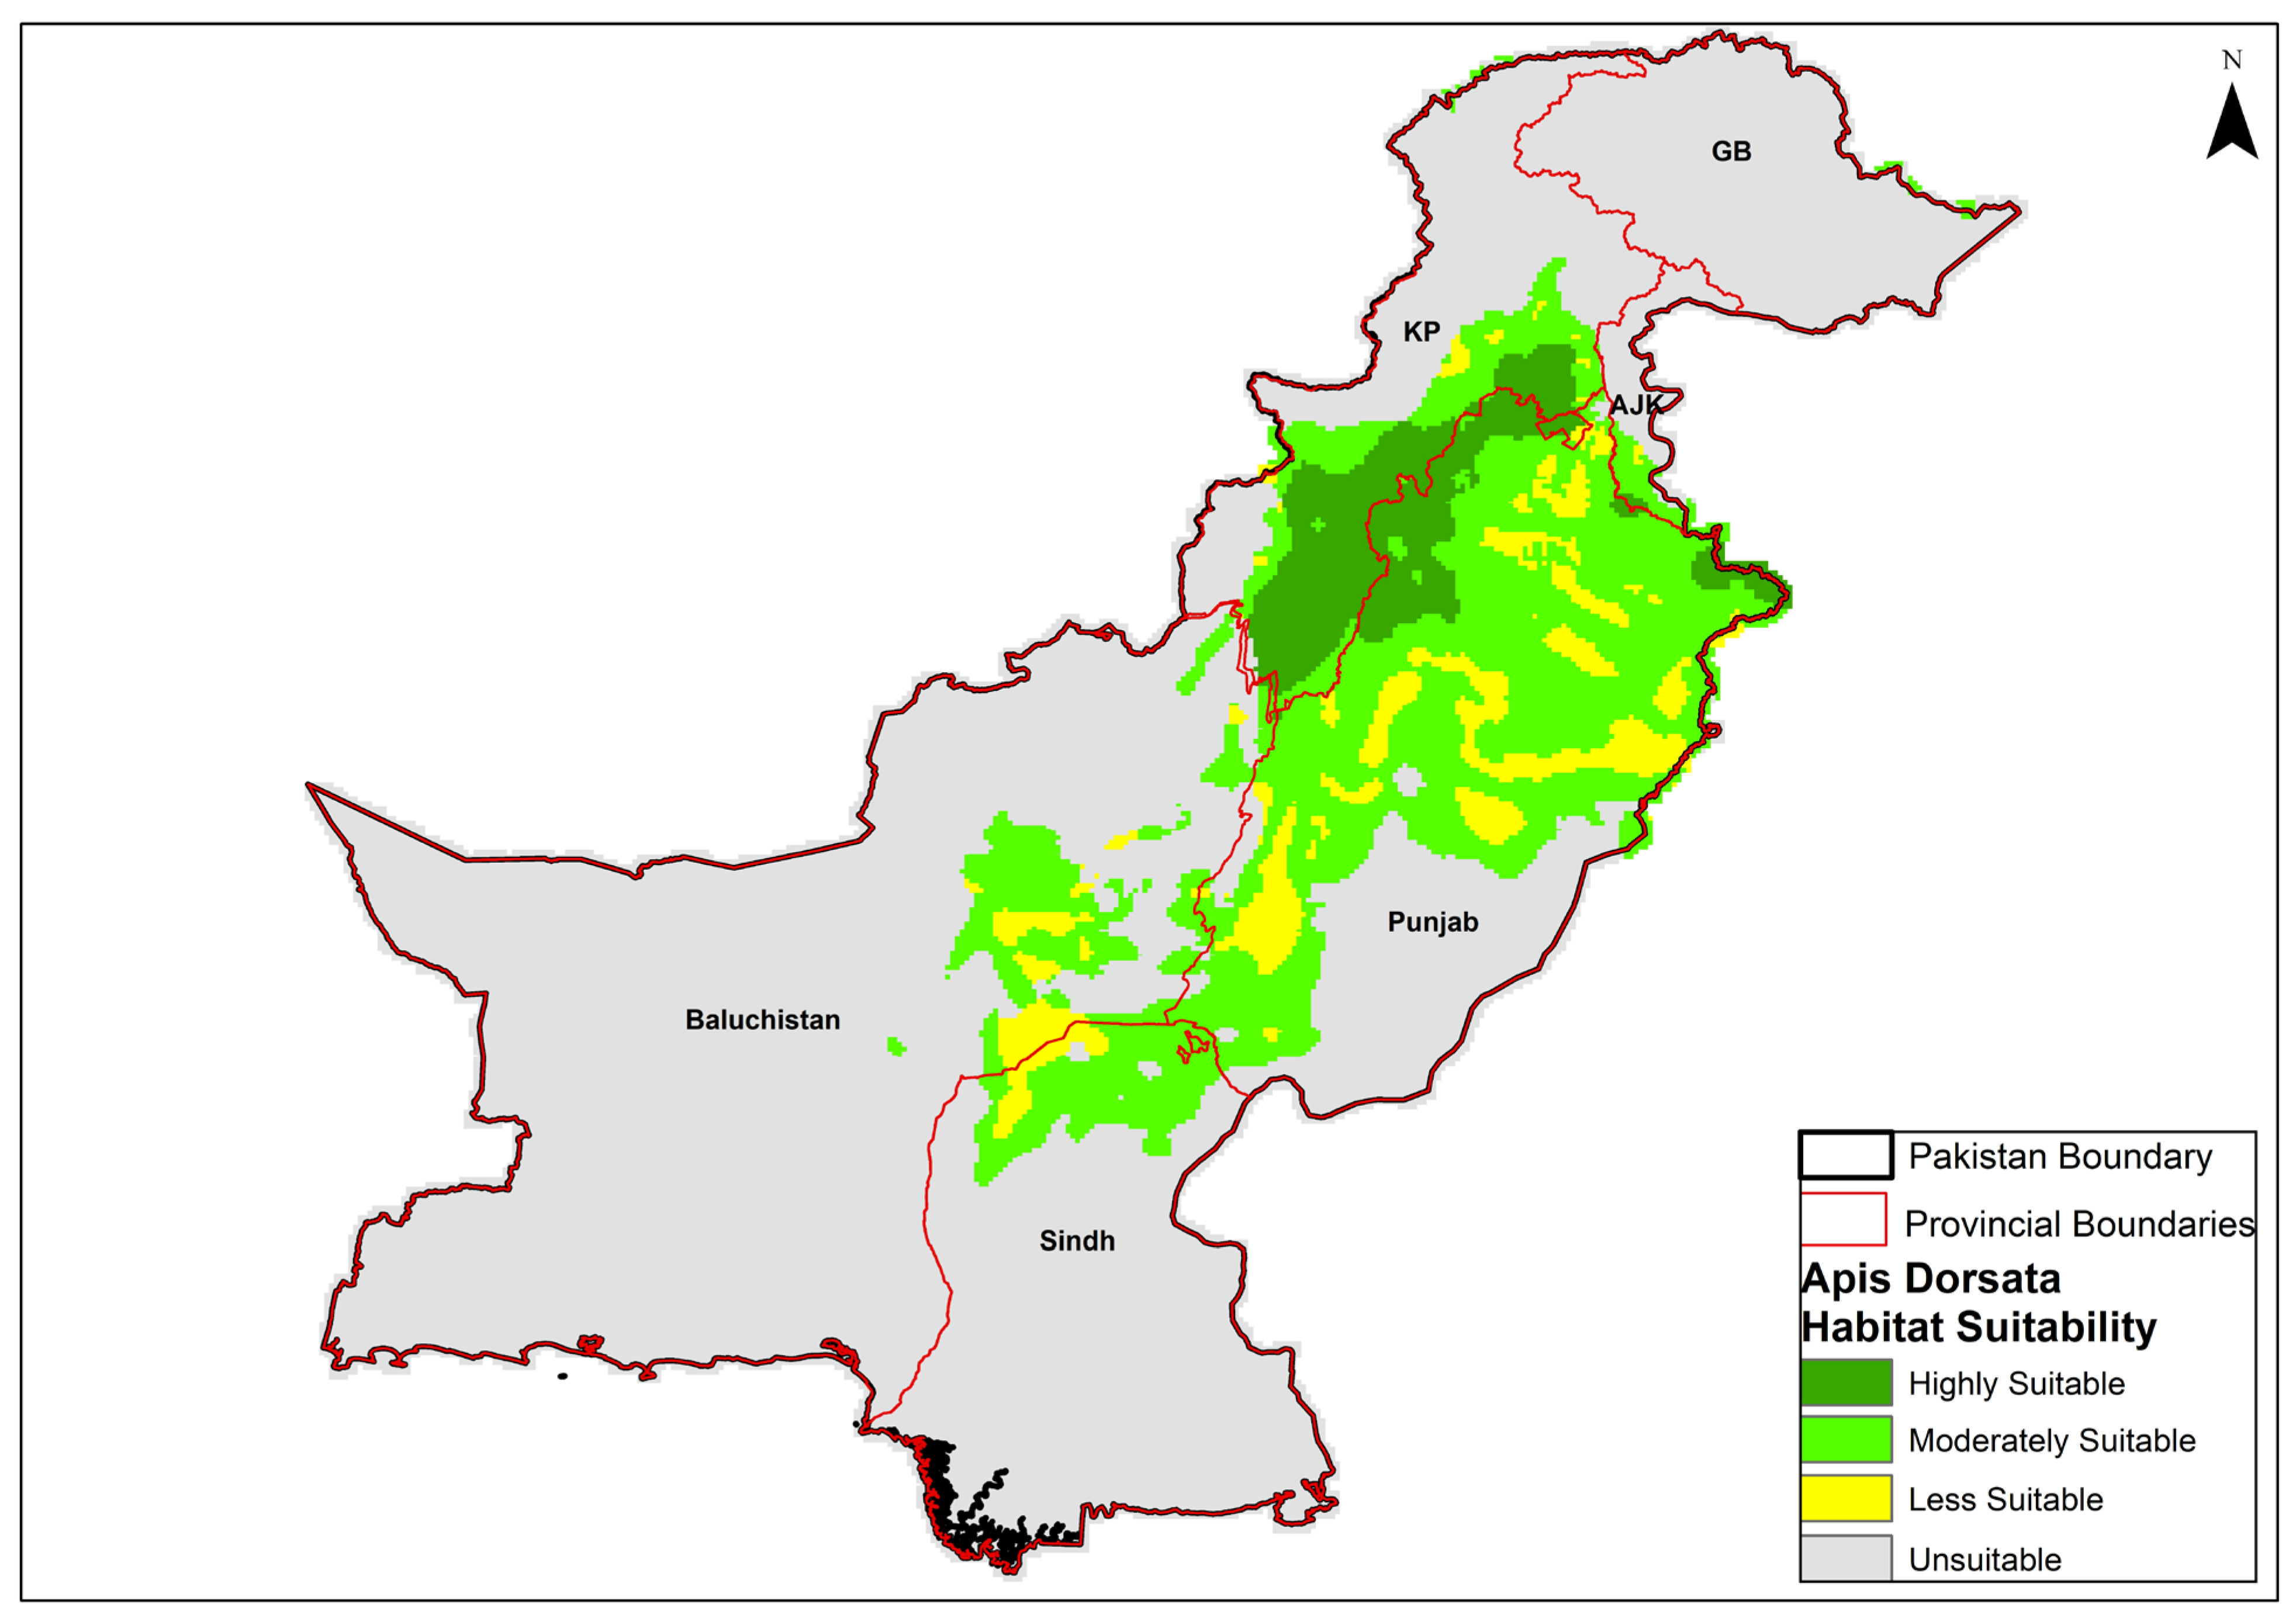
3.3. Species Habitat Under Current Environmental Conditions

Under current climatic conditions, the habitat suitability model for A. dorsata showed significant variations across different provinces of Pakistan. The habitat was categorized into four classes including unsuitable, less suitable, moderately suitable, and highly suitable. The model predicts that highly suitable habitats span approximately 49,792 km2 (Table 1), primarily located in the Punjab and Khyber Pakhtunkhwa (KP) provinces (Figure 5). These regions, known for their diverse climatic conditions and moderate altitudes, provide optimal conditions for the species. Notable areas of high suitability extend into central Punjab and the southern parts of KP, encompassing districts such as Mianwali, Bhakkar, Isa Khel, Kalabagh, Fateh Jang, and Attock in Punjab and Dera Ismail Khan, Lakki Marwat, Bannu, Karak, Kohat, Charsadda, Nowshera, and Swabi in KP. Moderately suitable habitats cover about 150,975 km2 and are distributed more broadly. The central and southern regions of Punjab and parts of Sindh and northern Baluchistan contribute significantly to this category. These areas feature intermediate environmental conditions that support A. dorsata to a lesser extent than highly suitable areas. Less suitable habitats, totaling 51,312 km2, are scattered primarily around the periphery of moderately suitable regions, including southern Punjab and parts of eastern Sindh. The largest portion of the landscape comprising 629,817 km2 is deemed unsuitable for the species. This category dominates Baluchistan and extends to the extreme northern areas, including Gilgit-Baltistan (GB) and the Azad Jammu and Kashmir (AJK) regions, where climatic and environmental conditions fall outside the preferred range for A. dorsata.

3.4. Quantification and Distribution of Future Suitable Habitat of Apis dorsata

Based on the future projections of A. dorsata habitat suitability under different climate models (CNRM-CM6-1 and EPI-ESM1-2-HR-1) and socioeconomic pathways (SSP245 and SSP585), the results showed a substantial loss and shift in suitable habitats across Pakistan by mid-century (2050) and late-century (2070). The distribution maps (Figure 6 and Figure 7) illustrate these changes, highlighting trends in habitat suitability under various greenhouse gas concentration pathways.

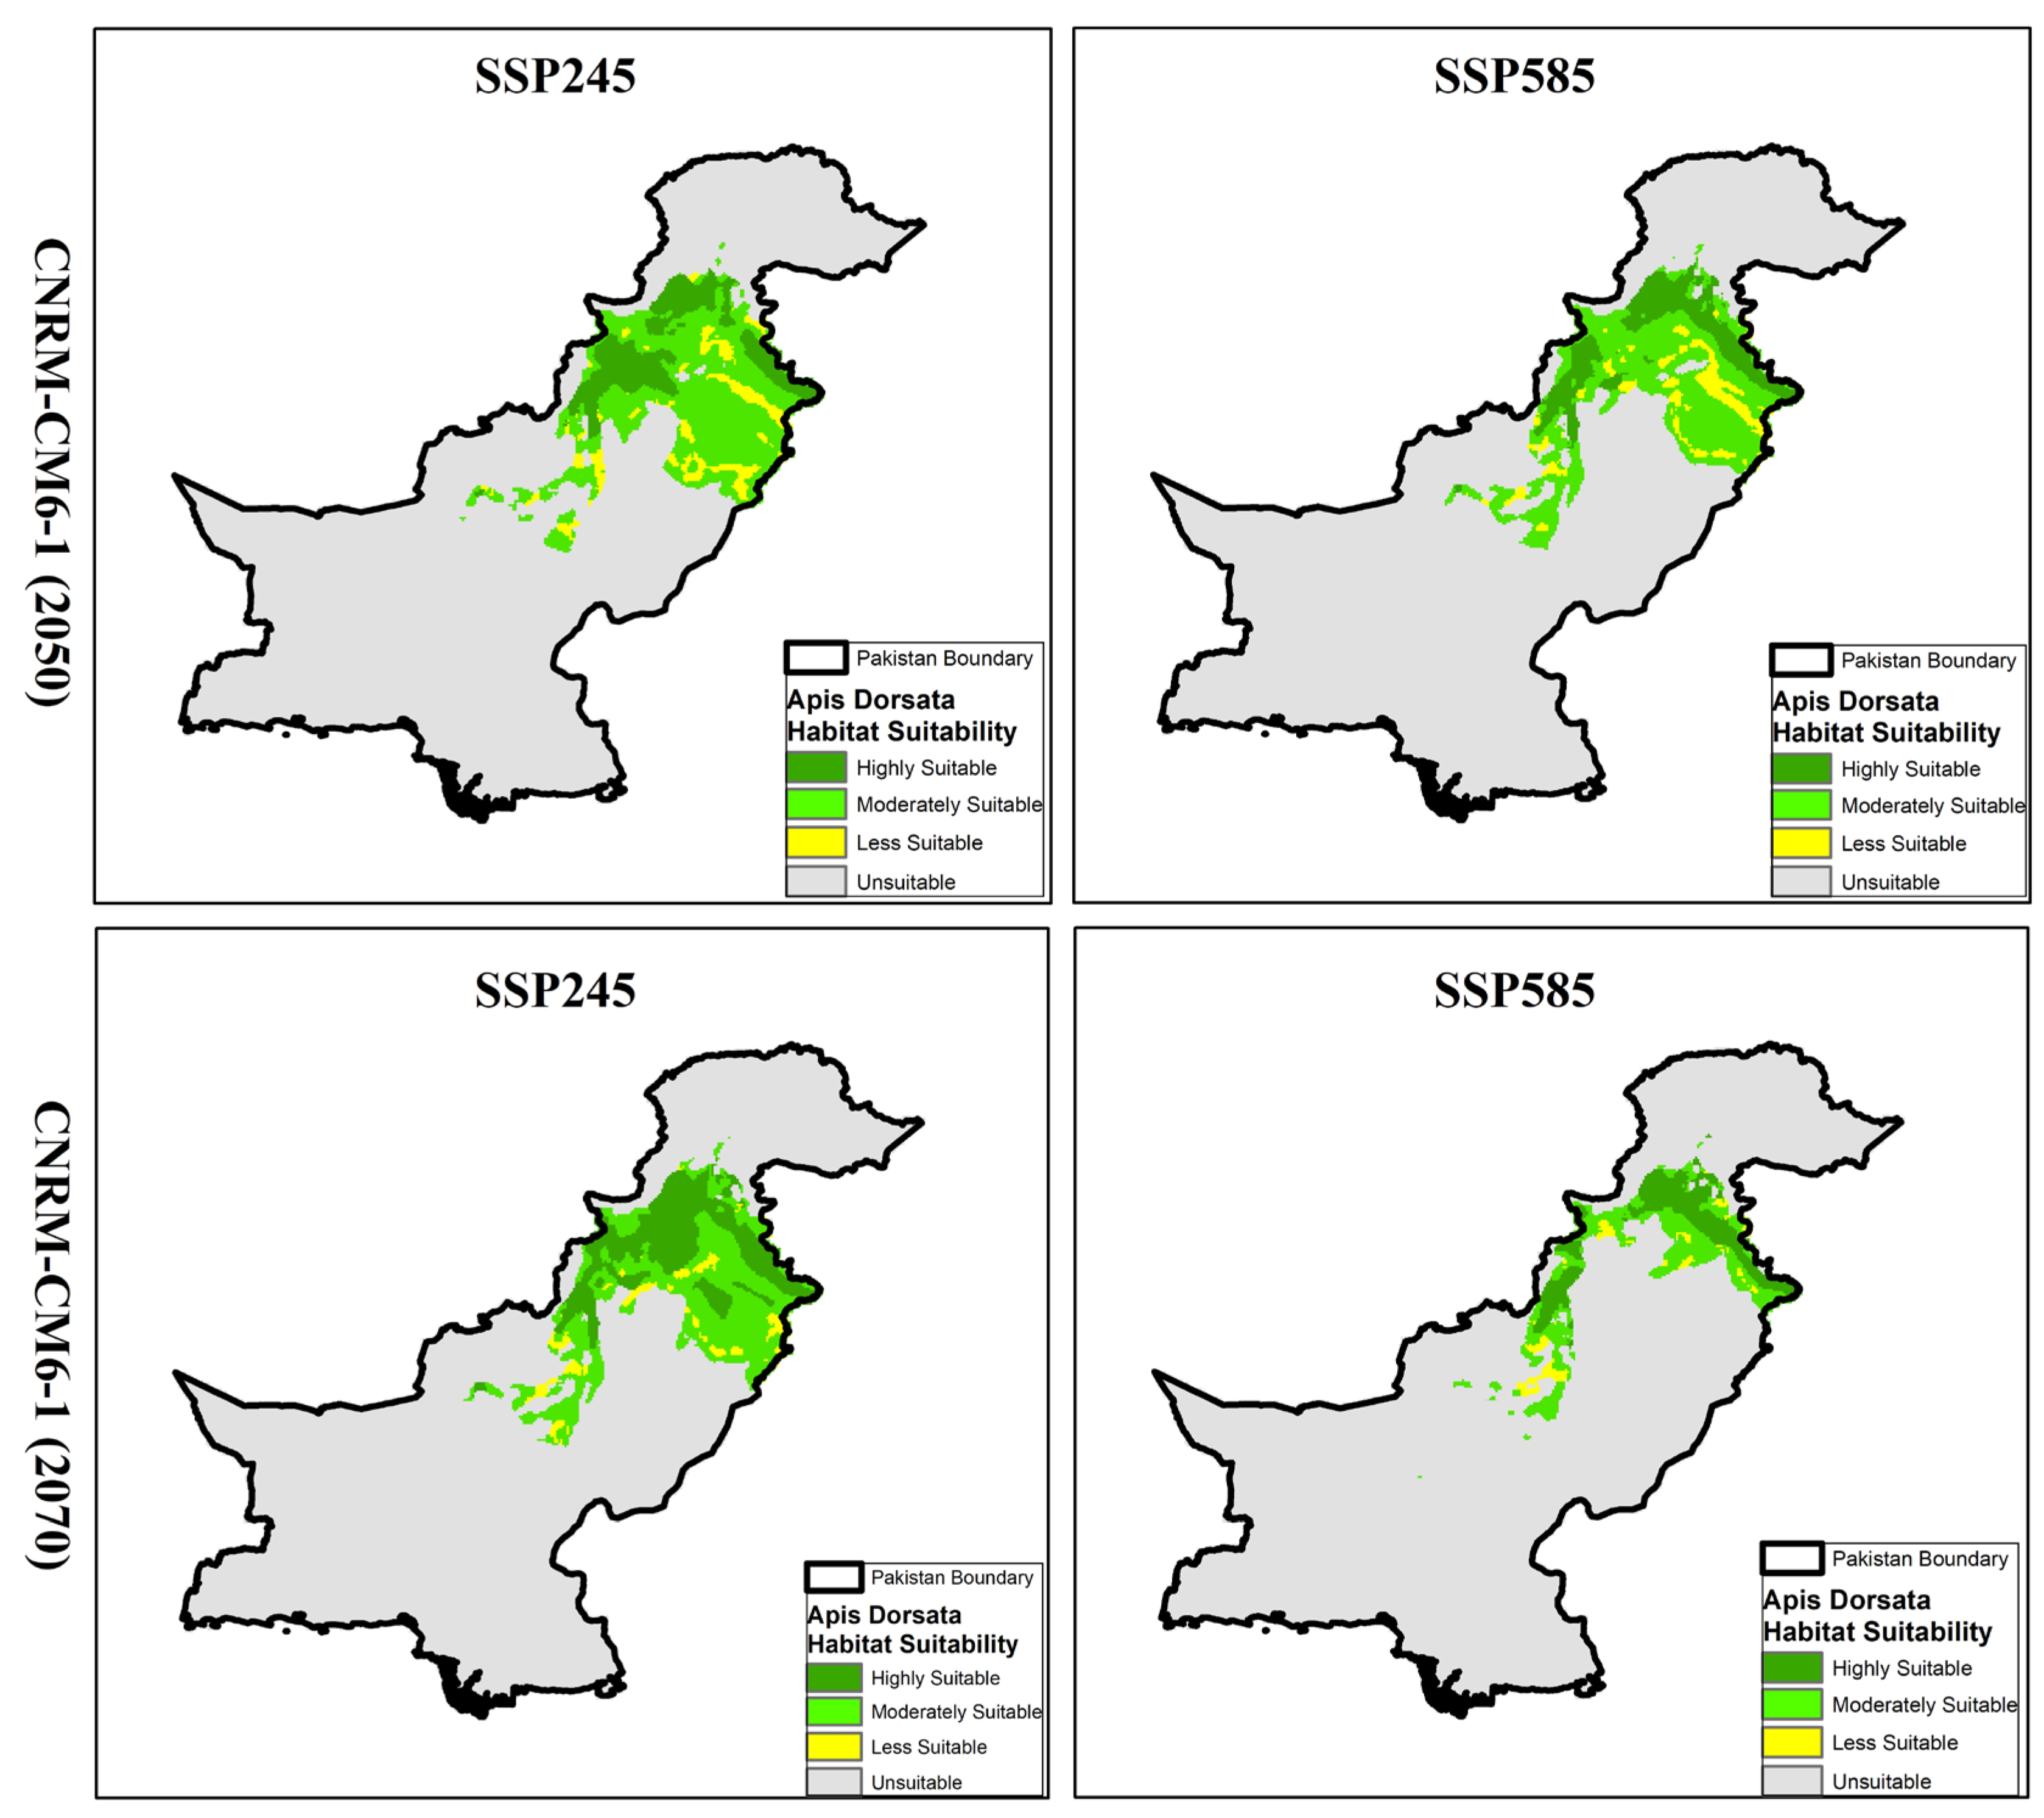
3.5. Habitat Projections and Distribution of A. dorsata Under CNRM-CM6-1 Model

Under future climate projections using the CNRM-CM6-1 model, significant changes in the distribution of A. dorsata habitats are anticipated by mid-century (2050) and late-century (2070) under both SSP245 and SSP585 scenarios. Compared to current conditions, where highly suitable habitats span approximately 49,792 km2, future projections showed a decline in these areas. For the mid-century under SSP245, highly suitable habitats decrease to 39,073 km2 and further decline to 36,011 km2 by late-century. Similarly, the SSP585 scenario forecasts an even steeper decline, with highly suitable habitats shrinking to 35,965 km2 by mid-century and 29,743 km2 by late-century. Moderately suitable areas, which currently cover about 150,975 km2, are also projected to decrease under future conditions. Mid-century estimates under SSP245 predict 103,135 km2 of moderately suitable habitats, reducing to 86,274 km2 by late-century. Under SSP585, these areas shrink from 93,156 km2 in the mid-century projection to 45,691 km2 in the late-century projection. These results suggest a pronounced shift and contraction of suitable habitats, indicating a potential movement of suitable habitat zones towards higher altitudes or more northern regions in response to changing climatic conditions. Expanding unsuitable and less suitable habitat categories also point to increasing challenges for A. dorsata habitat sustainability. For instance, unsuitable areas, currently covering 629,817 km2, are projected to grow significantly, reaching up to 792,177 km2 under SSP585 by late-century. This shift underscores the potential impacts of climate change on the habitat range, pushing A. dorsata towards regions that can sustain its ecological needs amidst changing conditions.

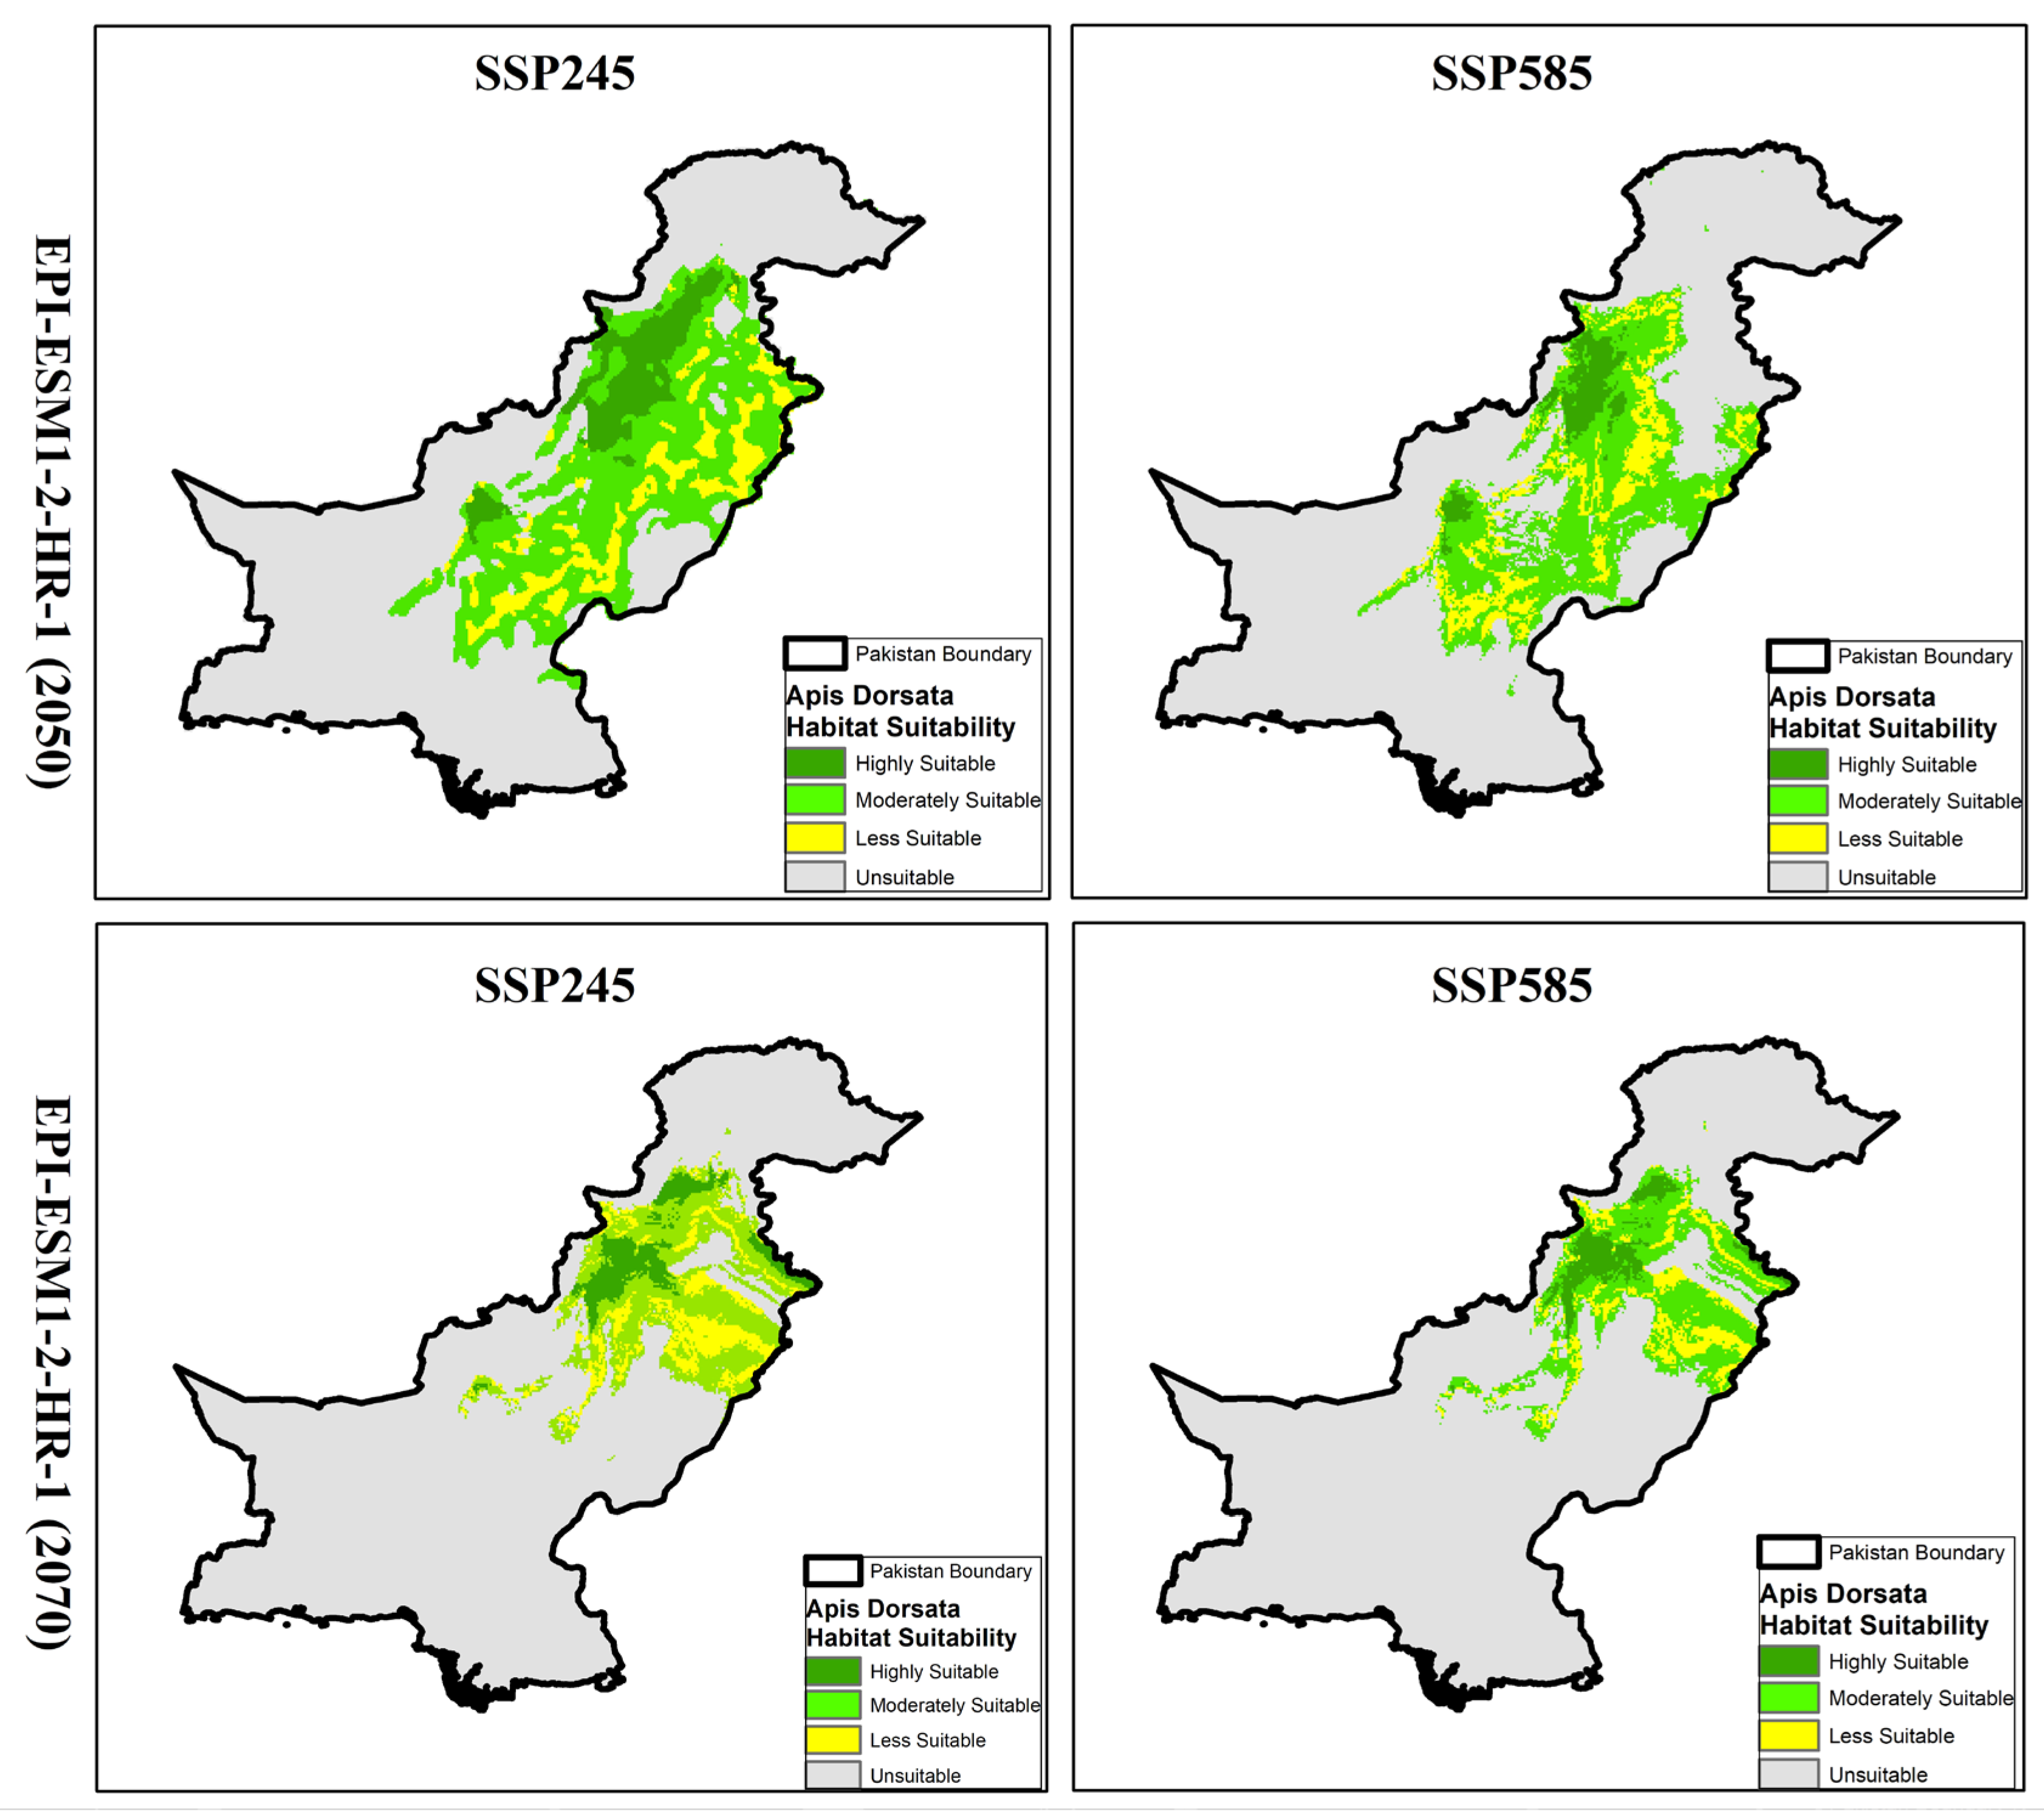
3.6. Habitat Projections and Distribution of A. dorsata Under EPI-ESM1-2-HR-1 Model

Based on future projections using the EPI-ESM1-2-HR-1 climate model, habitat suitability for A. dorsata demonstrated significant loss under different SSP scenarios for both mid-century (2050) and late-century (2070). In the SSP245 scenario for 2050, highly suitable habitats are predicted to cover approximately 27,865 km2, while moderately suitable areas span around 96,561 km2. Less suitable habitats account for 43,872 km2, and unsuitable areas dominate with 713,598 km2. This indicates a shift towards more habitats becoming unsuitable compared to current conditions. In the SSP585 scenario for the same period, the highly suitable habitat reduces further to 22,329 km2, with moderately suitable areas covering 86,756 km2. Less suitable regions decrease to 34,916 km2, and the extent of unsuitable habitats increases to 737,895 km2, showing a marked trend of habitat degradation under more intense greenhouse gas concentrations. Projections for 2070 under the SSP245 scenario reveal continued habitat reduction, with highly suitable areas decreasing to 24,547 km2 and moderately suitable areas remaining at 86,721 km2. Unsuitable habitats expand to 741,035 km2, further emphasizing the negative impact of climate change over time. The SSP585 scenario for 2070 showed the most severe impact, with highly suitable habitats reduced to just 10,646 km2 and moderately suitable areas shrinking to 54,756 km2. The extent of unsuitable habitats peak at 802,169 km2, signifying significant future habitat loss for A. dorsata under a high-emission scenario.

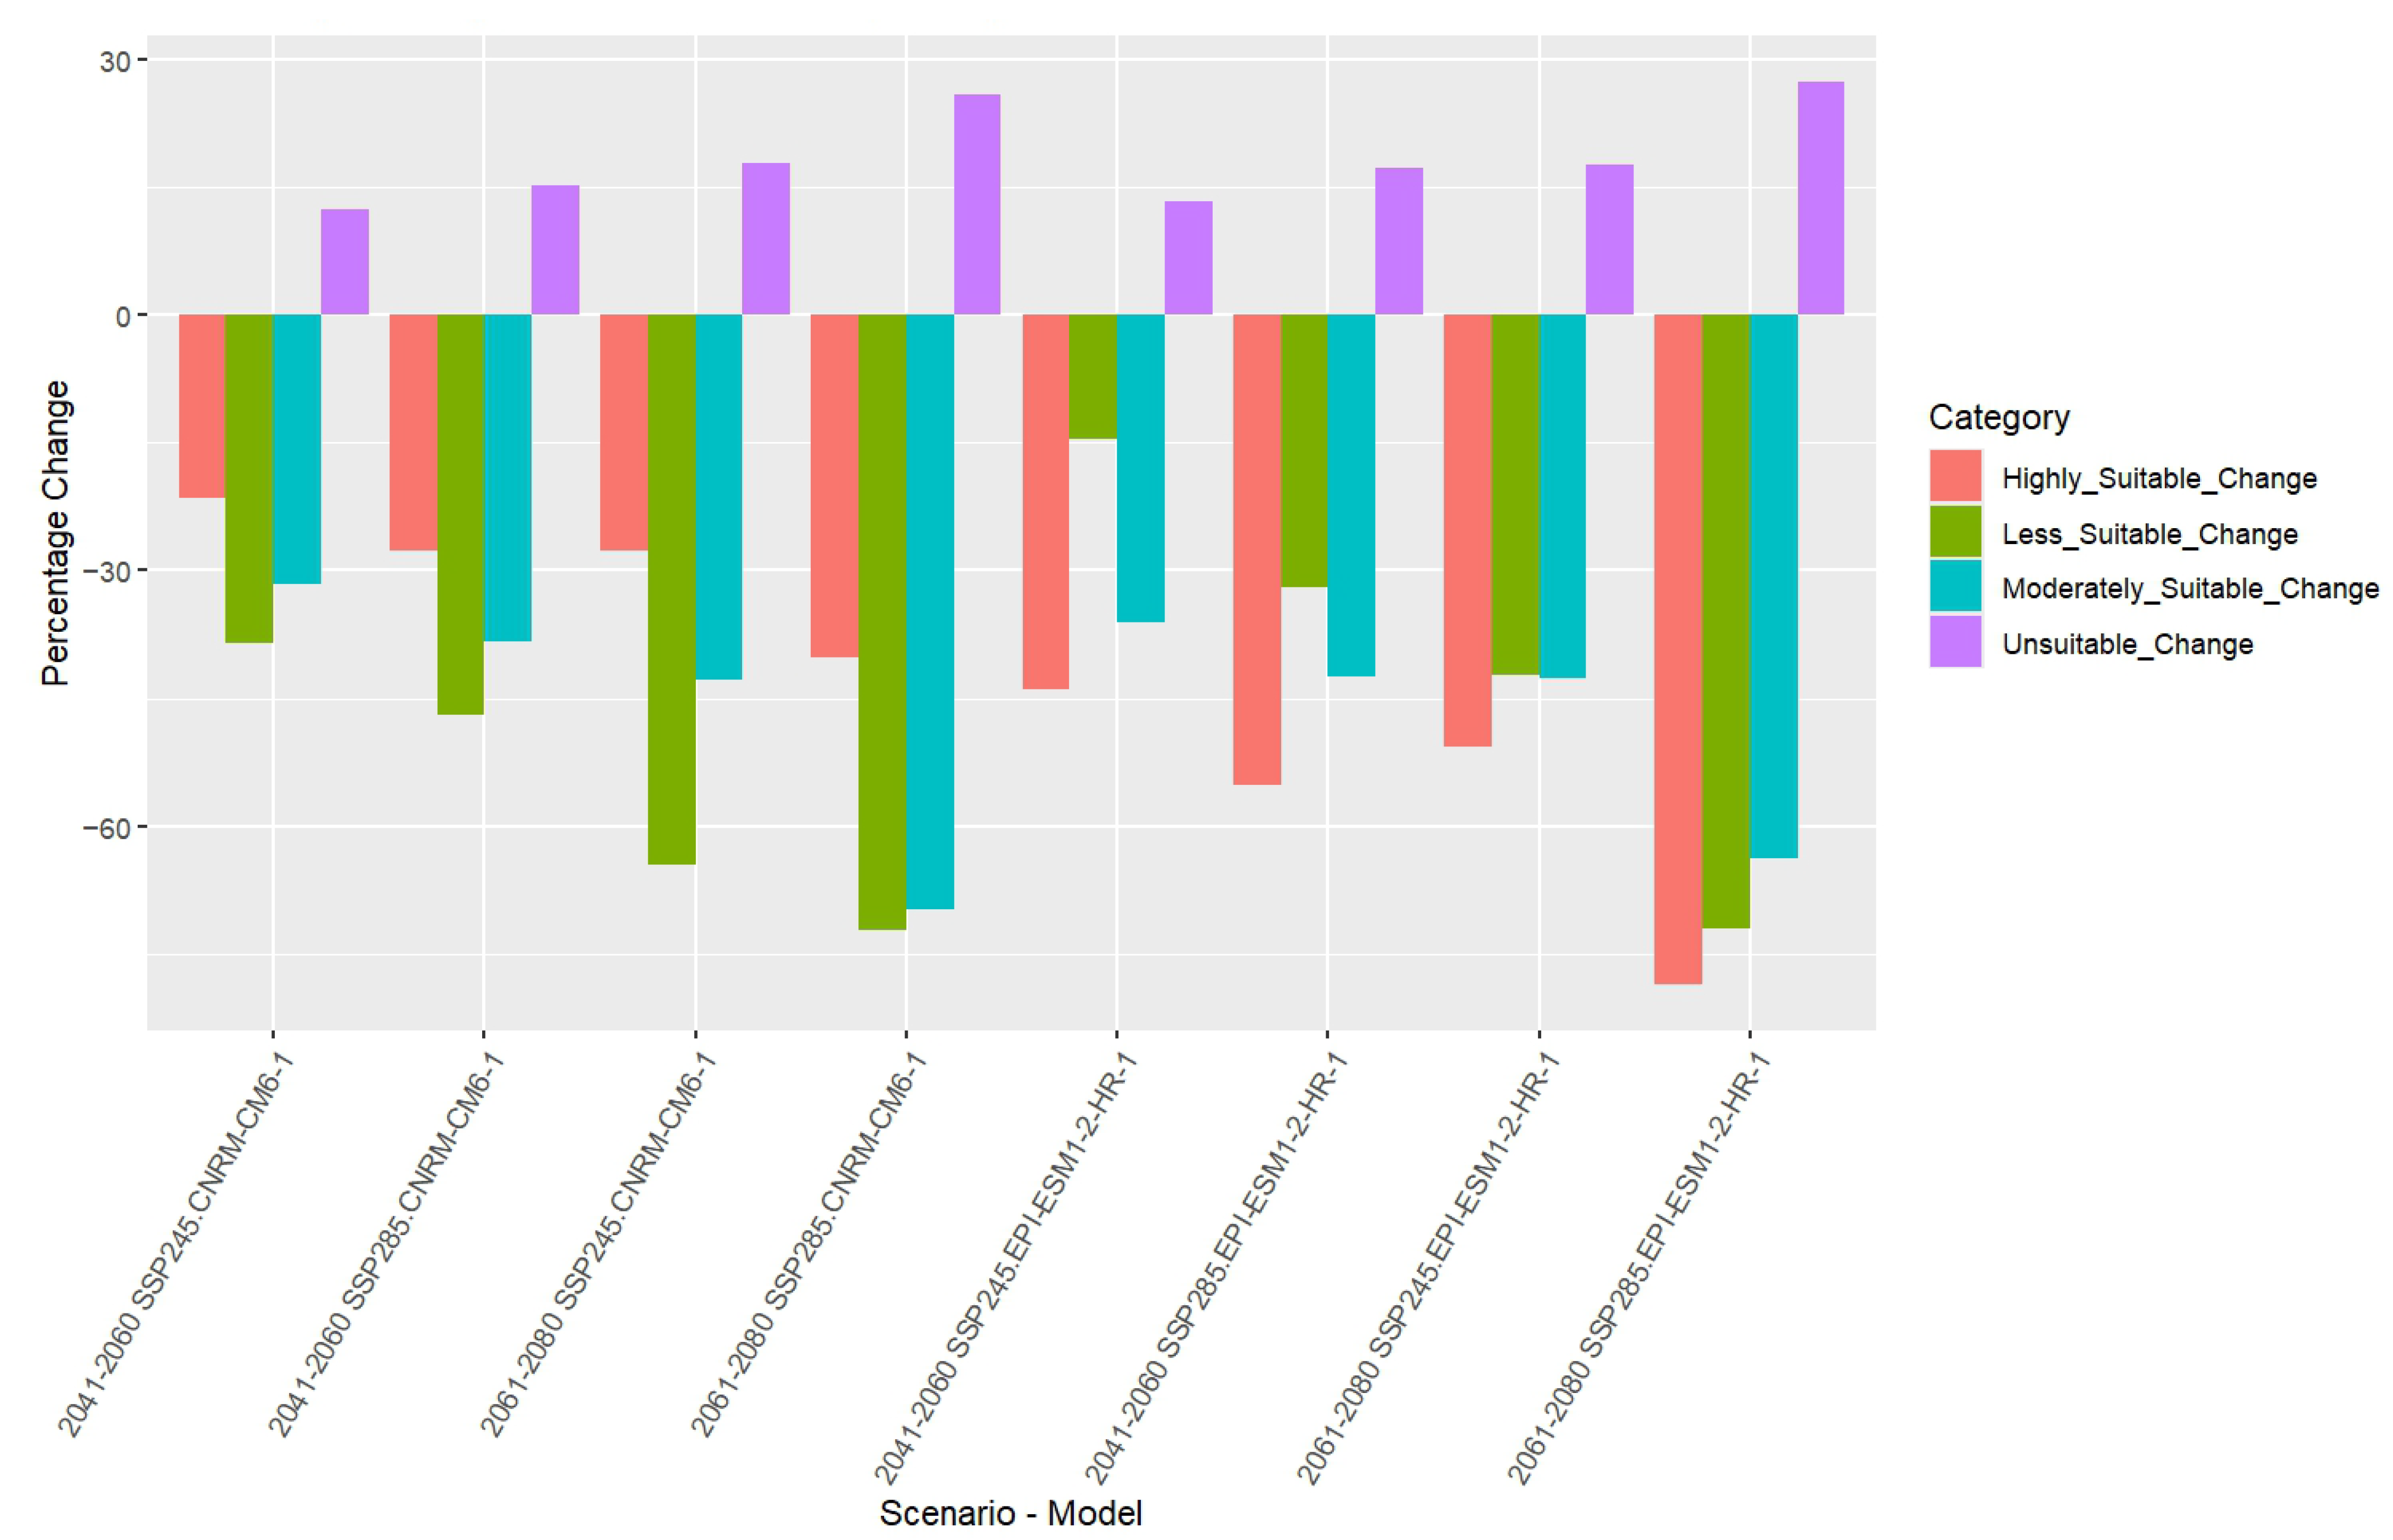
3.7. Percentage Change in Habitat Suitability Categories

Based on the percentage change in habitat suitability categories projected under different future scenarios, significant trends were observed (Table 2, Figure 8). For the CNRM-CM6-1 model during the 2050 period under SSP245, the unsuitable habitat showed a moderate increase of approximately 12.43%, while less suitable, moderately suitable, and highly suitable habitats exhibited notable declines of 38.48%, 31.69%, and 21.53%, respectively. Under SSP585 for the same period, the trend continued with a larger increase in unsuitable areas (15.20%) and more pronounced decreases in less suitable (47.00%), moderately suitable (38.30%), and highly suitable habitats (27.77%). By 2061–2080 under SSP245, the increase in the unsuitable habitat further intensified to 17.72%, accompanied by severe reductions in less suitable (64.60%), moderately suitable (42.86%), and highly suitable areas (27.68%). SSP585 projected an even greater shift, with the unsuitable habitat increasing by 25.78% and dramatic losses across the less suitable (72.16%), moderately suitable (69.74%), and highly suitable categories (40.27%).
For the EPI-ESM1-2-HR-1 model, the period 2050 under SSP245 showed an increase in the unsuitable habitat by 13.30%, while reductions were seen in less suitable (14.50%), moderately suitable (36.04%), and highly suitable habitats (44.04%). Under SSP585, the unsuitable habitat increased by 17.16%, and other categories saw more pronounced declines: less suitable (31.95%), moderately suitable (42.54%), and highly suitable (55.16%). During 2070, projections under SSP245 estimated a 17.66% rise in the unsuitable habitat, with declines in less suitable (42.33%), moderately suitable (42.56%), and highly suitable areas (50.70%). The SSP585 scenario projected the most drastic changes, with the unsuitable habitat increasing by 27.37% and significant reductions in less suitable (72.08%), moderately suitable (63.73%), and highly suitable areas (78.62%).

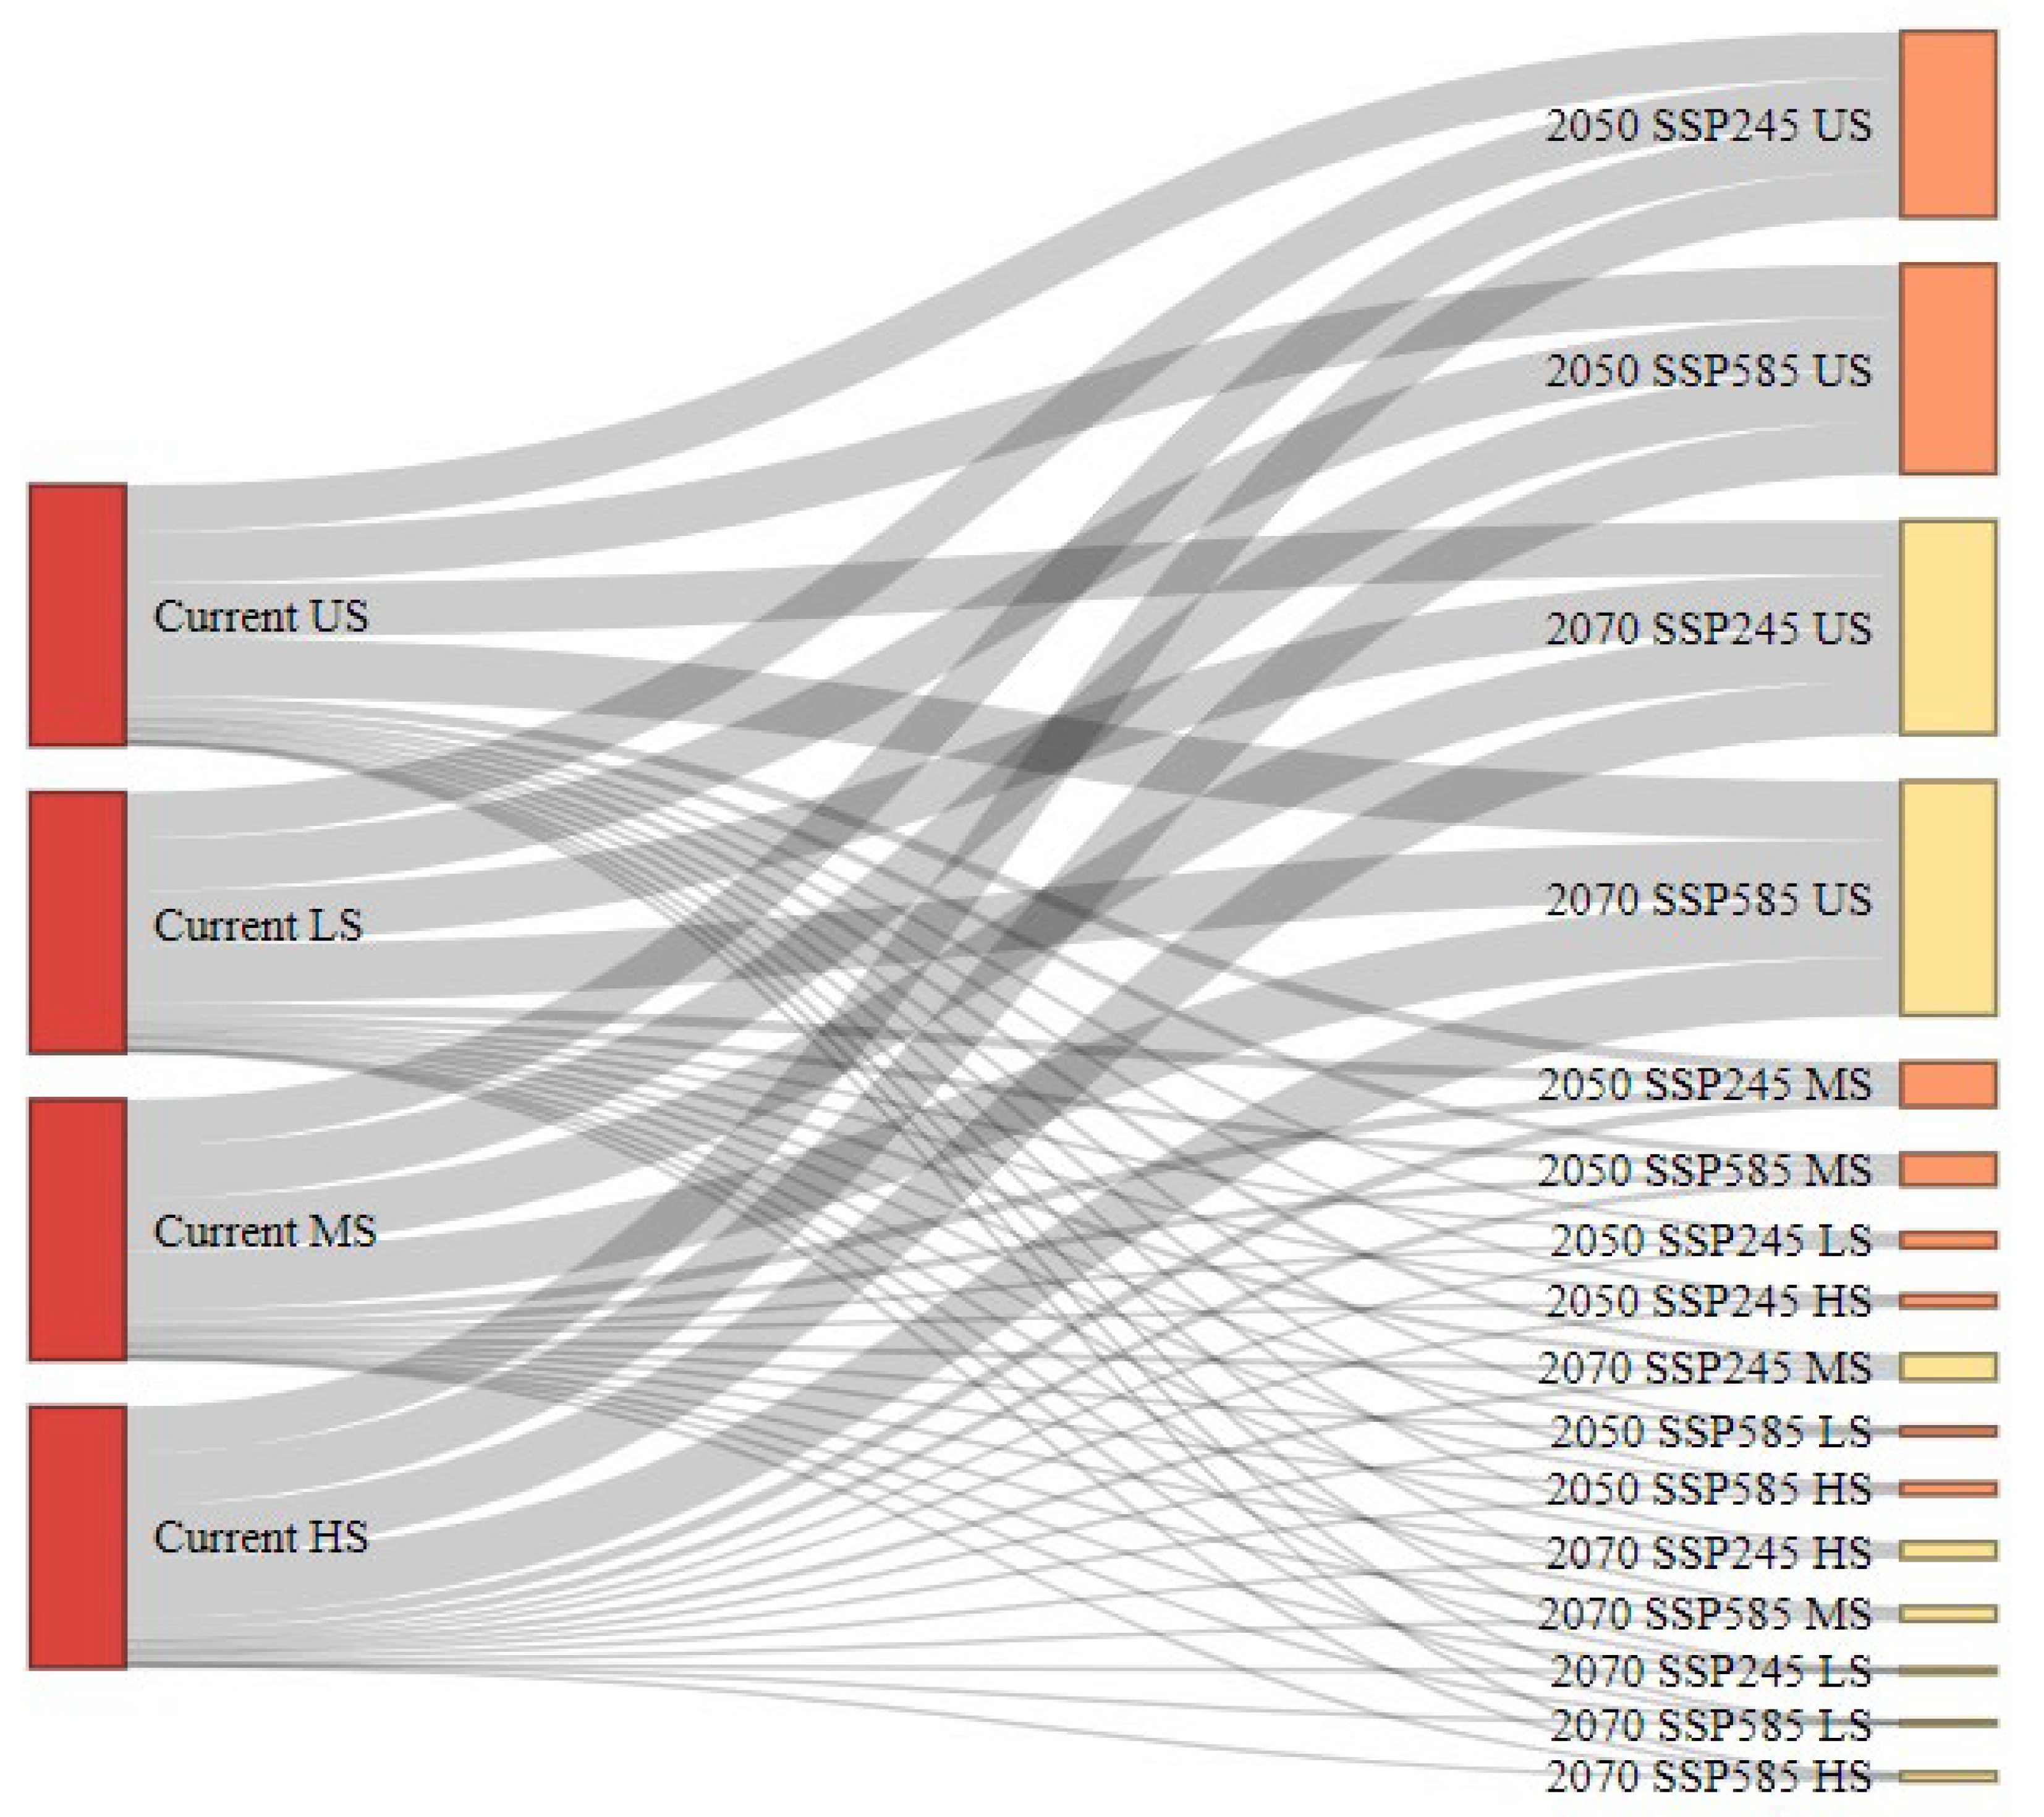
3.8. Habitat Transition Pathways

The Sankey diagram comprehensively visualizes habitat suitability transitions for A. dorsata from the current distribution to future climate projections under SSP245 and SSP585 scenarios (Figure 9). The diagram captures the flow of habitat categories including unsuitable (US), less suitable (LS), moderately suitable (MS), and highly suitable (HS) across different periods, including mid-century (2050) and late-century (2070). Notably, a substantial shift towards increased “Unsuitable” habitats is evident, particularly pronounced under the SSP585 pathway for late-century. This trend suggests significant habitat loss due to the intensifying impacts of climate change. The flow lines demonstrate that current “Highly Suitable” and “Moderately Suitable” areas predominantly transition to lower suitability categories or become “Unsuitable” over time. This indicates a reduction in favorable habitat, reflecting habitat degradation across future scenarios. The pattern also showed variability between SSP245 and SSP585, with SSP585 displaying more severe transitions, underscoring the increased risk associated with higher emission pathways. Overall, this visualization highlights the vulnerability of A. dorsata habitats in Pakistan under projected climate change, emphasizing the potential impact on the species’ future distribution.

4. Discussion

We used MaxEnt modeling to assess the current and future habitat suitability and distributions of A. dorsata across Pakistan. The MaxEnt approach is considered highly reliable and accepted for ecological niche modeling [64,126]. It is known for and is widely recognized for its robust predictive performance with complex interactions between species occurrences and environmental factors [145]. We found that MaxEnt performed exceptionally well in our study across all metrics, with an AUC of 0.91, which is comparable to other studies that used MaxEnt for similar ecological assessments [11,146]. In addition, performing MaxEnt in R improved the overall model-building process with features including seamless data handling, reproducibility, and customization [147]. Environmental data are processed, models are trained, and they are evaluated with R packages like dismo and raster, making the workflow efficient and scalable for our research objectives and conservation needs [147]. These advantages underscore the utility of MaxEnt for ecological modeling and demonstrate the further convenience of running habitat suitability models in R, simplifying analyses and increasing clarity of research outputs [138]. Based on the good AUC values and model fit of this study, MaxEnt should be considered as a primary tool for species distribution modeling and conservation planning [148].
Our MaxEnt model generated response curves for the selected eight variables, allowing us to understand how climatic variables influence the suitability distribution of A. dorsata. Results showed habitat suitability for A. dorsata to increase under moderate temperature and precipitation values but to decrease when variables are extreme. Like other bee species, A. dorsata is highly sensitive to temperature and moisture fluctuations, which impact its habitat, foraging, reproduction, and ultimate survival [149,150]. Annual mean temperature (Bio1) and temperature seasonality (Bio4) also showed an influence on the species’ suitable habitat. Optimal foraging and hive health are essential to A. dorsata sustainability, and these are best achieved under moderate temperature conditions [151]. Extreme temperatures can compromise brood development and honey production in A. dorsata colonies [152]. Numerous studies highlight temperature as a key factor in bees’ distribution and habitat, with species typically adapted to temperature ranges that support optimal physiological performance and energy efficiency [153].
Precipitation, particularly during the wettest (Bio8) and coldest quarters (Bio18), emerged as a crucial factor influencing the habitat suitability of A. dorsata. The fact reflects the species’ dependence on water availability to sustain nectar- and pollen-producing flora essential for foraging, highlighting the interplay between hydrological cycles and floral resource availability. Floral availability and diversity, critical for sustaining bee populations, are closely tied to moderate rainfall levels [154]. Excessive or insufficient rainfall reduces nectar and pollen availability or limits access, making habitats suitable for the bee species [153,155]. The response curves indicate that A. dorsata favors stable rainfall patterns, adopting best to environments with consistent water availability. This finding aligns with the previous studies on pollinators, which highlight the importance of balanced precipitation in sustaining plant communities that provide nectar and pollen [156]. A. dorsata exhibits a nuanced adaptation to temperature and precipitation, balancing resource competition with avoidance of climatic extremes that could endanger habitat, colony health, and productivity [157,158]. Vegetation, flowering patterns, and abundance of pollinator communities like bees are intricately tied to specific temperatures and precipitation levels. High temperatures accelerate evapotranspiration, often leading to dry soil conditions that stress vegetation and reduce nectar and pollen availability in flowering plants [156]. Thermal stress can also disrupt flowering cycles, creating a mismatch between peak flowering and periods when bees rely most on floral resources [159,160].
The projected habitat loss and shift of A. dorsata in Pakistan could be attributed to the country’s significant environmental challenges they are facing due to climate change and socioeconomic pressures. Key drivers include projected temperature increase and changes in precipitation patterns and intensities, both of which affect the floral resources and composition and ecological stability that A. dorsata depends on [153,156]. As a species adapted to tropical climates with moderate temperature and rainfall, A. dorsata is particularly susceptible to the expected rise in temperature in Pakistan, which studies indicate may outpace the global average [161,162]. Under high-emission scenarios, habitat loss becomes even more pronounced due to intensified heat waves, droughts, and erratic rainfalls [163]. These extreme conditions could disrupt the flowering cycles and decrease the availability of essential foraging plants, ultimately threatening the survival and reproductive success of Apis dorsata. The species’ dependence on a variety of floral resources heightens its vulnerability to fluctuations in plant diversity and abundance, which are influenced by temperature and precipitation instability [154]. Rising temperatures can also directly impact A. dorsata by altering both behavior and physiology, resulting in constrained foraging activity and diminished colony productivity. Studies concluded that bees reduce their foraging activity at temperatures exceeding their optimal range, which could intensify resource shortages during critical times [164,165,166]. In addition to climatic changes, shafting land use patterns in Pakistan present an additional threat to A. dorsata habitats. Rapid population growth and associated rise in urban development and expansion of agricultural lands are leading to fragmentation and reduction in natural habitats [167]. This shrunk the foraging landscape for the species and exposed it to anthropogenic pressures. Additionally, the rise in agricultural land caused a rise in the use of pesticides [153].
Under future climatic conditions, the A. dorsata habitats in Pakistan are likely to shift towards higher altitudes or more northern regions, a trend consistent with the global observation of species moving to cooler or more favorable environments as a response to global warming [1]. Shifts towards northern, higher-altitude regions, including Khyber Pakhtunkhwa and the Himalayan foothills, are expected to provide cooler, more stable habitats with fewer disturbances [168,169]. Such areas are predicted to maintain more stable floral resources, offering potential refuges to the species [153]. Additionally, these areas have reduced human disturbances compared to lower land area of the country. However, such habitat shifts are often faced with geographical and ecological constraints [170,171], especially in the case of areas like Pakistan, having a diverse landscape.
Pakistan is recognized as one of the top five countries most affected by climate change, experiencing frequent and severe climate anomalies, including intense floods, heat waves, and irregular heavy rainfall [172]. These extreme weather events have profound implications for both biodiversity and human livelihoods and are projected to escalate in frequency and severity if current climate trends persist [173]. Our study’s future projections for A. dorsata habitat suitability highlight a significant decline in areas deemed moderately and highly suitable for the species. This anticipated loss aligns with the broader impacts of climate change on ecosystems across Pakistan and poses a substantial risk to pollinators and the services they provide.
The plains area, especially in Punjab, is expected to experience significant warming, which could disrupt the A. dorsata habitat, forging activity, and floral resource availability. Additionally, temperature fluctuations and altered rainfall patterns adversely impact vegetation, reducing the abundance of flowering plants essential to A. dorsata [174]. This reflects findings in similar studies, where climatic variability has been shown to disrupt pollinator habitats, reduce floral resources, and alter species distributions [175,176]. In regions like Punjab and Sindh, where human population density and land use change are prominent, the compounded effects of habitat fragmentation and environmental stressors further exacerbate the loss of viable habitats for A. dorsata. The significant loss of suitable habitat for A. dorsata in Punjab’s lower plains could also be attributed to the excessive use of pesticides in extensive farming. As Pakistan’s agricultural hub, Punjab heavily relies on agrochemicals to maximize crop yield [177,178]. Pesticides harm bee populations both directly and indirectly [179,180].

Conservation and Management Strategies

To address the urgent challenges facing A. dorsata and their habitat in Pakistan, a comprehensive, multi-faceted conservation strategy is essential. Key recommendations include promoting sustainable agriculture practices like integrated pest management (IPM) and agroecology (e.g., crop rotation, intercropping) to curb pesticide use while fostering pollinator-friendly environments. Reforestation and afforestation efforts should prioritize native flowering plants, enhancing foraging and nesting sites while boosting habitat resilience, particularly in northern and central Pakistan. Planting bee-friendly flora in currently suitable areas could provide stable nectar and pollen sources, benefiting A. dorsata populations and, ultimately, contributing to climate mitigation by supporting ecosystems that store carbon.
To mitigate climate change impacts, policies focusing on reforestation and carbon sequestration can help stabilize local microclimates, while adaptive strategies like creating artificial nesting sites in affected areas support population stability during environmental shifts. Community engagement is critical, with programs educating locals on the ecological and economic benefits of pollinators and offering sustainable beekeeping as a livelihood. Strengthening regulations to control agrochemical overuse, deforestation, and habitat conversion will reduce habitat degradation and incentivize pollinator-friendly practices among farmers. Finally, establishing long-term monitoring and research programs will support adaptive management, with collaborative research guiding targeted conservation actions. Implementing these strategies can help preserve A. dorsata and pollination services, essential for Pakistan’s ecological and agricultural sustainability.

5. Conclusions

This study was carried out to identify, categorize, and quantify A. dorsata habitat suitability and distribution under current and future climatic conditions in Pakistan, one of the most vulnerable countries to climate change. Our results concluded that the species habitat suitability is highly related to stable and moderate ranges of both temperature and precipitation. A decline in species habitat was observed for extreme climatic conditions. Moreover, the species would lose 80% of its current suitable habitat to climate change under extreme greenhouse emission scenarios. This shows the species’ sensitivity to the changing climatic conditions and global warming. Our model predicted a shift in species habitats towards higher altitudes in the northern parts of Pakistan. To mitigate the impacts of climate change on species habitats, the country government with the help of national and international conservation organizations should design conservation strategies and policies to encounter the climate change effects. This study underscores the importance of adaptive management practices considering dynamic ecological interactions amid escalating climatic challenges.

Supplementary Materials

The following supporting information can be downloaded at https://www.mdpi.com/article/10.3390/insects16030289/s1, Table S1: The literature on different ecological aspects of A. dorsata to supplement the occurrence data; Table S2: Environmental variables used in MaxEnt modeling; Figure S1: Correlation among all 19 variables. The red highlight shows the variables having correlation less than 0.75.

Author Contributions

Conceptualization: T.U.K., M.F.R., H.H. and X.L.; methodology: T.U.K., AAA, M.F.R., X.L. and G.N.; software: T.U.K., S.N.K. and X.L.; validation: T.U.K., A.I., H.H., G.N. and S.N.K.; formal analysis: T.U.K.; investigation: T.U.K., M.F.R., A.I., G.N. and S.N.K.; resources: H.H. and X.L.; data curation: T.U.K., A.I., M.F.R., S.N.K. and G.N.; writing—original draft preparation: T.U.K.; writing—review and editing: H.H., S.N.K., A.I., G.N., X.L. and M.F.R.; visualization: T.U.K., M.F.R. and A.I.; supervision: H.H.; project administration: T.U.K., X.L., M.F.R., S.N.K. and A.I.; funding acquisition: H.H. All authors have read and agreed to the published version of the manuscript.

Funding

This study was supported by the National Natural Science Foundation of China (no. 31901109), GDAS Special Project of Science and Technology Development (2022GDASZH-2022010105, 2022GDASZH-2022010101), and Dynamic Monitoring of Distribution, Quantity and Activity of Typical Large and Medium-sized Mammals in the Yarlung Tsangpo River Basin (54000022T000000071200, 54000024210200021038).

Data Availability Statement

The data will be available on request.

Acknowledgments

The authors express their sincere gratitude to the relevant government departments for their support in facilitating the field surveys. We sincerely appreciate the valuable feedback, constructive suggestions, and insightful comments provided by the anonymous reviewers, which we believe have significantly enhanced the quality of our manuscript. Finally, we express our deep appreciation to the local communities for their support and hospitality extended to our survey teams during the field surveys.

Conflicts of Interest

The authors declare that they have no known competing financial interests or personal relationships that could have appeared to influence the work reported in this paper.

References

  1. Parmesan, C.; Yohe, G. A globally coherent fingerprint of climate change impacts across natural systems. Nature 2003, 421, 37–42. [Google Scholar] [CrossRef] [PubMed]
  2. Walther, G.-R.; Post, E.; Convey, P.; Menzel, A.; Parmesan, C.; Beebee, T.J.; Fromentin, J.-M.; Hoegh-Guldberg, O.; Bairlein, F. Ecological responses to recent climate change. Nature 2002, 416, 389–395. [Google Scholar] [CrossRef] [PubMed]
  3. Colombo, S.M. Climate change is impacting nutritional security from seafood. Nat. Clim. Change 2023, 13, 1166–1167. [Google Scholar] [CrossRef]
  4. Newbold, T.; Hudson, L.N.; Hill, S.L.; Contu, S.; Lysenko, I.; Senior, R.A.; Börger, L.; Bennett, D.J.; Choimes, A.; Collen, B. Global effects of land use on local terrestrial biodiversity. Nature 2015, 520, 45–50. [Google Scholar] [CrossRef]
  5. Biaou, S.; Gouwakinnou, G.N.; Noulèkoun, F.; Salako, K.V.; Kpoviwanou, J.M.R.H.; Houehanou, T.D.; Biaou, H.S.S. Incorporating intraspecific variation into species distribution models improves climate change analyses of a widespread West African tree species (Pterocarpus erinaceus Poir, Fabaceae). Glob. Ecol. Conserv. 2023, 45, e02538. [Google Scholar] [CrossRef]
  6. Zhao, H.; Zhang, H.; Xu, C. Study on Taiwania cryptomerioides under climate change: MaxEnt modeling for predicting the potential geographical distribution. Glob. Ecol. Conserv. 2020, 24, e01313. [Google Scholar] [CrossRef]
  7. Hamann, A.; Wang, T. Potential effects of climate change on ecosystem and tree species distribution in British Columbia. Ecology 2006, 87, 2773–2786. [Google Scholar] [CrossRef]
  8. Barrett, M.A.; Brown, J.L.; Junge, R.E.; Yoder, A.D. Climate change, predictive modeling and lemur health: Assessing impacts of changing climate on health and conservation in Madagascar. Biol. Conserv. 2013, 157, 409–422. [Google Scholar] [CrossRef]
  9. Kellermann, V.; Van Heerwaarden, B.; Sgrò, C.M.; Hoffmann, A.A. Fundamental evolutionary limits in ecological traits drive Drosophila species distributions. Science 2009, 325, 1244–1246. [Google Scholar] [CrossRef]
  10. Abolmaali, S.M.-R.; Tarkesh, M.; Bashari, H. MaxEnt modeling for predicting suitable habitats and identifying the effects of climate change on a threatened species, Daphne mucronata, in central Iran. Ecol. Inform. 2018, 43, 116–123. [Google Scholar] [CrossRef]
  11. Warren, D.L.; Seifert, S.N. Ecological niche modeling in Maxent: The importance of model complexity and the performance of model selection criteria. Ecol. Appl. 2011, 21, 335–342. [Google Scholar] [CrossRef] [PubMed]
  12. Cuena-Lombraña, A.; Fois, M.; Fenu, G.; Cogoni, D.; Bacchetta, G. The impact of climatic variations on the reproductive success of Gentiana lutea L. in a Mediterranean mountain area. Int. J. Biometeorol. 2018, 62, 1283–1295. [Google Scholar] [CrossRef] [PubMed]
  13. Parmesan, C. Ecological and evolutionary responses to recent climate change. Annu. Rev. Ecol. Evol. Syst. 2006, 37, 637–669. [Google Scholar] [CrossRef]
  14. Bar-Massada, A.; Ives, A.R.; Butsic, V. A mathematical partitioning of the effects of habitat loss and habitat degradation on species abundance. Landsc. Ecol. 2019, 34, 9–15. [Google Scholar] [CrossRef]
  15. Wiegand, T.; Revilla, E.; Moloney, K.A. Effects of habitat loss and fragmentation on population dynamics. Conserv. Biol. 2005, 19, 108–121. [Google Scholar] [CrossRef]
  16. Bogich, T.L.; Barker, G.M.; Mahlfeld, K.; Climo, F.; Green, R.; Balmford, A. Fragmentation, grazing and the species–area relationship. Ecography 2012, 35, 224–231. [Google Scholar] [CrossRef]
  17. Heinrichs, J.A.; Bender, D.J.; Schumaker, N.H. Habitat degradation and loss as key drivers of regional population extinction. Ecol. Model. 2016, 335, 64–73. [Google Scholar] [CrossRef]
  18. Moraitis, M.L.; Valavanis, V.D.; Karakassis, I. Modelling the effects of climate change on the distribution of benthic indicator species in the Eastern Mediterranean Sea. Sci. Total Environ. 2019, 667, 16–24. [Google Scholar] [CrossRef]
  19. Swets, J.A. Measuring the accuracy of diagnostic systems. Science 1988, 240, 1285–1293. [Google Scholar] [CrossRef]
  20. Wilson, K.L.; Skinner, M.A.; Lotze, H.K. Projected 21st-century distribution of canopy-forming seaweeds in the Northwest Atlantic with climate change. Divers. Distrib. 2019, 25, 582–602. [Google Scholar] [CrossRef]
  21. Aguayo, J.; Elegbede, F.; Husson, C.; Saintonge, F.X.; Marçais, B. Modeling climate impact on an emerging disease, the Phytophthora alni-induced alder decline. Glob. Change Biol. 2014, 20, 3209–3221. [Google Scholar] [CrossRef] [PubMed]
  22. Rohr, J.R.; Halstead, N.T.; Raffel, T.R. Modelling the future distribution of the amphibian chytrid fungus: The influence of climate and human-associated factors. J. Appl. Ecol. 2011, 48, 174–176. [Google Scholar] [CrossRef]
  23. Kinezaki, N.; Kawasaki, K.; Shigesada, N. The effect of the spatial configuration of habitat fragmentation on invasive spread. Theor. Popul. Biol. 2010, 78, 298–308. [Google Scholar] [CrossRef] [PubMed]
  24. Choudhury, M.R.; Deb, P.; Singha, H.; Chakdar, B.; Medhi, M. Predicting the probable distribution and threat of invasive Mimosa diplotricha Suavalle and Mikania micrantha Kunth in a protected tropical grassland. Ecol. Eng. 2016, 97, 23–31. [Google Scholar] [CrossRef]
  25. Silvertown, J. Plant coexistence and the niche. Trends Ecol. Evol. 2004, 19, 605–611. [Google Scholar] [CrossRef]
  26. Michalski, F.; Peres, C.A. Anthropogenic determinants of primate and carnivore local extinctions in a fragmented forest landscape of southern Amazonia. Biol. Conserv. 2005, 124, 383–396. [Google Scholar] [CrossRef]
  27. Sih, A.; Jonsson, B.G.; Luikart, G. Habitat loss: Ecological, evolutionary and genetic consequences. Trends Ecol. Evol. 2000, 15, 132–134. [Google Scholar] [CrossRef]
  28. Qin, A.; Liu, B.; Guo, Q.; Bussmann, R.W.; Ma, F.; Jian, Z.; Xu, G.; Pei, S. Maxent modeling for predicting impacts of climate change on the potential distribution of Thuja sutchuenensis Franch., an extremely endangered conifer from southwestern China. Glob. Ecol. Conserv. 2017, 10, 139–146. [Google Scholar] [CrossRef]
  29. Spooner, F.E.; Pearson, R.G.; Freeman, R. Rapid warming is associated with population decline among terrestrial birds and mammals globally. Glob. Change Biol. 2018, 24, 4521–4531. [Google Scholar] [CrossRef]
  30. Soroye, P.; Newbold, T.; Kerr, J. Climate change contributes to widespread declines among bumble bees across continents. Science 2020, 367, 685–688. [Google Scholar] [CrossRef]
  31. Outhwaite, C.L.; McCann, P.; Newbold, T. Agriculture and climate change are reshaping insect biodiversity worldwide. Nature 2022, 605, 97–102. [Google Scholar] [CrossRef]
  32. Powney, G.D.; Carvell, C.; Edwards, M.; Morris, R.K.; Roy, H.E.; Woodcock, B.A.; Isaac, N.J. Widespread losses of pollinating insects in Britain. Nat. Commun. 2019, 10, 1–6. [Google Scholar] [CrossRef]
  33. Kougioumoutzis, K.; Kaloveloni, A.; Petanidou, T. Assessing climate change impacts on Island bees: The Aegean Archipelago. Biology 2022, 11, 552. [Google Scholar] [CrossRef]
  34. Eickermann, M.; Junk, J.; Rapisarda, C. Climate change and insects. Insects 2023, 14, 678. [Google Scholar] [CrossRef]
  35. Mutamiswa, R.; Chikowore, G.; Nyamukondiwa, C.; Mudereri, B.T.; Khan, Z.R.; Chidawanyika, F. Biogeography of cereal stemborers and their natural enemies: Forecasting pest management efficacy under changing climate. Pest Manag. Sci. 2022, 78, 4446–4457. [Google Scholar] [CrossRef]
  36. Srivastava, V.; Liang, W.; Keena, M.A.; Roe, A.D.; Hamelin, R.C.; Griess, V.C. Assessing niche shifts and conservatism by comparing the native and post-invasion niches of major forest invasive species. Insects 2020, 11, 479. [Google Scholar] [CrossRef]
  37. Matias, D.M.S.; Leventon, J.; Rau, A.-L.; Borgemeister, C.; von Wehrden, H. A review of ecosystem service benefits from wild bees across social contexts. Ambio 2017, 46, 456–467. [Google Scholar] [CrossRef]
  38. Papa, G.; Maier, R.; Durazzo, A.; Lucarini, M.; Karabagias, I.K.; Plutino, M.; Bianchetto, E.; Aromolo, R.; Pignatti, G.; Ambrogio, A. The honey bee Apis mellifera: An insect at the interface between human and ecosystem health. Biology 2022, 11, 233. [Google Scholar] [CrossRef]
  39. Nguyen, T.-T.; Yoo, M.-S.; Lee, H.-S.; Truong, A.-T.; Youn, S.-Y.; Lee, S.-J.; Kim, J.; Cho, Y.S. First detection and prevalence of Apis mellifera filamentous virus in Apis mellifera and Varroa destructor in the Republic of Korea. Sci. Rep. 2024, 14, 14105. [Google Scholar] [CrossRef]
  40. Gustafson, D.I. Climate change: A crop protection challenge for the twenty-first century. Pest Manag. Sci. 2011, 67, 691–696. [Google Scholar] [CrossRef]
  41. Zou, Y.; Ge, X.; Guo, S.; Zhou, Y.; Wang, T.; Zong, S. Impacts of climate change and host plant availability on the global distribution of Brontispa longissima (Coleoptera: Chrysomelidae). Pest Manag. Sci. 2020, 76, 244–256. [Google Scholar] [CrossRef] [PubMed]
  42. Abro, Z.; Kassie, M.; Tiku, H.A.; Taye, B.; Ayele, Z.A.; Ayalew, W. The impact of beekeeping on household income: Evidence from north-western Ethiopia. Heliyon 2022, 8, e09492. [Google Scholar] [CrossRef] [PubMed]
  43. Basa, B.; Belay, W.; Tilahun, A.; Teshale, A. Review on medicinal value of honeybee products: Apitherapy. Adv. Biol. Res. 2016, 10, 236–247. [Google Scholar]
  44. Nainu, F.; Masyita, A.; Bahar, M.A.; Raihan, M.; Prova, S.R.; Mitra, S.; Emran, T.B.; Simal-Gandara, J. Pharmaceutical prospects of bee products: Special focus on anticancer, antibacterial, antiviral, and antiparasitic properties. Antibiotics 2021, 10, 822. [Google Scholar] [CrossRef]
  45. Salatino, A. Perspectives for uses of propolis in therapy against infectious diseases. Molecules 2022, 27, 4594. [Google Scholar] [CrossRef]
  46. Kishan Tej, M.; Aruna, R.; Mishra, G.; Srinivasan, M. Beekeeping in India. Ind. Entomol. 2017, 35–66. [Google Scholar] [CrossRef]
  47. Fakrudin, B.; Ugalat, J.; Lakshmidevamma, T.; Kumar, C.; Rakesh, K.; Thimmarayappa, R. Genetic Diversity of Apis dorsata and Apis laboriosa. In Role of Giant Honeybees in Natural and Agricultural Systems; CRC Press: Boca Raton, FL, USA, 2023; pp. 62–77. [Google Scholar]
  48. Migdał, P.; Murawska, A.; Berbeć, E.; Zarębski, K.; Ratajczak, N.; Roman, A.; Latarowski, K. Biochemical Indicators and Mortality in Honey Bee (Apis mellifera) Workers after Oral Exposure to Plant Protection Products and Their Mixtures. Agriculture 2023, 14, 5. [Google Scholar] [CrossRef]
  49. Rahimi, E.; Jung, C. Global trends in climate suitability of bees: Ups and downs in a warming world. Insects 2024, 15, 127. [Google Scholar] [CrossRef]
  50. Czekońska, K.; Łopuch, S.; Miścicki, S. The effect of meteorological and environmental variables on food collection by honey bees (Apis mellifera). Ecol. Indic. 2023, 156, 111140. [Google Scholar] [CrossRef]
  51. Landaverde, R.; Rodriguez, M.T.; Parrella, J.A. Honey production and climate change: Beekeepers’ perceptions, farm adaptation strategies, and information needs. Insects 2023, 14, 493. [Google Scholar] [CrossRef]
  52. Novelli, S.; Vercelli, M.; Ferracini, C. An easy mixed-method analysis tool to support rural development strategy decision-making for beekeeping. Land 2021, 10, 675. [Google Scholar] [CrossRef]
  53. Ruttner, F.; Ruttner, F. Apis dorsata Fabricius 1793: 328. In Biogeography and Taxonomy of Honeybees; Springer Science & Business Media: Berlin/Heidelberg, Germany, 1988; pp. 103–119. [Google Scholar]
  54. Renner, I.W.; Warton, D.I. Equivalence of MAXENT and Poisson point process models for species distribution modeling in ecology. Biometrics 2013, 69, 274–281. [Google Scholar] [CrossRef] [PubMed]
  55. Gupta, R.K. Taxonomy and distribution of different honeybee species. In Beekeeping for Poverty Alleviation and Livelihood Security; Springer: Dordrecht, The Netherlands, 2014; pp. 63–103. [Google Scholar]
  56. Haldhar, S.; Nidhi, C.; Singh, K.; Devi, A. Honeybees diversity, pollination, entrepreneurship and beekeeping scenario in NEH region of India. J. Agric. Ecol. 2021, 12, 27–43. [Google Scholar] [CrossRef]
  57. Khan, K.A.; Ansari, M.J.; Al-Ghamdi, A.; Sharma, D.; Ali, H. Biodiversity and relative abundance of different honeybee species (Hymenoptera: Apidae) in Murree-Punjab, Pakistan. J. Entomol. Zool. Stud. 2014, 2, 324–327. [Google Scholar]
  58. Kitnya, N.; Prabhudev, M.; Bhatta, C.P.; Pham, T.H.; Nidup, T.; Megu, K.; Chakravorty, J.; Brockmann, A.; Otis, G.W. Geographical distribution of the giant honey bee Apis laboriosa Smith, 1871 (Hymenoptera, Apidae). ZooKeys 2020, 951, 67. [Google Scholar] [CrossRef]
  59. Mustafa, G.; Iqbal, A.; Arshad Javid, W.A.; Ahmad, N.; Saleem, M.; Farooq, M.; Farooq, M.; Hussain, S.; Ali, A.; Khalid, M. Morphological and genetic characterization of various Apis species captured from selected sites of Punjab. Feb-Fresenius Environ. Bull. 2022, 31, 11259. [Google Scholar]
  60. Bashir, S.; Malik, M.F.; Hussain, M. Spatiotemporal occurrence of beehives of genus Apis in Northern Punjab and Azad Jammu and Kashmir, Pakistan. Kuwait J. Sci. 2023, 50, 40–46. [Google Scholar] [CrossRef]
  61. Phillips, S.J.; Dudík, M. Modeling of species distributions with Maxent: New extensions and a comprehensive evaluation. Ecography 2008, 31, 161–175. [Google Scholar] [CrossRef]
  62. Evcin, O.; Kucuk, O.; Akturk, E. Habitat suitability model with maximum entropy approach for European roe deer (Capreolus capreolus) in the Black Sea Region. Environ. Monit. Assess. 2019, 191, 669. [Google Scholar] [CrossRef]
  63. Friedman, K.; Shimony, A. Jaynes’s maximum entropy prescription and probability theory. J. Stat. Phys. 1971, 3, 381–384. [Google Scholar] [CrossRef]
  64. Phillips, S.J.; Anderson, R.P.; Schapire, R.E. Maximum entropy modeling of species geographic distributions. Ecol. Model. 2006, 190, 231–259. [Google Scholar] [CrossRef]
  65. Wisz, M.S.; Hijmans, R.; Li, J.; Peterson, A.T.; Graham, C.; Guisan, A.; NCEAS Predicting Species Distributions Working Group. Effects of sample size on the performance of species distribution models. Divers. Distrib. 2008, 14, 763–773. [Google Scholar] [CrossRef]
  66. Aryal, A.; Shrestha, U.B.; Ji, W.; Ale, S.B.; Shrestha, S.; Ingty, T.; Maraseni, T.; Cockfield, G.; Raubenheimer, D. Predicting the distributions of predator (snow leopard) and prey (blue sheep) under climate change in the Himalaya. Ecol. Evol. 2016, 6, 4065–4075. [Google Scholar] [CrossRef] [PubMed]
  67. Holt, C.D.S.; Nevin, O.T.; Smith, D.; Convery, I. Environmental niche overlap between snow leopard and four prey species in Kazakhstan. Ecol. Inform. 2018, 48, 97–103. [Google Scholar] [CrossRef]
  68. Sony, R.; Sen, S.; Kumar, S.; Sen, M.; Jayahari, K. Niche models inform the effects of climate change on the endangered Nilgiri Tahr (Nilgiritragus hylocrius) populations in the southern Western Ghats, India. Ecol. Eng. 2018, 120, 355–363. [Google Scholar] [CrossRef]
  69. Luo, Z.; Jiang, Z.; Tang, S. Impacts of climate change on distributions and diversity of ungulates on the Tibetan Plateau. Ecol. Appl. 2015, 25, 24–38. [Google Scholar] [CrossRef]
  70. Khan, B.; Ablimit, A.; Khan, G.; Jasra, A.W.; Ali, H.; Ali, R.; Ahmad, E.; Ismail, M. Abundance, distribution and conservation status of Siberian ibex, Marco Polo and Blue sheep in Karakoram-Pamir mountain area. J. King Saud Univ.-Sci. 2016, 28, 216–225. [Google Scholar] [CrossRef]
  71. Khan, T.U.; Ullah, I.; Hu, Y.; Liang, J.; Ahmad, S.; Omifolaji, J.K.; Hu, H. Assessment of Suitable Habitat of the Demoiselle Crane (Anthropoides virgo) in the Wake of Climate Change: A Study of Its Wintering Refugees in Pakistan. Animals 2024, 14, 1453. [Google Scholar] [CrossRef]
  72. Irshad, M.; Stephen, E. Value of insect pollinators to agriculture of Pakistan. Int. J. Agron. Agric. Res 2013, 3, 14–21. [Google Scholar]
  73. Ghani, U.; Nawaz, A.; Mustafa, T.; Muneer, S.; Ghafar, A.; Akbar, S.; Bibi, S.; Aziz, M.; Aslam, A. Challenges and Threats for Pollinator Conservation. In Advances in Insect Pollination Technology in Sustainable Agriculture; IK International Pvt. Ltd.: Delhi, India, 2023. [Google Scholar] [CrossRef]
  74. Usman, M.; Hasnain, M.; Banaras, S.; Akram, M.; Abbas, Q.; Shah, J.A.; Tabasum, S.; Shah, S.A.; Raza, A.; Khan, M.N. Potential emerging constraints and management strategies of different honeybee species in Pakistan: A review. CABI Rev. 2022. [Google Scholar] [CrossRef]
  75. Eckstein, D.; Künzel, V.; Schäfer, L. Global Climate Risk Index 2019. Who Suffers Most from Extreme Weather Events? Weather-Related Loss Events in 2017 and 1998 to 2017; Germanwatch: Bonn, Germany, 2017. [Google Scholar]
  76. Eckstein, D.; Künzel, V.; Schäfer, L.; Winges, M. Global Climate Risk Index 2020; Germanwatch: Bonn, Germany, 2019; pp. 1–50. [Google Scholar]
  77. Rehman, A.; Jingdong, L.; Du, Y.; Khatoon, R.; Wagan, S.A.; Nisar, S.K. Flood disaster in Pakistan and its impact on agriculture growth (a review). Environ. Dev. Econ. 2016, 6, 39–42. [Google Scholar]
  78. Looney, R. Economic impacts of the floods in Pakistan. In Pakistan in National and Regional Change; Routledge: London, UK, 2016; pp. 53–69. [Google Scholar]
  79. Ahmad, Z.; Hafeez, M.; Ahmad, I. Hydrology of mountainous areas in the upper Indus Basin, Northern Pakistan with the perspective of climate change. Environ. Monit. Assess. 2012, 184, 5255–5274. [Google Scholar] [CrossRef]
  80. Ashraf, A.; Naz, R.; Roohi, R. Glacial lake outburst flood hazards in Hindukush, Karakoram and Himalayan Ranges of Pakistan: Implications and risk analysis. Geomat. Nat. Hazards Risk 2012, 3, 113–132. [Google Scholar] [CrossRef]
  81. Joshi, S.; Jasra, W.; Ismail, M.; Shrestha, R.; Yi, S.; Wu, N. Herders’ perceptions of and responses to climate change in Northern Pakistan. Environ. Manag. 2013, 52, 639–648. [Google Scholar] [CrossRef]
  82. Tahir, A.A.; Chevallier, P.; Arnaud, Y.; Ashraf, M.; Bhatti, M.T. Snow cover trend and hydrological characteristics of the Astore River basin (Western Himalayas) and its comparison to the Hunza basin (Karakoram region). Sci. Total Environ. 2015, 505, 748–761. [Google Scholar] [CrossRef]
  83. Khan, T.U.; Ahmad, S. Protect Pakistan’s otters. Science 2024, 384, 519. [Google Scholar] [CrossRef]
  84. Kulkarni, A.; Patwardhan, S.; Kumar, K.K.; Ashok, K.; Krishnan, R. Projected climate change in the Hindu Kush–Himalayan region by using the high-resolution regional climate model PRECIS. Mt. Res. Dev. 2013, 33, 142–151. [Google Scholar] [CrossRef]
  85. Xu, J.; Grumbine, R.E.; Shrestha, A.; Eriksson, M.; Yang, X.; Wang, Y.; Wilkes, A. The melting Himalayas: Cascading effects of climate change on water, biodiversity, and livelihoods. Conserv. Biol. 2009, 23, 520–530. [Google Scholar] [CrossRef]
  86. Ali, Z.; Khan, A. Captive Breeding and Multiple Clutching Techniques of Captive Cranes in Bannu and Lakki Marwat, NWFP; The Ministry of Environment’s Pakistan Wetlands Programme: Bannu, Pakistan, 2007; p. 42. [Google Scholar]
  87. Baig, M.B.; Al-Subaiee, F.S. Biodiversity in Pakistan: Key issues. Biodiversity 2009, 10, 20–29. [Google Scholar] [CrossRef]
  88. White, P.C.; Jennings, N.V.; Renwick, A.R.; Barker, N.H. Questionnaires in ecology: A review of past use and recommendations for best practice. J. Appl. Ecol. 2005, 42, 421–430. [Google Scholar] [CrossRef]
  89. Shima, A.L.; Berger, L.; Skerratt, L.F. Conservation and health of Lumholtz’s tree-kangaroo (Dendrolagus lumholtzi). Aust. Mammal. 2018, 41, 57–64. [Google Scholar] [CrossRef]
  90. Lunney, D.; Matthews, A. The contribution of the community to defining the distribution of a vulnerable species, the spotted-tailed quoll, Dasyurus maculatus. Wildl. Res. 2001, 28, 537–545. [Google Scholar] [CrossRef]
  91. Wang, Z.; Li, Z.; Beauchamp, G.; Jiang, Z. Flock size and human disturbance affect vigilance of endangered red-crowned cranes (Grus japonensis). Biol. Conserv. 2011, 144, 101–105. [Google Scholar] [CrossRef]
  92. Said, F.; Jalal, F.; Imtiaz, M.; Khan, M.A.; Hussain, S. Foraging behavior of the giant honey bee, Apis dorsata F. (Hymenoptera: Apidae) in sunflower (Helianthus annuus L.) at Peshawar District of Pakistan. Pure Appl. Biol. 2018, 7, 1115–1121. [Google Scholar] [CrossRef]
  93. Akram, A.; Sohail, A.; Masud, T.; Latif, A.; Tariq, S.; Butt, S.J.; Hassan, I. Physico-chemical and antimicrobial assessment of honey of Apis dorsata from different geographical regions of Pakistan. Int. J. Agric. Sci. Res. 2014, 3, 25–30. [Google Scholar]
  94. Sajid, M.; Haider, Z.; Awan, Q.T.; Ahmad, B.; Naz, S.; Khan, J.; Khan, N.A.; Sharif, S.; Qamer, S. Bio-chemical analysis of honey made by three, Apis florea, Apis mellifera and Apis dorsata’s honeybee species from Punjab region. Pure Appl. Biol. (PAB) 2023, 12, 1017–1024. [Google Scholar] [CrossRef]
  95. Ahmad, R. Methods to control migration by Apis dorsata colonies in Pakistan. Bee World 1989, 70, 160–162. [Google Scholar] [CrossRef]
  96. Kousar, R.; Qamer, S. Physciochemical variations in the honey produced by Apis dorsata from Punjab, Pakistan. Pure Appl. Biol. (PAB) 2017, 6, 733–739. [Google Scholar] [CrossRef]
  97. Sajjad, A.; Maqsood, S.; Abbasi, A.; Awais, M.; Rafiq, S.; Rafique, M.K.; Iqra, R.; Haq, I.U. Comparison of wild honeybees in the pollination of strawberries in Bahawalpur, Pakistan: Comparación de abejas silvestres en la polinización de frutilla en Bahawalpur, Pakistán. Rev. Soc. Entomológica Argent. 2023, 82, 1–8. [Google Scholar] [CrossRef]
  98. Iftikhar, F.; Masood, M.A.; Waghchoure, E.S. Comparison of Apis cerana, Apis dorsata, Apis florea and Apis mellifera honey from different areas of Pakistan. Asian J. Exp. Biol. Sci. 2011, 2, 399–403. [Google Scholar]
  99. Qamer, S.; Al-Abbadi, A.A.; Sajid, M.; Asad, F.; Khan, M.F.; Khan, N.A.; Sthanadar, A.A.; Akhtar, M.N.; Mahmoud, A.H.; Mohammed, O.B. Genetic analysis of honey bee, Apis dorsata populations using random amplified polymorphic DNA (RAPD) markers. J. King Saud Univ.-Sci. 2021, 33, 101218. [Google Scholar] [CrossRef]
  100. Farooqi, M.A.; Akhtar, S.; Arshad, M.; Aslam, M.N.; Rafay, M. Detection of insecticide residues in honey of Apis dorsata F. from Southern Punjab, Pakistan. Pak. J. Zool. 2017, 49, 1761–1766. [Google Scholar] [CrossRef]
  101. Mustafa, G.; Iqbal, A.; Javid, A.; Manzoor, M.; Aslam, S.; Ali, A.; Azam, S.M.; Khalid, M.; Farooq, M.; Al Naggar, Y. Antibacterial properties of Apis dorsata honey against some bacterial pathogens. Saudi J. Biol. Sci. 2022, 29, 730–734. [Google Scholar] [CrossRef]
  102. Perveen, N.; Ahmad, M. Toxicity of some insecticides to the haemocytes of giant honeybee, Apis dorsata F. under laboratory conditions. Saudi J. Biol. Sci. 2017, 24, 1016–1022. [Google Scholar] [CrossRef] [PubMed]
  103. Akhtar, T.; Aziz, M.A.; Naeem, M.; Ahmed, M.S.; Bodlah, I. Diversity and relative abundance of pollinator fauna of canola (Brassica napus L. var Chakwal Sarsoon) with managed Apis mellifera L. in Pothwar region, Gujar Khan, Pakistan. Pak. J. Zool. 2018, 50, 567–573. [Google Scholar] [CrossRef]
  104. Ahmad, S.; Zafar, M.; Ahmad, M.; Sultana, S.; Yaseen, G.; Khan, K.; Khan, F. Health benefits of honey and ethnobotanical uses of its bee flora from Lakki Marwat district, Khyber Pakhtunkhwa, Pakistan. Interdiscip. J. Appl. Basics Subj. 2021, 1, 27–35. [Google Scholar]
  105. Ali, M.; Sajjad, A.; Saeed, S. Yearlong association of Apis dorsata and Apis florea with flowering plants: Planted forest vs. agricultural landscape. Sociobiology 2017, 64, 18–25. [Google Scholar] [CrossRef]
  106. Akram, W.; Sajjad, A.; Ali, M.; Khan, H.A.A.; Maqsood, S.; Farooq, S.U. Toxicity of Commonly Used Insecticides against Apis dorsata (Hymenoptera: Apidae) in South Punjab, Pakistan. Pak. J. Zool. 2024, 1–16. [Google Scholar] [CrossRef]
  107. Ashkani, H.; Badinij, K.; Bulfati, A.; Chutani, U.; Dareshak, T.; Darzada, D. Assessment of physico-chemical and antimicrobial of honey of Apis dorsata from different locations of Pakistan. Glob. Sci. Res. J. 2014, 2, 186–191. [Google Scholar]
  108. Aiello-Lammens, M.E.; Boria, R.A.; Radosavljevic, A.; Vilela, B.; Anderson, R.P. spThin: An R package for spatial thinning of species occurrence records for use in ecological niche models. Ecography 2015, 38, 541–545. [Google Scholar] [CrossRef]
  109. Guisan, A.; Zimmermann, N.E. Predictive habitat distribution models in ecology. Ecol. Model. 2000, 135, 147–186. [Google Scholar] [CrossRef]
  110. Peterson, A.; Soberón, J.; Pearson, R.; Anderson, R.P.; Martínez-Meyer, E.; Nakamura, M.; Araújo, M. Evaluating model performance and significance. Ecol. Niches Geogr. Distrib. 2011, 150–181. [Google Scholar] [CrossRef]
  111. Pearson, R.G.; Raxworthy, C.J.; Nakamura, M.; Townsend Peterson, A. Predicting species distributions from small numbers of occurrence records: A test case using cryptic geckos in Madagascar. J. Biogeogr. 2007, 34, 102–117. [Google Scholar] [CrossRef]
  112. Shcheglovitova, M.; Anderson, R.P. Estimating optimal complexity for ecological niche models: A jackknife approach for species with small sample sizes. Ecol. Model. 2013, 269, 9–17. [Google Scholar] [CrossRef]
  113. Franklin, J. Mapping Species Distributions: Spatial Inference and Prediction; Cambridge University Press: Cambridge, UK, 2009. [Google Scholar]
  114. Sánchez-Mercado, A.; Ferrer-Paris, J.; Franklin, J. Mapping species distributions: Spatial inference and prediction. Oryx 2010, 44, 615. [Google Scholar] [CrossRef]
  115. Hijmans, R.J.; Cameron, S.E.; Parra, J.L.; Jones, P.G.; Jarvis, A. Very high resolution interpolated climate surfaces for global land areas. Int. J. Climatol. J. R. Meteorol. Soc. 2005, 25, 1965–1978. [Google Scholar] [CrossRef]
  116. Kriticos, D.J.; Webber, B.L.; Leriche, A.; Ota, N.; Macadam, I.; Bathols, J.; Scott, J.K. CliMond: Global high-resolution historical and future scenario climate surfaces for bioclimatic modelling. Methods Ecol. Evol. 2012, 3, 53–64. [Google Scholar] [CrossRef]
  117. Sbrocco, E.J.; Barber, P.H. MARSPEC: Ocean climate layers for marine spatial ecology: Ecological Archives E094-086. Ecology 2013, 94, 979. [Google Scholar] [CrossRef]
  118. Karger, D.N.; Conrad, O.; Böhner, J.; Kawohl, T.; Kreft, H.; Soria-Auza, R.W.; Zimmermann, N.E.; Linder, H.P.; Kessler, M. Climatologies at high resolution for the earth’s land surface areas. Sci. Data 2017, 4, 170122. [Google Scholar] [CrossRef]
  119. Hijmans, R.; Barbosa, M.; Ghosh, A.; Mandel, A. Geodata: Download Geographic Data, R Package Version 0.5-8; R Core Team: Cary, CA, USA, 2023. [Google Scholar]
  120. Kaeslin, E.; Redmond, I.; Dudley, N. Wildlife in a Changing Climate; Food and Agriculture Organization of the United Nations (FAO): Rome, Italy, 2012. [Google Scholar]
  121. Yang, X.-Q.; Kushwaha, S.; Saran, S.; Xu, J.; Roy, P. Maxent modeling for predicting the potential distribution of medicinal plant, Justicia adhatoda L. in Lesser Himalayan foothills. Ecol. Eng. 2013, 51, 83–87. [Google Scholar] [CrossRef]
  122. Molloy, S.W.; Davis, R.A.; Van Etten, E.J. Species distribution modelling using bioclimatic variables to determine the impacts of a changing climate on the western ringtail possum (Pseudocheirus occidentals; Pseudocheiridae). Environ. Conserv. 2014, 41, 176–186. [Google Scholar] [CrossRef]
  123. Yi, Y.-j.; Zhou, Y.; Cai, Y.-p.; Yang, W.; Li, Z.-w.; Zhao, X. The influence of climate change on an endangered riparian plant species: The root of riparian Homonoia. Ecol. Indic. 2018, 92, 40–50. [Google Scholar] [CrossRef]
  124. Liu, B.; Gao, X.; Ma, J.; Jiao, Z.; Xiao, J.; Hayat, M.A.; Wang, H. Modeling the present and future distribution of arbovirus vectors Aedes aegypti and Aedes albopictus under climate change scenarios in Mainland China. Sci. Total Environ. 2019, 664, 203–214. [Google Scholar] [CrossRef] [PubMed]
  125. Swanepoel, L.H.; Lindsey, P.; Somers, M.J.; Van Hoven, W.; Dalerum, F. Extent and fragmentation of suitable leopard habitat in South Africa. Anim. Conserv. 2013, 16, 41–50. [Google Scholar] [CrossRef]
  126. Elith, J.; Phillips, S.J.; Hastie, T.; Dudík, M.; Chee, Y.E.; Yates, C.J. A statistical explanation of MaxEnt for ecologists. Divers. Distrib. 2011, 17, 43–57. [Google Scholar] [CrossRef]
  127. Araújo, M.B.; Anderson, R.P.; Márcia Barbosa, A.; Beale, C.M.; Dormann, C.F.; Early, R.; Garcia, R.A.; Guisan, A.; Maiorano, L.; Naimi, B. Standards for distribution models in biodiversity assessments. Sci. Adv. 2019, 5, eaat4858. [Google Scholar] [CrossRef]
  128. Phillips, A.J.; Vidafar, P.; Burns, A.C.; McGlashan, E.M.; Anderson, C.; Rajaratnam, S.M.; Lockley, S.W.; Cain, S.W. High sensitivity and interindividual variability in the response of the human circadian system to evening light. Proc. Natl. Acad. Sci. USA 2019, 116, 12019–12024. [Google Scholar] [CrossRef]
  129. Phillips, J.J.; Phillips, P.P. Handbook of Training Evaluation and Measurement Methods; Routledge: London, UK, 2016. [Google Scholar]
  130. Zhao, X.; Ren, B.; Li, D.; Garber, P.A.; Zhu, P.; Xiang, Z.; Grueter, C.C.; Liu, Z.; Li, M. Climate change, grazing, and collecting accelerate habitat contraction in an endangered primate. Biol. Conserv. 2019, 231, 88–97. [Google Scholar] [CrossRef]
  131. Bosso, L.; Rebelo, H.; Garonna, A.P.; Russo, D. Modelling geographic distribution and detecting conservation gaps in Italy for the threatened beetle Rosalia alpina. J. Nat. Conserv. 2013, 21, 72–80. [Google Scholar] [CrossRef]
  132. Fois, M.; Fenu, G.; Lombrana, A.C.; Cogoni, D.; Bacchetta, G. A practical method to speed up the discovery of unknown populations using Species Distribution Models. J. Nat. Conserv. 2015, 24, 42–48. [Google Scholar] [CrossRef]
  133. Vasconcelos, T.S.; Rodríguez, M.Á.; Hawkins, B.A. Species distribution modelling as a macroecological tool: A case study using New World amphibians. Ecography 2012, 35, 539–548. [Google Scholar] [CrossRef]
  134. Hernandez, P.A.; Graham, C.H.; Master, L.L.; Albert, D.L. The effect of sample size and species characteristics on performance of different species distribution modeling methods. Ecography 2006, 29, 773–785. [Google Scholar] [CrossRef]
  135. Kumar, S.; Stohlgren, T.J. Maxent modeling for predicting suitable habitat for threatened and endangered tree Canacomyrica monticola in New Caledonia. J. Ecol. Nat. Environ. 2009, 1, 94–98. [Google Scholar]
  136. Harte, J.; Zillio, T.; Conlisk, E.; Smith, A.B. Maximum entropy and the state-variable approach to macroecology. Ecology 2008, 89, 2700–2711. [Google Scholar] [CrossRef]
  137. Zhang, F.; Xiang, X.; Dong, Y.; Yan, S.; Song, Y.; Zhou, L. Significant differences in the gut bacterial communities of Hooded Crane (Grus monacha) in different seasons at a stopover site on the flyway. Animals 2020, 10, 701. [Google Scholar] [CrossRef]
  138. Kass, J.M.; Muscarella, R.; Galante, P.J.; Bohl, C.L.; Pinilla-Buitrago, G.E.; Boria, R.A.; Soley-Guardia, M.; Anderson, R.P. ENMeval 2.0: Redesigned for customizable and reproducible modeling of species’ niches and distributions. Methods Ecol. Evol. 2021, 12, 1602–1608. [Google Scholar] [CrossRef]
  139. Muscarella, R.; Galante, P.J.; Soley-Guardia, M.; Boria, R.A.; Kass, J.M.; Uriarte, M.; Anderson, R.P. ENM eval: An R package for conducting spatially independent evaluations and estimating optimal model complexity for Maxent ecological niche models. Methods Ecol. Evol. 2014, 5, 1198–1205. [Google Scholar] [CrossRef]
  140. Bohl, C.L.; Kass, J.M.; Anderson, R.P. A new null model approach to quantify performance and significance for ecological niche models of species distributions. J. Biogeogr. 2019, 46, 1101–1111. [Google Scholar] [CrossRef]
  141. Yi, Y.-j.; Cheng, X.; Yang, Z.-F.; Zhang, S.-H. Maxent modeling for predicting the potential distribution of endangered medicinal plant (H. riparia Lour) in Yunnan, China. Ecol. Eng. 2016, 92, 260–269. [Google Scholar] [CrossRef]
  142. Li, Y.; Li, M.; Li, C.; Liu, Z. Optimized maxent model predictions of climate change impacts on the suitable distribution of Cunninghamia lanceolata in China. Forests 2020, 11, 302. [Google Scholar] [CrossRef]
  143. Hijmans, R.J.; Phillips, S.; Leathwick, J.; Elith, J.; Hijmans, M.R.J. Package ‘dismo’. Circles 2017, 9, 1–68. [Google Scholar]
  144. Ahmad, S.; Khattak, R.H.; Teng, L.; Kaneez, K.; Liu, Z. Factors Affecting Habitat Selection of Endangered Steppe Eagle (Aquila nipalensis) in Pakistan: Implications for Raptors Conservation. Diversity 2022, 14, 1135. [Google Scholar] [CrossRef]
  145. Merow, C.; Smith, M.J.; Silander, J.A., Jr. A practical guide to MaxEnt for modeling species’ distributions: What it does, and why inputs and settings matter. Ecography 2013, 36, 1058–1069. [Google Scholar] [CrossRef]
  146. Guisan, A.; Thuiller, W.; Zimmermann, N.E. Habitat Suitability and Distribution Models: With Applications in R; Cambridge University Press: Cambridge, UK, 2017. [Google Scholar]
  147. Hijmans, R.J.; Elith, J. Species Distribution Modeling with R; R Cran Project: Vienna, Austria, 2013. [Google Scholar]
  148. El-Gabbas, A.; Dormann, C.F. Improved species-occurrence predictions in data-poor regions: Using large-scale data and bias correction with down-weighted Poisson regression and Maxent. Ecography 2018, 41, 1161–1172. [Google Scholar] [CrossRef]
  149. Kevan, P.G. Forest application of the insecticide Fenitrothion and its effect on wild bee pollinators (Hymenoptera: Apoidea) of lowbush blueberries (Vaccinium spp.) in Southern New Brunswick, Canada. Biol. Conserv. 1975, 7, 301–309. [Google Scholar] [CrossRef]
  150. Heinrich, B. The Hot-Blooded Insects: Strategies and Mechanisms of Thermoregulation; Harvard University Press: Cambridge, MA, USA, 1993. [Google Scholar]
  151. Seeley, T.D. The Wisdom of the Hive: The Social Physiology of Honey Bee Colonies; Harvard University Press: Cambridge, MA, USA, 2009. [Google Scholar]
  152. Stabentheiner, A.; Kovac, H.; Brodschneider, R. Honeybee colony thermoregulation–regulatory mechanisms and contribution of individuals in dependence on age, location and thermal stress. PLoS ONE 2010, 5, e8967. [Google Scholar] [CrossRef]
  153. Goulson, D.; Nicholls, E.; Botías, C.; Rotheray, E.L. Bee declines driven by combined stress from parasites, pesticides, and lack of flowers. Science 2015, 347, 1255957. [Google Scholar] [CrossRef]
  154. Brodschneider, R.; Crailsheim, K. Nutrition and health in honey bees. Apidologie 2010, 41, 278–294. [Google Scholar] [CrossRef]
  155. Ricketts, T.H.; Regetz, J.; Steffan-Dewenter, I.; Cunningham, S.A.; Kremen, C.; Bogdanski, A.; Gemmill-Herren, B.; Greenleaf, S.S.; Klein, A.M.; Mayfield, M.M. Landscape effects on crop pollination services: Are there general patterns? Ecol. Lett. 2008, 11, 499–515. [Google Scholar] [CrossRef]
  156. Potts, S.G.; Biesmeijer, J.C.; Kremen, C.; Neumann, P.; Schweiger, O.; Kunin, W.E. Global pollinator declines: Trends, impacts and drivers. Trends Ecol. Evol. 2010, 25, 345–353. [Google Scholar] [CrossRef]
  157. Roubik, D.W.; Roubik, D.W. Ecology and Natural History of Tropical Bees; Cambridge University Press: Cambridge, UK, 1992. [Google Scholar]
  158. Usha, V.; Devi, M.S. Effect of environmental factors on the foraging activities of major bee pollinators. J. Entomol. Zool. Stud. 2020, 8, 450–454. [Google Scholar]
  159. Singh, P.; Gargi, B.; Semwal, P. Global trends, knowledge mapping and visualization of current research on climate change and their impact on plant-pollinators interaction. Res. Sq. 2023. [Google Scholar] [CrossRef]
  160. Shi, Y.; Ren, Z.; Zhao, Y.; Wang, H. Effect of climate change on the distribution and phenology of plants, insect pollinators, and their interactions. Biodivers. Sci. 2021, 29, 495. [Google Scholar] [CrossRef]
  161. Javed, K. Climate Change Perspective in Pakistan. J. Politics Soc. 2023, 1, 10–17. [Google Scholar] [CrossRef]
  162. Fahad, S.; Wang, J. Climate change, vulnerability, and its impacts in rural Pakistan: A review. Environ. Sci. Pollut. Res. 2020, 27, 1334–1338. [Google Scholar] [CrossRef]
  163. Masson-Delmotte, V.; Zhai, P.; Pirani, A.; Connors, S.L.; Péan, C.; Berger, S.; Caud, N.; Chen, Y.; Goldfarb, L.; Gomis, M. Climate change 2021: The physical science basis. Contrib. Work. Group I Sixth Assess. Rep. Intergov. Panel Clim. Change 2021, 2, 2391. [Google Scholar]
  164. Gérard, M.; Cariou, B.; Henrion, M.; Descamps, C.; Baird, E. Exposure to elevated temperature during development affects bumblebee foraging behavior. Behav. Ecol. 2022, 33, 816–824. [Google Scholar] [CrossRef]
  165. Karbassioon, A.; Yearlsey, J.; Dirilgen, T.; Hodge, S.; Stout, J.C.; Stanley, D.A. Responses in honeybee and bumblebee activity to changes in weather conditions. Oecologia 2023, 201, 689–701. [Google Scholar] [CrossRef]
  166. Jaboor, S.K.; da Silva, C.R.B.; Kellermann, V. The effect of environmental temperature on bee activity at strawberry farms. Austral Ecol. 2022, 47, 1470–1479. [Google Scholar] [CrossRef]
  167. Beltran-Peña, A.; Rosa, L.; D’Odorico, P. Global food self-sufficiency in the 21st century under sustainable intensification of agriculture. Environ. Res. Lett. 2020, 15, 095004. [Google Scholar] [CrossRef]
  168. Kattel, G.R. Climate warming in the Himalayas threatens biodiversity, ecosystem functioning and ecosystem services in the 21st century: Is there a better solution? Biodivers. Conserv. 2022, 31, 2017–2044. [Google Scholar] [CrossRef]
  169. Thapa, K.; Subba, S.A.; Thapa, G.J.; Dewan, K.; Acharya, B.P.; Bohara, D.; Subedi, S.; Karki, M.T.; Gotame, B.; Paudel, G. Wildlife in climate refugia: Mammalian diversity, occupancy, and tiger distribution in the Western Himalayas, Nepal. Ecol. Evol. 2022, 12, e9600. [Google Scholar] [CrossRef] [PubMed]
  170. Pinsky, M.L.; Selden, R.L.; Kitchel, Z.J. Climate-driven shifts in marine species ranges: Scaling from organisms to communities. Annu. Rev. Mar. Sci. 2020, 12, 153–179. [Google Scholar] [CrossRef] [PubMed]
  171. Moore, J.W.; Schindler, D.E. Getting ahead of climate change for ecological adaptation and resilience. Science 2022, 376, 1421–1426. [Google Scholar] [CrossRef]
  172. Eckstein, D.; Künzel, V.; Schäfer, L. The Global Climate Risk Index 2021; Germanwatch: Bonn, Germany, 2021. [Google Scholar]
  173. Lynn, J.; Peeva, N. Communications in the IPCC’s Sixth Assessment Report cycle. Clim. Change 2021, 169, 18. [Google Scholar] [CrossRef]
  174. Gélvez-Zúñiga, I.; Beirão, M.; Novais, S.; Santiago, J.; Fernandes, G. Floral resource availability declines and florivory increases along an elevation gradient in a highly biodiverse community. Ann. Bot. 2024, 135, 199–210. [Google Scholar] [CrossRef]
  175. Pontarp, M.; Runemark, A.; Friberg, M.; Opedal, Ø.H.; Persson, A.S.; Wang, L.; Smith, H.G. Evolutionary plant–pollinator responses to anthropogenic land-use change: Impacts on ecosystem services. Biol. Rev. 2024, 99, 372–389. [Google Scholar] [CrossRef]
  176. Imran, M.; Sheikh, U.A.A.; Rahim, J.; Nasir, M. A Threat to Pollinators: Understanding the Impacts and Solutions: A Review. Planta Anim. 2023, 2, 79–87. [Google Scholar]
  177. Mehmood, Y.; Arshad, M.; Mahmood, N.; Kächele, H.; Kong, R. Occupational hazards, health costs, and pesticide handling practices among vegetable growers in Pakistan. Environ. Res. 2021, 200, 111340. [Google Scholar] [CrossRef]
  178. Rashid, S.; Rashid, W.; Tulcan, R.X.S.; Huang, H. Use, exposure, and environmental impacts of pesticides in Pakistan: A critical review. Environ. Sci. Pollut. Res. 2022, 29, 43675–43689. [Google Scholar] [CrossRef]
  179. Mei, T. Estimating the Causal Effects of Neonicotinoid Use on Wild Bee Abundance in the Mid-Atlantic United States. Ph.D. Thesis, Cornell University, Ithaca, NY, USA, 2023. [Google Scholar]
  180. Douglas, M.R.; Sponsler, D.B.; Lonsdorf, E.V.; Grozinger, C.M. County-level analysis reveals a rapidly shifting landscape of insecticide hazard to honey bees (Apis mellifera) on US farmland. Sci. Rep. 2020, 10, 797. [Google Scholar] [CrossRef] [PubMed]
Figure 1. Map of the study area and distribution of the A. dorsata occurrence used for habitat suitability modeling under current and future climatic conditions. The color gradient represents elevation, ranging from lowland areas (green) to higher elevations (light brown to dark brown).
Insects 16 00289 g001
Figure 2. Selected variables with less than 0.7 correlation used for model building. The variables shown in the plots include Bio1 (annual mean temperature), Bio4 (temperature seasonality, standard deviation × 100), Bio5 (maximum temperature of the warmest month), Bio8 (mean temperature of the wettest quarter), Bio10 (mean temperature of the warmest quarter), Bio12 (annual precipitation), Bio18 (precipitation of the warmest quarter), and Bio19 (precipitation of the coldest quarter). Each plot represents the geographic distribution of the respective variable across the study area, with the axes indicating latitude (y-axis) and longitude (x-axis).
Insects 16 00289 g002
Figure 3. Comparative evaluation of model performance metrics for different feature classes (L, LQ, LQH, and LQHP) across a range of regularization multipliers (rms).
Insects 16 00289 g003
Figure 4. Response curves showing the habitat suitability of A. dorsata across the range of selected environmental variables (Bio1: annual mean temperature, Bio4: temperature seasonality, Bio5: maximum temperature of the warmest month, Bio8: mean temperature of the wettest quarter, Bio10: mean temperature of the warmest quarter, Bio12: annual precipitation, Bio18: precipitation of the warmest quarter, and Bio19: precipitation of the coldest quarter). The red line indicates the modeled response of habitat suitability, while the shaded area reflects the overall trend of suitability distribution. The values on each plot show the percentage contribution and permutation importance based on the Jackknife test, providing insight into the significance of each variable in model construction.
Insects 16 00289 g004
Figure 5. Current habitat suitability map for Apis dorsata. The abbreviations indicate the provinces and regions of Pakistan: GB (Gilgit Baltistan), AJK (Azad Jammu and Kashmir), KP (Khyber Pakhtunkhwa), Punjab, Sindh and Balochistan.
Insects 16 00289 g005
Figure 6. Projected distribution maps of A. dorsata habitat suitability in Pakistan under CNRM-CM6-1 model for SSP245 and SSP585 scenarios in mid-century (2050) and late-century (2070). Maps indicate shifts in suitable habitats with varying degrees of climate impact.
Insects 16 00289 g006
Figure 7. Projected distribution maps of A. dorsata habitat suitability in Pakistan under EPI-ESM1-2-HR-1 model for SSP245 and SSP585 scenarios in mid-century (2050) and late-century (2070). Maps indicate shifts in suitable habitats with varying degrees of climate impact.
Insects 16 00289 g007
Figure 8. Percentage changes in habitat suitability categories for A. dorsata under future climate scenarios based on projections from CNRM-CM6-1 and EPI-ESM1-2-HR-1 models for SSP245 and SSP585 during mid-century (2050) and late-century (2070) projections.
Insects 16 00289 g008
Figure 9. Transitions in A. dorsata habitat suitability from current conditions to future projections under mid-century (2050) and late-century (2070) climate scenarios (SSP245 and SSP585). Unsuitable (US), less suitable (LS), moderately suitable (MS), and highly suitable (HS).
Insects 16 00289 g009
Table 1. Current and future habitat suitability breakdowns and projections for A. dorsata under different climate scenarios.
Future Projection ScenarioHabitat CategoriesTotal
ModelYearUnsuitable (km2)Less Suitable (km2)Moderately Suitable (km2)Highly Suitable (km2)
Current629,81751,312150,97549,792881,896
CNRM-CM6-12050SSP245708,11931,569103,13539,073881,896
SSP585725,57927,19693,15635,965881,896
2070SSP245741,44918,16286,27436,011881,896
SSP585792,17714,28545,69129,743881,896
EPI-ESM1-2-HR-12050SSP245713,59843,87296,56127,865881,896
SSP585737,89534,91686,75622,329881,896
2070SSP245741,03529,59386,72124,547881,896
SSP585802,16914,32554,75610,646881,896
Table 2. Percentage changes in habitat categories for A. dorsata under different climate models (CNRM-CM6-1 and EPI-ESM1-2-HR-1) and scenarios (SSP245 and SSP585) for mid-century (2050) and late-century (2070) projections.
Future ProjectionPeriodScenarioHabitat Categories
ModelUSLSMSHS
Current629,81751,312150,97549,792
CNRM-CM6-12050SSP245% Change12−38−32−22
SSP585% Change15−47−38−28
2070SSP245% Change18−65−43−28
SSP585% Change26−72−70−40
EPI-ESM1-2-HR-12050SSP245% Change13−14−36−44
SSP585% Change17−32−43−55
2070SSP245% Change18−42−43−51
SSP585% Change27−72−64−79
Positive values indicate an increase in the unsuitable habitat, while negative values show a decrease in less suitable, moderately suitable, and highly suitable habitats compared to the current distribution. US: Unsuitable, LS: less suitable, MS: moderately suitable, and HS: highly suitable.
Disclaimer/Publisher’s Note: The statements, opinions and data contained in all publications are solely those of the individual author(s) and contributor(s) and not of MDPI and/or the editor(s). MDPI and/or the editor(s) disclaim responsibility for any injury to people or property resulting from any ideas, methods, instructions or products referred to in the content.

