Article

Structural and Functional Insights into Methuselah Genes of Plutella xylostella (Lepidoptera: Plutellidae): Evolutionary Adaptations and Their Responses to Chlorantraniliprole

1
Institute of Plant Protection, Guangdong Academy of Agricultural Sciences, Guangdong Provincial Key Laboratory of High Technology for Plant Protection, Key Laboratory of Green Prevention and Control on Fruits and Vegetables in South China Ministry of Agriculture and Rural Affairs, Guangzhou 510640, China
2
Guangzhou Molan Agricultural Technology Co., Ltd., Guangzhou 510000, China
3
Department of Chemistry, The Women University Multan, Multan 60000, Pakistan
4
School of Biological Sciences, The University of Queensland, Brisbane 4072, Australia
5
Shandong Engineering Research Center for Enviroment Friendly Agricultural Pest Management, College of Plant Health and Medicine, Qingdao Agricultural University, Qingdao 266109, China
*
Author to whom correspondence should be addressed.
These authors contributed equally to this work.
Insects 2025, 16(11), 1092; https://doi.org/10.3390/insects16111092
Submission received: 4 August 2025 / Revised: 16 October 2025 / Accepted: 20 October 2025 / Published: 24 October 2025
(This article belongs to the Section Insect Molecular Biology and Genomics)

Simple Summary

In this study, the role of Methuselah (Mth) genes, a G protein coupled receptor (GPCR) subfamily, in the diamondback moth (Plutella xylostella) in insecticide chlorantraniliprole (CAP) resistance was investigated. Genome-wide profiling and phylogenetic classification discovered eight Pxmth genes, of which Pxmth2 was overexpressed in CAP-resistant strains. Structural modeling confirmed the typical GPCR characteristics of Pxmth2. Functional assays showed that Pxmth2 silencing reduced CAP resistance and suppressed detoxification genes, while overexpression of the gene in transgenic Drosophila melanogaster increased CAP resistance. This suggests that Pxmth2 could play a role in insecticide resistance and could be a candidate for future pest control.

Abstract

G protein-coupled receptors (GPCRs) are considered the largest and most variable family of transmembrane receptors regulating physiological processes such as toxicological responses and insecticide resistance development. The present study investigated the responses of Methuselah (Mth), belonging to GPCR family B in the Diamondback Moth (DBM), Plutella xylostella, to chlorantraniliprole (CAP). Genome-wide identification and phylogenetic analysis of Pxmth genes revealed their evolutionary relationships and functional classifications. Expression profiling demonstrated significant overexpression of Pxmth2 in the CAP-resistant strain. Additionally, the tertiary and secondary structures of Pxmth2 were characterized, providing insights into its functional role. Silencing Pxmth2 via RNA interference (RNAi) reduced resistance of DBM to CAP and suppressed downstream stress-associated genes (CYP6B6, CYP6B7, CYP6BF1), increasing susceptibility to the insecticide. The function of Pxmth2 was further explored using a transgenic line of Drosophila melanogaster engineered to overexpress the gene; flies overexpressing Pxmth2 exhibited a significantly increased resistance to CAP compared to controls. These findings indicate that Pxmth2 contributes to CAP resistance in DBM and highlights potential molecular targets for improving pest management strategies.

1. Introduction

As a superfamily of membrane-bound proteins, G protein-coupled receptors (GPCRs) are distinguished by their seven-transmembrane (7TM) helical structure. They are among the most targeted molecules in pharmacology because of their various and significant biological roles; about 30–50% of all marketed medications act on these receptors [1,2,3]. In insects, GPCRs affect growth, reproduction, nutrition and other physiological processes [4]. These receptors are essential for converting ambient and extracellular cues into intracellular responses. Phospholipase C, cyclic nucleotide-gated channels, protein kinase A, cyclic adenosine monophosphate, adenylyl cyclase, diacylglycerol, and inositol triphosphate are among the downstream effectors that are activated by coupling with heterotrimeric G-proteins [5,6,7,8,9].
GPCRs in insects have become appealing targets for developing new insecticides, as they mediate key biological and physiological processes such as feeding behavior, development, and stress response that are essential for survival and adaptability [4], including insecticide resistance. Genes linked to GPCRs are overexpressed in insecticide resistant insect species [10,11]. The study of novel molecular targets, such as GPCRs, is essential for efficient pest control techniques as resistance to traditional pesticides increases [12].
The Methuselah (Mth) GPCR subfamily, a distinct group within the secretin-like GPCR family (family B) was initially identified in D. melanogaster. Mth genes are associated with extended lifespan and enhanced resistance to heat, oxidative stress, and starvation in hypomorphic mutants despite null mutants exhibiting pre-adult lethality highlighting a crucial contribution to development [13,14,15]. Longevity and stress tolerance imparted by Mth is mainly mediated via the rapamycin signaling pathway [16]. The Toll and immunodeficiency signaling pathways may also be directly involved in the functioning of Mth-like gene (Tcmthl1) with respect to stress and lifespan in Tribolium castaneum [17]. In Dastarcus helophoroides, three Mth-like genes were differentially transcribed in a variety of tissues and at different phases of development, implying that these genes participate in development. Further, their expression in adults was induced by heat, oxidative stress, starvation, and aging, suggesting that they play an important role in aging, reproduction and defense mechanisms against environmental stressors [18].
The diamondback moth (DBM), Plutella xylostella (Lepidoptera: Plutellidae), is a major global pest causing substantial annual economic losses in cabbage fields [19]. Its capacity to develop resistance to all pesticide classes has made management increasingly challenging [20]. Although several studies have investigated GPCRs in P. xylostella [21,22,23], a limited body of research has addressed the role of the Mth subfamily in stress regulation in this pest, despite its recognized importance in other insects.
Chlorantraniliprole (CAP) is an anthranilic diamide insecticide that targets the ryanodine receptor (RyR) in insect muscle cells and is widely used against lepidopteran pests, including DBM. However, CAP resistance has been reported in DBM populations from several countries [24], mainly due to enhanced detoxification through transport proteins and enzymes such as CYP450s, CarEs, and GSTs. Despite cases of resistance, CAP remains effective, highlighting the need for strategies to delay resistance increasing and preserve its long-term efficacy [25].
Accordingly, the present study aims to evaluate the evolutionary relationships and structural characteristics of potential Mth gene candidates using bioinformatic methods and phylogenetic analysis. The secondary and tertiary structures of one candidate, Pxmth2, was predicted, the gene’s response to CAP exposure assessed, and its developmental expression pattern analyzed. Moreover, the potential role of Pxmth2 in lifespan regulation and pesticide resistance is examined using functional genomics and reverse genetics techniques. It is expected that these findings will enhance our understanding of Mth genes in insects and offer novel strategies for addressing the serious pest issues posed by P. xylostella.
The Methuselah genes PxMth2 plays a central role in regulating stress tolerance and CAP resistance in P. xylostella, with its expression being developmentally regulated and by responding to pesticide exposure. Altering PxMth2 expression is expected to affect downstream detoxification pathways, thereby influencing the insect’s survival and adaptability.

2. Material and Methods

2.1. Insects

A pesticide-susceptible P. xylostella strain gathered in Guangdong, China (2002) was maintained pesticide-free in the laboratory. In 2023, a CAP-resistant strain was isolated from Huizhou (Guangdong) cabbage fields (E 113.9808°, N 23.127062°), where intensive and long-term use of CAP had imposed strong field resistance. After collection, the colony was reared on Brassica rapa in controlled conditions (a temperature of 25 degrees Celsius, relative humidity of 65%, and a 16 h light: 8 h dark cycle) for three generations without additional insecticide exposure to ensure stabilization. The larvae were fed B. rapa, while the adults were given a 10% honey solution, with no pesticide exposure.

2.2. Leaf-Dip Bioassays

To determine the LC50, a preliminary bioassay was first performed to identify doses producing approximately 10% and 90% mortality (27 and 85 mg/L, respectively). Based on these results, three intermediate concentrations were chosen using geometric (logarithmic) sequence according to [26]. yielding five test doses: 27, 34, 47, 63, and 85 mg·L−1. This spacing approximates a constant ratio between successive concentrations (mean ratio ≈ 1.33), as recommended for probit analysis. The toxicity of CAP was evaluated using a standard leaf-dip bioassay with cauliflower leaves [27]. Commercial formulations were serially diluted in distilled water containing 0.1% Triton X-100 (v/v). Leaf discs (5 cm diameter) were dipped into each concentration (27, 34, 47, 63, and 85 mg/L for the HZ-R strain) for 30 s, air-dried at room temperature for 1 h, and individually placed in 7 cm plastic Petri dishes. Controls consisted of leaf discs dipped in distilled water with 0.1% Triton X-100. Each concentration included three replicates of ten third-instar larvae of the same age. Mortality was recorded after 48 h; larvae were considered dead if they failed to move in a coordinated manner when touched with a brush. Dose–response data were analyzed using Probit regression on log-transformed concentrations to estimate LC50 values and their 95% confidence intervals. The PoloPlus software (Version 2.0) was used for model fitting. The LC50 for pesticide and each strain was estimated from experiments with <10% control mortality.

2.3. Insecticides

CAP (50 g L−1 SC) used in this experiment was obtained from DuPont Agricultural Chemicals Company (Ltd., Wilmington, DE, USA).

2.4. Documentation of Mth Genes in the P. xylostella Genome

Mth genes were identified by a BLASTP search against the P. xylostella genome (https://www.ncbi.nlm.nih.gov/datasets/genome/GCF_932276165.1/, 25 March 2025) using reference sequences from D. melanogaster, Bombyx mori, and Musca domestica. Candidate genes containing 7TM domains were verified by TMHMM, version 2.0 (http://www.cbs.dtu.dk/services/TMHMM/, accessed on 25 March 2025) [28]. In addition, likely subcellular localization was identified using WoLF PSORT (http://www.genscript.com/psort/wolf_psort.html, accessed on 25 March 2025) based on available data [29], and nuclear localization signals were identified through the NLSdb database (https://nls-mapper.iab.keio.ac.jp/cgi-bin/NLS_Mapper_form.cgi, accessed on 25 March 2025). Further, molecular weight, isoelectric points (pI), and GRAVY scores were computed by ExPASy (https://web.expasy.org/protparam/, accessed on 25 March 2025) (Table 1).

2.5. Phylogenetic Analysis and Chromosomal Mapping

First, a phylogenetic tree was constructed containing Mth protein sequences from P. xylostella, D. melanogaster, and B. mori. Then the deduced GPCR protein sequences were aligned using the default parameters in Clustal X2.0 for multiple sequence alignment. Phylogenetic trees were generated with MEGA 5.0 using the neighbor-joining technique. Further, pairwise gap elimination was executed under the bootstrap analysis of 1000 replicates as specified by [30]. The chromosomal sites of GPCRs were identified using TBtools v1.120 (https://github.com/CJ-Chen/TBtools, accessed on 1 May 2025) [31]. Finally, gene mapping of chromosomes was performed using MG2C v2.1 (http://mg2c.iask.in/mg2c%5Fv2.1/, accessed on 1 May 2025) [32].

2.6. Gene Structure and Motif Analysis

The Gene Structure Display Server (http://gsds.cbi.pku.edu.cn/, accessed on 1 May 2025) was used to examine the intron/exon organization of genomic DNA and P. xylostella complementary DNA (cDNA) sequences to investigate the structure and distribution of Pxmth genes [33]. A visual summary of gene structures was offered by this analysis. In addition, domains and conserved motifs within Pxmth candidate amino acid sequences were estimated by MEME (https://github.com/cinquin/MEME?utm_source=chatgpt.com, accessed on 1 May 2025) based on previous research [34]. MEME parameters were adjusted to allow a maximum of 10 motif repeats, with preferred motif lengths ranging from six to two hundred amino acids. The aim of this strategy was to find conserved elements that could give insight into the possible roles of the Pxmth genes.

2.7. Protein Structure Analysis

The homology models of Pxmth2 domains were created by applying SWISS-MODEL (https://swissmodel.expasy.org, accessed on 16 May 2025) and AlphaFold, version 2. The TMHMM-2.0 server predicted membrane localization.

2.7.1. Transmembrane Domain Prediction

The TM regions of Pxmth were predicted by the TMHMM-2 server (https://services.healthtech.dtu.dk/service.php?TMHMM-2.0, accessed on 16 May 2025). The input protein sequence was retrieved from the UniProt database and analyzed using TMHMM (https://services.healthtech.dtu.dk/service.php?TMHMM-2.0, accessed on 16 May 2025) to identify TM helices (TMHs). The results, visualized as a TM topology plot, confirmed the presence of multiple TM domains in the protein structure.

2.7.2. Ramachandran Plot Analysis

To study the stereochemistry of the protein structure, a Ramachandran plot was generated using PROCHECK (https://www.ebi.ac.uk/thornton-srv/software/PROCHECK/, accessed on 20 May 2025). The protein’s three-dimensional structure, predicted or experimentally determined, was subjected to PROCHECK analysis to assess backbone dihedral angles (Φ and Ψ). The plot categorizes residues into favored, allowed, and outlier regions, helping evaluate the protein’s structural integrity. Residues in the favored regions indicated well-folded regions of the protein, while outliers were flagged for potential structural issues.

2.8. Multiple Sequence Alignment and Phylogenetic Analysis

The genes and amino acid sequences related to the Pxmth2 gene were obtained from a transcriptome database and the NCBI database (http://www.ncbi.nlm.nih.gov/BLAST, accessed on 30 May 2025), respectively. Sequence alignments were performed with Clustal Omega v1.2.4 (https://www.ebi.ac.uk/Tools/msa/clustalo/, accessed on 30 May 2025), and aligned sequences were annotated with ESPript 3.0 to visualize conserved residues and secondary structure elements in the form of α-helices and β-sheets. The phylogenetic tree was developed by the maximum likelihood technique of MEGA-X with 1000 bootstrapped replicates. The resulting tree was visualized and annotated, along with bootstrap values for major nodes. Scale bars show evolutionary distance in terms of substitutions per site.

2.9. Signal Peptide Prediction

Signal peptides were searched with the aid of SignalP-6.0 [35], and ProP1.0 software [36] was utilized for predicting residues of potential cleavage sites within the preproteins and to perform a general preprotein convertase prediction.

2.10. Expression Profiling of Mth Genes Under CAP Exposure

Eight gene-specific primers were designed to quantify the expression of Mth genes in CAP-susceptible and -resistant P. xylostella strains (see Table S1 Supplementary Data), Invitrogen Trading Company, Ltd., Shanghai, China). Bioassays determined LC30 (47 mg/L) and LC50 (63 mg/L) values for CAP-resistant strains, which were applied to 100 larvae per treatment. Control groups were treated with water and TritonX-100 solutions. Samples were collected 6, 24, and 48 h post-treatment. Total RNA was extracted from pooled samples of five larvae per treatment using the EASYspin RNA isolation kit (Biomed, Beijing, China) based on the manufacturer’s instructions. First-strand cDNA synthesis was conducted by employing e M-MLV reverse transcriptase (Takara Bio Inc., Shiga, Japan). Quantitative polymerase chain reaction (qPCR) was performed in triplicate with a Rotor-Gene thermal cycler (Bio-Rad Laboratories, Hercules, CA, USA) using reactions made of 1 µL of cDNA, 10 µL of green qPCR SuperMix, 8.2 µL of ddH2O in a 20 µL total volume, and 0.4 µL of each primer (0.2 µM). Primer specificity was checked by melting curve analysis, confirming single-amplicon generation. The housekeeping gene ribosomal protein RPL32 (GenBank: AB180441) was utilized as a reference, and relative transcript levels were determined by the 2^−∆∆CT technique.

2.11. Functional Verification of Pxmth2 by RNA Interference (RNAi)

Gene-specific primers targeting distinct segments of the Pxmth2 gene (GenBank accession number XM038115253.2) were designed using genomic P. xylostella data and the SnapDragon double-stranded RNA (dsRNA) design tool (accessed 25 September 2023). The cDNA synthesized from DBM larval RNA was employed for the amplification of Pxmth2 segments with forward and reverse primers encompassing the T7 polymerase promoter sequence at their 5′ ends (forward primer 5′-TAATACGACTCACTATAGGGCAGTCGAGCTTCTTCTGGCT-3′ and reverse primer 5′-TAATACGACTCACTATAGGGTAGAGGCCGTATCGTTGCTT-3′). Amplification was performed by initial denaturation at 95 °C for 3 min, 35 cycles of denaturation at 95 °C, annealing at 60 °C, and extension at 72 °C for 45 s each, and final extension at 72 °C for 5 min. The purified amplicons by Gel Extraction Mini Kit (TransGen Biotech, Beijing, China), served as templates for in vitro transcription by applying the RiboMAX T7 system (Promega, Madison, WI, USA), according to the instructions of the manufacturer. The synthesized dsRNA targeting Pxmth2 was treated with DNase I to remove residual DNA templates, precipitated with ethanol, and dissolved in RNase-free water. Third-instar larvae were injected with 300 ng/larva dsRNA targeting the Pxmth2 gene using a microinjector (Sarasota, FL, USA), into the hemocoel between the second and third legs on the thorax. A dsRNA targeting green fluorescent protein (GFP, GenBank accession: MN623123.1) was synthesized as a control. After dsRNA injection, larval survival was monitored at 24 h post-injection. Only larvae that survived the injection and showed normal feeding behavior were included in subsequent gene expression and bioassay analyses. Statistical analysis of silencing efficiency was conducted using three independent biological replicates, and the detailed results are provided in (Table S1, Supplementary Data). To determine transcript levels a qPCR was performed 24h after the injection. Total RNA was prepared from the TRIzol® reagent (Invitrogen, Carlsbad, CA, USA), and its quantity and quality were measured by a NanoDrop™ spectrophotometer at OD260/280 ratios and agarose gel electrophoresis (Thermo Scientific, Wilmington, DE, USA). First-strand cDNA was synthesized using the cDNA Synthesis SuperMix kit (Transgen) and the TransScript One-Step gDNA Removal. qPCR reactions were conducted under the initial denaturation at 94 °C for 30 s, followed by 40 cycles of 94 °C for 5 s and 60 °C for 30 s (primers are provided in Table S1, Supplementary Data). The relative expression of genes was normalized against the reference gene ribosomal protein RPL32, and the comparative expression was quantified by the 2^−∆∆Ct method. Leaf-dip bioassays were conducted 24 h post-injection to investigate the function of Pxmth2 in CAP susceptibility with LC50. Mortality due to mechanical injury from injection was excluded from the statistical analysis to ensure that the observed effects were specifically due to RNAi gene silencing. Each treatment group contained three biological replicates replicate with 10 larvae per replicate (total 30 larvae per treatment), in which dsRNA targeting GFP (dsGFP) was utilized as a control. Mortality was recorded after 48 h. The mortality data were analyzed by probit analysis using PoloPlus software (LeOra Software, version 1, Parma, MO, USA) to estimate the LC50 value.

2.12. Generation of UAS-Pxmth2 Transgenic Drosophila

To determine whether Pxmth2 regulates resistance to CAP, transgenic D. melanogaster strains overexpressing Pxmth2 were generated by Fungene Biotech (Qidong, China). Overexpression was confirmed by qPCR, and functional effects were assessed through adult mortality bioassays. CAP toxicity was tested following the protocol of [37]. Briefly, CAP was serially diluted into six concentrations (1, 0.5, 0.25, 0.125, 0.062, 0.031, 0.0156 units mg/L) using 10% honey solution as the solvent. Groups of 20 female flies were placed in each vial, with three replicates per concentration. A control group (w1118) was treated with 10% honey solution without CAP. Mortality was recorded after 48 h, with all ataxic flies counted as dead. All flies were maintained at a temperature of 25 degrees Celsius, relative humidity of 65%, and a 12 h light: 12 h dark cycle.

2.13. Statistical Analysis

Mortality data from leaf-dip bioassays were analyzed using PoloPlus software to calculate LC30 and LC50 values with 95% confidence intervals based on probit analysis. For RT-qPCR experiments, relative gene expression was calculated using the 2^−ΔΔCt method. Differences in gene expression between treatments or strains were evaluated using Student’s t-test (p < 0.05). Data visualization and statistical comparisons were performed using GraphPad Prism (version 9.0).

3. Results

3.1. Identification and Distribution of Mth-Encoding Genes in the P. xylostella Genome

To detect Mth genes in the P. xylostella genome, a sequence alignment was conducted using BLAST v1.2.4 (https://www.ebi.ac.uk/Tools/msa/clustalo/, accessed on 30 May 2025), against known Mth genes from B. mori, D. melanogaster, and Musca domestica. B. mori was selected because it is a well-studied model species in Lepidoptera with comprehensive genomic data available, while D. melanogaster and M. domestica were included due to the extensive functional characterization of Mth gene families in these dipteran insects. Eight potential Mth genes were identified in the P. xylostella genome by matching with the reference sequences. The NCBI database was then used to download available basic information about the Mth genes including the protein, coding, and genomic sequences, gene name, chromosome position, chromosomal number, protein length, molecular weight, GRAVY, exon/intron number, and pI value (Table 1). The calculated molecular weights of the Mth potential candidates were in the range of 45.86 Da (Pxmth3, 407aa) for the shortest to 79.82 Da (Pxmth4, 715aa) for the longest protein sequence. The determined pI of the Mth candidates ranged from 6.23 (Pxmth1) to 8.76 (Pxmth7).

3.2. Characterization of Pxmth in P. xylostella

A full-length Mth gene (LOC119693055) was detected in P. xylostella, with an open reading frame of 554 bp encoding a total of 184 amino acids. The molecular mass and the pI were predicted as 57.10 kDa and 8.05, respectively. The structure of the Pxmth2 homology model encompasses the 7TM domain, the extracellular domain (ectodomain), and the intracellular domain (Figure 1A).
The A0A811WXK3.1 template was employed to model the ectodomain of the Mth gene. Model quality for the ectodomain was reported by the I-TASSER server as a confidence score (C-score) of 0.78, and the TM score was 0.58 ± 0.50. The crystal structure template for modeling the intracellular domain and the Mth2 gene TM domain contained class B GPCRs. Mth, similar to secretin receptor family members, has a large-scale N-terminal ectodomain, which probably constitutes the ligand binding site (Figure 1A). Model superposition and sequence alignment demonstrated a total of 10 conserved cysteine residues located in the ectodomain of Mth and Mth-like proteins. Conserved residues, including hydrophobic regions and charged residues, were observed in ligand-binding domains, particularly around the β-sheets and α-helices critical for receptor function. The PxMth2 sequence exhibited unique features, including an extended hydrophobic region and slight variations in the conserved ligand-binding motifs, which could have functional implications. Structural annotations identified secondary elements, such as α1, α2, and β1, consistent across species, supporting the evolutionary conservation of the GPCR framework (Figure 2).
The TMHMM indicated that the protein PxMth2 (XP_037971181.2), which has a total length of 514 amino acids, contains seven TMHs at positions 202–224, 231–253, 268–290, 313–335, 363–385, 417–439, and 444–466. The N-terminal (1–201) and the spaces between TMHs were the main locations for regions outside the membrane, whereas positions 225–230, 291–312, 336–362, and 386–416 were the locations for regions within. In accordance with the properties of TM proteins, the general structure indicated that this protein is membrane-bound and has alternating intracellular and extracellular domains (Figure 1C).
The Ramachandran plot for the protein structure revealed that the majority of residues fall within the energetically preferred regions, which are depicted by the darkest green areas. These regions are related to the common α\alphaα-helical and β\betaβ-sheet conformations. A few residues are located in allowed regions (light green), and very few outliers were observed, including one prominently marked in red, which represents a residue with unusual dihedral angles. The distribution of angles suggests that the protein adopts a well-defined secondary structure with minimal steric clashes or deviations (Figure 1B).

3.3. Phylogenetic and Domain Analysis

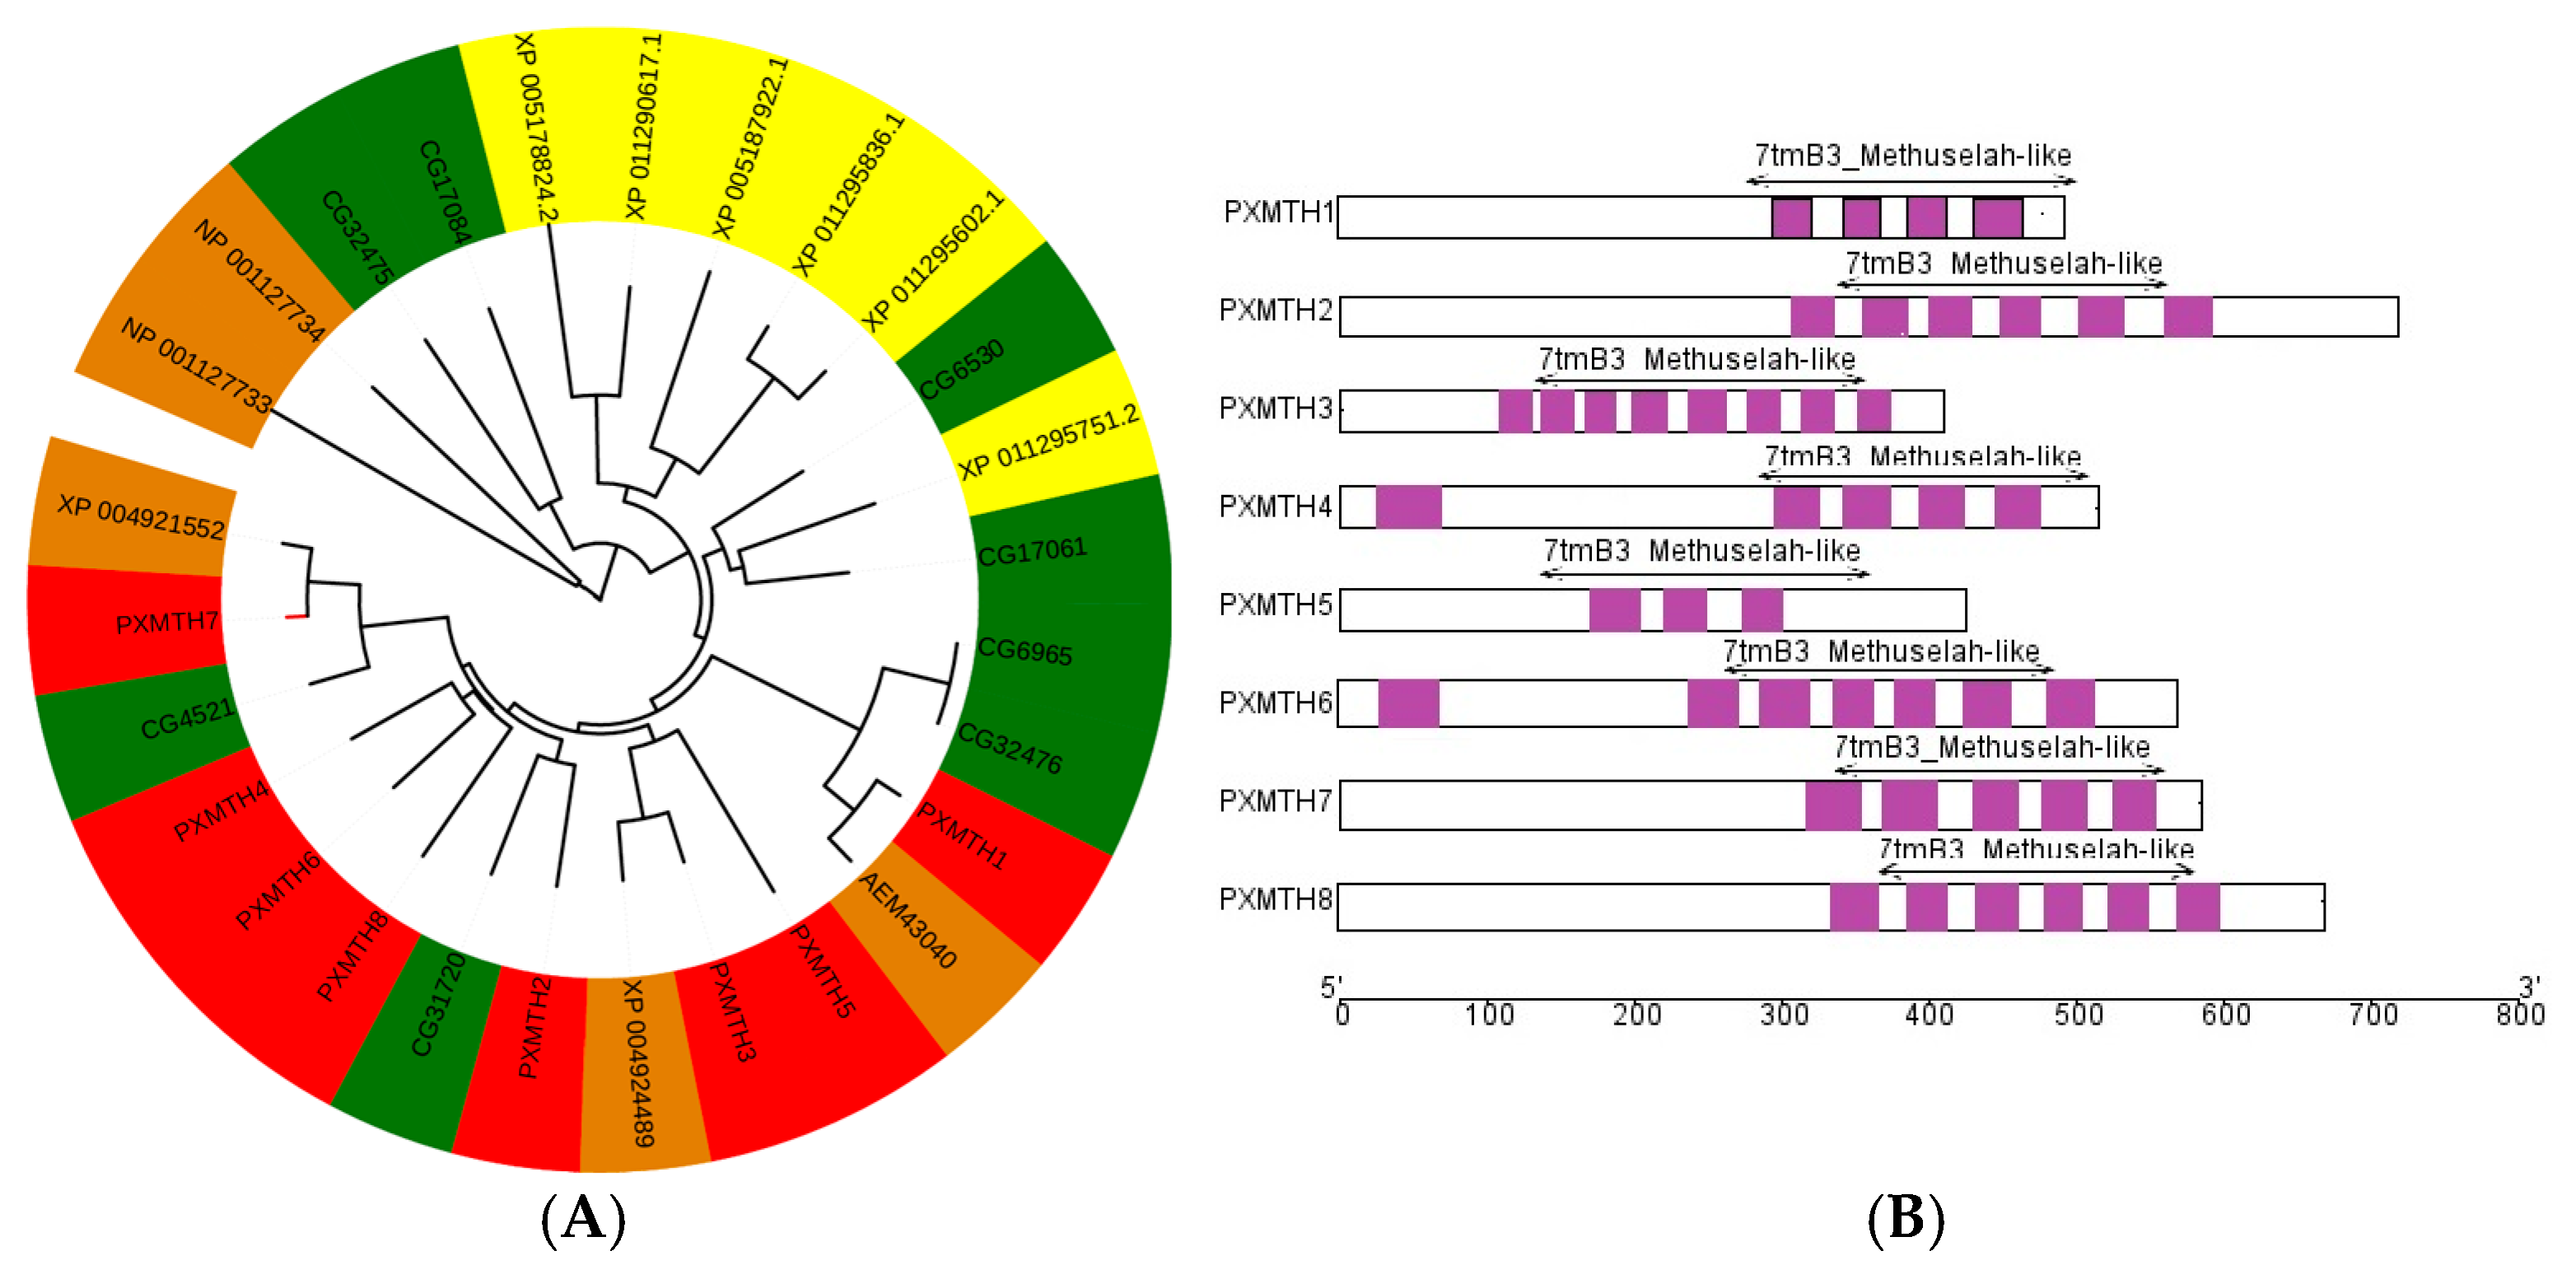
A phylogenetic tree based on multiple sequence alignment was developed to study the evolutionary and phylogenetic connections among the proteins of P. xylostella, B. mori, and D. melanogaster (Figure 3A). The majority of Mth genes had orthologous connections with proteins in B. mori and D. melanogaster, but there was no direct linkage with M. domestica. Additionally, there were multiple cases of Mth gene deletion and duplication in B. mori and D. melanogaster. The structural analysis demonstrated that most Mth candidates in P. xylostella possess multiple TM domains, implying that Mths in P. xylostella are highly conserved (Figure 3B).

3.4. Gene Structure and Conserved Motif Analysis

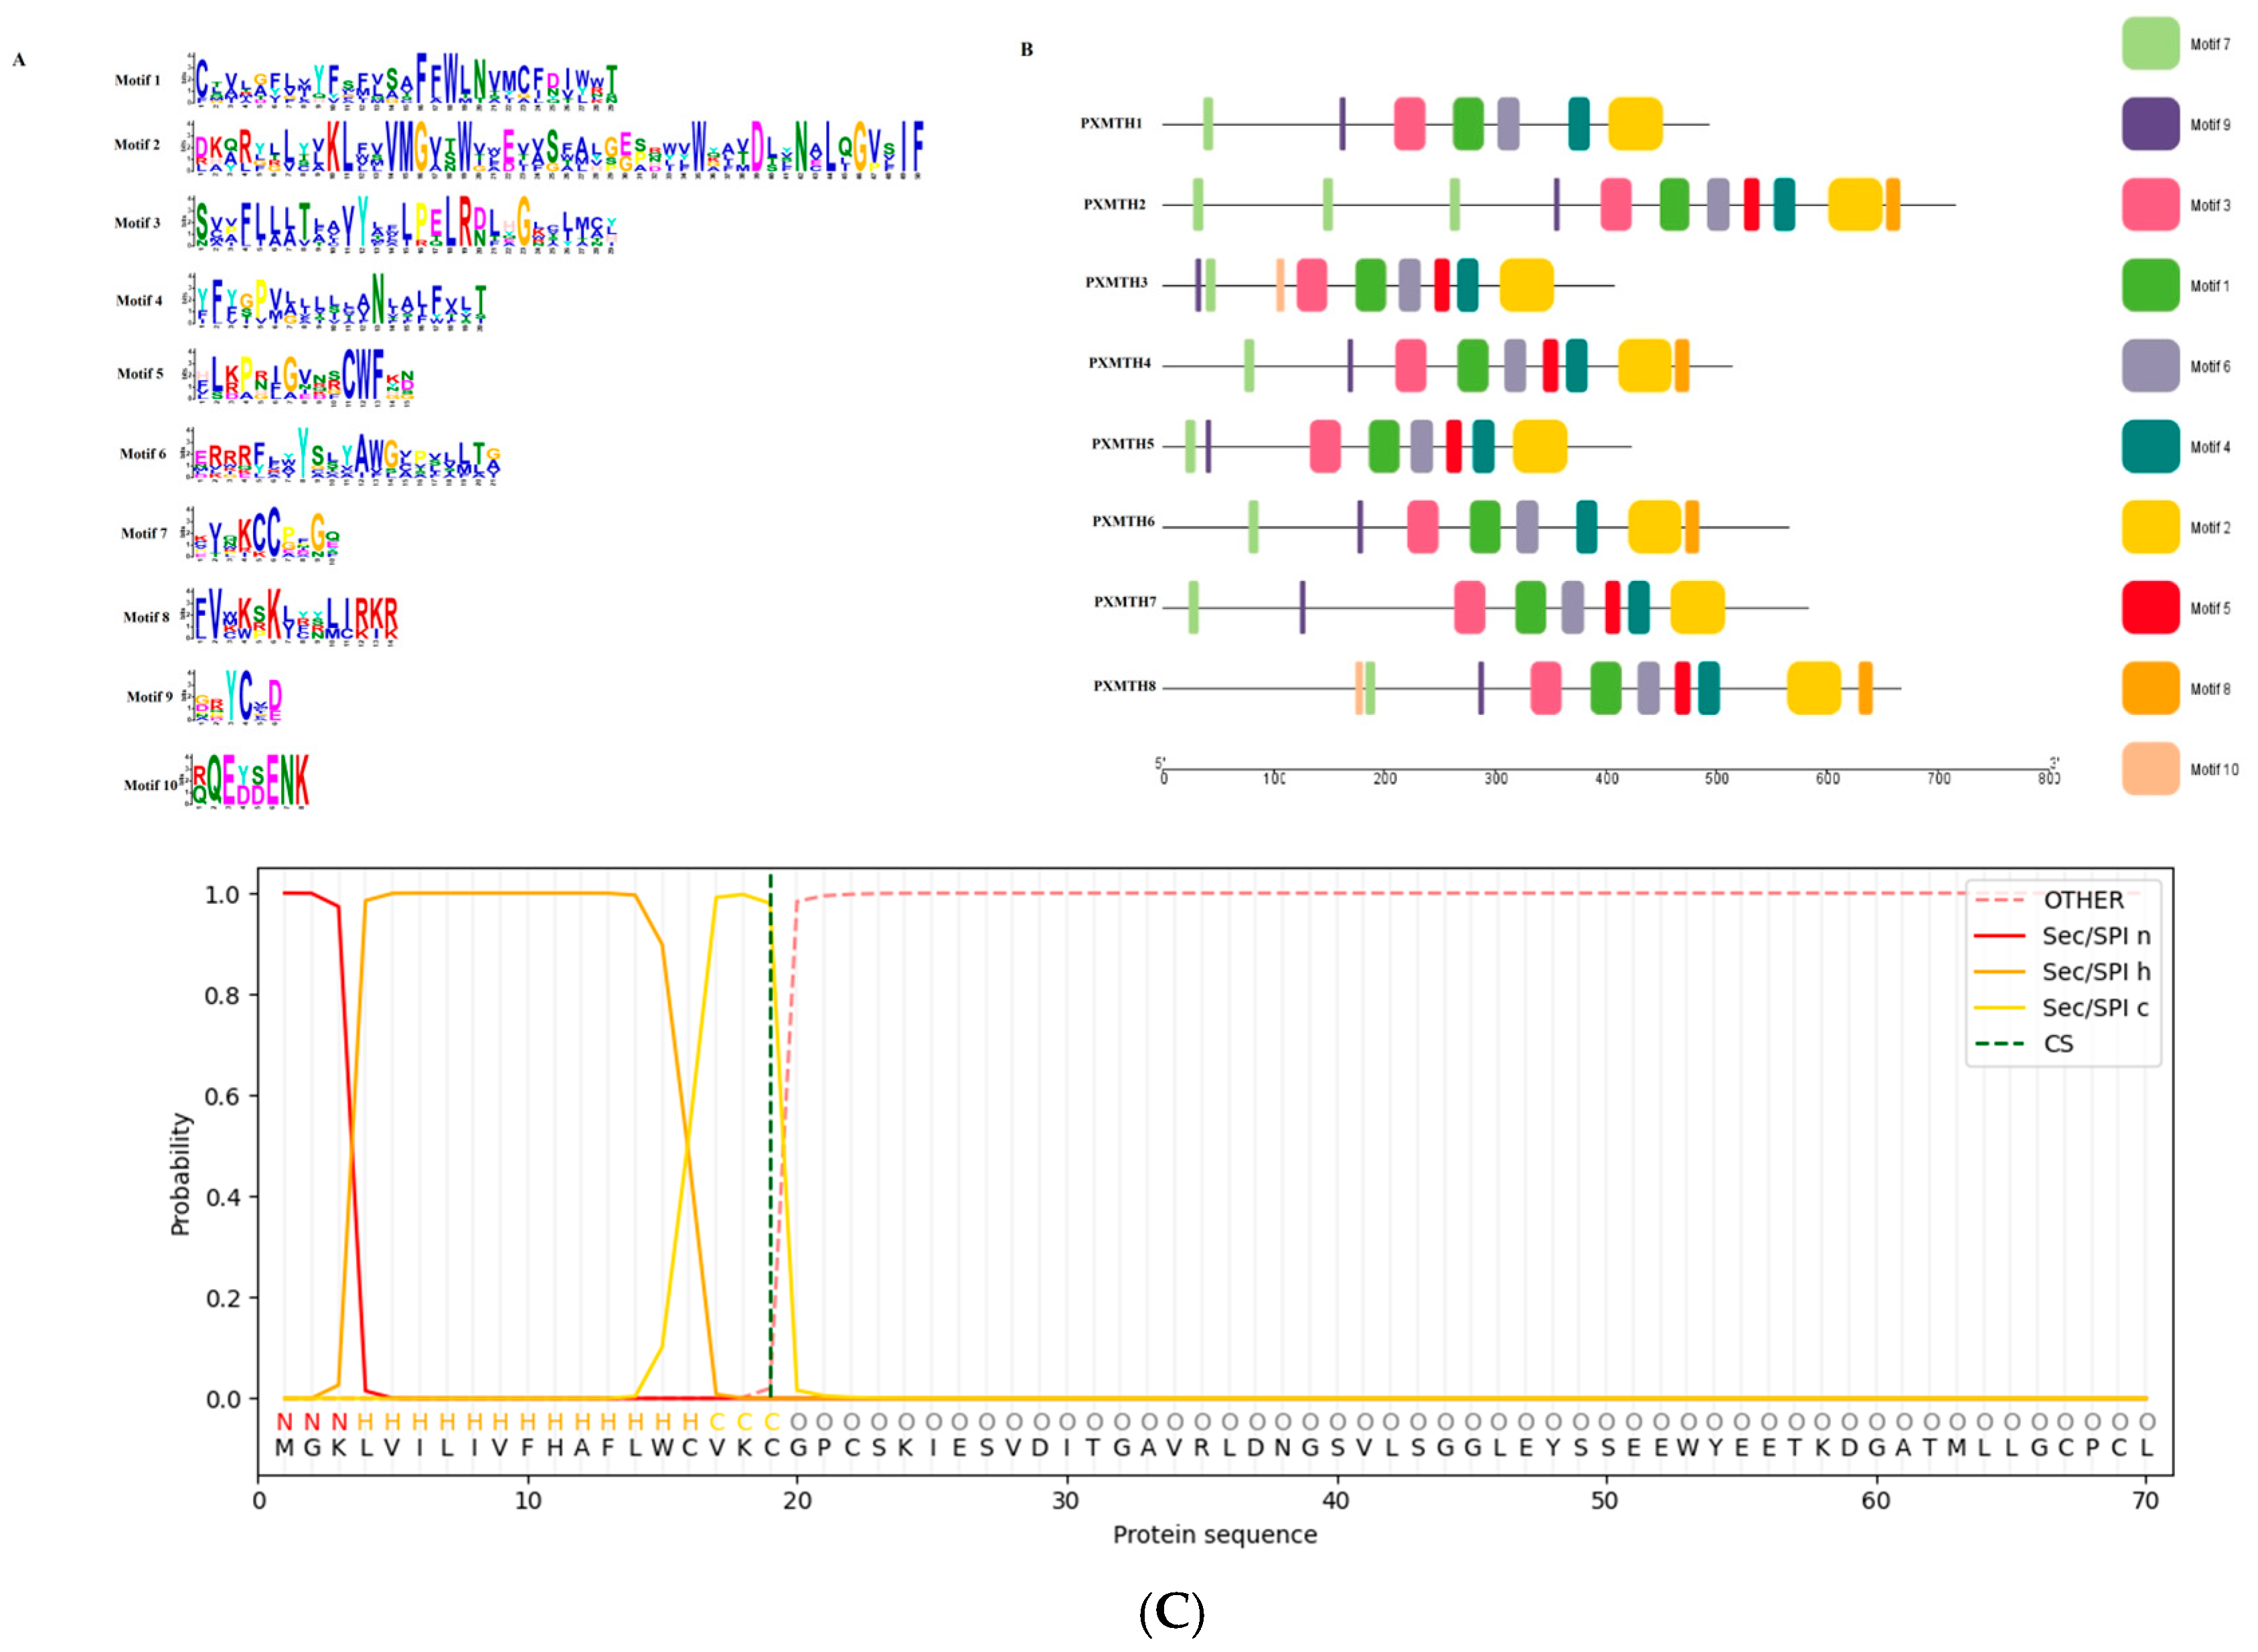
The MEME tool was employed to assess the motifs in the eight Mth proteins, and the results confirmed that there were generally 10 conserved motifs. Three highly conserved sequence motifs were found in the majority of Mth proteins and subsets of Mth proteins shared more conserved motifs. These findings show that Mth proteins are highly conserved (Figure 4A,B); nonetheless, this subfamily may have additional, as-yet-unidentified activities that require further research.
SignalP 6.0 predictions further validated the presence of a signal peptide within the N-terminal region of the protein. The cleavage site was predicted at position 20, as indicated by the green dashed line, and the Sec/SPI (Signal Peptide) probabilities depicted a clear transition from the n-region (red) to the h-region (yellow) and finally to the c-region (orange). This indicates that the protein undergoes typical signal peptide processing and is subsequently processed as a membrane-bound receptor. The presence of a functional signal peptide aligns with its role as a membrane protein involved in environmental sensing or ligand interaction (Figure 4C).
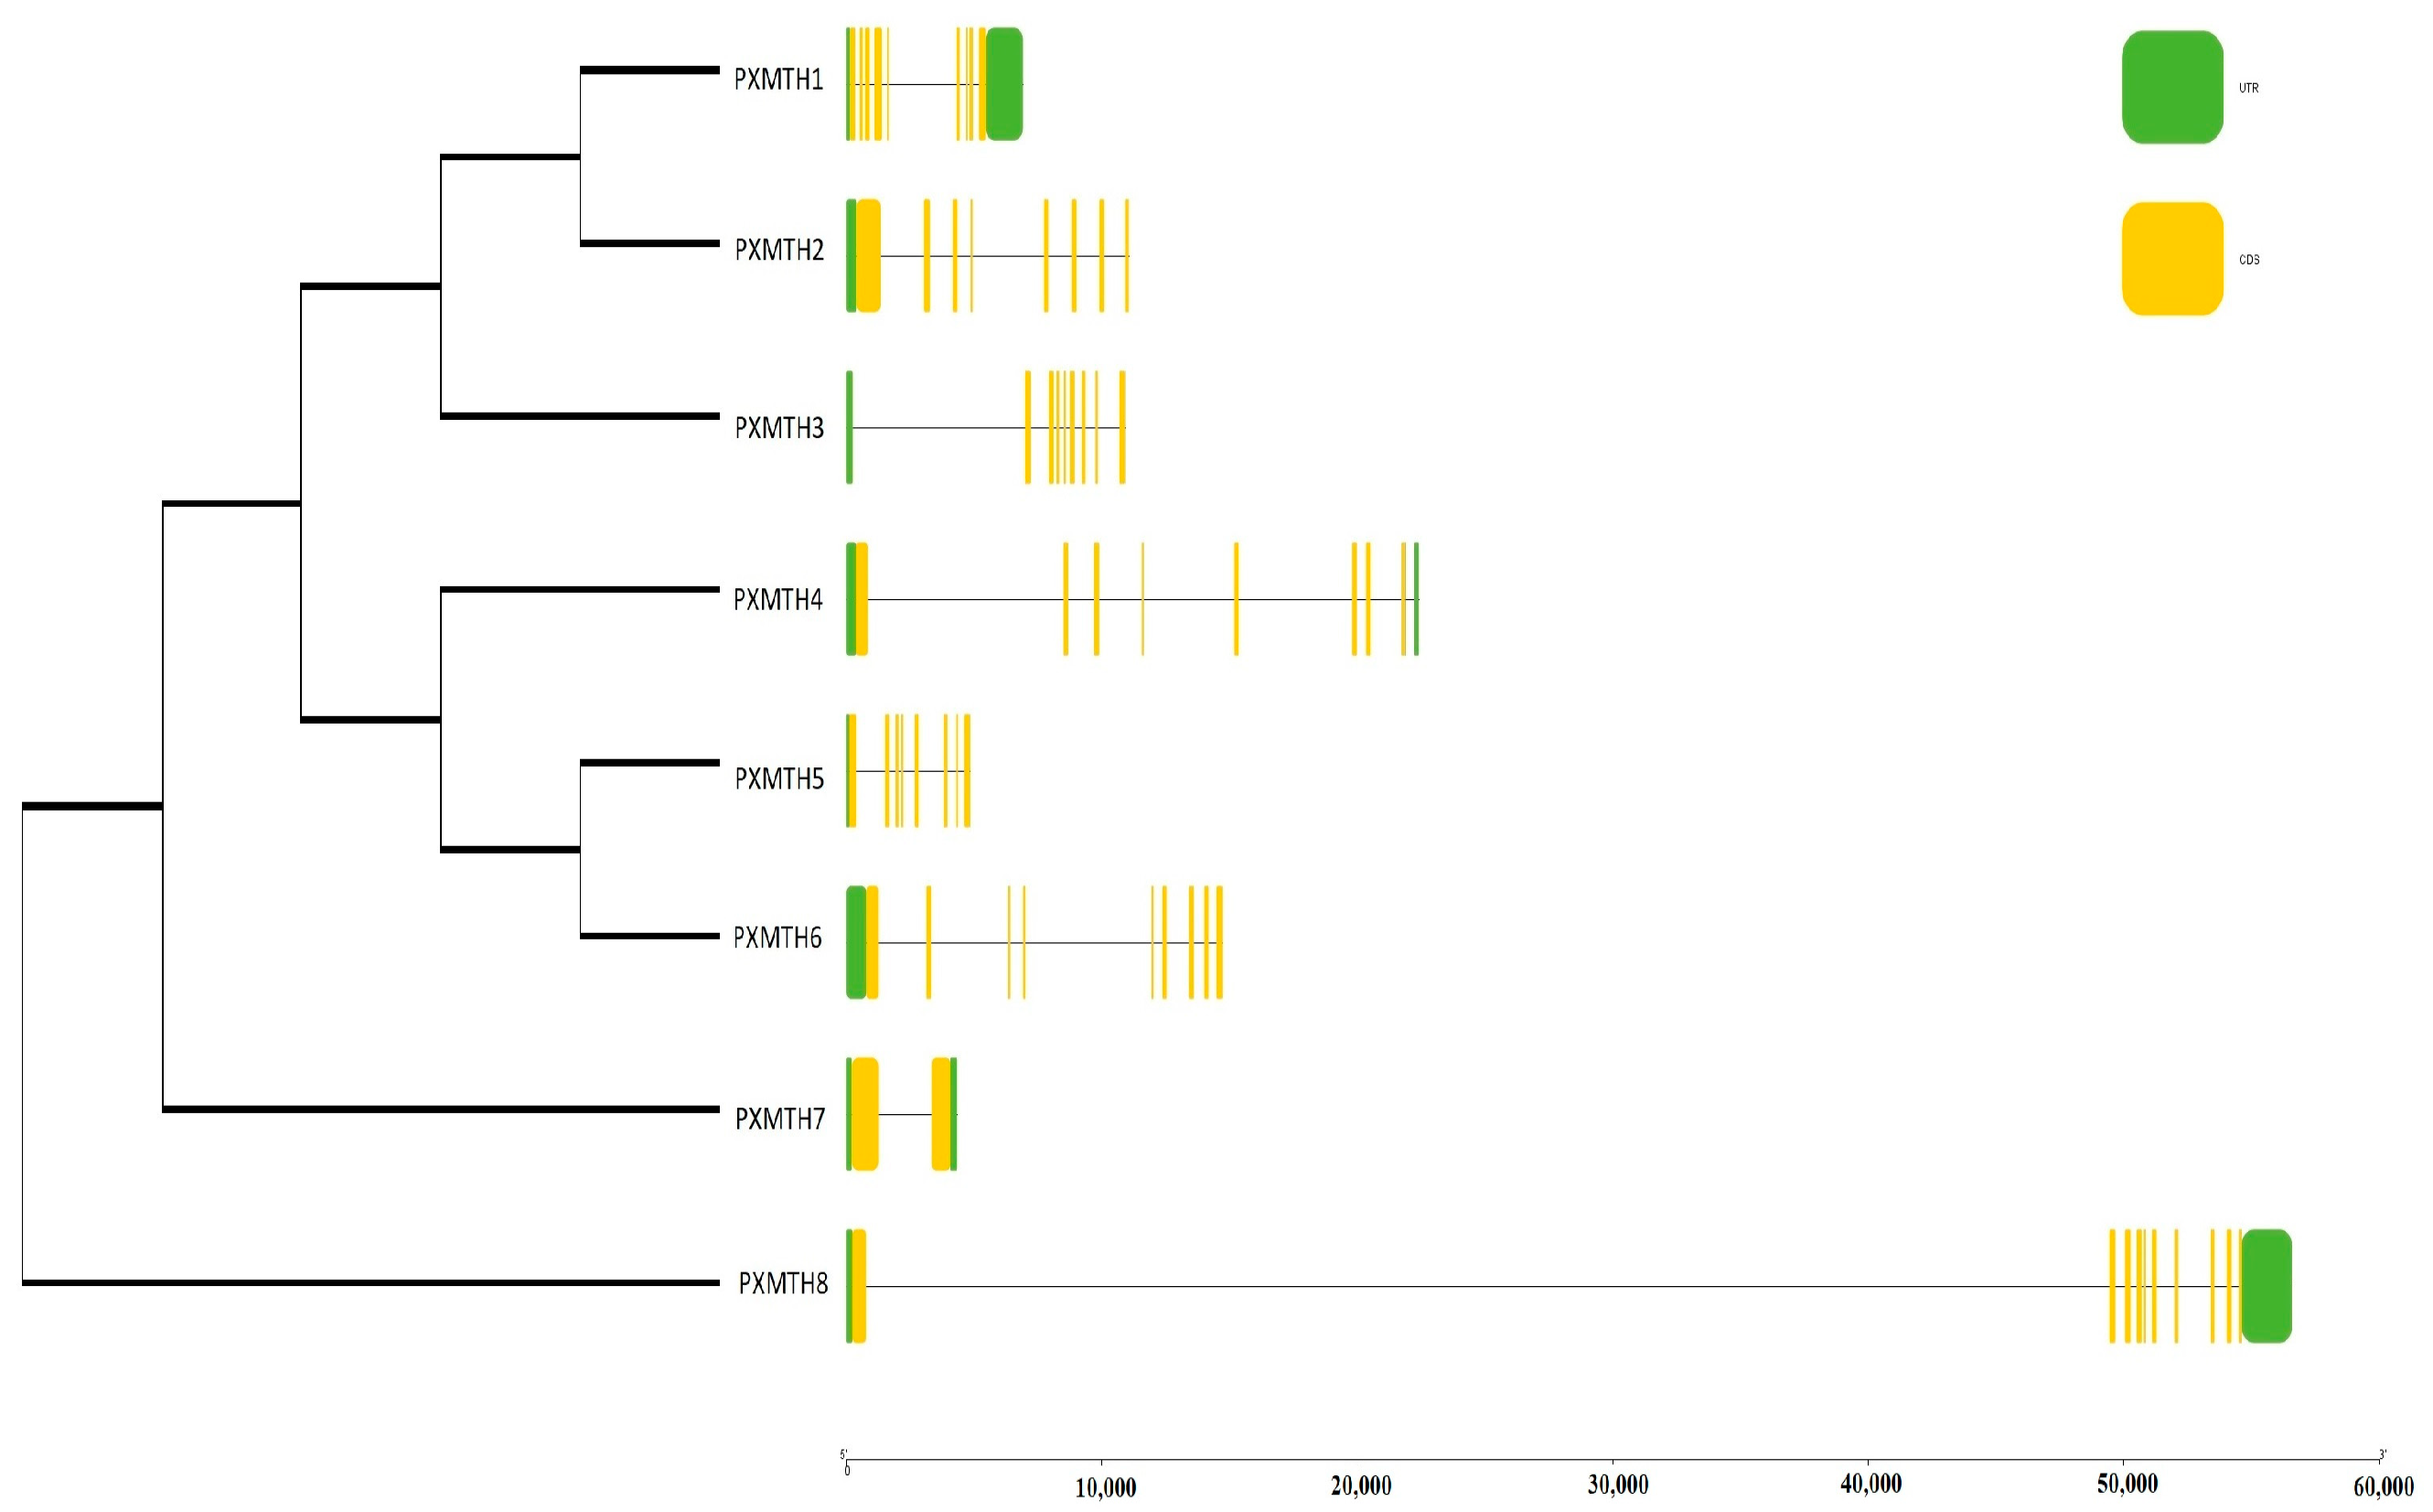
The exon–intron structure and conserved motifs of Mth genes were investigated to gain insight into the evolutionary development of the Mth gene family within the P. xylostella genome. There were between 7 and 11 exons and between 8 and 12 introns (Figure 4B). With a few exceptions within the same sub-clade, the majority of Mth genes displayed parallel structures. PXMH8, PXMTH4, PXMTH6, PXMTH2, PXMTH3, PXMTH1, and PXMTH7 were identified to include the longest exon–intron structures (Figure 5).

3.5. Expression Profiles of Mth Receptors in Response to Chlorantraniliprole

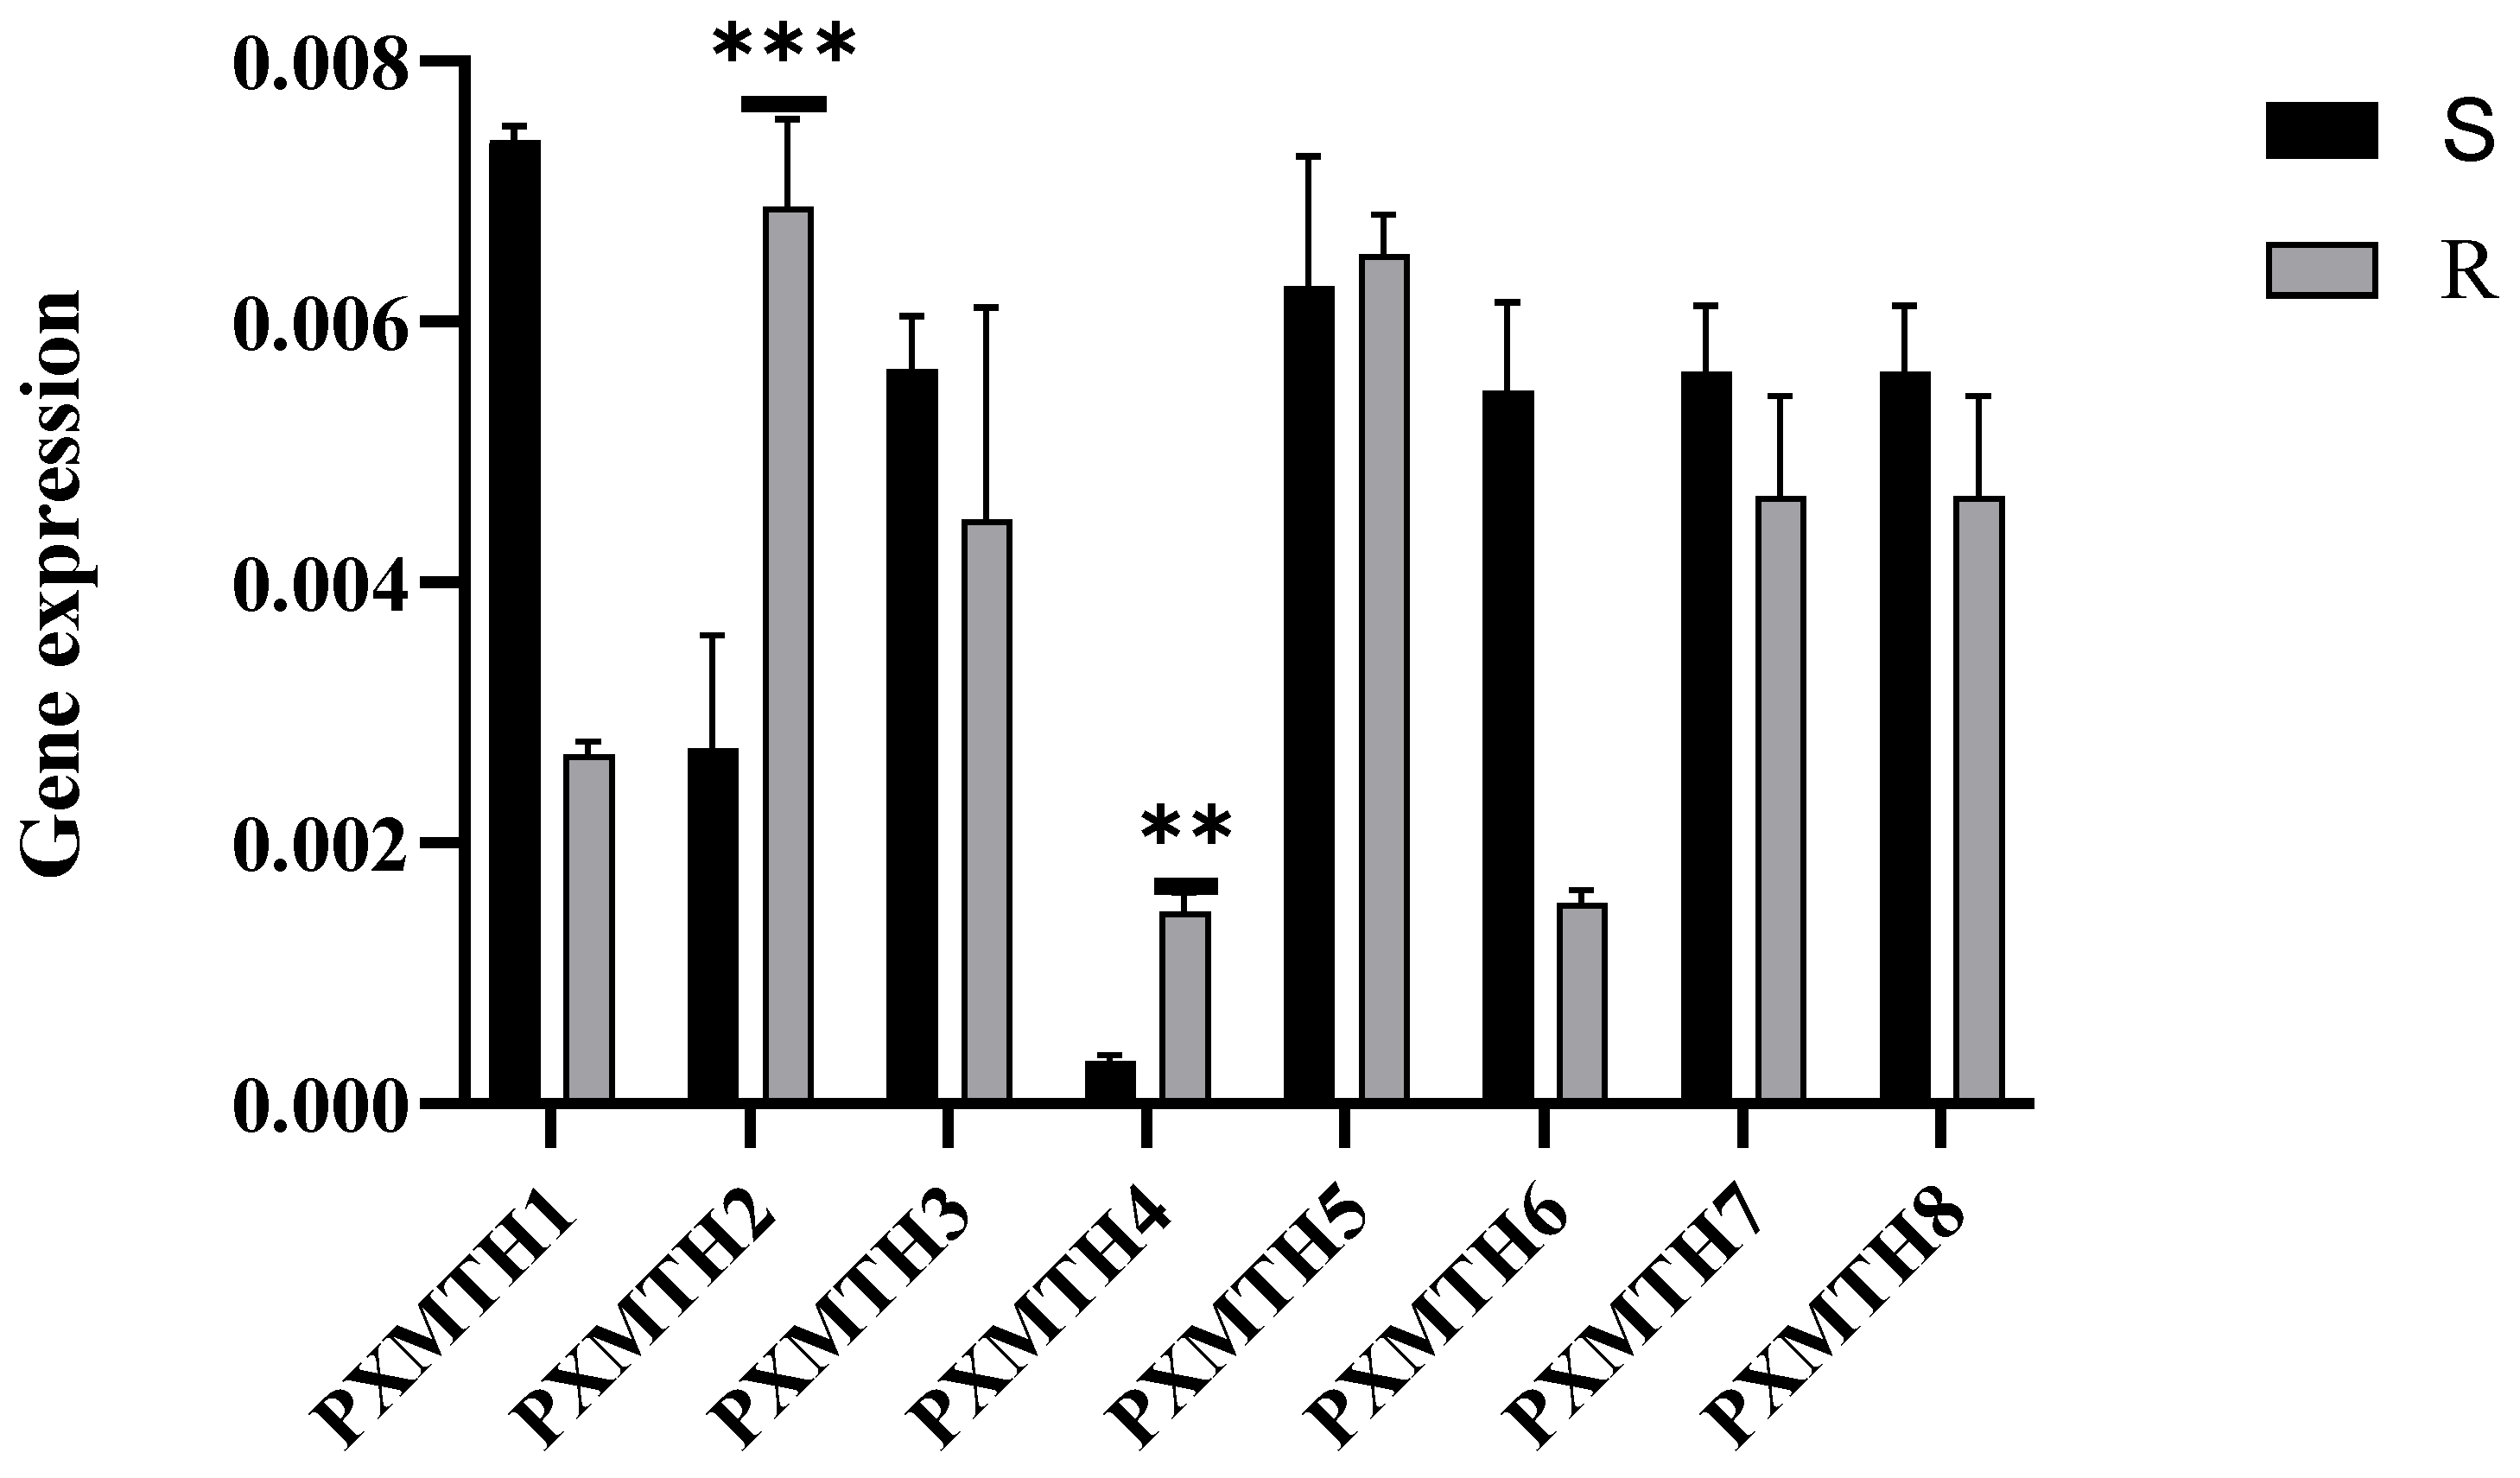
To explore the potential contribution of differentially expressed Mth genes to detoxification metabolism in P. xylostella, we examined the expression levels of these receptors before exposure to CAP using RT-qPCR in both susceptible and resistant strains (Figure 6). The results showed that PxMth2 and PxMth4 were upregulated in the resistant strain, with PxMth2 exhibiting a much higher expression level compared to PxMth4.
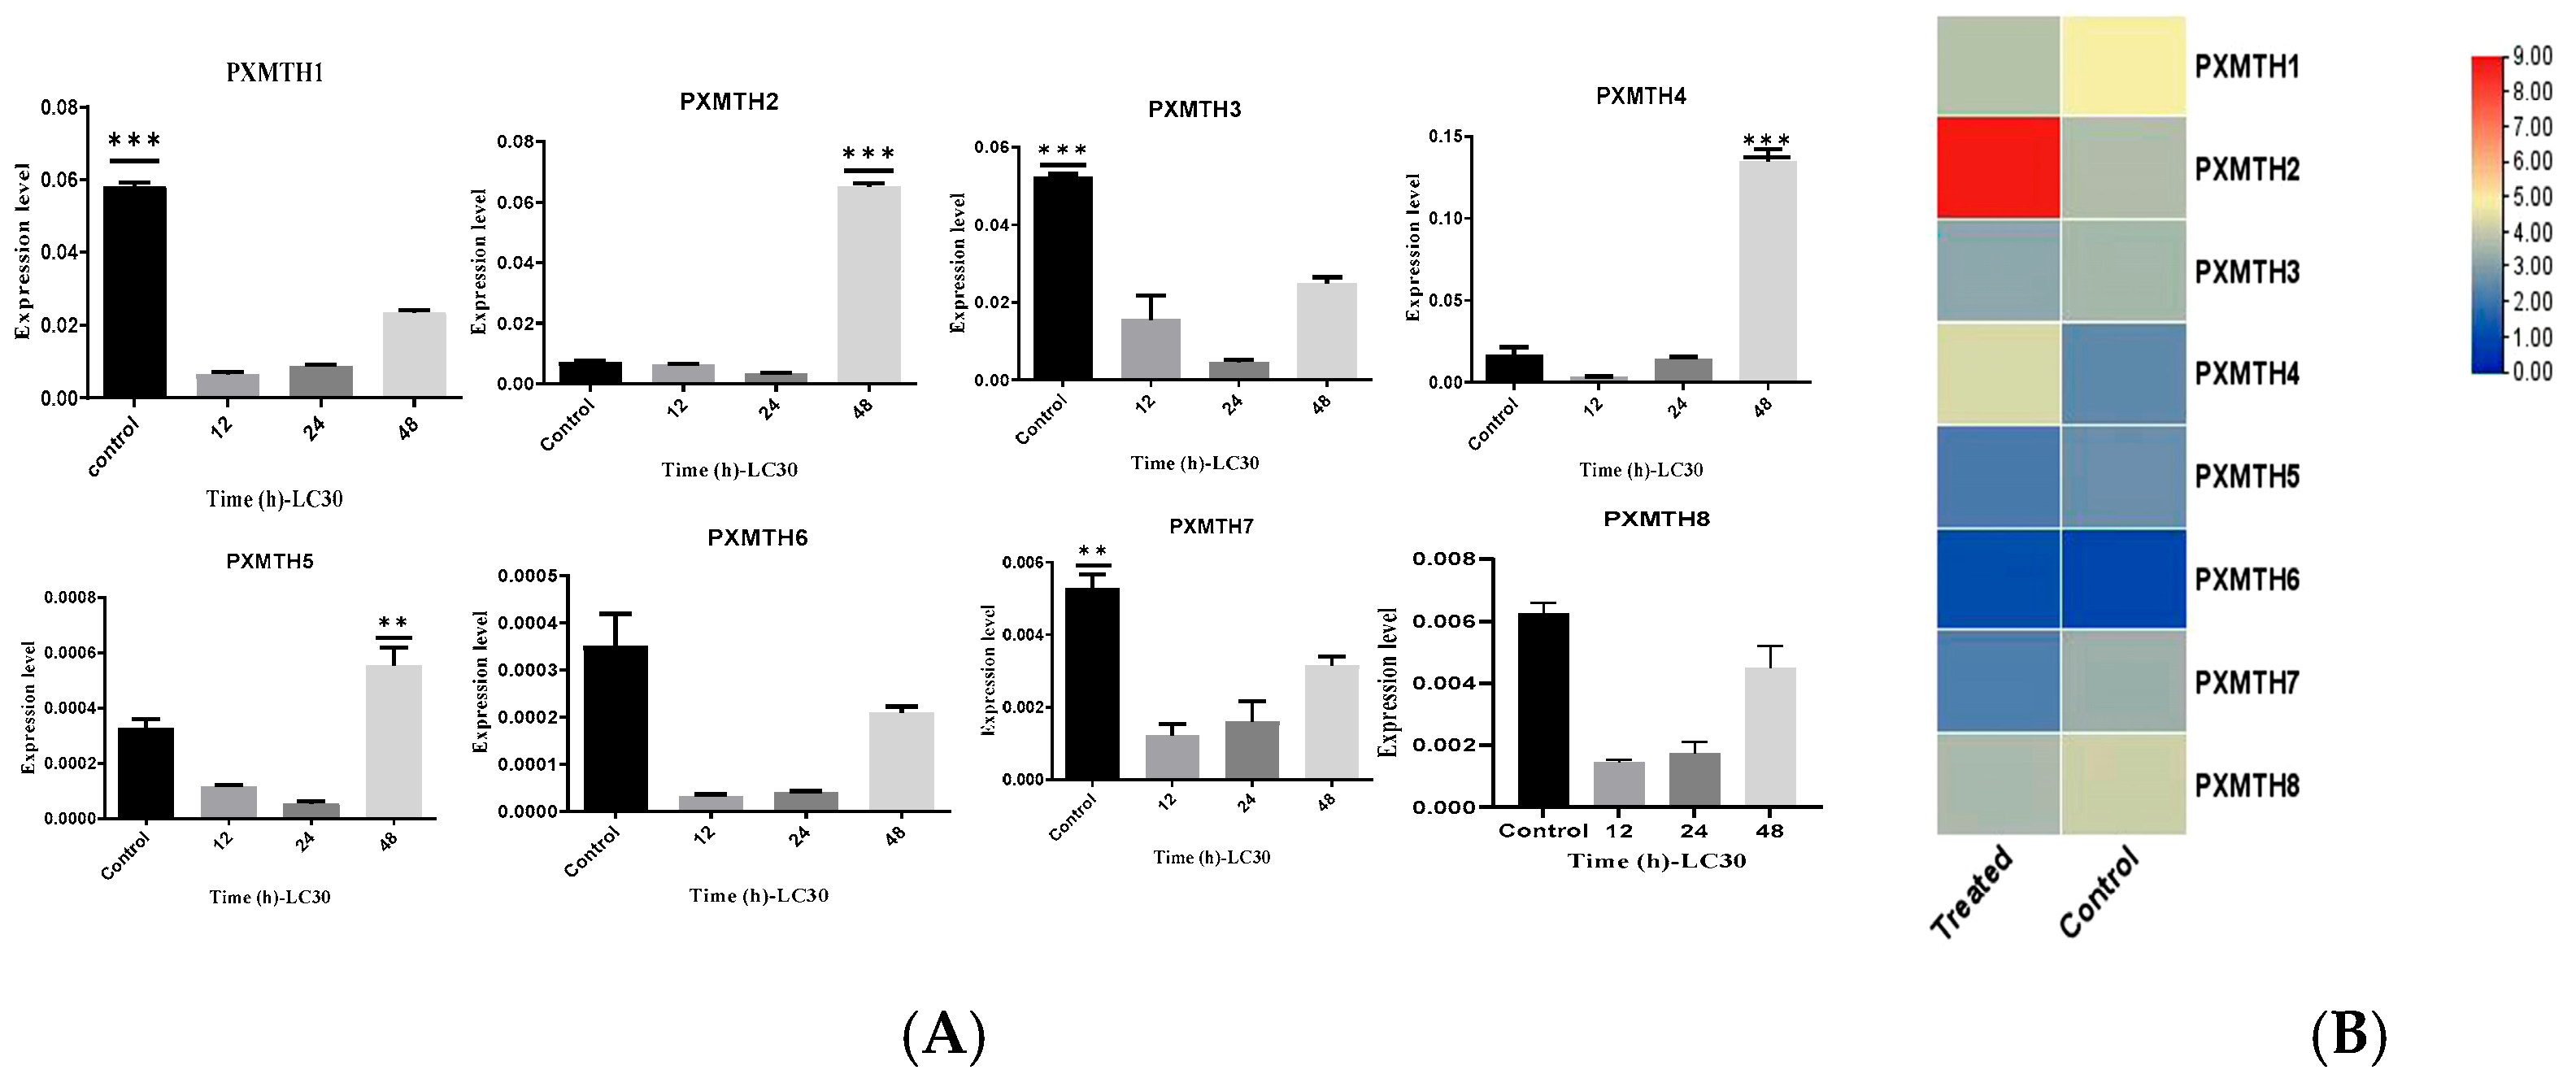
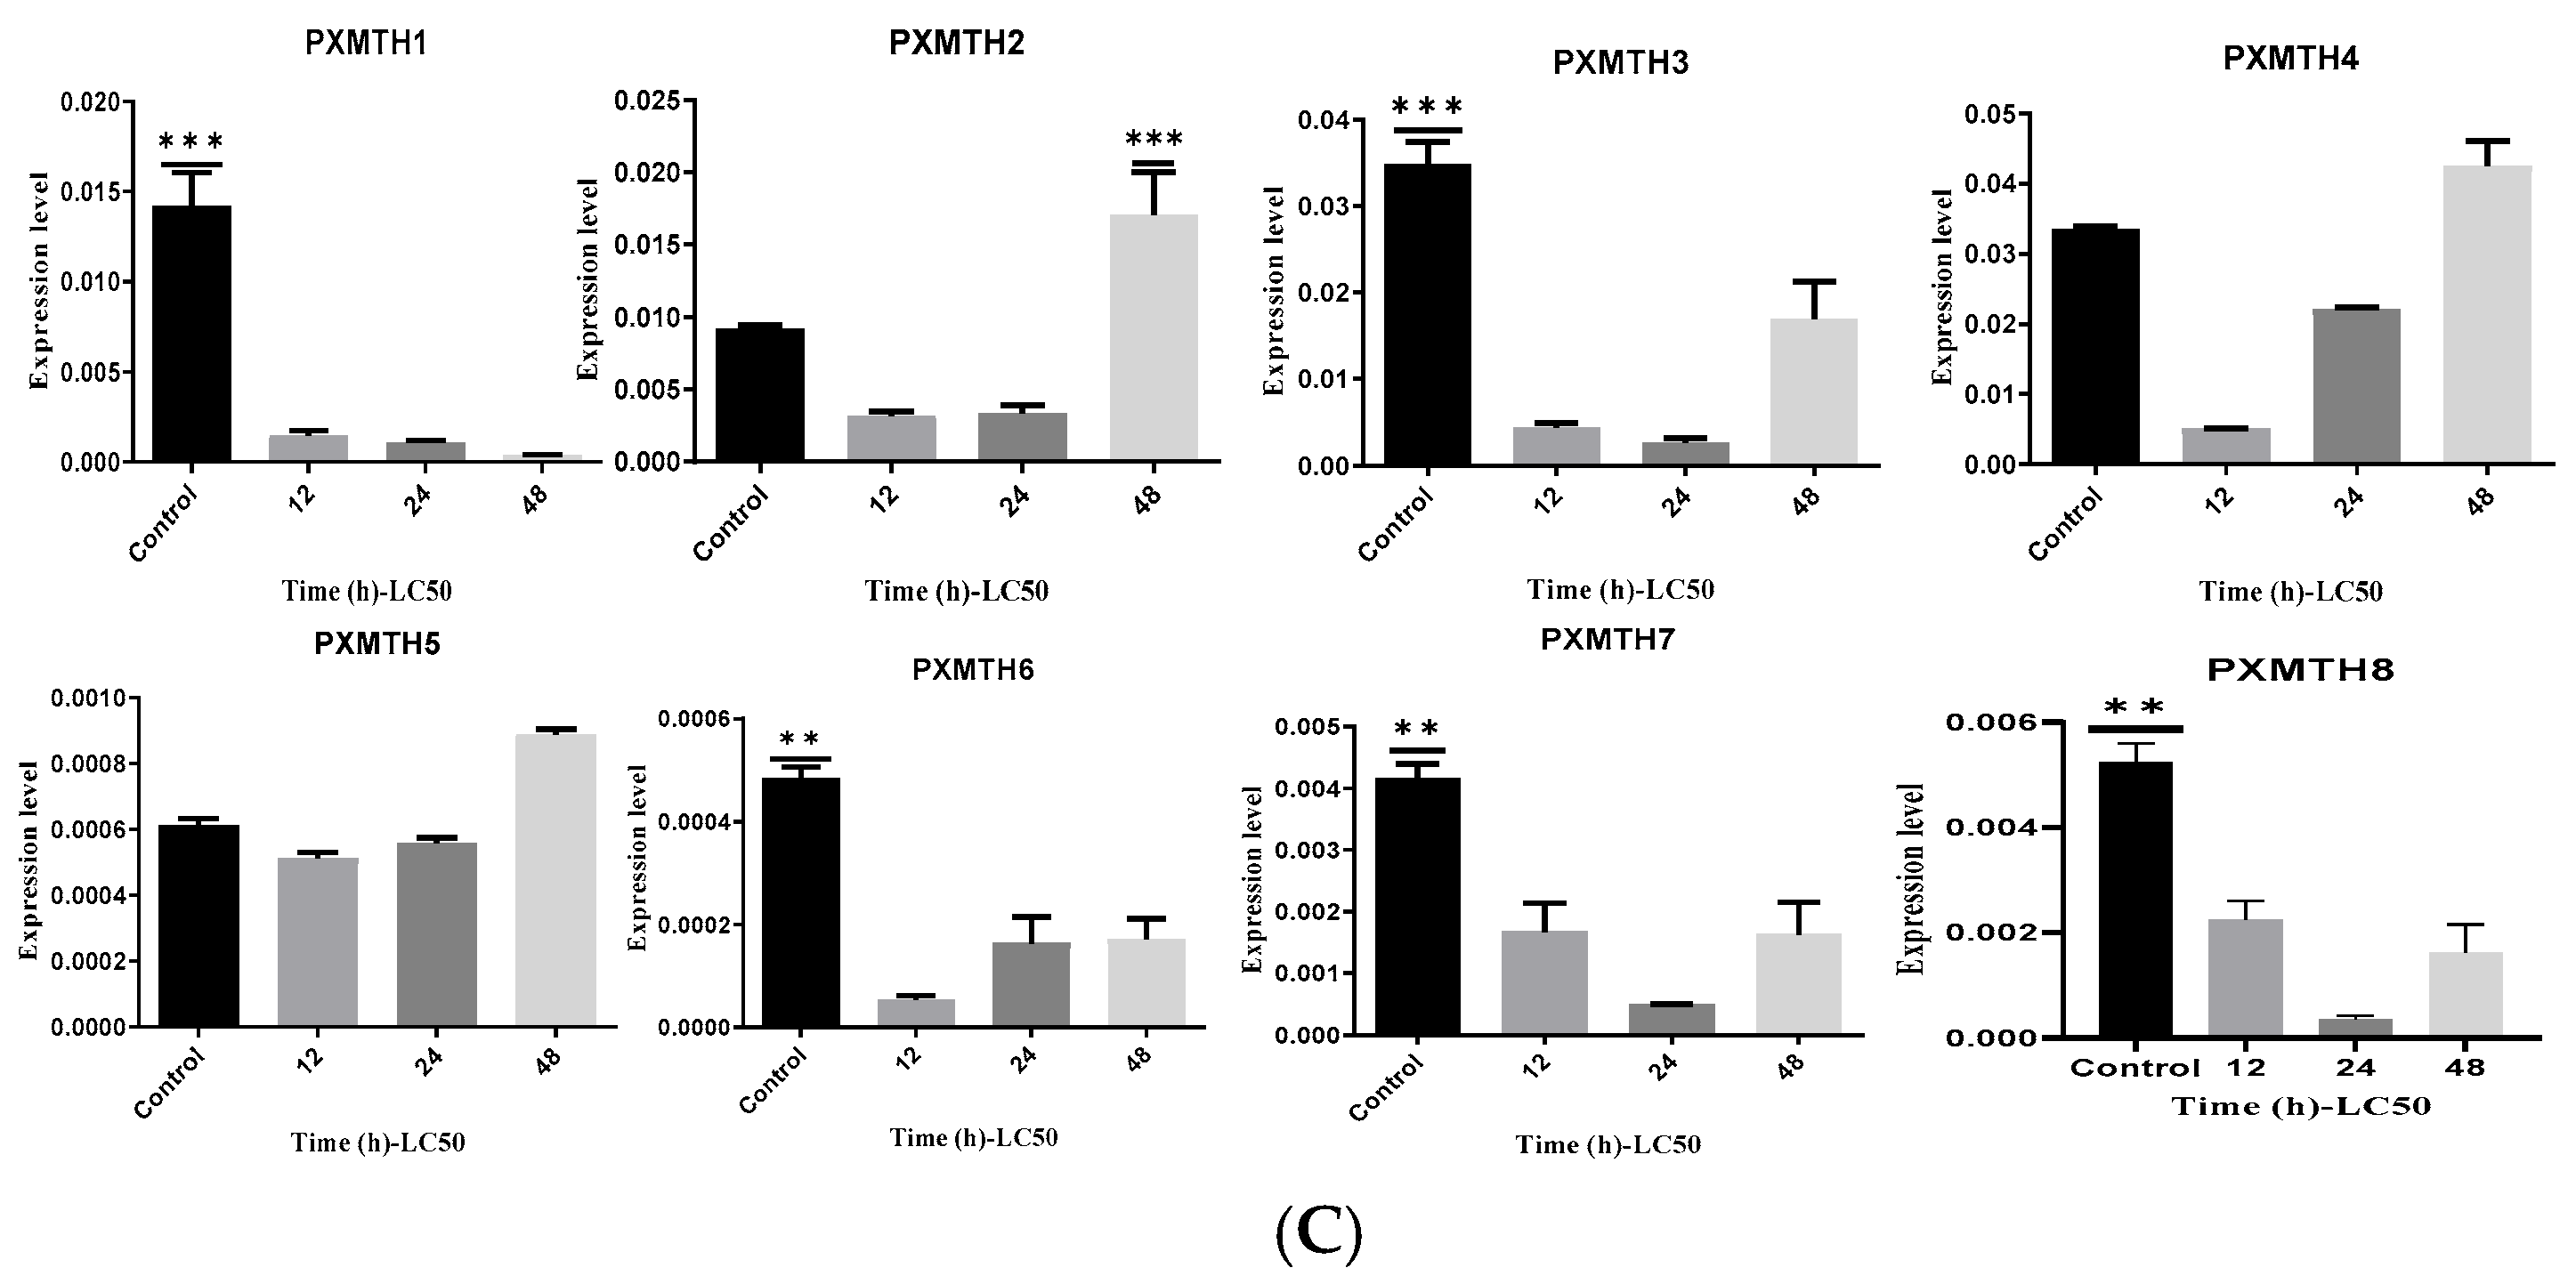
To further evaluate the possible role of these differentially expressed genes, concentrations of LC30 (47 mg/L) and LC50 (63 mg/L) were utilized to assess the regulation of Mth gene expression in P. xylostella (Table 2). PXMTH2 and PXMTH4 were significantly up-regulated after 48 h of exposure to the LC30 dose (Figure 7A). Similarly, after 48 h of LC50 treatment, PXMTH2, PXMTH4, and PXMTH5 showed increased expression, with PXMTH2 displaying a notably higher increase compared to the others. These findings suggest that up-regulated Mth gene expression may be associated with CAP detoxification metabolism.
Transcriptome analysis of the eight Mth genes showed differential expressions in response to CAP treatment. PXMTH2 was the most highly expressed gene (Figure 7B).

3.6. Investigation of RNAi of Pxmth2 in Resistance to CAP

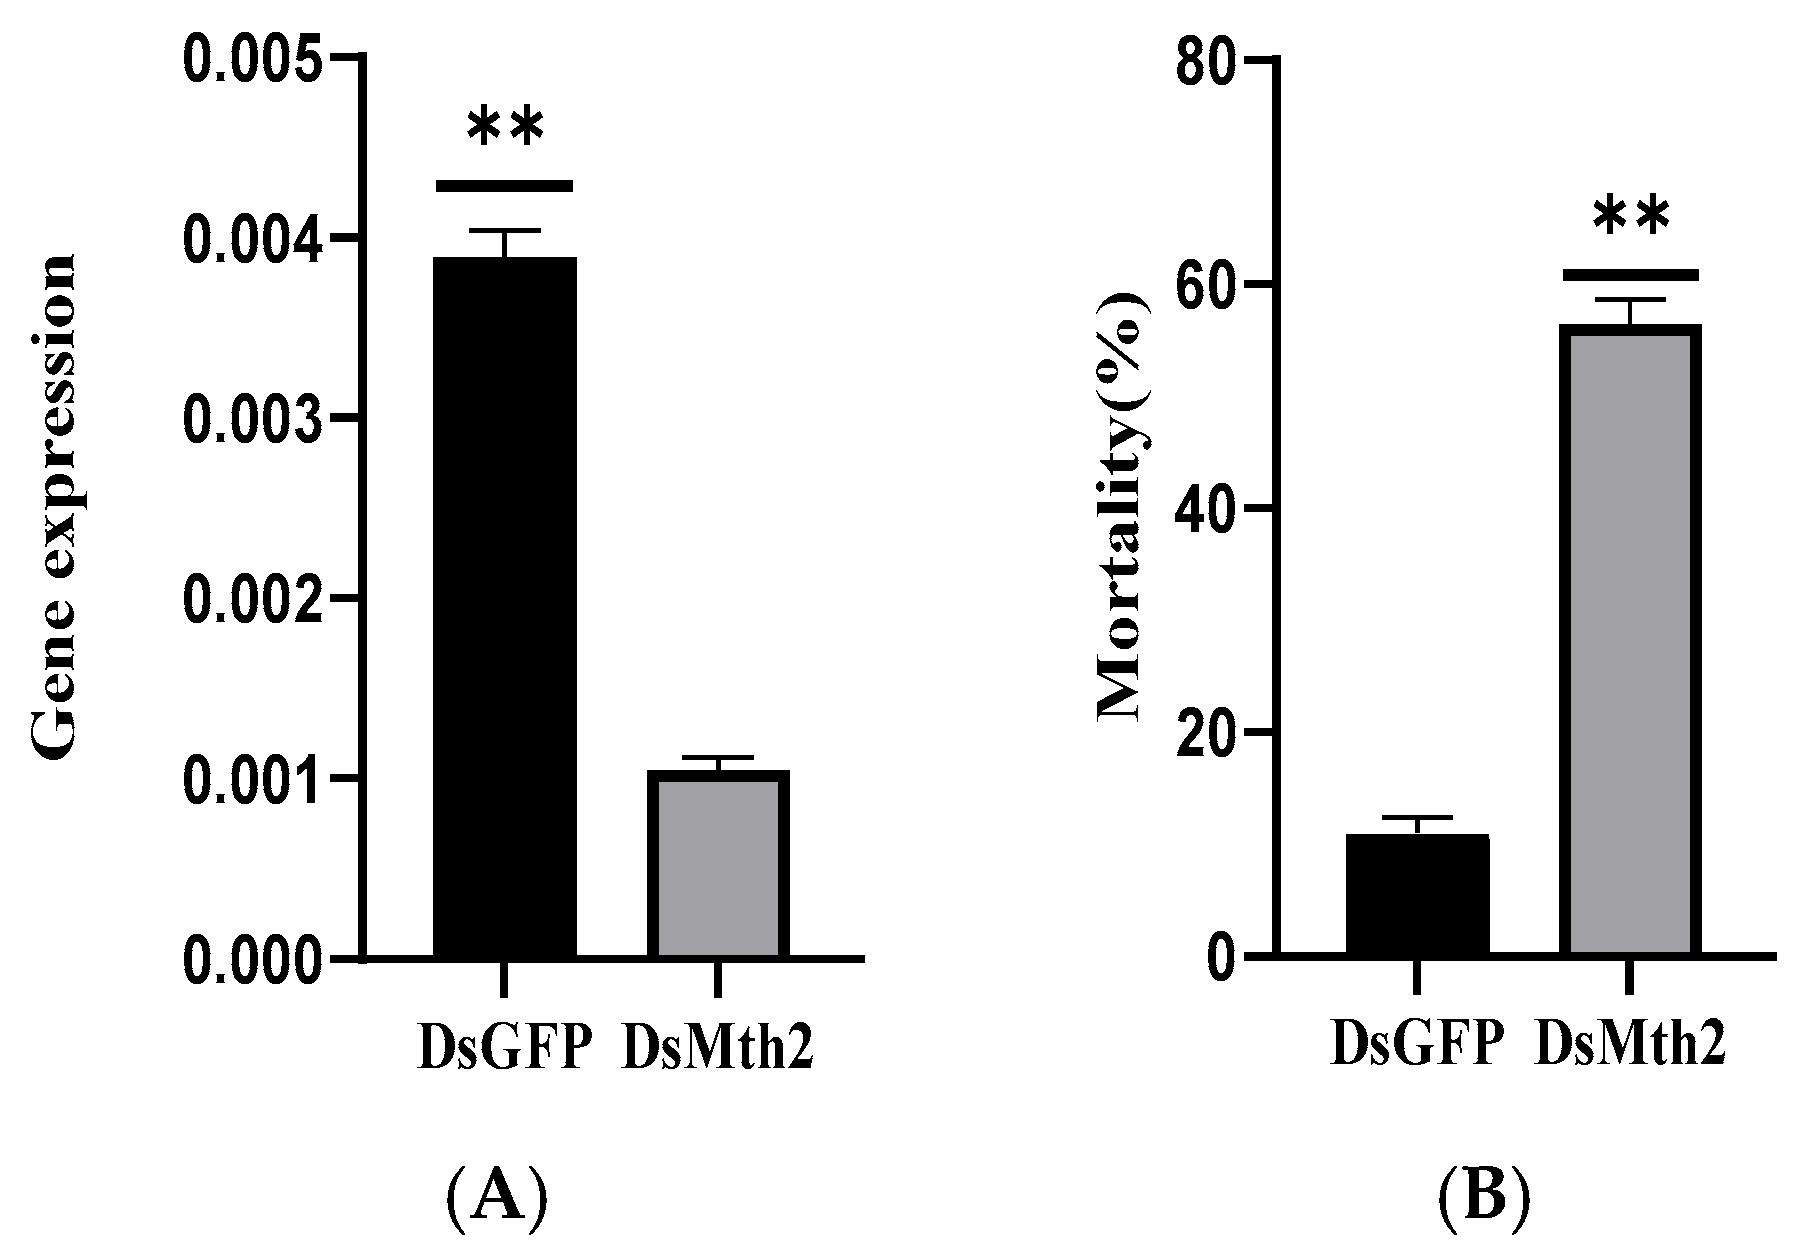
For several lepidopteran species, including P. xylostella, RNAi has been used as a functional genomics technique [38,39,40,41,42,43,44]. In this study, RNAi was utilized to knock down genes in third-instar P. xylostella larvae to investigate the functions of Pxmth2 in resistance to CAP. The mRNA levels of Pxmth2 were much lower in dsRNA injected larvae compared to those injected with GFP RNAi 24 h after injection (Figure 8A), indicating successful Pxmthl2 silencing.
Next, we assessed how Pxmth2 silencing affected the mortality of P. xylostella larvae under CAP stress. After being exposed to 63 mg/L CAP for 24 h, the cumulative mortality in larvae microinjected with dsRNA for Pxmth2 was significantly higher than that of the control group injected with dsGFP. The cumulative mortality rate of the experimental larvae was 57%, whereas the control group’s mortality rate was just 11% (Figure 8B). These findings demonstrate that third-instar P. xylostella larvae’s resilience to low levels of CAP stress was diminished by Pxmth2 silencing.
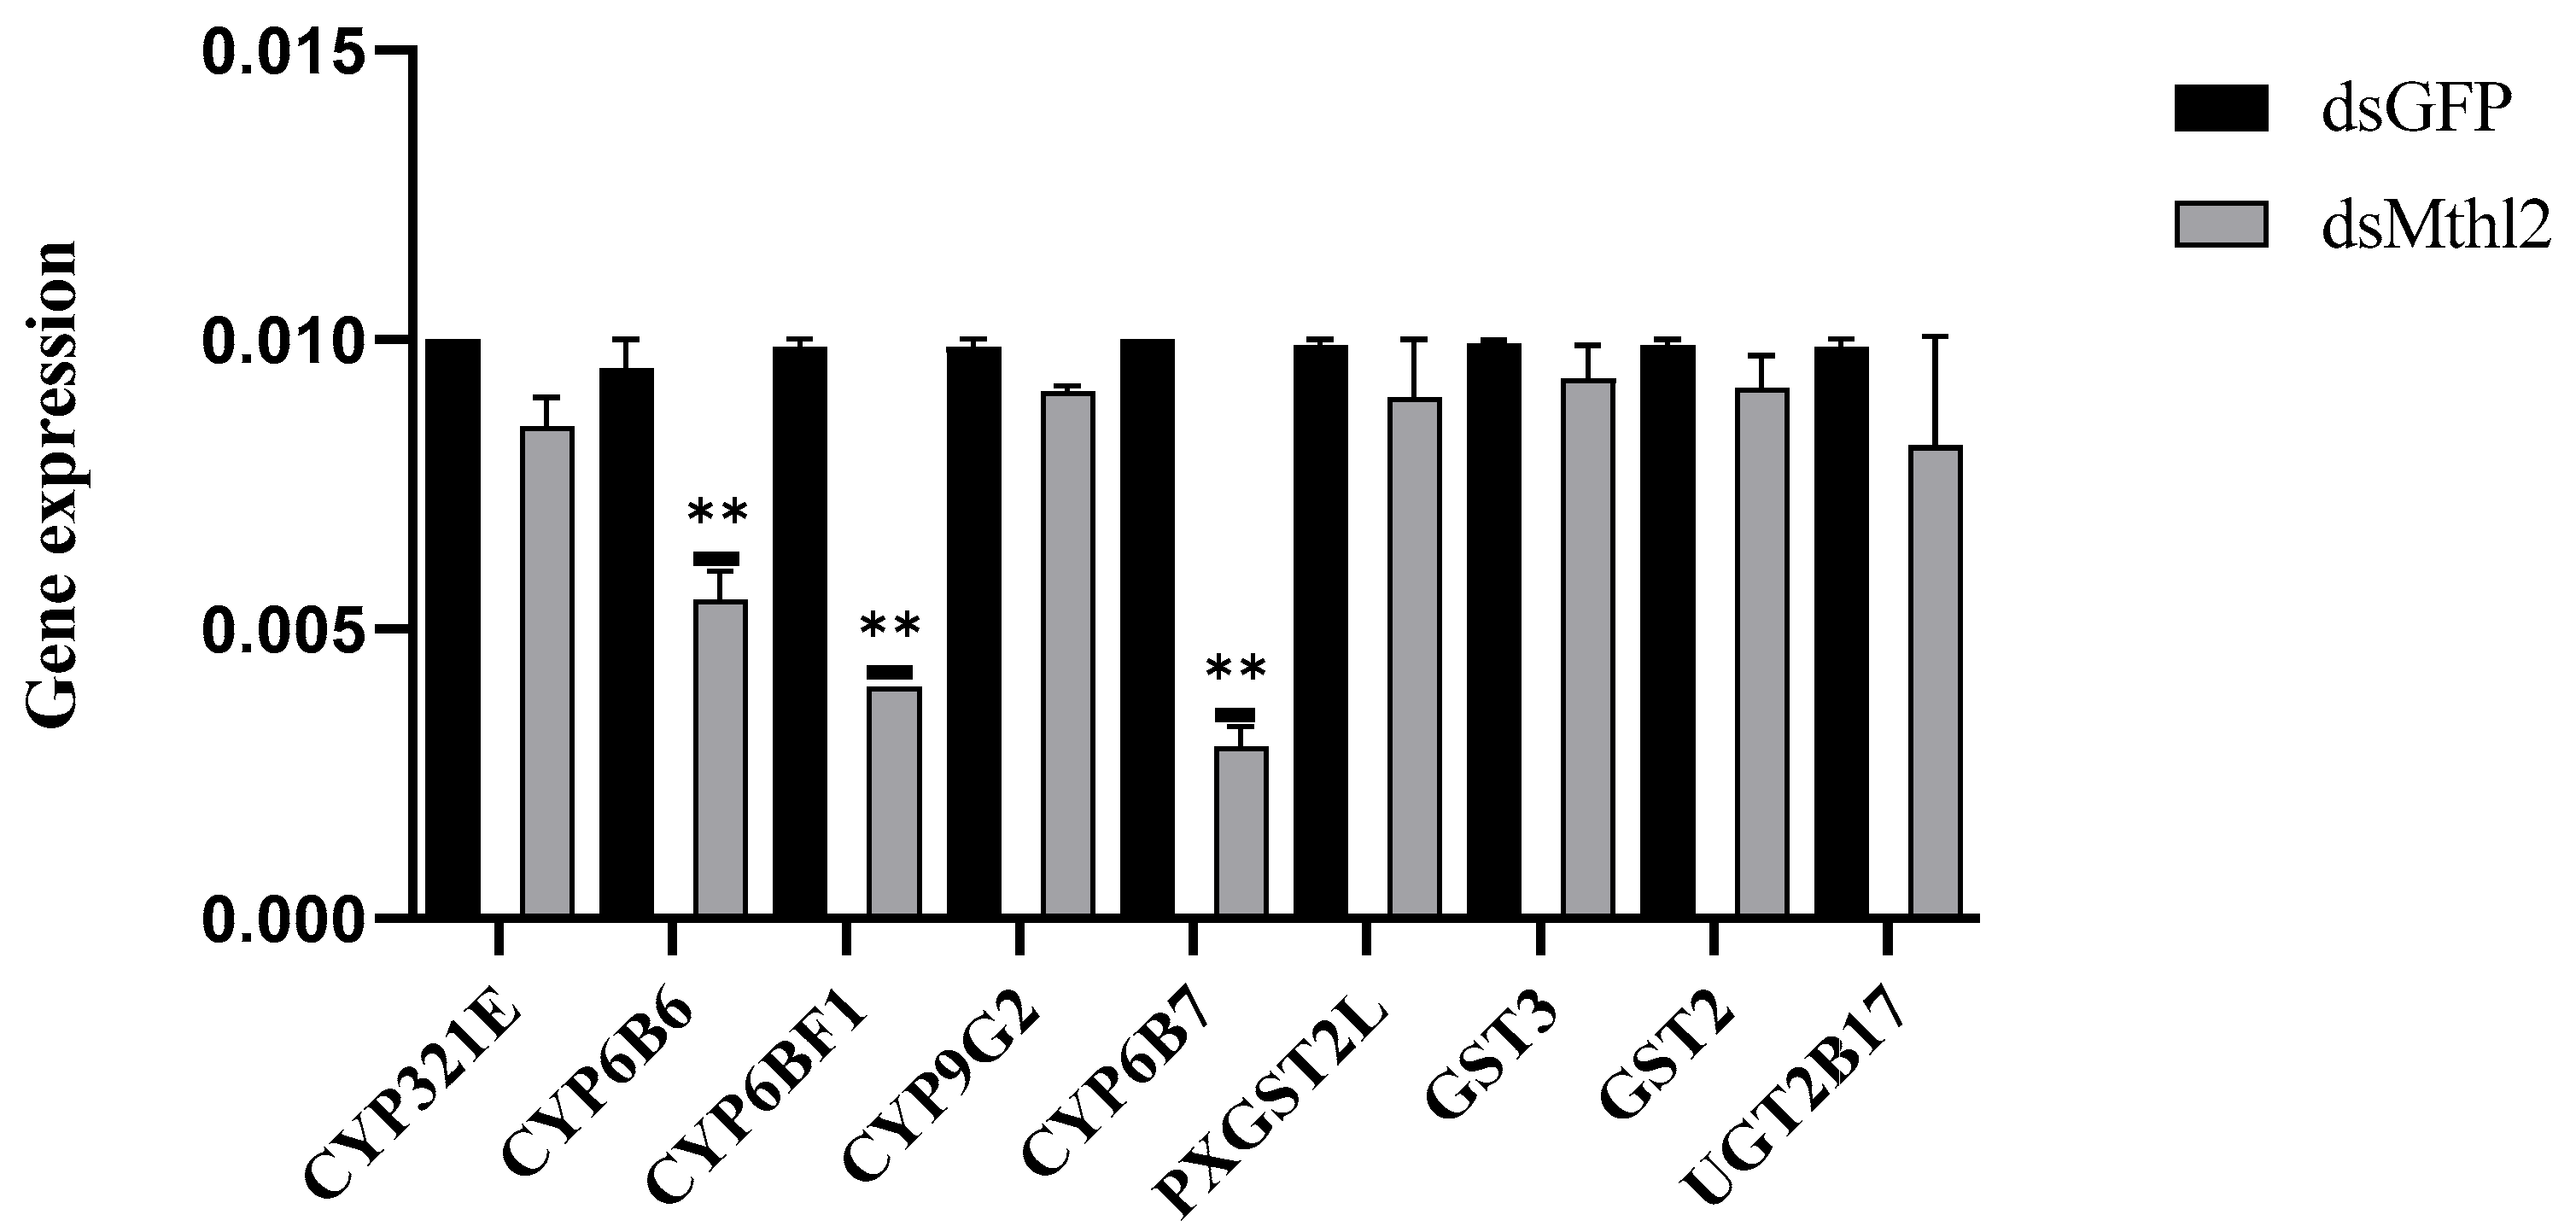
Longer lifespans and higher resistance to stress have been associated with Mth and Mth-like genes [15,45,46]. The expression levels of these target genes following Pxmth2 silencing were studied to determine whether Pxmth2 regulates stress resistance-related genes, such as GSTs, P450s, and UGT. Following Pxmth2 silencing, the expression of CYP6B6, CYP6BF1, and CYP6B7 was decreased (Figure 9), implying that these genes are probably engaged in stress resistance control.

3.7. Pxmth2 Overexpression Confers CAP Resistance in Drosophila

To evaluate the impact of Pxmth2 overexpression on CAP resistance, bioassays were performed using transgenic D. melanogaster lines. The survival data revealed that flies overexpressing Pxmth2 exhibited significantly reduced sensitivity to CAP compared to the wild-type (w1118) controls (Table 3). The LC50 for the transgenic line was 0.7 mg/L, a three-fold increase relative to the WT line (LC50 = 0.24 mg/L), indicating enhanced resistance. QPCR analysis was performed comparing UAS-PxMth2 lines with the w1118 control. The results confirmed significant overexpression of PxMth2 in transgenic flies, while no detectable expression was observed in wild-type controls. These findings suggest that Pxmth2 overexpression confers a substantial detoxification advantage, potentially contributing to increased tolerance to CAP.
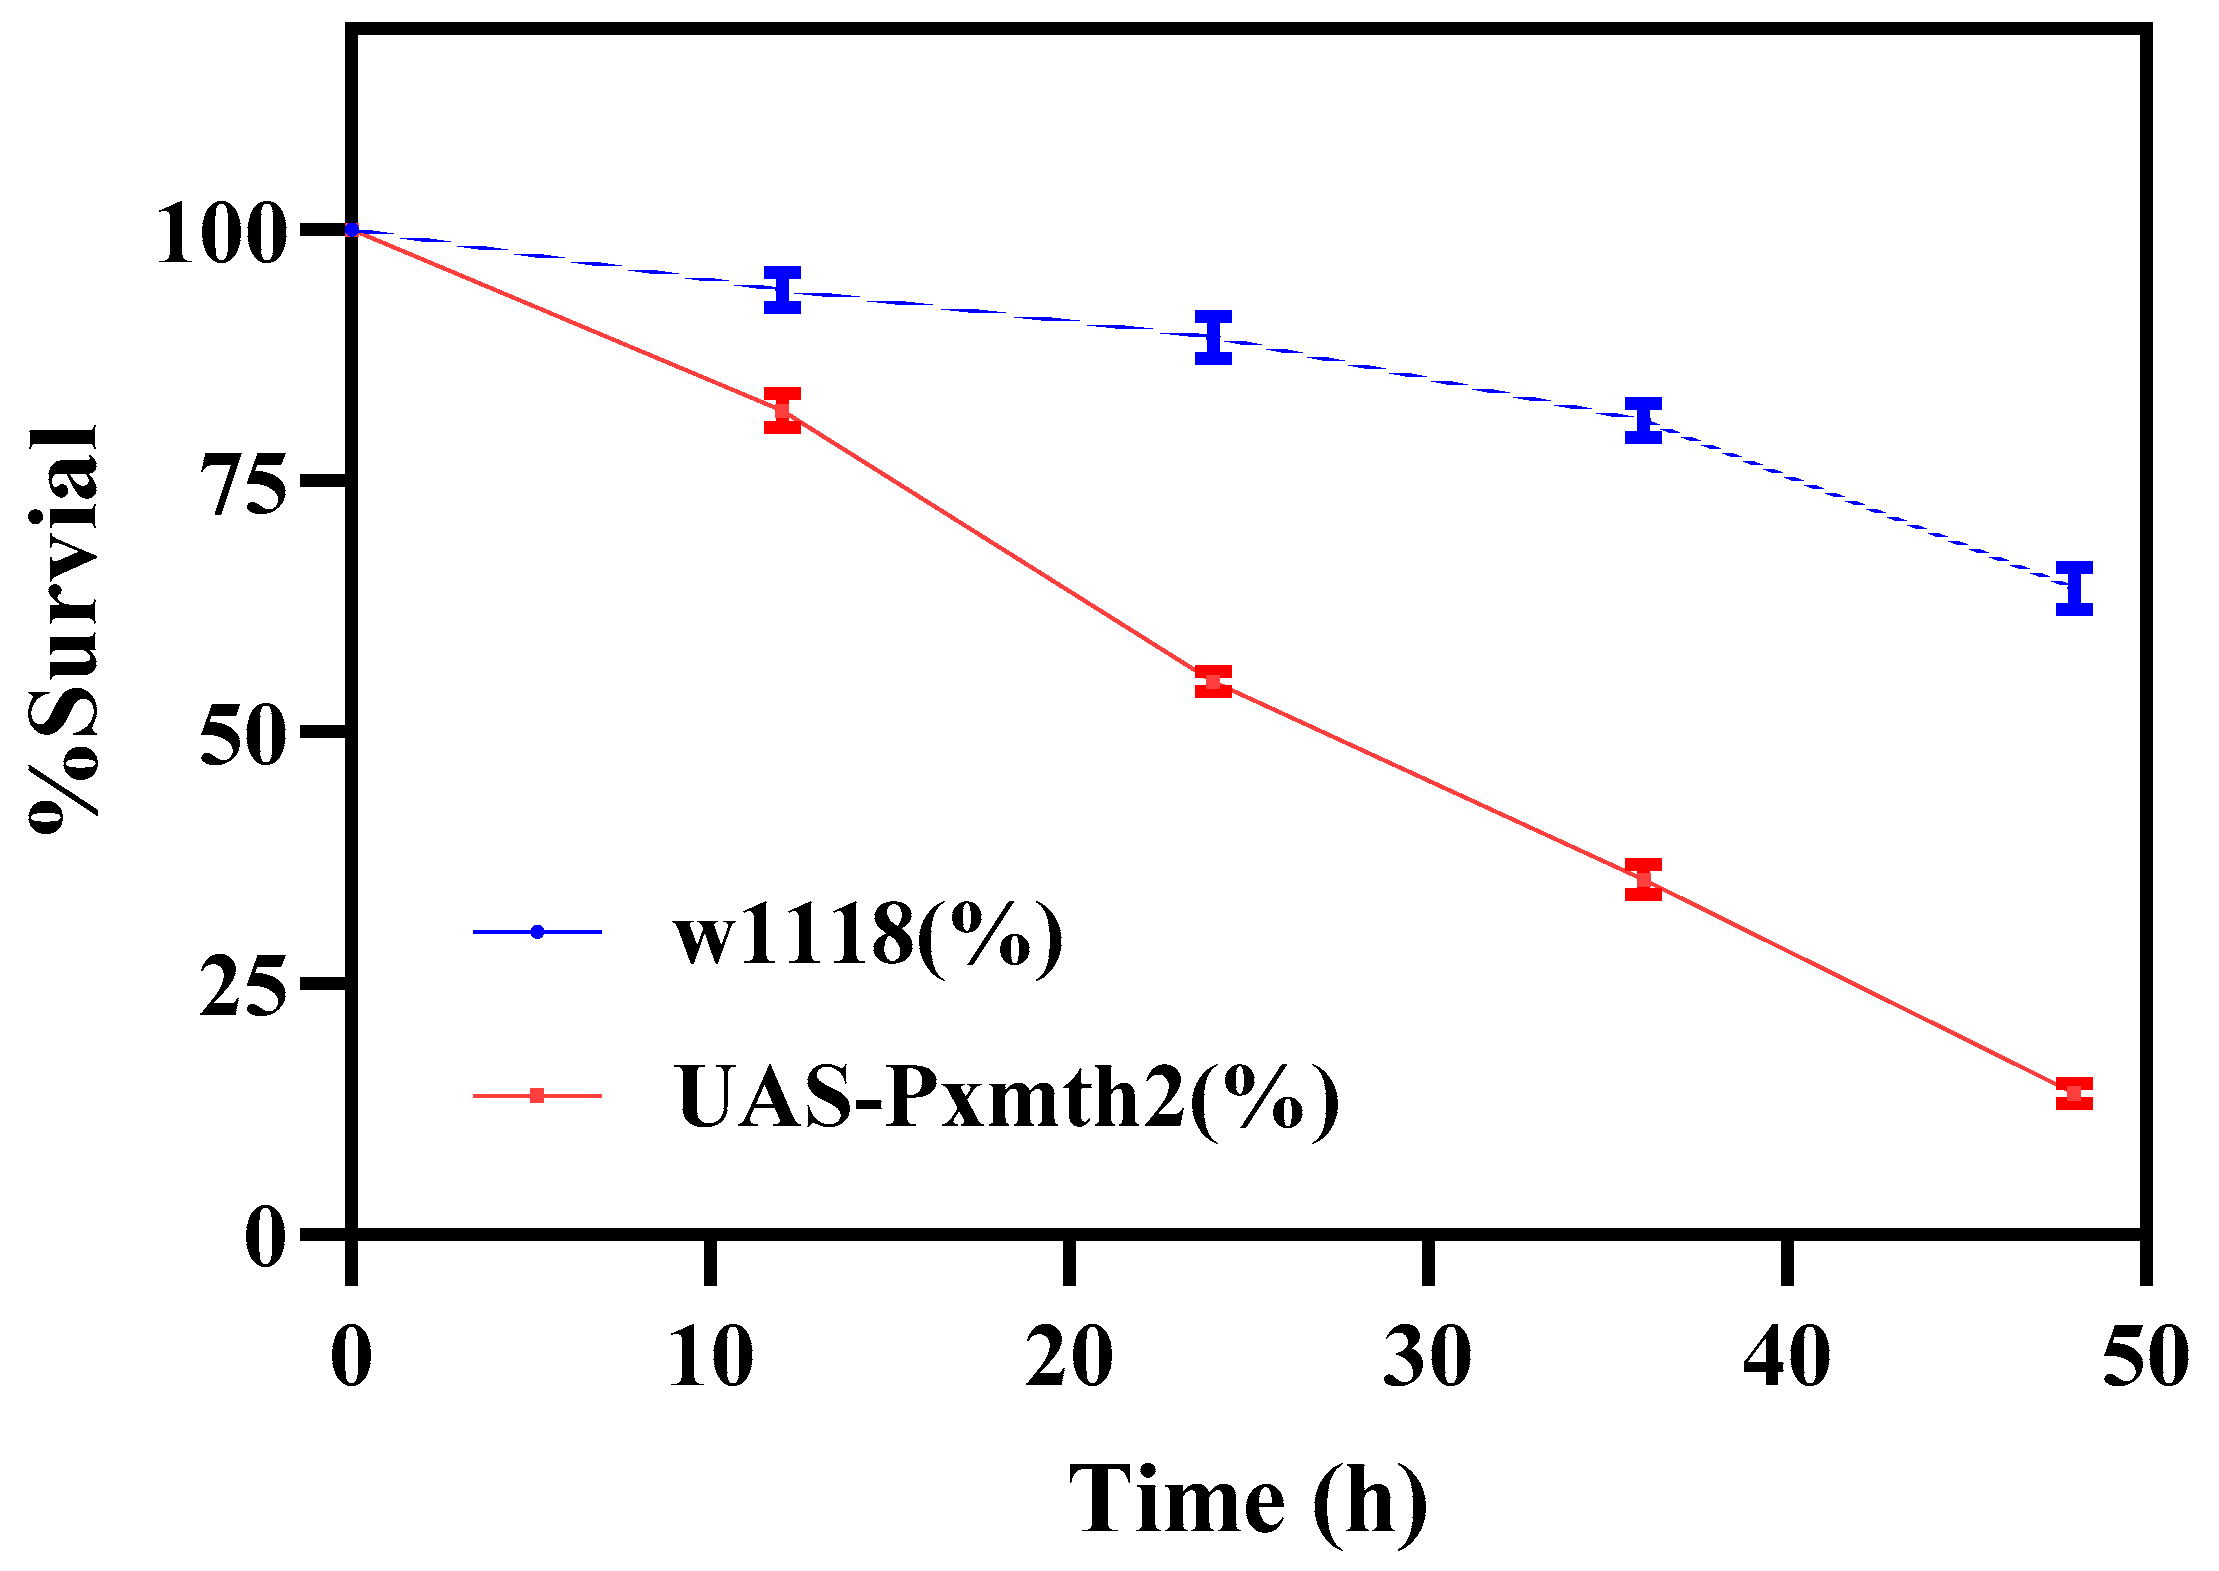
The survival curves clearly demonstrated that overexpression of Pxmth2 enhanced tolerance to CAP in transgenic D. melanogaster compared to the control strain (w1118) (Figure 10). After 48 h of CAP exposure, only 18% of the control flies survived, whereas 65% of the UAS-Pxmth2 line remained alive. The survival decline was significantly slower in the transgenic flies across all time points, confirming that Pxmth2 overexpression confers a protective effect against CAP toxicity.

4. Discussion

Mth genes in P. xylostella were identified and analyzed to explore their potential role in pesticide resistance, specifically in response to CAP exposure. Genome sequencing helped identify Mth genes using model insects, such as D. melanogaster, B. mori, and M. domestica. This study expands our understanding of GPCR-mediated detoxification pathways in lepidopteran pests by demonstrating that specific Mth genes, particularly PxMth2, act as significant participants in resistance mechanisms. Mth genes are known for their roles in stress responses and longevity in insects [47,48]. Eight Mth genes were detected in the P. xylostella genome. The CAP-resistant strain of P. xylostella showed significant expression of these genes, suggesting that they might have a role in insects’ resistance to CAP exposure. This is in conformity with the results of other studies, underscoring the role of Mth genes in stress resistance [15,46]. Recent findings in Zeugodacus cucurbitae provide further support for the conserved role of GPCRs in insecticide resistance. A total of 80 GPCR genes were identified in Z. cucurbitae, including seven Methuselah-like GPCRs (Mth/Mthl). Expression profiling revealed that three Methuselah-like GPCR genes (MFZC63, MFZC66, MFZC67) showed high expression under β-cypermethrin stress [49], consistent with earlier reports linking Mth/Mthl genes to stress tolerance and survival in Drosophila [15,50].
RT-qPCR and genetic analyses were employed to investigate the expression of Mth genes in susceptible and resistant strains of P. xylostella under CAP exposure. The resistant strain exhibited significantly higher levels of PxMth2 expression. Further analysis confirmed that both LC30 and LC50 doses of CAP upregulated PxMth2, highlighting a role in detoxification. These findings imply that PxMth2 is a good candidate for further functional studies that aim to enhance pest management strategies.
The structure of PxMth2, containing seven TMHs, an intracellular domain, and an extracellular domain, aligns with the conserved characteristics of class B GPCRs. Notably, the presence of ten conserved cysteine residues in the ectodomain, along with hydrophobic and charged residues within the ligand-binding regions, underscores the structural and functional conservation of Mth receptors across species. These conserved elements, particularly secondary structural components (e.g., α-helices and β-sheets), emphasize the evolutionary stability of Mth frameworks. Structural integrity, confirmed by the Ramachandran plot, highlighted functional flexibility at key sites, correlating with evolutionary pressures, such as insecticide exposure. PxMth2 likely interacts with CAP, mediating resistance through receptor sensitivity modulation. In the absence of CAP exposure, Mth genes—including PxMth2—play essential roles in regulating key physiological processes such as stress tolerance, aging, and innate immunity. The methuselah GPCR in Drosophila is best known for extending lifespan and bolstering resistance to oxidative damage, starvation, heat, and other stressors [47]. Similarly, T. castaneum Mth-like genes have been shown to influence development, stress resistance, lifespan, and reproduction [50]. Furthermore, Mth mutants demonstrate enhanced detoxification following exposure to chemicals, supporting roles in basal stress-response and homeostatic signaling [51]. Therefore, while PxMth2 is strongly upregulated under CAP stress in our study, these findings suggest it also has inherent functions in maintaining homeostasis and environmental resilience under normal conditions.
RNAi was successfully used to silence PxMth2 in third-instar larvae of P. xylostella. These findings conform to those of studies on T. castaneum, D. helophoroides, and Lymantria dispar, where silencing Mth like-genes reduced lifespan [18,38,45]. These findings indicate that PxMth2 has a complex, critical role in regulating longevity in P. xylostella, implying that PxMth2 contributes to insecticide resistance by transmitting extracellular signals to downstream genes in response to stress caused by insecticides [52]. The involvement of PxMth2 in this stress response probably involves regulating the expression of downstream target genes (e.g., GSTs and P450s). Xenobiotic metabolism facilitated by GSTs or CYPs is widely recognized as a general mechanism for insecticide resistance [53,54,55]. A significant process that allows insects to adapt to plant secondary compounds and allelochemicals is the detoxification of xenobiotics by CYPs [56,57,58,59,60,61,62]. The expression of three examined CYP6 genes (CYP6B6, CYP6B7, and CYP6BF1) was dramatically decreased in P. xylostella larvae when PxMth2 expression was silenced, suggesting that PxMth2 positively controls cytochrome P450 expression in this species. When L. dispar larvae were subjected to different pesticide stressors, several P450 genes (e.g., CYP6B53, CYP6AE51, CYP6CT4, CYP6AB36, and CYP6AN15v1) showed distinct expression patterns [63]. Our results confirm that PxMth2 could affect how P450 genes are regulated in reaction to pesticide stress. Similarly, in Culex pipiens pallens, a GPCR-arrestin gene has been shown to regulate an insecticide-resistance-associated CYP gene in a deltamethrin-resistant strain [64]. Four GPCR-related genes were found to be important in controlling the expression of several resistance-related P450 genes in Culex quinquefasciatus [65]. Furthermore, in mosquitoes, rhodopsin-like GPCRs play a role in insecticide resistance. When these receptors were knocked down, permethrin resistance decreased, along with the expression of resistance-related P450 and PKA genes. This role was further confirmed in transgenic D. melanogaster, and inhibition of cAMP or knockdown of PKA genes also reduced resistance and P450 expression [10]. These results demonstrate the unique function of GPCRs as key modulators of metabolic pesticide resistance mediated by P450.
According to our findings, PxMth2 promotes stress resistance in P. xylostella by controlling genes linked to stress responses and detoxification, including P450s. These results advance our knowledge of a novel GPCR in insects and raise the possibility that it could be the target of insecticides that target GPCRs. Overall, our findings underscore the critical role of Mths, particularly those involved in stress responses and detoxification, in P. xylostella resistance to CAP. This research provides a foundation for developing innovative pest control strategies that are more target specific and minimize environmental impacts. However, further field studies are necessary to confirm our findings and fully explore GPCR-mediated resistance mechanisms in P. xylostella.

5. Conclusions

In this study, we identified and characterized Mth genes in P. xylostella, revealing that PxMth2 plays a role in pesticide resistance, particularly against CAP. PxMth2 was significantly upregulated in resistant strains and under CAP exposure, and RNAi demonstrated its involvement in regulating downstream detoxification genes, including (CYP6B6, CYP6B7, CYP6BF1). Structural and evolutionary analyses confirmed the conservation of PxMth2 as a class B GPCR, supporting its functional significance in stress response and homeostasis. These findings highlight PxMth2 as a target for future pest management strategies and contribute to our understanding of GPCR-mediated detoxification pathways in lepidopteran pests.

Supplementary Materials

The following supporting information can be downloaded at: https://www.mdpi.com/article/10.3390/insects16111092/s1, Table S1: List of primers used for qPCR experiment.

Author Contributions

Conceptualization, M.Z., F.Y. and S.S.; methodology, M.Z., F.Y., S.S., Q.C., Y.X. and Z.P.; software, M.Z., F.Y., Q.C., Y.X., Z.P. and S.S.; validation, M.Z., F.Y. and S.S.; formal analysis, M.Z., F.Y., Q.C. and S.S.; investigation, M.Z., F.Y. and S.S.; resources, M.Z., F.Y., S.S., Z.-Y.L. and Y.X.; data curation, M.Z., F.Y. and S.S.; writing—original draft preparation, M.Z., F.Y. and S.S.; writing—review and editing, M.Z., Z.-Y.L., F.Y. and M.P.Z.; visualization, F.Y. and Z.-Y.L.; supervision, F.Y., Z.-Y.L. and M.P.Z.; project administration, F.Y. and Z.-Y.L.; funding acquisition, Z.-Y.L. and M.P.Z. All authors have read and agreed to the published version of the manuscript.

Funding

Funding was provided by the Natural Science Foundation of Guangdong Province (2025A1515010408), National Natural Science Foundation of China (Grant No.: 31701819, Innovation Team Project in Modern Agricultural Industrial Technology System of Guangdong (2024CXTD21).

Data Availability Statement

The original contributions presented in this study are included in the article/Supplementary Material. Further inquiries can be directed to the corresponding author.

Conflicts of Interest

Author Maryam Zolfaghari was employed by Guangzhou Molan Agricultural Technology Co., Ltd. The remaining authors declare that the research was conducted in the absence of any commercial or financial relationships that could be construed as a potential conflict of interest.

References

  1. Garland, S.L. Are GPCRs still a source of new targets? J. Biomol. Screen. 2013, 18, 947–966. [Google Scholar] [CrossRef]
  2. Filmore, D. It’s a GPCR world. Mod. Drug Discov. 2004, 7, 24–28. [Google Scholar]
  3. Klabunde, T.; Hessler, G. Drug design strategies for targeting G-protein-coupled receptors. Chembiochem 2002, 3, 928–944. [Google Scholar] [CrossRef]
  4. Liu, N.; Li, T.; Wang, Y.; Liu, S. G-protein coupled receptors (GPCRs) in insects—A potential target for new insecticide development. Molecules 2021, 26, 2993. [Google Scholar] [CrossRef]
  5. Syrovatkina, V.; Alegre, K.O.; Dey, R.; Huang, X.-Y. Regulation, signaling, and physiological functions of G-proteins. J. Mol. Biol. 2016, 428, 3850–3868. [Google Scholar] [CrossRef]
  6. Falkenburger, B.H.; Dickson, E.J.; Hille, B. Quantitative properties and receptor reserve of the DAG and PKC branch of Gq-coupled receptor signaling. J. Gen. Physiol. 2013, 141, 537–555. [Google Scholar] [CrossRef]
  7. Kim, C.; Cheng, C.Y.; Saldanha, S.A.; Taylor, S.S. PKA-I holoenzyme structure reveals a mechanism for cAMP-dependent activation. Cell 2007, 130, 1032–1043. [Google Scholar] [CrossRef]
  8. Chen-Goodspeed, M.; Lukan, A.N.; Dessauer, C.W. Modeling of Gαs and Gαi regulation of human type V and VI adenylyl cyclase. J. Biol. Chem. 2005, 280, 1808–1816. [Google Scholar] [CrossRef]
  9. Bradley, J.; Li, J.; Davidson, N.; Lester, H.A.; Zinn, K. Heteromeric olfactory cyclic nucleotide-gated channels: A subunit that confers increased sensitivity to cAMP. Proc. Natl. Acad. Sci. USA 1994, 91, 8890–8894. [Google Scholar] [CrossRef]
  10. Li, T.; Cao, C.; Yang, T.; Zhang, L.; He, L.; Xi, Z.; Bian, G.; Liu, N. A G-protein-coupled receptor regulation pathway in cytochrome P450-mediated permethrin-resistance in mosquitoes, Culex quinquefasciatus. Sci. Rep. 2015, 5, 17772. [Google Scholar] [CrossRef]
  11. Li, T.; Liu, N. The function of G-protein-coupled receptor-regulatory cascade in southern house mosquitoes (Diptera: Culicidae). J. Med. Entomol. 2018, 55, 862–870. [Google Scholar] [CrossRef] [PubMed]
  12. Audsley, N.; Down, R.E. G protein coupled receptors as targets for next generation pesticides. Insect Biochem. Mol. Biol. 2015, 67, 27–37. [Google Scholar] [CrossRef]
  13. Patel, M.V.; Hallal, D.A.; Jones, J.W.; Bronner, D.N.; Zein, R.; Caravas, J.; Husain, Z.; Friedrich, M.; Vanberkum, M.F. Dramatic expansion and developmental expression diversification of the methuselah gene family during recent Drosophila evolution. J. Exp. Zool. B Mol. Dev. Evol. 2012, 318, 368–387. [Google Scholar] [CrossRef] [PubMed]
  14. Song, W.; Ranjan, R.; Dawson-Scully, K.; Bronk, P.; Marin, L.; Seroude, L.; Lin, Y.J.; Nie, Z.; Atwood, H.L.; Benzer, S.; et al. Presynaptic regulation of neu rotransmission in Drosophila by the g protein-coupled receptor methuselah. Neuron 2002, 36, 105–119. [Google Scholar] [CrossRef]
  15. Lin, Y.-J.; Seroude, L.; Benzer, S. Extended life-span and stress resistance in the Drosophila mutant methuselah. Science 1998, 282, 943–946. [Google Scholar] [CrossRef]
  16. Wang, J.; Wang, Z.; Zhang, Z.; Hua, Q.; Wang, M.; Shi, C.; Xue, L.; Zhang, R.; Xie, X. Methuselah regulates longevity via dTOR: A pathway revealed by small-molecule ligands. J. Mol. Cell Biol. 2015, 7, 280–282. [Google Scholar] [CrossRef]
  17. Li, C.; Wu, W.; Sang, M.; Liu, X.; Hu, X.; Yun, X.; Li, B. Comparative RNA-sequencing analysis of mthl1 functions and signal transductions in Tribolium castaneum. Gene 2014, 547, 310–318. [Google Scholar] [CrossRef]
  18. Zhang, Z.Y.; Zhang, J.; Yang, C.J.; Lian, H.Y.; Yu, H.; Huang, X.M.; Cai, P. Coupling mechanism of electromagnetic field and thermal stress on Drosophila melanogaster. PLoS ONE 2016, 11, e0162675. [Google Scholar] [CrossRef]
  19. Furlong, M.J.; Wright, D.J.; Dosdall, L.M. Diamondback moth ecology and management: Problems, progress, and prospects. Annu. Rev. Entomol. 2013, 58, 517–541. [Google Scholar] [CrossRef]
  20. Tabashnik, B.E.; Huang, F.; Ghimire, M.N.; Leonard, B.R.; Siegfried, B.D.; Rangasamy, M.; Yang, Y.; Wu, Y.; Gahan, L.J.; Heckel, D.G.; et al. Efficacy of genetically modified Bt toxins against insects with different genetic mechanisms of resistance. Nat. Biotechnol. 2011, 29, 1128–1131. [Google Scholar] [CrossRef]
  21. You, M.; Yue, Z.; He, W.; Yang, X.; Yang, G.; Xie, M.; Zhan, D.; Baxter, S.W.; Vasseur, L.; Gurr, G.M.; et al. A heterozygous moth genome provides insights into herbivory and detoxification. Nat. Genet. 2013, 45, 220–225. [Google Scholar] [CrossRef]
  22. Xu, P.; Lu, B.; Xiao, H.; Fu, X.; Murphy, R.W.; Wu, K. The evolution and expression of the moth visual opsin family. PLoS ONE 2013, 8, e78140. [Google Scholar] [CrossRef]
  23. Lee, D.W.; Shrestha, S.; Kim, A.Y.; Park, S.J.; Yang, C.Y.; Kim, Y.; Koh, Y.H. RNA interference of pheromone biosynthesis activating neuropeptide receptor suppresses mating behavior by inhibiting sex pheromone production in Plutella xylostella (L.). Insect Biochem. Mol. Biol. 2011, 41, 236–243. [Google Scholar] [CrossRef]
  24. Yin, F.; Lin, Q.; Wang, X.; Li, Z.; Feng, X.; Shabbir, M.Z. The glutathione S-transferase (PxGST2L) may contribute to the detoxification metabolism of chlorantraniliprole in Plutella xylostella (L.). Ecotoxicology 2021, 30, 1007–1016. [Google Scholar] [CrossRef]
  25. Zolfaghari, M.; Yin, F.; Jurat-Fuentes, J.L.; Xiao, Y.; Peng, Z.; Wang, J.; Yang, X.; Li, Z.-Y. Effects of Bacillus thuringiensis Treatment on Expression of Detoxification Genes in Chlorantraniliprole-Resistant Plutella xylostella. Insects 2024, 15, 595. [Google Scholar] [CrossRef]
  26. Zolfaghari, M.; Ghadamyari, M.; Sajedi, R.H. Resistance Mechanisms of a Field Population of Diamondback Moth, Plutella xylostella (Lepidoptera: Plutellidae), to Current Organophosphate Pesticides. J. Crop Prot. 2019, 8, 403–416. [Google Scholar]
  27. Tabashnik, T.; Cushing, N. Leaf residue vs. topical bioassays for assessing insecticide resistance in the diamond-back moth, Plutella xylostella L. FAO Plant Prot. Bull. 1987, 35, 11–14. [Google Scholar]
  28. Kahsay, R.Y.; Gao, G.; Liao, L. An improved hidden Markov model for transmembrane protein detection and topology prediction and its applications to complete genomes. Bioinformatics 2005, 21, 1853–1858. [Google Scholar] [CrossRef]
  29. Horton, P.; Park, K.-J.; Obayashi, T.; Fujita, N.; Harada, H.; Adams-Collier, C.; Nakai, K. WoLF PSORT: Protein localization predictor. Nucleic Acids Res. 2007, 35, W585–W587. [Google Scholar] [CrossRef] [PubMed]
  30. Tamura, K.; Peterson, D.; Peterson, N.; Stecher, G.; Nei, M.; Kumar, S. MEGA5: Molecular evolutionary genetics analysis using maximum likelihood, evolutionary distance, and maximum parsimony methods. Mol. Biol. Evol. 2011, 28, 2731–2739. [Google Scholar] [CrossRef]
  31. Chen, C.; Chen, H.; Zhang, Y.; Thomas, H.R.; Frank, M.H.; He, Y.; Xia, R. TBtools: An integrative toolkit developed for interactive analyses of big biological data. Mol. Plant 2020, 13, 1194–1202. [Google Scholar] [CrossRef]
  32. Chao, J.; Li, Z.; Sun, Y.; Aluko, O.O.; Wu, X.; Wang, Q.; Liu, G. MG2C: A user-friendly online tool for drawing genetic maps. Mol. Hortic. 2021, 1, 16. [Google Scholar] [CrossRef] [PubMed]
  33. Guo, A.-Y.; Zhu, Q.-H.; Chen, X.; Luo, J.-C. GSDS: A gene structure display server. Yi Chuan Hered. 2007, 29, 1023–1026. [Google Scholar] [CrossRef]
  34. Bailey, T.L.; Williams, N.; Misleh, C.; Li, W.W. MEME: Discovering and analyzing DNA and protein sequence motifs. Nucleic Acids Res. 2006, 34, W369–W373. [Google Scholar] [CrossRef] [PubMed]
  35. Teufel, F.; Almagro Armenteros, J.J.; Johansen, A.R.; Gíslason, M.H.; Pihl, S.I.; Tsirigos, K.D.; Winther, O.; Brunak, S.; Von Heijne, G.; Nielsen, H. SignalP 6.0 predicts all five types of signal peptides using protein language models. Nat. Biotechnol. 2022, 40, 1023–1025. [Google Scholar] [CrossRef]
  36. Duckert, P.; Brunak, S.; Blom, N. Prediction of proprotein convertase cleavage sites. Protein Eng. Des. Sel. 2004, 17, 107–112. [Google Scholar] [CrossRef]
  37. Rinkevich, F.D.; Scott, J.G. Reduction of dADAR activity affects the sensitivity of Drosophila melanogaster to spinosad and imidacloprid. Pestic. Biochem. Physiol. 2012, 104, 163–169. [Google Scholar] [CrossRef]
  38. Cao, C.; Sun, L.; Du, H.; Moural, T.W.; Bai, H.; Liu, P.; Zhu, F. Physiological functions of a methuselah-like G protein coupled receptor in Lymantria dispar Linnaeus. Pestic. Biochem. Physiol. 2019, 160, 1–10. [Google Scholar] [CrossRef]
  39. Sun, L.; Liu, P.; Zhang, C.; Du, H.; Wang, Z.; Moural, T.W.; Zhu, F.; Cao, C. Ocular albinism type 1 (OA1) regulates deltamethrin tolerance in Lymantria dispar and Drosophila melanogaster. Front. Physiol. 2019, 10, 766. [Google Scholar] [CrossRef]
  40. Yu, Y.; Zhou, P.; Zhang, J.; Zheng, C.; Zhang, J.; Chen, N. Pheromone-binding proteins in the Asian gypsy moth females, Lymantria dispar, recognizing the sex pheromone and plant volatiles. Arch. Insect Biochem. Physiol. 2018, 99, e21477. [Google Scholar] [CrossRef]
  41. Xu, J.; Wang, X.F.; Chen, P.; Liu, F.T.; Zheng, S.C.; Ye, H.; Mo, M.H. RNA interference in moths: Mechanisms, applications, and progress. Genes 2016, 7, 88. [Google Scholar] [CrossRef]
  42. Kim, Y.H.; Issa, M.S.; Cooper, A.M.; Zhu, K.Y. RNA interference: Applications and advances in insect toxicology and insect pest management. Pestic. Biochem. Physiol. 2015, 120, 109–117. [Google Scholar] [CrossRef]
  43. Lin, W.; Yu, Y.; Zhou, P.; Zhang, J.; Dou, L.; Hao, Q.; Chen, H.; Zhu, S. Identification and knockdown of the olfactory receptor (OrCo) in gypsy moth, Lymantria dispar. Int. J. Biol. Sci. 2015, 11, 772–780. [Google Scholar] [CrossRef]
  44. Terenius, O.; Papanicolaou, A.; Garbutt, J.S.; Eleftherianos, I.; Huvenne, H.; Kanginakudru, S.; Albrechtsen, M.; An, C.; Aymeric, J.L.; Barthel, A.; et al. RNA interference in Lepidoptera: An overview of successful and unsuccessful studies and implications for experimental design. J. Insect Physiol. 2011, 57, 231–245. [Google Scholar] [CrossRef]
  45. Li, C.; Zhang, Y.; Yun, X.; Wang, Y.; Sang, M.; Liu, X.; Hu, X.; Li, B. Methuselah-like genes affect development, stress resistance, lifespan and reproduction in Tribolium castaneum. Insect Mol. Biol. 2014, 23, 587–597. [Google Scholar] [CrossRef] [PubMed]
  46. Gimenez, L.E.; Ghildyal, P.; Fischer, K.E.; Hu, H.; Ja, W.W.; Eaton, B.A.; Wu, Y.; Austad, S.N.; Ranjan, R. Modulation of methuselah expression targeted to Drosophila insulin-producing cells extends life and enhances oxidative stress resistance. Aging Cell 2013, 12, 121–129. [Google Scholar] [CrossRef]
  47. Friedrich, M.; Jones, J.W. Gene ages, nomenclatures, and functional diversification of the Methuselah/Methuselah—Like GPCR family in Drosophila and Tribolium. J. Exp. Zool. Part B 2016, 326, 453–463. [Google Scholar] [CrossRef]
  48. Li, C.; Chen, M.; Sang, M.; Liu, X.; Wu, W.; Li, B. Comparative genomic analysis and evolution of family-B G protein-coupled receptors from six model insect species. Gene 2013, 519, 1–12. [Google Scholar] [CrossRef] [PubMed]
  49. Shabbir, S.; Deng, M.-G.; Nawaz, M.; Lin, Q.-S. Genome-Wide Identification of G-Protein Coupled Receptors (GPCRs) and Their Expression Profile in Response to β-Cypermethrin Stress in Zeugodacus cucurbitae. Pestic. Biochem. Physiol. 2024, 202, 105919. [Google Scholar] [CrossRef] [PubMed]
  50. Li, C.; Song, X.; Chen, X.; Liu, X.; Sang, M.; Wu, W.; Yun, X.; Hu, X.; Li, B. Identification and comparative analysis of G protein-coupled receptors in Pediculus humanus humanus. Genomics 2014, 104, 58–67. [Google Scholar] [CrossRef]
  51. Pandey, A.; Khatoon, R.; Saini, S.; Vimal, D.; Patel, D.K.; Narayan, G.; Chowdhuri, D.K. Efficacy of methuselah gene mutation toward tolerance of dichlorvos exposure in Drosophila melanogaster. Free Radic. Biol. Med. 2015, 83, 54–65. [Google Scholar] [CrossRef]
  52. Rosenbaum, D.M.; Rasmussen, S.G.; Kobilka, B.K. The structure and function of G-protein-coupled receptors. Nature 2009, 459, 356–363. [Google Scholar] [CrossRef]
  53. Despres, L.; David, J.P.; Gallet, C. The evolutionary ecology of insect resistance to plant chemicals. Trends Ecol. Evol. 2007, 22, 298–307. [Google Scholar] [CrossRef]
  54. Liu, N.; Zhu, F.; Xu, Q.; Pridgeon, J.W.; Gao, X. Behavioral change, physiological modification, and metabolic detoxification: Mechanisms of insecticide resistance. Acta Entomol. Sin. 2006, 49, 671–679. [Google Scholar]
  55. Ranson, H.; Claudianos, C.; Ortelli, F.; Abgrall, C.; Hemingway, J.; Sharakhova, M.V.; Unger, M.F.; Collins, F.H.; Feyereisen, R. Evolution of supergene families associated with insecticide resistance. Science 2002, 298, 179–181. [Google Scholar] [CrossRef]
  56. Zhu, F.; Gujar, H.; Gordon, J.R.; Haynes, K.F.; Potter, M.F.; Palli, S.R. Bed bugs evolved unique adaptive strategy to resist pyrethroid insecticides. Sci. Rep. 2013, 3, 1456. [Google Scholar] [CrossRef]
  57. Zhu, F.; Moural, T.W.; Shah, K.; Palli, S.R. Integrated analysis of cytochrome P450 gene superfamily in the red flour beetle, Tribolium castaneum. BMC Genom. 2013, 14, 174. [Google Scholar] [CrossRef]
  58. Feyereisen, R. Insect CYP genes and P450 enzymes. In Insect Molecular Biology and Biochemistry; Gilbert, L.I., Ed.; Elsevier Academic Press: Cambridge, MA, USA, 2012; pp. 236–316. [Google Scholar]
  59. Liu, N.; Zhu, F. House fly cytochrome P450s: Their role in insecticide resistance and strategies in the isolation and characterization. In Recent Advances in Entomological Research; Liu, T., Kang, L., Eds.; Higher Education Press: Beijing, China; Springer: Berlin/Heidelberg, Germany, 2011; pp. 246–257. [Google Scholar]
  60. Zhu, F.; Parthasarathy, R.; Bai, H.; Woithe, K.; Kaussmann, M.; Nauen, R.; Harrison, D.A.; Palli, S.R. A brain-specific cytochrome P450 responsible for the majority of deltamethrin resistance in the QTC279 strain of Tribolium castaneum. Proc. Natl. Acad. Sci. USA 2010, 107, 8557–8562. [Google Scholar] [CrossRef] [PubMed]
  61. Zhu, F.; Liu, N. Differential expression of CYP6A5 and CYP6A5v2 in pyrethroid resistant house flies, Musca domestica. Arch. Insect Biochem. Physiol. 2008, 67, 107–119. [Google Scholar] [CrossRef] [PubMed]
  62. Scott, J.G.; Liu, N.; Wen, Z. Insect cytochromes P450: Diversity, insecticide resistance and tolerance to plant toxins. Comp. Biochem. Physiol. Part C Pharmacol. Toxicol. Endocrinol. 1998, 121, 147–155. [Google Scholar] [CrossRef] [PubMed]
  63. Sun, L.; Wang, Z.; Zou, C.; Cao, C. Transcription profiling of 12 Asian gypsy moth (Lymantria dispar) cytochrome P450 genes in response to insecticides. Arch. Insect Biochem. Physiol. 2014, 85, 181–194. [Google Scholar] [CrossRef]
  64. Sun, Y.; Zou, P.; Yu, X.Y.; Chen, C.; Yu, J.; Shi, L.N.; Hong, S.C.; Zhou, D.; Chang, X.L.; Wang, W.J.; et al. Functional characterization of an arrestin gene on insecticide resistance of Culex pipiens pallens. Parasites Vectors 2012, 5, 134. [Google Scholar] [CrossRef] [PubMed]
  65. Li, T.; Liu, L.; Zhang, L.; Liu, N. Role of G-protein-coupled receptor-related genes in insecticide resistance of the mosquito, Culex quinquefasciatus. Sci. Rep. 2014, 4, 6474. [Google Scholar] [CrossRef] [PubMed]
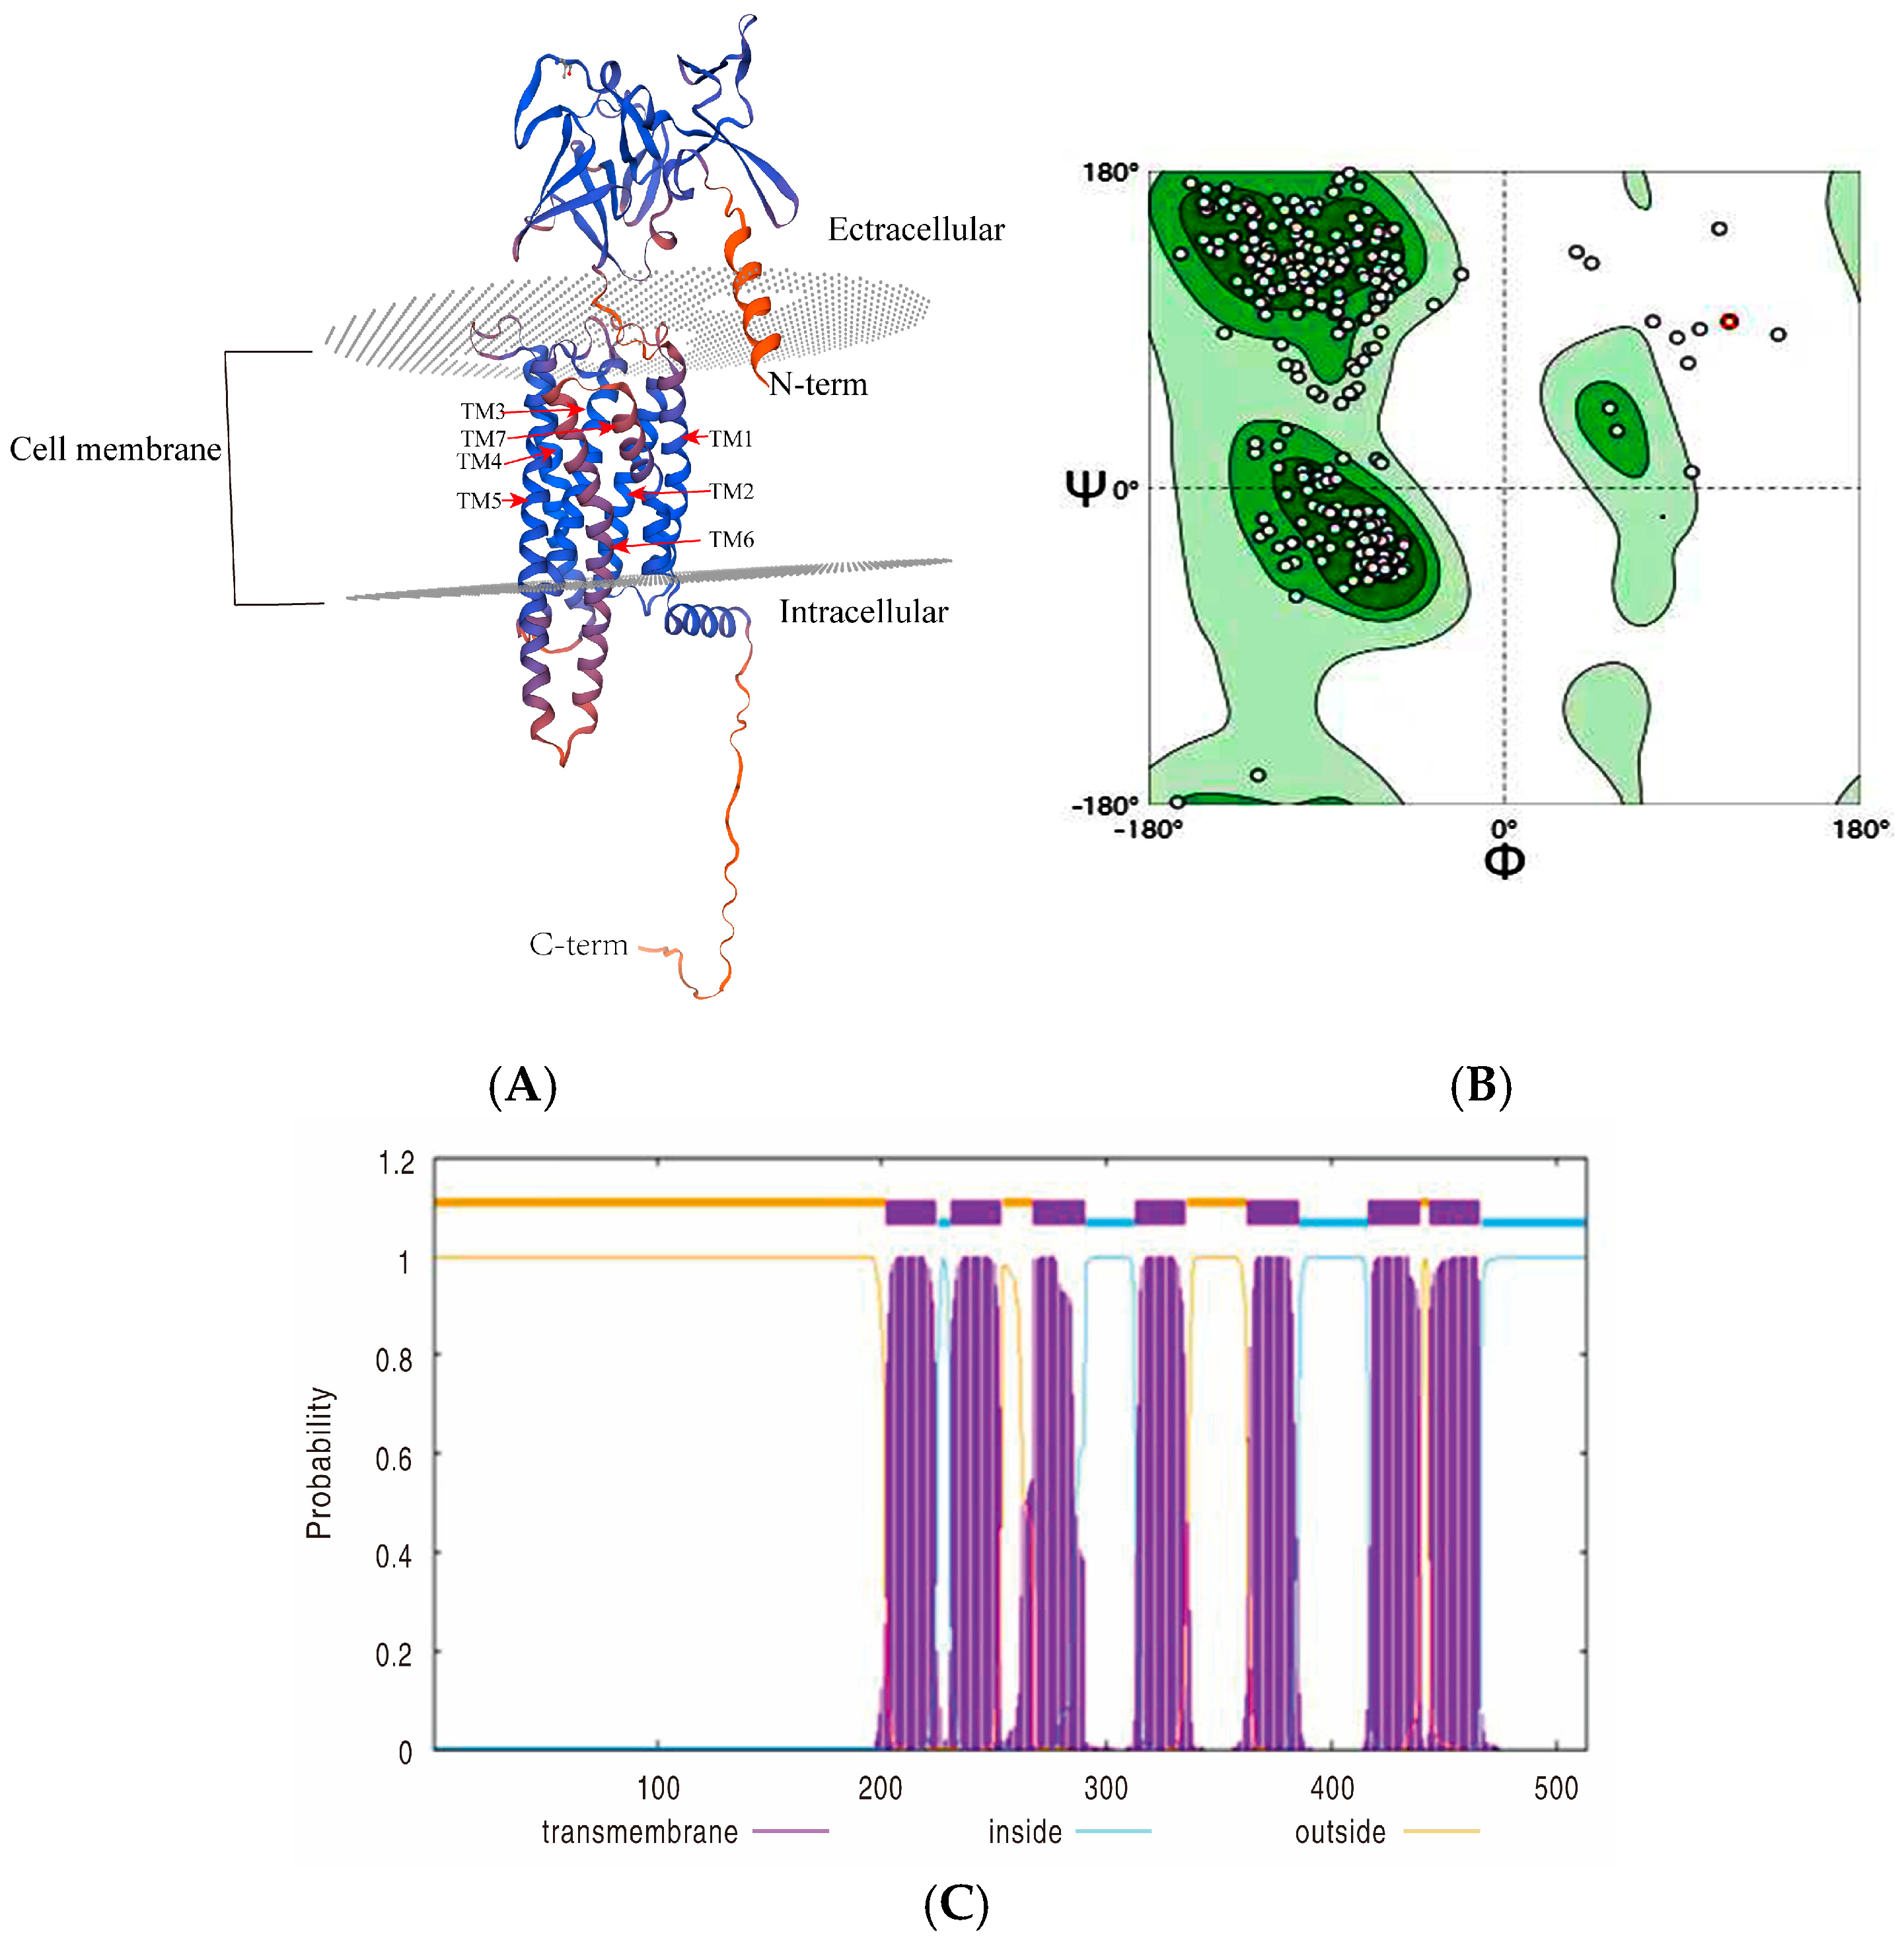
Figure 1. (A) Ribbon diagram displaying the global structure of PxMth2 dividing the intracellular and extracellular domains, the transmembrane regions (TM1–TM4) span the cell membrane, with the N-terminal facing the extracellular space and the C-terminal located intracellularly. Figures were generated using the molecular viewing program Swiss Model. (B) Confirmation of Mth2 protein in P. xylostella via Ramachandran plots and 3D verification via the SWISS-MODEL, Ramachandran plot showcases the allowed and favored regions for backbone dihedral angles, as well as the phi and psi bonds (Φ and Ψ) of amino acids in a protein structure. The green areas indicate highly favored conformations, while the gray dots represent individual residues, and the red dot highlights a specific outlier. (C) TMHMM posterior probabilities for PxMth2 (XP_037971181.2) illustrating predicted transmembrane regions (purple), intracellular regions (blue), and extracellular regions (orange) along the protein sequence, Peaks and plateaus highlight the distinct topology across the sequence length (1–500 amino acids).
Insects 16 01092 g001
Figure 2. Structural and phylogenic analysis of PxMth2 (XM_038115253.2). P. xylostella (PxMth2), Trichoplusia ni (TnMth2), Cydia pomonella (CpMth2), Pieris napi (PnMth2), Drosophila melanogaster (DmMth), Bombix mori (BmMth), and Musca domestica (MdMth2). The alpha helix, beta sheet, random coil, and beta turn are identical to α, β, η and T, respectively. Conserved residues are highlighted in red, and the intensity of shading indicates the degree of conservation.
Insects 16 01092 g002
Figure 3. Phylogenetic tree displaying Mths receptors from D. melanogaster, M. domestica, P. xylostella, and B. mori, generated using the neighbor-joining method. Receptors from P. xylostella, M. domestica, D. melanogaster, and B. mori are highlighted in pink, yellow, green, and brown, respectively. The scale bar indicates p-distance (A). Domain analysis for Mth genes. The CDD database identified the conserved domain structures of 8 Mth genes from P. xylostella. Purple boxes represent the Mths domain (B).
Insects 16 01092 g003
Figure 4. (A) Sequences of the ten motifs identified by MEME (https://github.com/cinquin/MEME?utm_source=chatgpt.com, accessed on 1 May 2025), (B) Venn diagram illustrating motif distribution across domains, with the number of conserved domains limited to a maximum of ten, and (C) Signal peptide 6.0 prediction for the G-protein-coupled Mth2 isoform X2 from P. xylostella. The graph displays the probability of signal peptide regions: Sec/SPI n-region (red), h-region (orange), c-region (yellow), and cleavage site (CS, green dashed line). The sequence prediction highlights the presence of a signal peptide, aiding in functional localization analysis.
Insects 16 01092 g004
Figure 5. The Mth gene structure analysis of P. xylostella. Untranslated 5-3 regions (UTR), exons, and introns are displayed in the legend on the right-hand side. Green color (UTR), yellow color (Exon) and the line between Exones part is Intron.
Insects 16 01092 g005
Figure 6. The expression levels of GPCR genes quantified by the 2^(−∆∆Ct) technique. Bars indicate the relative expression levels of GPCR genes, with statistical comparisons to the control group conducted using Student’s t-test (** p < 0.01, and *** p < 0.001). GPCR genes with relative expression values ≥ 1 are classified as upregulated, while those with values < 1 are grouped as downregulated.
Insects 16 01092 g006
Figure 7. (A) Mth gene expression at LC30 in strains susceptible and resistant to chlorantraniliprole, (B) expression at the LC50 level, and (C) a heat map displaying log2-transformed FPKM values for the expression profiles of Mth genes across different Mth genes of the CAP-resistant strain. The 2^(−∆∆Ct) technique was applied to quantify gene expression, and bars were employed to show relative expression. Student’s t-test was utilized for statistical comparisons to the control; ** p < 0.01, *** p < 0.001. High to low expression is marked by red to blue (C).
Insects 16 01092 g007aInsects 16 01092 g007b
Figure 8. Pxmth2 relative expression (A) and mortality percentage (B) in resistant strain larvae after Pxmth2 RNAi; GFP: green fluorescent protein; DsRNA: double-stranded RNA. Significant differences were indicated by various letters above the bars, and statistical differences were evaluated using a t-test (p < 0.05). ** denotes a highly significant difference at p < 0.01.
Insects 16 01092 g008
Figure 9. Impact of Pxmth2 RNAi on stress resistance gene expression. Twenty-four hours after Pxmth2 RNAi treatment, the relative mRNA levels of P. xylostella genes were assessed, normalized to RPL32 expression, and contrasted with levels after GFP RNAi treatment. The data are shown as means ± SE (n = 3). A t-test (p < 0.05) was employed to find statistical significance between the treatment and control (dsGFP) groups; significant differences were identified by various letters above the bars. ** denotes a highly significant difference at p < 0.01.
Insects 16 01092 g009
Figure 10. Survival rate of D. melanogaster lines following CAP exposure. Red line indicates control strain (w1118), and blue line indicates transgenic UAS-Pxmth2 flies. Survival was recorded at 12 h intervals up to 48 h post-treatment.
Insects 16 01092 g010
Table 1. Identified candidate Mth genes in P. xylostella based on a comparison with known Mth genes in Bombyx mori, D. melanogaster, and Musca domestica. Details come from publicly available databases (see text for details).
Gene IDRenameChrStartEndStrandA.AExonIntronMW (kDs)PIGRAVY
LOC105382322PXMTH1254,719,6314,726,549F4939856.676.230.326
LOC119693055PXMTH283,392,3363,414,747R51410957.18.050.215
LOC105397179PXMTH3254,705,0514,71,5964F4079845.867.810.434
LOC105392921PXMTH447,187,7857,198,855F7159879.827.650.002
LOC105382325PXMTH5254,680,7204,685,582F4238747.148.130.365
LOC105383750PXMTH682,418,3432,433,086F5659864.677.990.081
LOC119693713PXMTH710148,466152,815F5832159.848.760.408
LOC105380334PXMTH888,697,7408,754,344R66610974.428.39−0.019
Table 2. Toxicity bioassay of chlorantraniliprole on P. xylostella.
InsecticidePopulationN aLC50 (mg/L)95% CI of LC50 bX2 (df) cRR d
ChlorantraniliproleResistant15063.246.66-70.20.90 (3)42.1
Control1501.50.8-2.30.90 (3)1
a The overall number of insects used at all concentrations. b A 95% confidence interval. c Chi-square test with those in brackets demonstrating the degree of freedom. d RR: Resistance ratio = LC50 of the susceptible population/LC50 of the resistant population.
Table 3. Toxicity bioassay of chlorantraniliprole on Transgenic and Wild-Type Drosophila melanogaster.
InsecticidePopulationN aLC50 (mg/L)95% CI of LC50 bX2 (df) cRR d
chlorantraniliproleTransgenic Drosophila4200.70.6–17 (4)2.9
Control (WT)4200.240.21–0.281.57 (4)1
a Total number of insects tested across all concentrations. b Values represent the 95% confidence interval. c Chi-square test results, with degrees of freedom indicated in parentheses. d RR (Resistance Ratio) calculated as LC50 of the susceptible/control strain divided by the LC50 of the transgenic Drosophila strain.
Disclaimer/Publisher’s Note: The statements, opinions and data contained in all publications are solely those of the individual author(s) and contributor(s) and not of MDPI and/or the editor(s). MDPI and/or the editor(s) disclaim responsibility for any injury to people or property resulting from any ideas, methods, instructions or products referred to in the content.