Article

Assessment of Suitable Reference Genes for qRT-PCR Normalization in Eocanthecona furcellata (Wolff)

Guizhou Provincial Key Laboratory for Agricultural Pest Management of Mountainous Regions, Institute of Entomology, Guizhou University, Guiyang 550025, China
*
Author to whom correspondence should be addressed.
Insects 2022, 13(9), 773; https://doi.org/10.3390/insects13090773
Submission received: 21 June 2022 / Revised: 24 August 2022 / Accepted: 25 August 2022 / Published: 26 August 2022
(This article belongs to the Section Insect Molecular Biology and Genomics)

Abstract

:

Simple Summary

Eocanthecona furcellata (Wolff) is an important polyphagous predatory natural enemy insect for agriculture and forestry production. In this paper, we screened nine commonly used reference genes β-1-TUB, RPL4, RPL32, RPS17, RPS25, SDHA, GAPDH2, EF2, and UBQ. Five methods, Ct value, geNorm, NormFinder, BestKeeper, and RefFinder, were used to assess the stability of gene expression at different developmental stages, in different tissues of male and female adults, under different temperatures and starvation treatments. Finally, stable reference genes were screened under different experimental conditions, which laid the foundation for further study of E. furcellata gene function.

Abstract

Quantitative reverse transcription–polymerase chain reaction (qRT–PCR) is a widely used tool for measuring gene expression; however, its accuracy relies on normalizing the data to one or more stable reference genes. Eocanthecona furcellata (Wolff) is a polyphagous predatory natural enemy insect that preferentially feeds on more than 40 types of agricultural and forestry pests, such as those belonging to the orders Lepidoptera, Coleoptera, and Hymenoptera. However, to our knowledge, the selection of stable reference genes has not been reported in detail thus far. In this study, nine E. furcellata candidate reference genes (β-1-TUB, RPL4, RPL32, RPS17, RPS25, SDHA, GAPDH2, EF2, and UBQ) were selected based on transcriptome sequencing results. The expression of these genes in various samples was examined at different developmental stages, in the tissues of male and female adults, and after temperature and starvation treatments. Five algorithms were used, including ΔCt, geNorm, NormFinder, BestKeeper, and RefFinder, to evaluate reference gene expression stability. The results revealed that the most stable reference genes were RPL32 and RPS25 at different developmental stages; RPS17, RPL4, and EF2 for female adult tissue samples; RPS17 and RPL32 for male adult tissue samples; RPS17 and RPL32 for various temperature treatments of nymphs; RPS17 and RPS25 for nymph samples under starvation stress; and RPS17 and RPL32 for all samples. Overall, we obtained a stable expression of reference genes under different conditions in E. furcellata, which provides a basis for future molecular studies on this organism.

1. Introduction

Eocanthecona furcellata (Wolff) is an excellent natural enemy of pests, with predatory capabilities shared by both nymphs and adults [1]. Its abilities are large and diverse, and it can feed on more than 40 types of agriculture and forestry pests, especially those of the order Lepidoptera [2,3,4]. E. furcellata may be readily reared in the laboratory and can form large populations. Thus, it is an important natural enemy insect used for biological control [5]. Currently, several studies on E. furcellata have focused on its biological characteristics, predatory function, and artificial feeding; however, molecular studies are lacking. In recent years, with the advent of high-throughput sequencing, the transcriptome of E. furcellata has been established, which provides a basis for studying its biology and physiology at the molecular level in terms of characterization and function.
Quantitative reverse transcription-polymerase chain reaction (qRT-PCR) is widely used in molecular biology to measure gene expression. It is a rapid and efficient technique with high simplicity and reproducibility, and has the advantages of high sensitivity toward a low concentration of target genes and a high specificity for target genes [6,7]. However, the accuracy of qRT-PCR is influenced by various factors, such as RNA extraction, cDNA synthesis, PCR amplification efficiency, and the stability of the reference or housekeeping genes [8]. Therefore, one or more relatively stable housekeeping genes are required as reference when using qRT-PCR to measure gene expression. Ideal reference genes may be stably expressed in various tissues and cells and under diverse experimental conditions, yet such ideal genes may not exist [9]. With the available molecular techniques, we can find the corresponding stably expressed reference genes for specific conditions. At present, however, there are no relevant studies on the expression stability of reference genes for E. furcellata.
Therefore, this study aimed to evaluate and select reference genes that are stably expressed under different conditions in E. furcellata. To avoid the effects of co-regulation, this study utilized transcriptome sequencing to identify tubulin beta-1 (β-1-TUB), 60S ribosomal protein L32 (RPL32), 60S ribosomal protein L4 (RPL4), succinate dehydrogenase (SDHA), 40S ribosomal protein S17 (RPS17), 40S ribosomal protein S25 (RPS25), glyceraldehyde-3-phosphate dehydrogenase 2 (GAPDH2), elongation factor 2 (EF2), and ubiquitin (UBQ) 9 as housekeeping genes, which were selected from different functional classes and gene families. The expression stability of these candidate genes was also analyzed at different developmental stages, in the tissues of male and female adults, and under different temperature and starvation time treatments using five algorithms, including ΔCt, geNorm version 3.5 (https://genorm.cmgg.be/), NormFinder version 0.953 (http://moma.dk/normfinder-software), BestKeeper version 1.0 (http://www.gene-quantification.de/bestkeeper.html), and RefFinder (http://blooge.cn/RefFinder/) [10,11,12,13,14]. This study provides a preliminary comprehensive evaluation of reference genes for E. furcellata under various conditions, which will be useful for subsequent gene expression and function studies.

2. Materials and Methods

2.1. Insect Rearing

E. furcellata was reared in the laboratory at the Institute of Entomology, Guizhou University. Male and female adults were matched 1:1 in a rearing box (15.2 cm length × 9.9 cm width × 6.3 cm height), and the eggs were placed in a small rearing box (top inner diameter 6.0 cm × bottom inner diameter 4.8 cm × and height 3.3 cm) after spawning. After the eggs hatched, they were transferred to a different rearing box (15.2 cm length × 9.9 cm width × 6.3 cm height), and reared on Tenebrio molitor pupae until they fledged into adults. Wet cotton balls were placed in the rearing box to maintain humidity. All rearing was carried out in an artificial climate chamber under conditions of 26 ± 0.5 °C, 60–70% relative humidity, and a photoperiod of 16/8 h = L/D.

2.2. Experimental Conditions

2.2.1. Development Stages

Samples of E. furcellata at different developmental stages were collected from 1-day-old first-fifth instar nymphs and 2-day-old adult males and females. Three biological replicates were set up for each stage and each replicate, including 20 first instar nymphs, 10 second instar nymphs, 5 third instar nymphs, 3 fourth instar nymphs, 3 fifth instar nymphs, 3 female adults, and 3 male adults. The collected samples were placed in 2.0 mL Eppendorf (EP) tubes, rapidly frozen with liquid nitrogen, and stored in an ultra-low temperature refrigerator at −80 °C.

2.2.2. Different Tissues

The antennae, heads (with antennae removed), thorax, abdomen, legs, and wings of 2-day-old healthy male and female adults were collected separately as different tissue samples. Three biological replicates were set up for each tissue sample, with a minimum of five insects per tissue group. The collected samples were placed in 2.0 mL EP tubes, rapidly frozen with liquid nitrogen, and stored in an ultra-low temperature refrigerator at −80 °C.

2.2.3. Temperature Treatment

Three biological replicates were set up for each treatment. Five 1-day-old E. furcellata nymphs of the 3rd instar were collected from each replicate as sample representing different temperature treatments. The sample were stimulated for 2 h at 4 °C, 26 °C, 37 °C and 42 °C and subsequently allowed to recover at 26 °C for 30 min with T. molitor pupae. The collected samples were placed in 2.0 mL EP tubes, rapidly frozen with liquid nitrogen, and stored in an ultra-low temperature refrigerator at −80 °C.

2.2.4. Starvation Treatment

Three biological replicates, each including 5 1-day-old E. furcellata nymphs of the 3rd instar, were set up for starvation treatment. The nymphs were starved for 0, 6, 12, and 24 h and collected as samples representing different starvation time treatments. The collected samples were placed in 2.0 mL EP tubes, rapidly frozen with liquid nitrogen, and stored in an ultra-low temperature refrigerator at −80 °C.

2.3. Total RNA Extraction and cDNA Synthesis

Total RNA was extracted from all samples using the OMEGA E.Z.N.A.TM HP Total RNA Kit (Omega Bio-Tek, Norcross, GA, USA) according to the manufacturer’s instructions. The concentration and quality of the RNA were determined using a NanoPhotometerTMP-Class spectrophotometer ((Thermo Fisher Scientific, Waltham, MA, USA). The GenStar StarScript II First-strand cDNA Synthesis Mix With gDNA Remover kit (GenStar, Beijing China) was used for 1st-strand cDNA synthesis.

2.4. Candidate Reference Gene Selection and Primer Design

Based on the results of a homology search of these genes, nine housekeeping gene sequences—β-1-TUB, RPL4, RPL32, RPS17, RPS25, SDHA, GAPDH2, EF2, and UBQ—were annotated from the transcriptome data of the E. furcellata nymphs, and the above housekeeping genes were named according to the Blast best match terms. Primer Premier 6.0 software (PREMIER Biosoft International, Palo Alto, CA, USA) was used to design gene-specific primers, and after obtaining specific bands by PCR amplification, they were cloned, sequenced, and compared to determine the exact candidate reference gene sequences. To detect the amplification specificity, amplification efficiency, and coefficient of determination (R2) of the standard curve for each primer pair (Table 1), the cDNA obtained in Section 2.3 was used as the template to plot the melting curve for each primer pair with the standard curve of the amplification at serial concentrations using a qRT-PCR instrument.

2.5. qRT-PCR

All qRT-PCR reactions were performed using a CFX-96 real-time PCR system (BioRad, Hercules, CA, USA) with the GenStar 2 × RealStar Green Fast Mixture. Each 20 μL reaction consisted of 10 μL of 2 × RealStar Green Fast Mixture (GenStar), 1 μL cDNA template, 0.5 μL for forward and reverse primer (10 μmol/L), and 8 μL RNase-Free ddH2O. qRT-PCR was performed under the following conditions: denaturation at 95 °C for 2 min, followed by 40 cycles of dissociation at 95 °C for 15 s, annealing at 55 °C for 30 s, and extension 72 °C for 30 s. Three biological replicates and three technical replicates were set up for each sample.

2.6. Data Analysis

Cycle threshold (Ct) values were obtained for all biological replicates to calculate Ct averages, and the subsequent analysis was performed using the Ct averages obtained for each gene. Nine candidate reference genes were evaluated for expression stability using five methods: ∆Ct, BestKeeper, geNorm, NormFinder, and RefFinder. These different analytical methods focused on different factors. The ∆Ct method estimates the relative expression of paired genes for each sample, and the lower the mean standard deviation (SD) value, the more stably expressed the reference gene [10]. BestKeeper is used to assess the expression stability of genes by obtaining a correlation coefficient (r), SD, and coefficient of variation (CV) of the pairs generated between each gene. For this program, the larger the correlation coefficient, the smaller the SD and CV, and the more stably expressed the reference gene [13]. The geNorm program ranks gene expression stability by calculating the expression stability value (M) for each reference gene, judged by the criterion that the smaller the M value, the more stably expressed the reference gene. Simultaneously, the variance value (V) of the two comparisons is obtained based on the pairwise difference analysis of the standardization factor of the reference genes, and the optimal number of required reference genes is determined by the formula Vn/n+1. When Vn/n+1 < 0.15, the most suitable number of reference genes is n, and there is no need to introduce the nth+1st reference gene for normalization correction. However, if Vn/n+1 > 0.15, it is necessary to add the nth+1st reference gene for normalization correction [11]. The computational principle of NormFinder is similar to that of geNorm. NormFinder uses an analysis of variance (ANOVA)-based model to evaluate the variation in the variation in the expression of candidate reference genes to obtain the stability value of reference gene expression. It then filters the most suitable reference genes based on the stability value, and the smaller the stability value, the more stable the gene expression [12]. Finally, the online software RefFinder was used to comprehensively evaluate the gene expression stability obtained from the above four methods and find the geometric mean to ultimately obtain a comprehensive ranking index [14].

2.7. Validation of Selected Reference Gene

In insects, odor-binding proteins (OBPs), which are acidic proteins, are generally found in the lymphatic fluid of the antenna sensor [15]. OBPs bind to odor molecules from the environment and transport them to odorant receptor proteins on the dendritic membrane of olfactory neurons [16]. To evaluate the effectiveness of reference gene screening, different tissues of adult male E. furcellata were used to verify the selected reference genes. E. furcellata’s EfurOBP11 (accession no. ON505075) was used as the target gene to verify the expression stability of the reference gene (EfurOBP11, F: 5′-CTGTCTCCTGGCTATGGTCTT-3′, R: 5′-CTTCCCGTGTGATTTCTGCTAT-3′). According to the comprehensive ranking obtained from geNorm and RefFinder analysis, the optimal reference gene combination (RPS17 and RPL32), the most stably expressed reference gene (RPS17), the second most stably expressed gene (RPL32), and the least stably expressed gene (β-1-TUB) were selected for standardization of the relative expression level of the target gene. qRT–PCR was performed as described above and the resulting data were analyzed using the 2−∆∆CT method [17]. One-way ANOVA was used, followed by multiple comparison with Tukey’s to determine the statistical significance. Statistical differences are denoted by different letters.

3. Results

3.1. Amplification Efficiency of Primers

E. furcellata cDNA was used as a template after 10-fold serial dilution, and the amplification efficiency of each reference gene ranged 93.7–104.8%, with a correlation coefficient (R2) value greater than 0.990. This indicates that the primers for each candidate reference gene were reasonably designed, with good amplification efficiency and specificity. Thus, they met the requirements of fluorescence quantitative analysis and were suitable for subsequent quantitative assays (Table 1).

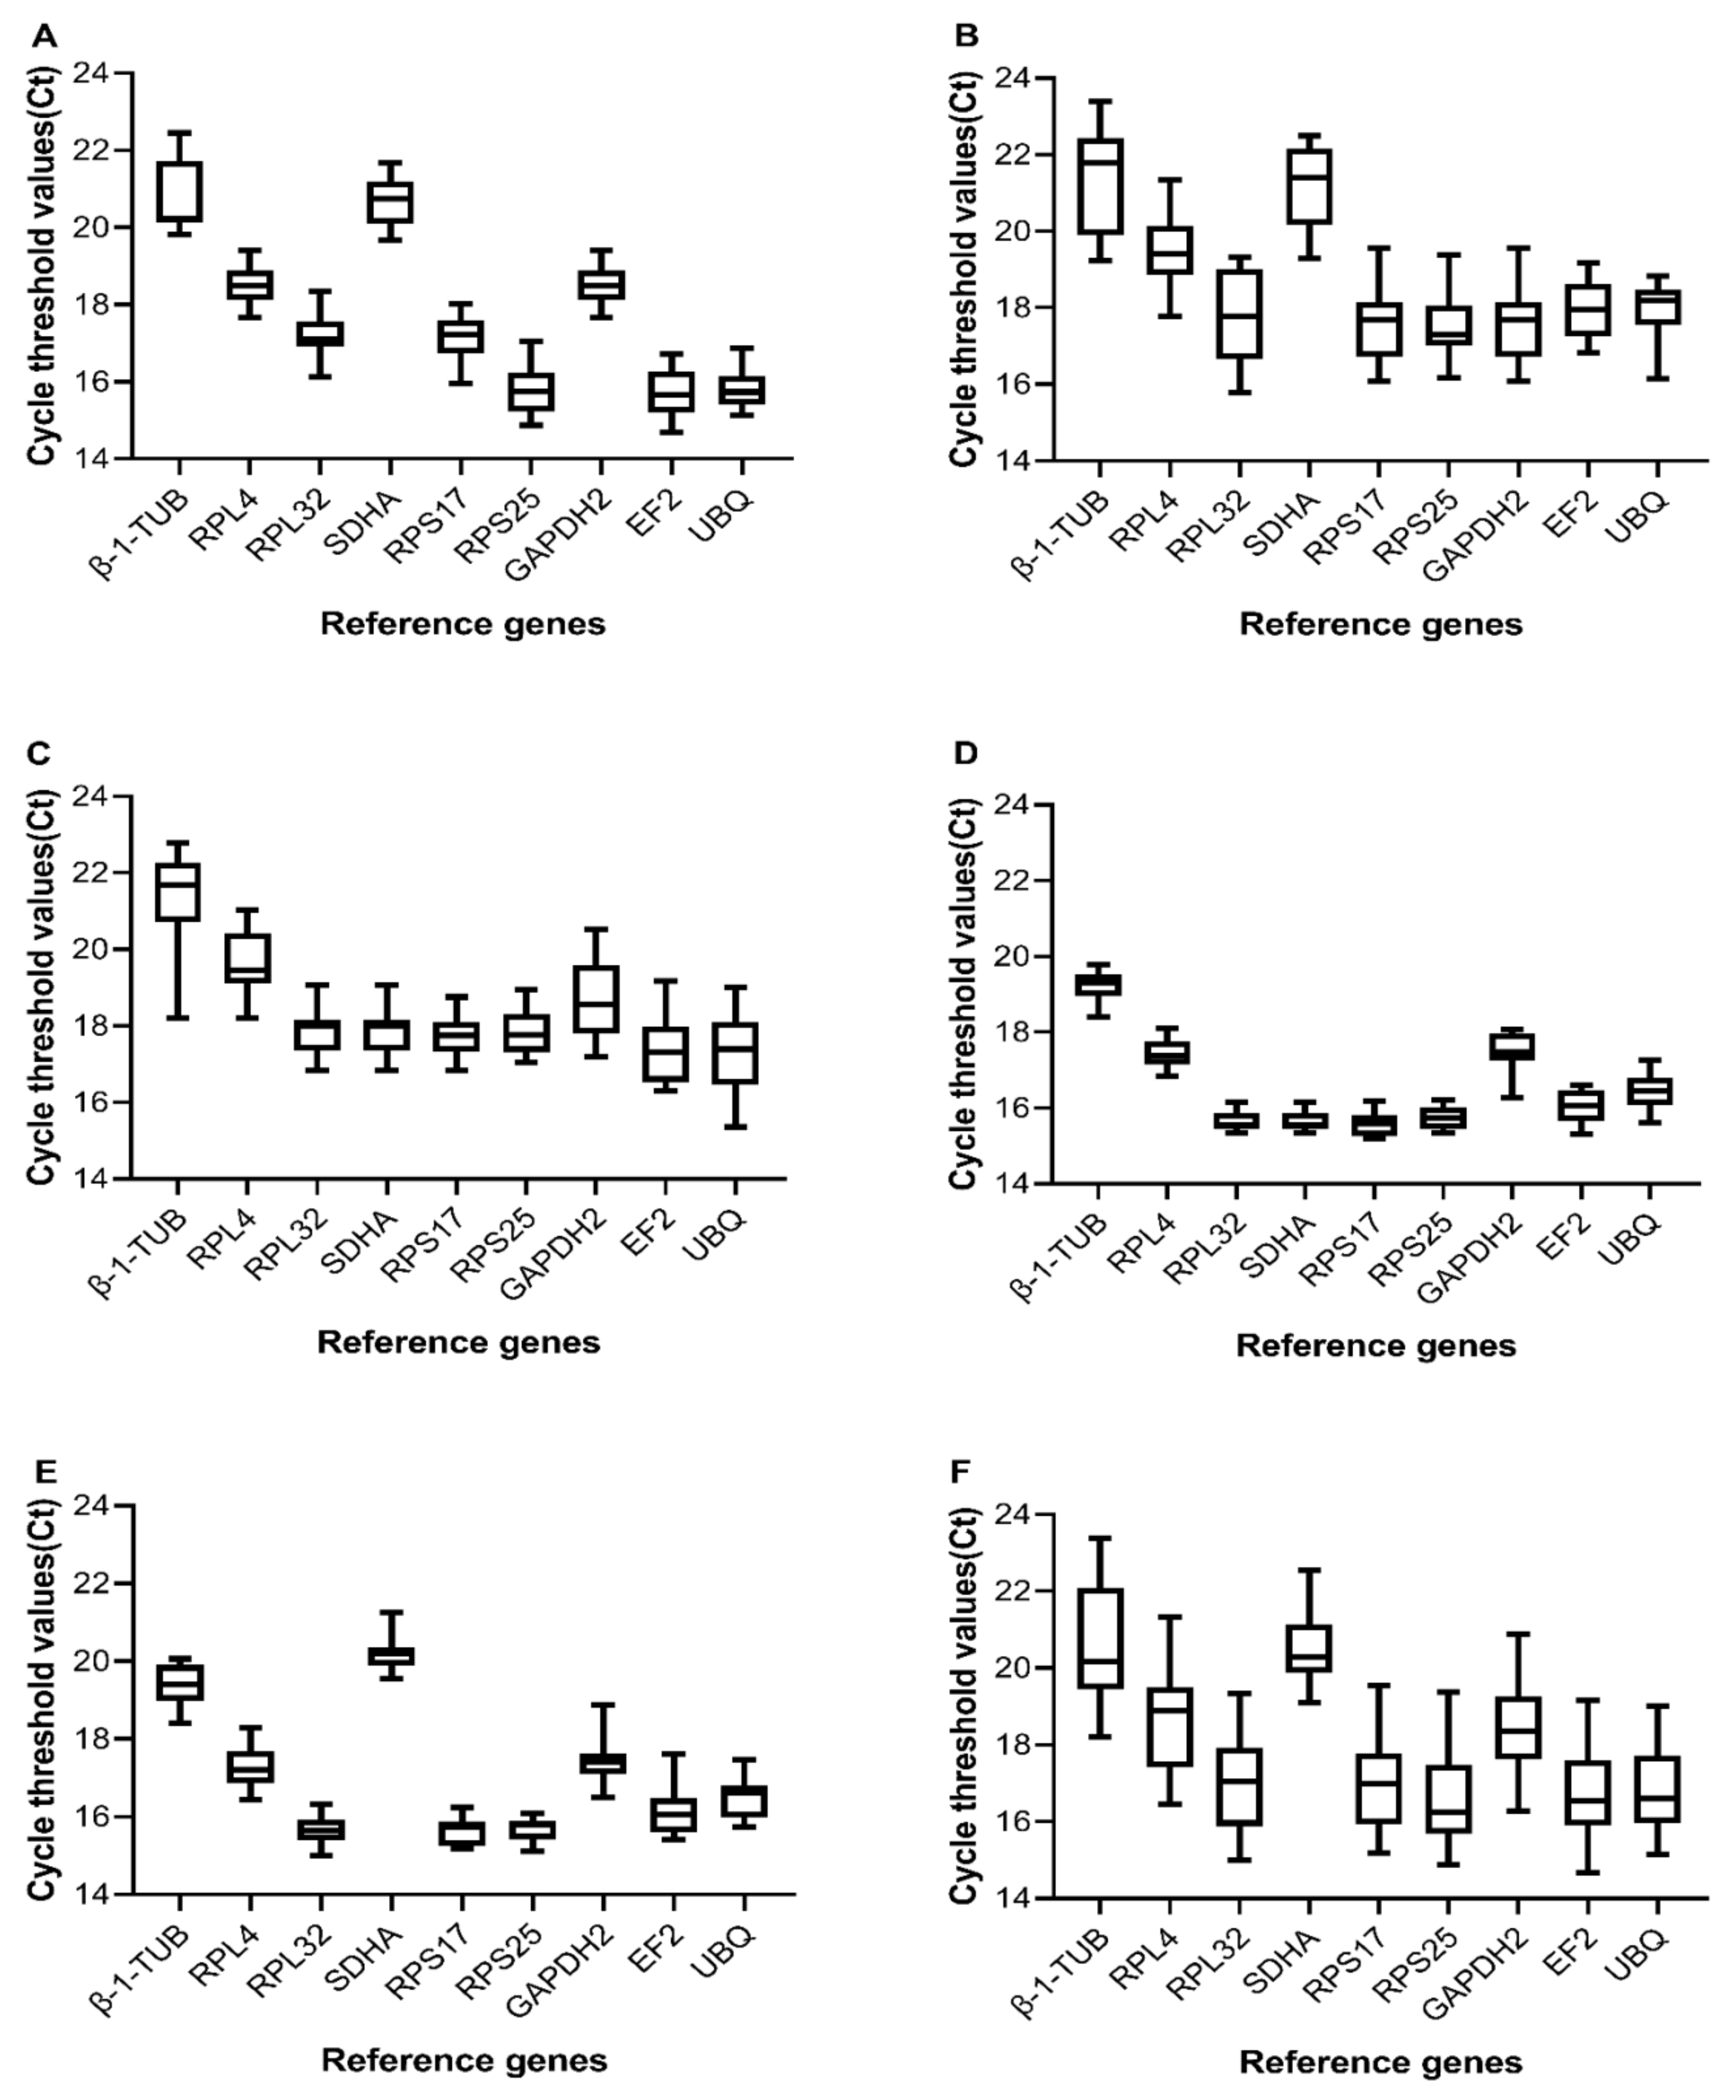
3.2. Expression Profiles of Candidate Reference Genes

The raw Ct value is the number of cycles that the fluorescence signal of the PCR amplification product undergoes as it progresses toward a set threshold, which reflects the gene expression level. Higher Ct values indicate lower gene expression. The abundance of reference gene expression is the primary condition for screening for the reference genes. To understand the expression abundance in the E. furcellata samples, the Ct values of nine candidate reference genes were evaluated by qRT-PCR under five experimental conditions. As shown in Figure 1, the Ct values of all the nine genes ranged 14.68–23.39, indicating that they all exhibited high expression under different experimental conditions and met the criteria for reference gene screening. The Ct values obtained under different experimental conditions ranged as follows: 14.68–22.45, 15.79–23.39, 15.36–22.77, 15.20–20.52, and 15.00–20.06 for different developmental stages, tissues of adult females, tissues of adult males, temperature treatments, and starvation treatments, respectively. The Ct values variation of EF2 ranged 14.68–19.17 under different experimental conditions, whereas the variation of β-1-TUB ranged 18.20–23.39, indicating that the expression of each candidate reference gene varied under different experimental conditions. In addition, the mean Ct values of β-1-TUB, RPL4, RPL32, SDHA, RPS17, RPS25, GAPDH2, EF2, and UBQ in all samples were 20.60 ± 1.36, 18.63 ± 1.23, 17.02 ± 1.17, 20.51 ± 0.88, 16.92 ± 1.08, 16.63 ± 1.15, 18.45 ± 1.06, 16.72 ± 1.12, and 16.81 ± 1.08, respectively, indicating that the mean expression level of RPS25 was the highest and the mean expression level of β-1-TUB was the lowest in all samples.

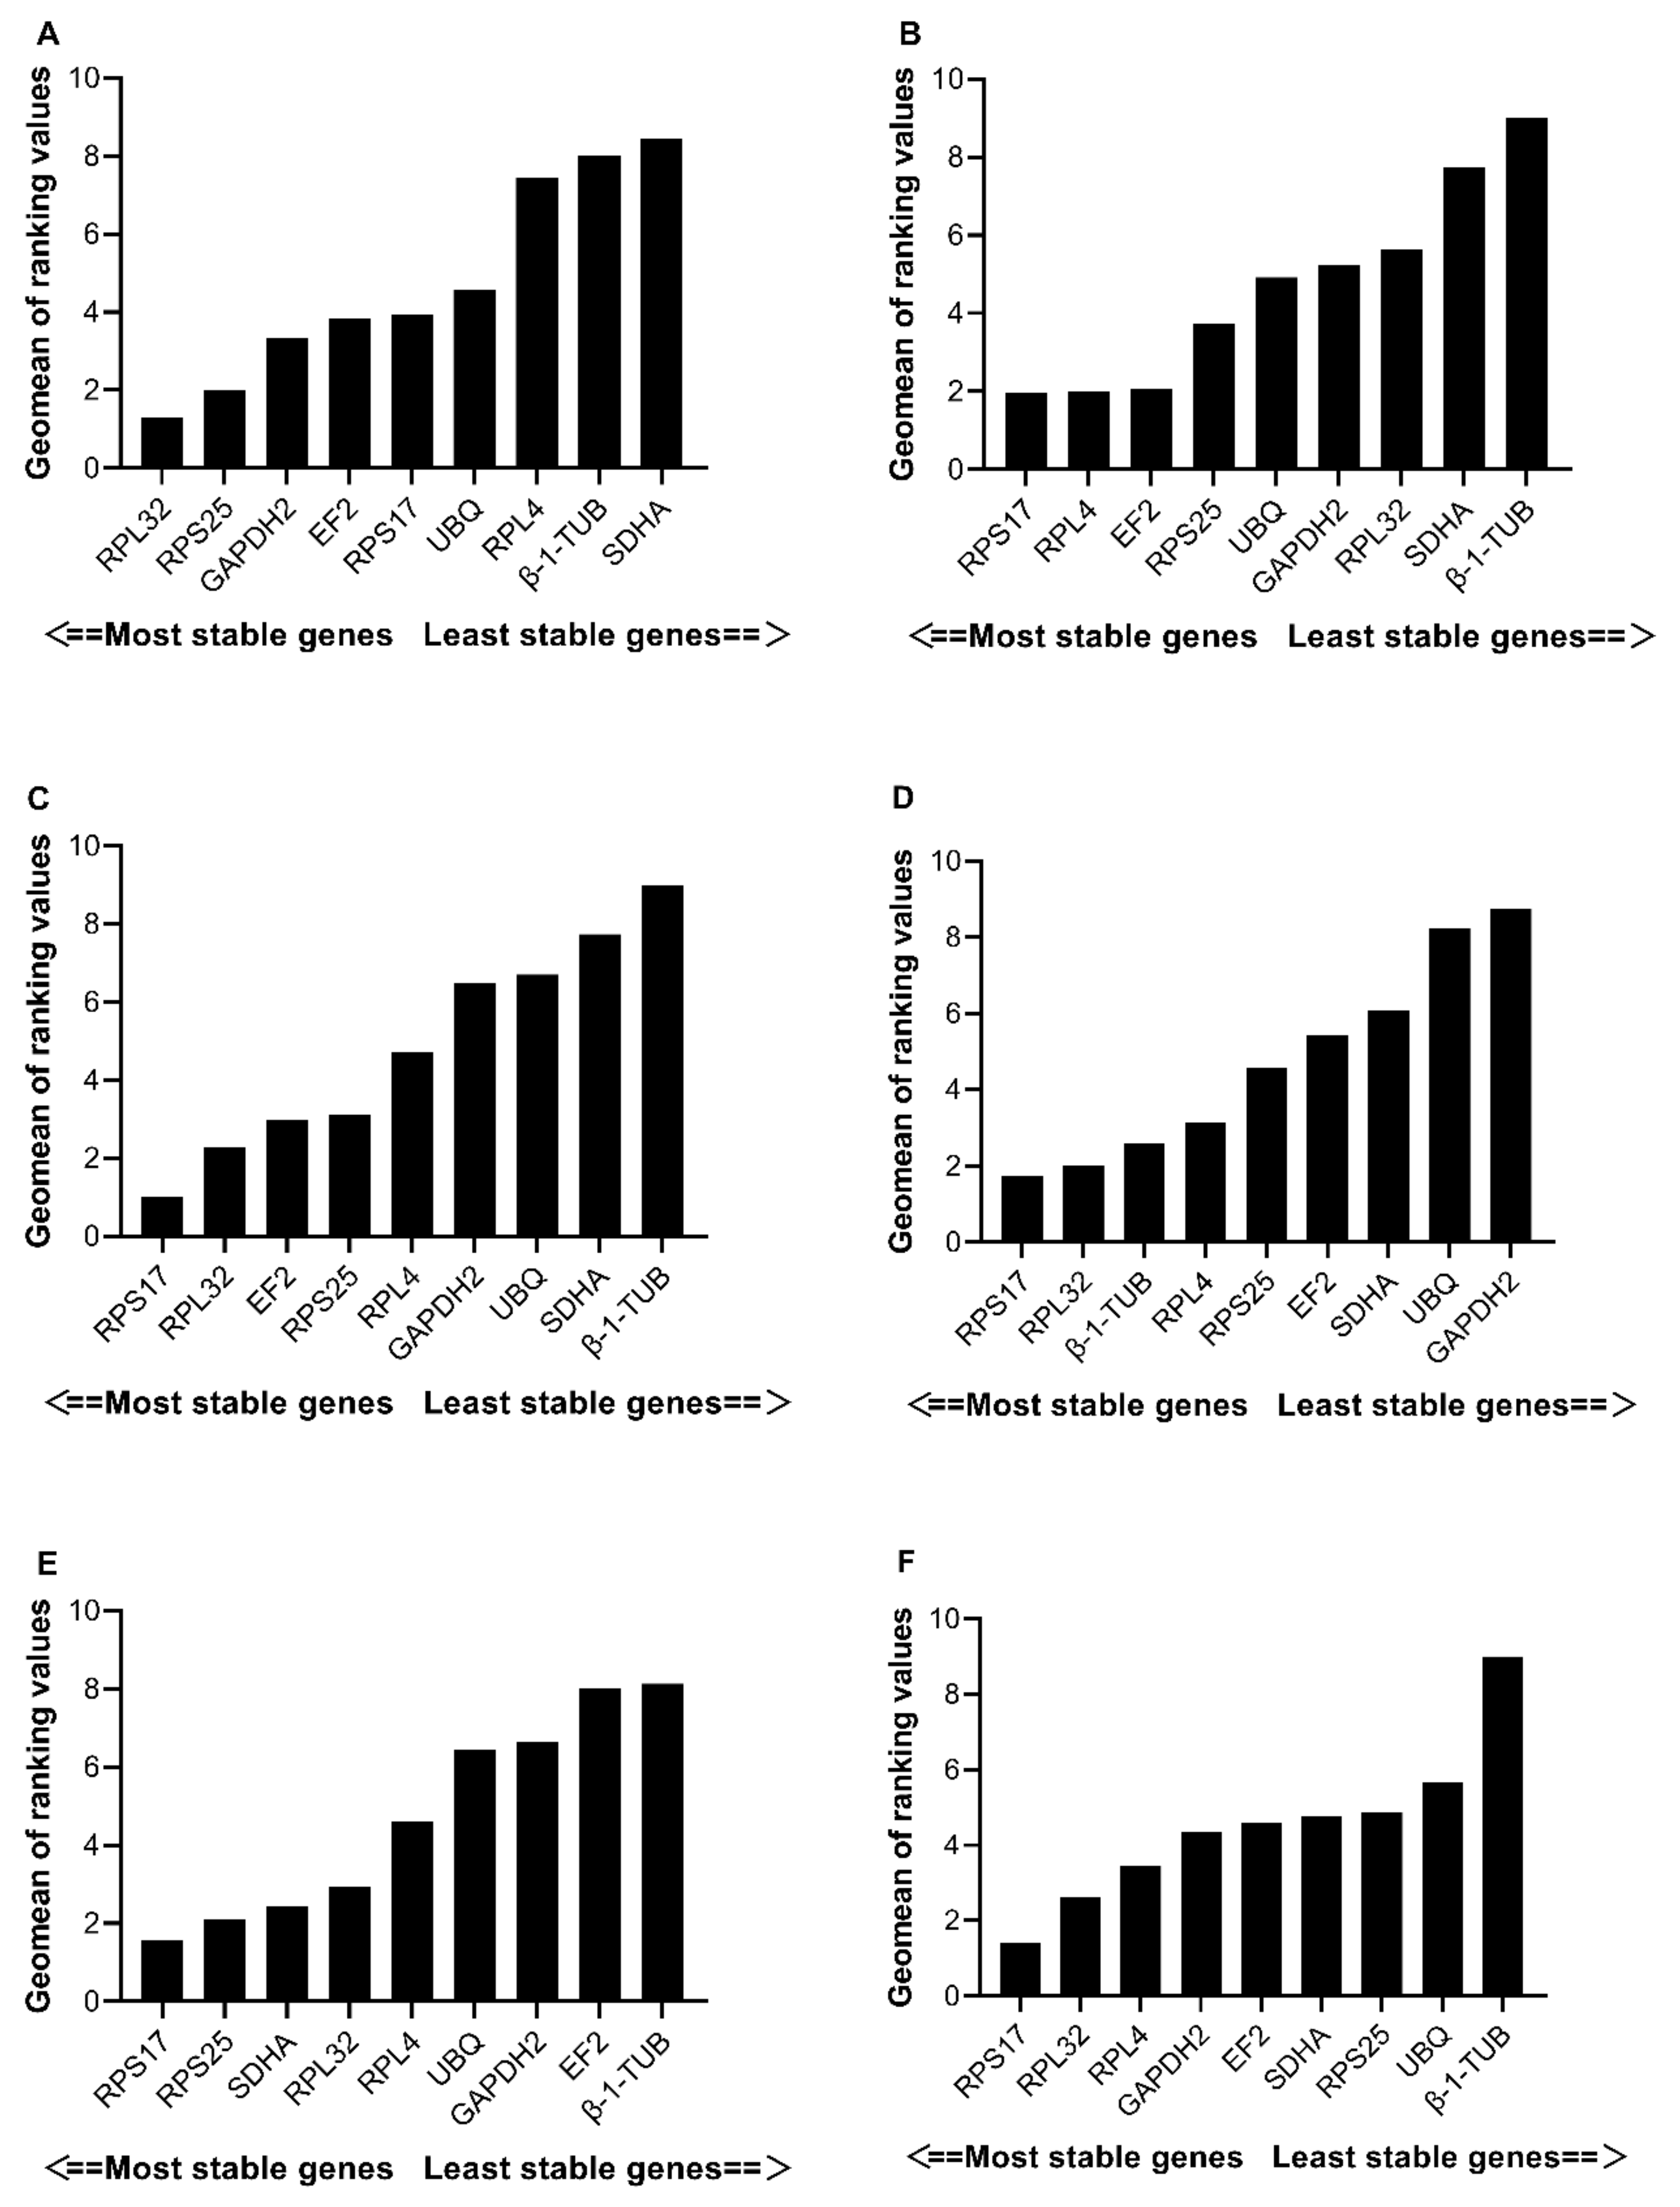
3.3. Expression Stability of Candidate Reference Genes

To analyze the expression stability of the nine candidate reference genes in different samples, four algorithms (ΔCt, BestKeeper, geNorm, and NormFinder), were used, and the results obtained are presented in Table 2. In addition, the expression stability of candidate reference genes for the various experimental samples was ranked overall using the online tool, RefFinder.

3.3.1. Developmental Stages

According to the ∆Ct analysis results, RPL32 and RPS25 were the most stably expressed reference genes in the samples at different developmental stages, and the NormFinder and geNorm results were consistent with those of the ∆Ct analysis (Table 2). In addition, GAPDH2 and UBQ exhibited the highest expression stability when analyzed by Bestkeeper (Table 2). The RefFinder integrated stability for the reference genes at different developmental stages of E. furcellata was ranked as follows: RPL32 > RPS25 > GAPDH2 > EF2 > RPS17 > UBQ > RPL4 > β-1-TUB > SDHA (Figure 2). The results from different algorithms indicated that RPL32 and RPS25 were the most stably expressed reference genes at various developmental stages of E. furcellata, whereas β-1-TUB and SDHA were the least stably expressed genes.

3.3.2. Female Tissues

The geNorm [11] software analysis revealed that V2/V3 value of 0.163, which is higher than 0.15; thus, the optimum number of required reference genes was 3 for different tissues of E. furcellata adult females. RPL4, RPS17, and RPL32 showed the highest expression stability using geNorm; RPS17, RPL4, and EF2 showed the highest expression stability using ∆Ct and NormFinder; and EF2, UBQ, and RPS25 showed the highest expression stability using Bestkeeper (Table 2). The RefFinder analysis revealed an expression stability ranking of the reference genes as follows: RPS17 > RPL4 > EF2 > RPS25 > UBQ > GAPDH2 > RPL32 > SDHA > β-1-TUB (Figure 2). Since the expression of β-1-TUB was the most unstable in all algorithms, it could not be used as a reference gene for qRT-PCR standardization in different tissue samples of E. furcellata adult females.

3.3.3. Male Tissues

For samples obtained from different tissues of E. furcellata adult males, ∆Ct and NormFinder analyses revealed RPS17 and EF2 as the most stably expressed genes; BestKeeper analysis revealed RPS17 and RPS25 as the most stably expressed genes; and geNorm revealed RPL32 and RPS17 as the most stably expressed reference genes. Based on the comprehensive analysis using RefFinder software, the ranking of these reference genes was as follows: RPS17 > RPL32 > EF2 > RPS25 > RPL4 > GAPDH2 > UBQ > SDHA > β-1-TUB (Figure 2). For all algorithms, the expression of β-1-TUB was the most unstable in different tissue samples of both E. furcellata adult males and females. Therefore, β-1-TUB is not recommended as a reference gene for qRT–PCR normalization.

3.3.4. Temperature Treatments

For E. furcellata samples subjected to different temperature treatments, RPS17 and RPL32; RPL32 and RPS25; and β-1-TUB and RPL4 had the most stable expression based on ∆Ct and NormFinder, BestKeeper, and geNorm analyses, respectively (Table 2). In the comprehensive ranking analysis using RefFinder, the expression stability ranking of the reference genes for different temperature conditions was as follows: RPS17 > RPL32 > β-1-TUB > RPL4 > RPS25 > EF2 > SDHA > UBQ > GAPDH2 (Figure 2). The analysis of the different algorithms revealed RPS17 and RPL32 as the most stably expressed reference genes in E. furcellata samples treated at different temperatures, whereas UBQ and GAPDH2 were the least stably expressed genes.

3.3.5. Starvation Treatments

In the samples subjected to different starvation time conditions, RPS17 and RPS25 had the highest expression stability according to ∆Ct, NormFinder, and BestKeeper analyses (Table 2), whereas RPL32 and SDHA had the highest expression stability according to geNorm analysis. In the comprehensive ranking analysis using RefFinder, the stability ranking of the reference genes of E. furcellata at different starvation time treatments was as follows: RPS17 > RPS25 > SDHA > RPL32 > RPL4 > UBQ > GAPDH2 > EF2 > β-1-TUB (Figure 2). These results indicate that RPS17 and RPS25 are the most stable reference genes for analyzing samples under various starvation conditions.

3.3.6. All Samples

For all samples, ∆Ct and geNorm analyses indicated that the most stably expressed reference genes were RPS17 and RPL32, whereas SDHA and GAPDH2 were considered the most desirable reference genes by BestKeeper analysis (Table 2). Based on NormFinder analysis, the best optimal reference genes in terms of stability were RPS17 and RPL4. In addition, RefFinder analysis showed that the stability ranking of reference genes for all samples of E. furcellata was: RPS17 > RPL32 > RPL4 > GAPDH2 > EF2 > SDHA > RPS25 > UBQ > β-1-TUB (Figure 2). Therefore, for qRT–PCR normalization, RPS17 and RPL32 may be used as reference genes in all samples, whereas β-1-TUB cannot be used as a reference gene in any of the samples.

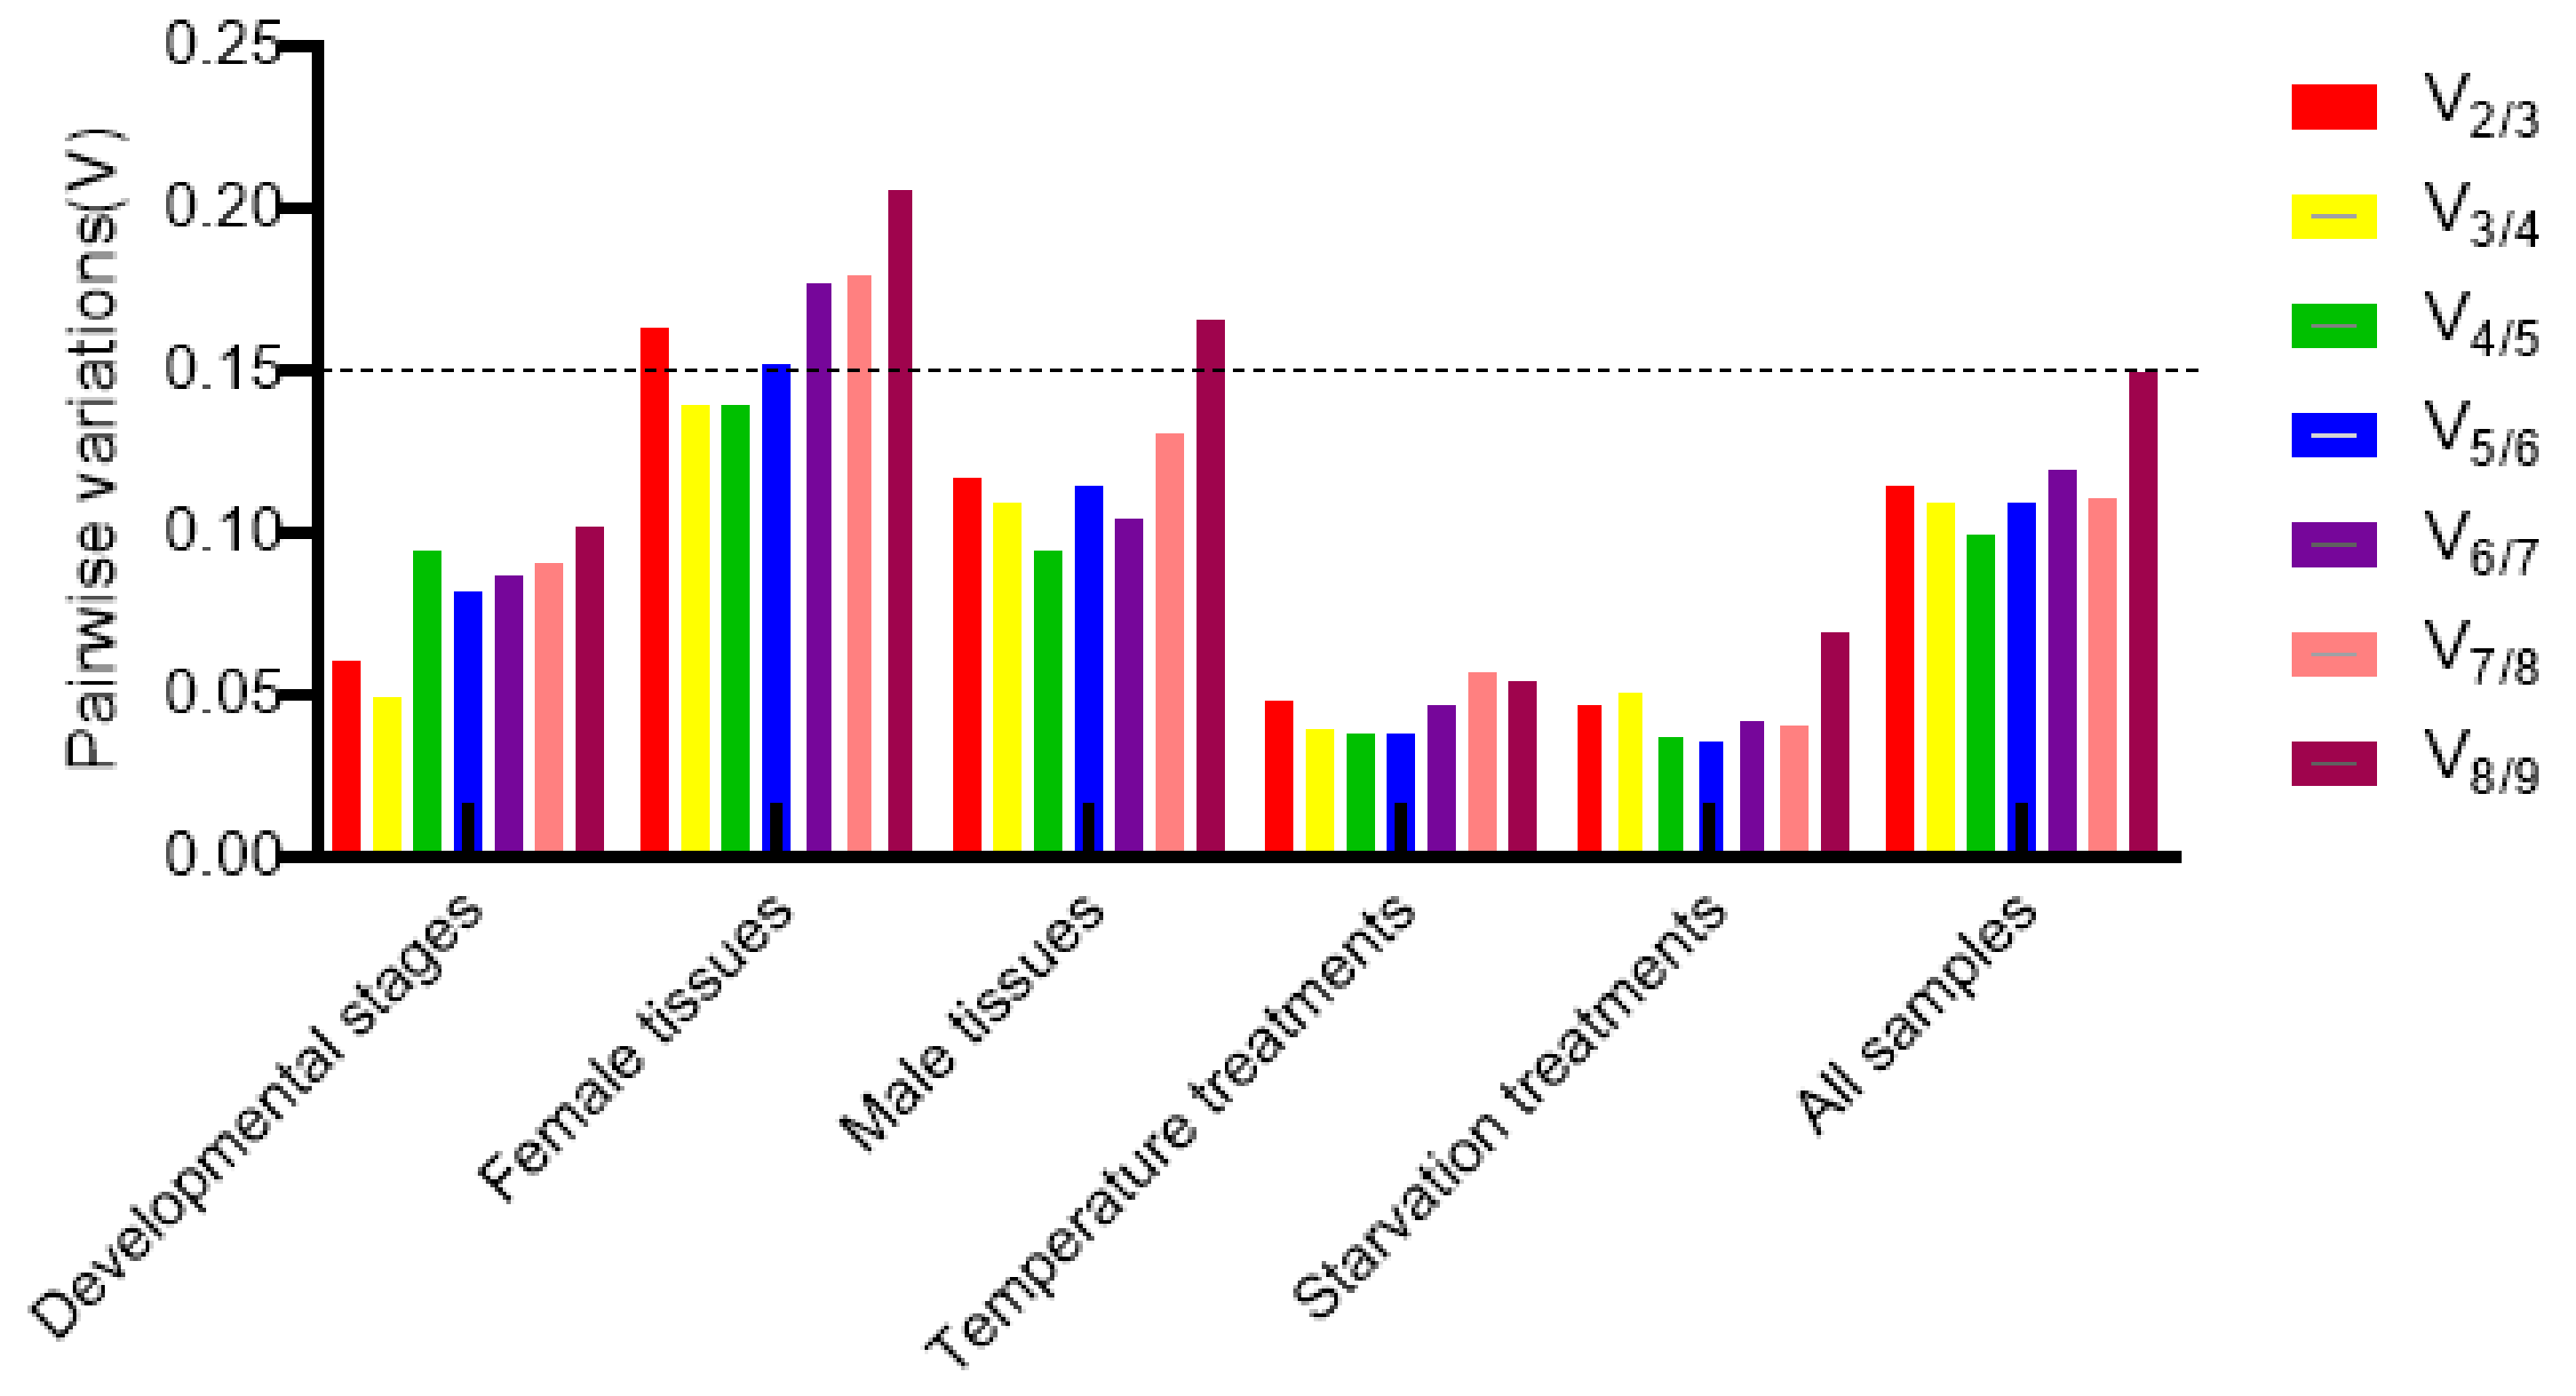
3.4. Optimal Number of Reference Genes Normalized under Different Experimental Conditions

To determine the minimum number of genes required to normalize qRT–PCR data, we used geNorm analysis to calculate the pairwise variance value Vn/V (n+ 1) to determine the appropriate number of reference genes. As shown in Figure 3, geNorm analysis revealed a pairwise variance value of <0.15 (V2/V3 < 0.15) in samples obtained at different developmental stages, in the tissues of adult males, and in samples subjected to various temperature and starvation treatments, indicating that two stably expressed reference genes were sufficient for standardizing qRT–PCR results. In contrast, samples from different tissues of adult females (V2/V3 > 0.15 and V3/V4 < 0.15) require three reference genes for normalization of qRT–PCR results (Figure 3). Therefore, the optimal number and combination of reference genes for different experimental conditions according to the RefFinder comprehensive reference gene ranking are as follows: RPL32 and RPS25 for different developmental stage samples; RPS17, RPL4, and EF2 for different tissue samples of adult females; RPS17 and RPL32 for different tissue samples of adult males; RPS17 and RPL32 for temperature-treated 3rd instar nymph samples; RPS17 and SDHA for starvation-treated 3rd instar nymph samples; and RPS17 and RPL32 for all samples.

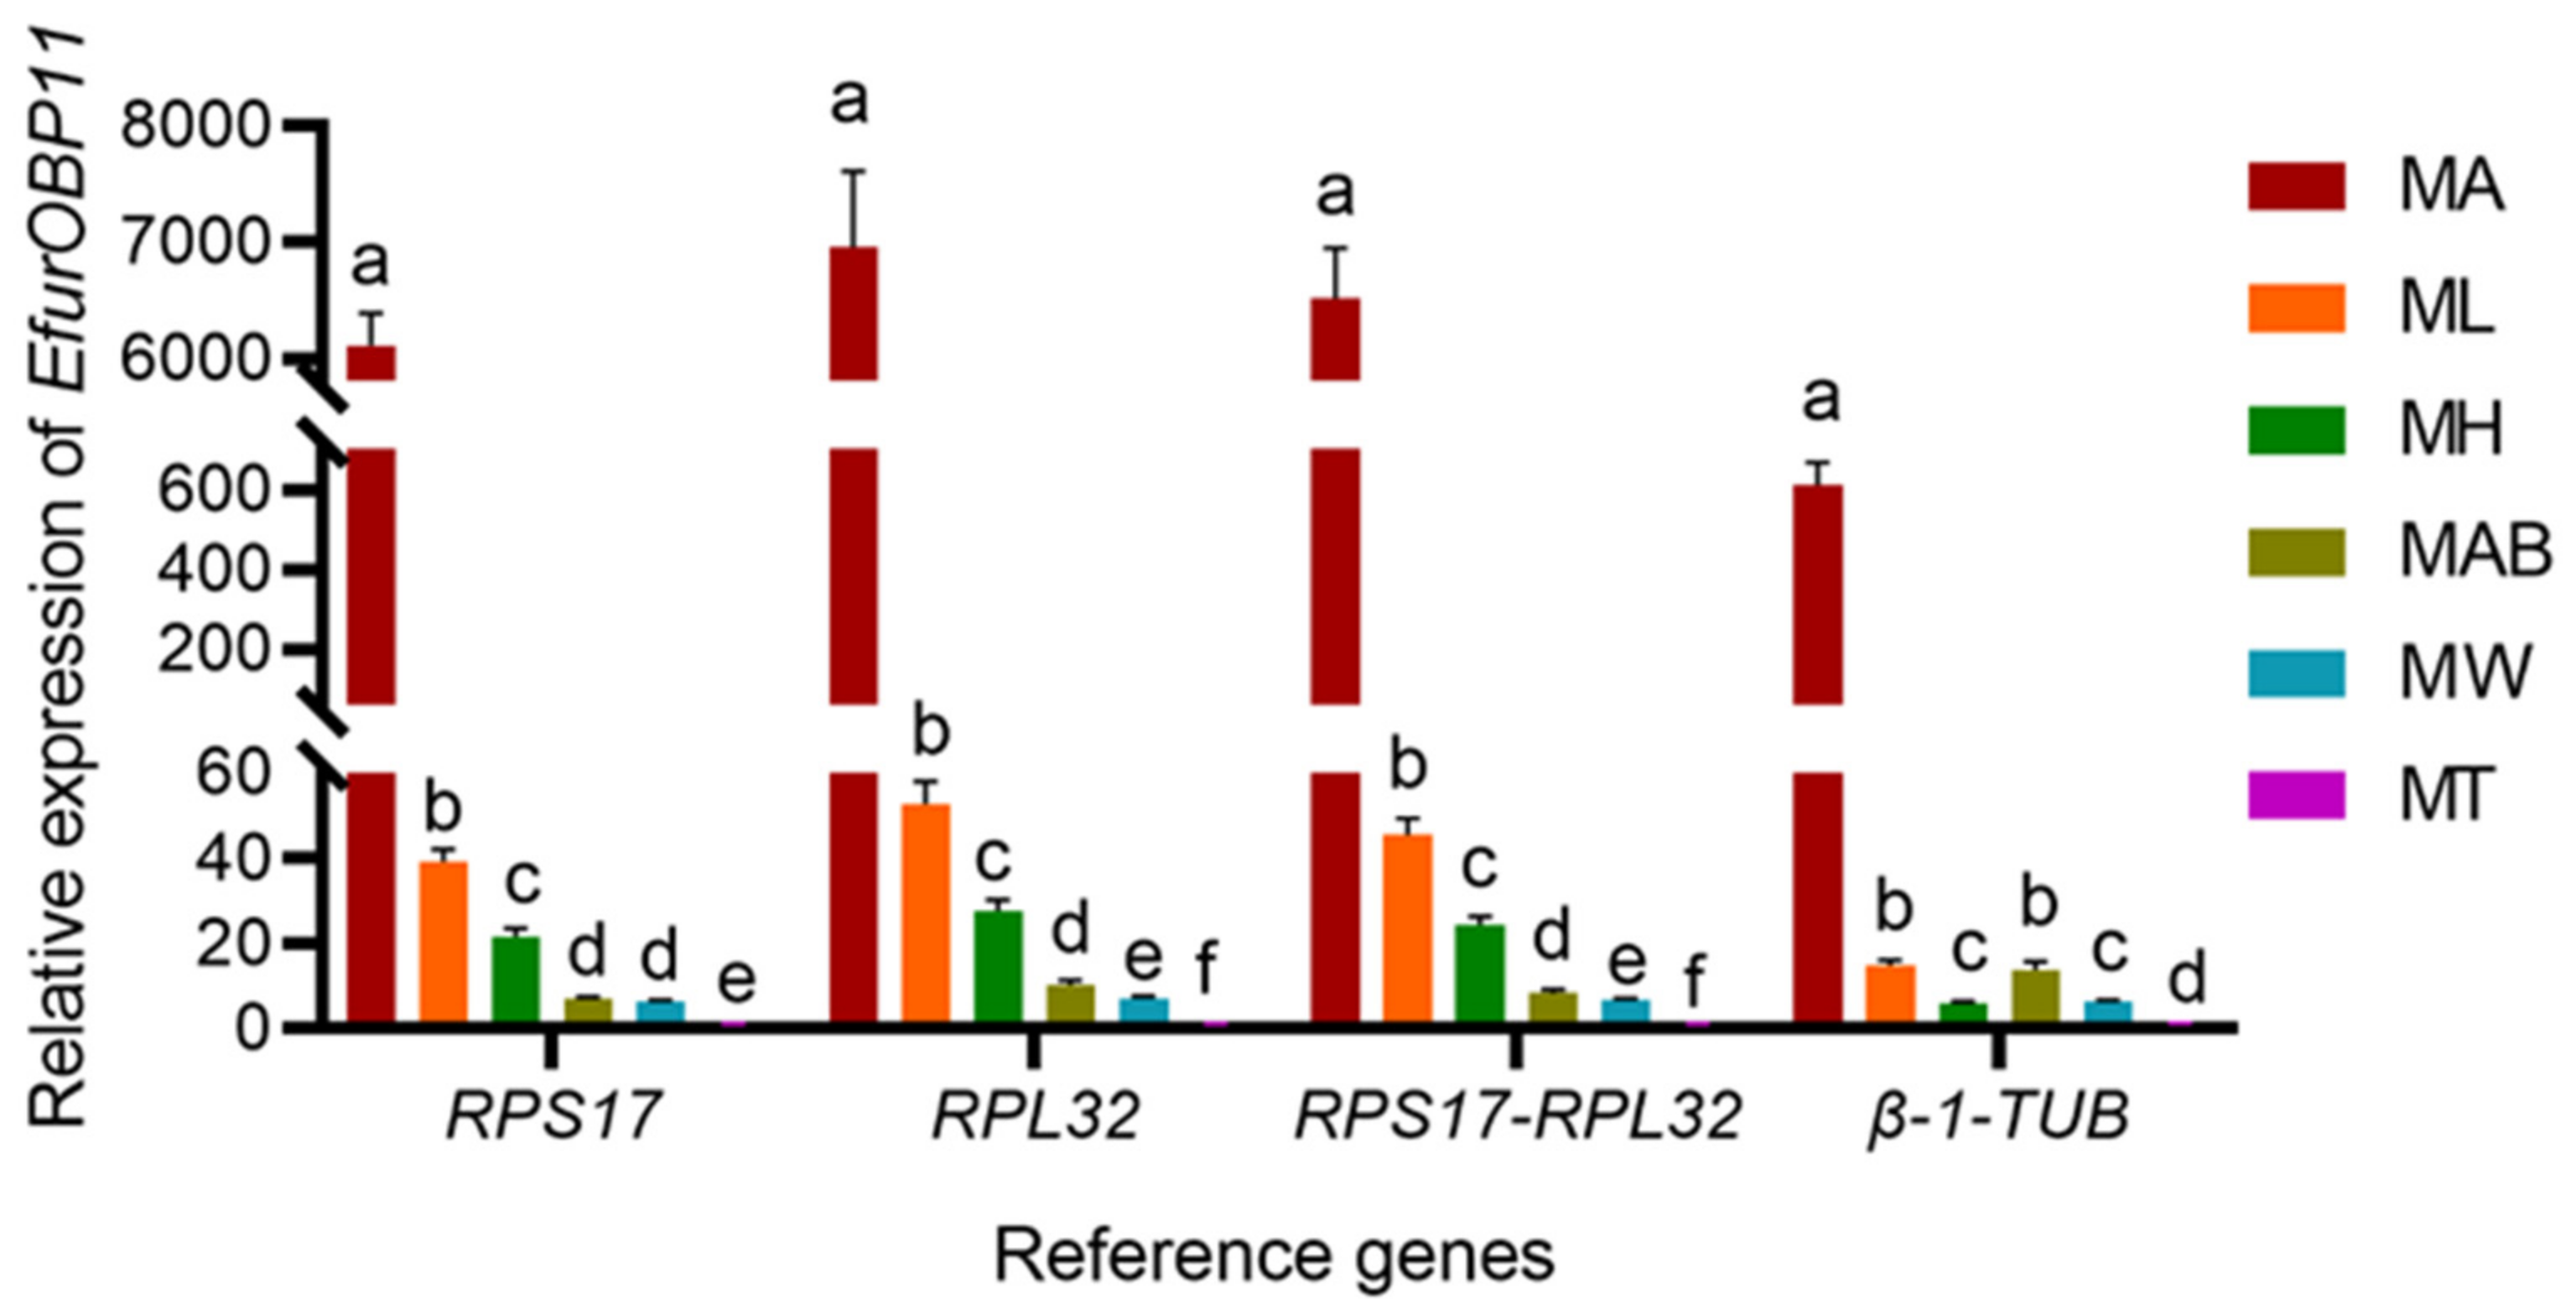
3.5. Validation of Selected Reference Genes in E. furcellata

To verify the expression stability of the reference genes screened, we selected the most optimal combination of reference genes (RPS17 and RPL32) for the comprehensive evaluation of their expression stability, the most stably expressed gene (RPS17), the second most stably expressed gene (RPL32), and the least stably expressed gene (β-1-TUB). These genes were used as reference genes to determine the relative expression levels of OBP EfurOBP11 in different tissues of E. furcellata adult males. As shown in Figure 4, the target gene EfurOBP11 showed similar expression patterns in different tissues of E. furcellata when standardized with RPS17, RPL32, or a combination of RPS17 and RPL32. The expression level was the highest in the antennae, followed by the foot, head, abdomen, wing, and thorax. When β-1-TUB was used as a reference gene, although its expression level in the antennae was the highest, the relative expression level was much lower than that of the other three groups (RPS17, RPL32, and both RPS17 and RPL32), and its expression level in the abdomen was higher than that of the foot and head, which was completely inconsistent with the results of the other three groups. Therefore, improper selection of reference genes in the standardization of qRT–PCR data may affect the accuracy of target gene expression levels and even lead to incorrect analysis conclusions.

4. Discussion

qRT-PCR is the most widely used molecular technique for gene expression analysis. It exhibits high sensitivity, high specificity, quickness, and accuracy; however, the accuracy and reliability of the results depend largely on proper data normalization using stably expressed reference genes [6,11,18]. The use of inappropriate reference genes can significantly affect quantitative results, leading to erroneous results [19,20]. In addition, several qRT–PCR studies have shown that most reference/housekeeping genes are differentially expressed under different experimental conditions and that their expression depends on the organism and the experimental conditions, suggesting that there is no “universal” reference gene [21,22,23]. Therefore, the selection of stably expressed reference genes is critical to accurate qRT-PCR analysis.
E. furcellata is an excellent predatory natural enemy that preys on pests, such as those belonging to the orders Lepidoptera, Coleoptera and Hymenoptera [1,2,4]. Extensive biological studies on E. furcellata as a natural enemy have been conducted; however, reports on reference genes for the qRT–PCR analysis of this organism are limited. Therefore, embarking on studies related to gene expression is needed to identify robust, stably expressed reference genes for E. furcellata under various experimental conditions to normalize the gene expression data. We screened nine putative housekeeping genes (β-1-TUB, RPL4, RPL32, RPS17, RPS25, SDHA, GAPDH2, EF2, and UBQ) of E. furcellata for expression stability under different experimental conditions. The results indicated that different housekeeping genes of E. furcellata are expressed at different levels under different experimental conditions, suggesting that there is no universal set of housekeeping genes that can be stably expressed toward all biotic and abiotic stresses [21,24]. This may result from the existence of specific expression profiles between different species [25,26]. Five analytical methods (ΔCt, geNorm, BestKeeper, NormFinder, and RefFinder) were used to comprehensively evaluate the expression stability of nine candidate reference genes of E. furcellata, which revealed not entirely consistent results. For example, based on the stability ranking of ΔCt, NormFinder, and geNorm, RPL32 was identified as the most stably expressed reference gene at different developmental stages, whereas BestKeeper identified GAPDH2. This could be attributed to different calculation principles used by different analysis software [27,28]. Although the ranking order was inconsistent depending on the analysis software used, the overall trend was similar. Therefore, the overall stability ranking of candidate reference genes by the RefFinder integrated ranking software was used as a criterion, since it is a comprehensive platform that integrates four algorithms.
Ribosomal proteins are components of ribosomes and are involved in ribosome assembly and protein translation as well as play an important role in cell development [29,30]. In recent years, the ribosomal protein gene has been considered the most stably expressed reference gene under different experimental conditions and has been widely used as a reference gene for qRT–PCR analysis in insects. For example, ribosomal proteins genes exhibited stable expression in Nilaparvata lugens (Stål) and Adelphocoris suturalis [22,31]. Freitas et al. [24] demonstrated that RPL32 and RPS18 were the most stably expressed reference genes in three stingless bee species, including at the developmental stage, sex, and with bacterial infections and pesticide treatment. In addition, RPL32 is also the most consistently expressed reference gene in the tissues of adult Lygus pratensis and in those with varying resistance to kung fu permethrin [32]. Even in Agasicles hygrophila, RPL32 was confirmed to be the most stably expressed reference gene for samples obtained from different body parts [33]. In this study, four ribosomal protein genes, RPL4, RPL32, RPS17, and RPS25, were selected as candidate reference genes. A comprehensive analysis showed that the top genes consistently contained at least two ribosomal protein genes under different experimental conditions, indicating that the expression stability of ribosomal protein genes in E. furcellata was excellent.
The transcriptional elongation factors, another family of highly conserved proteins, play roles in binding to RNA polymerase and ensuring efficient transcription through nucleosomes [34]. In a previous study, they were selected as reference genes for normalization of qRT-PCR data, of which EF1α was identified as one of the most commonly used reference genes [35]. In a study by Shu et al. [26], EF2 and EF1α were identified as the most stably expressed reference genes at different developmental stages of Spodoptera frugiperda. Bansal et al. [36] demonstrated experimentally that EF1α expression was stable at different developmental stages of Aphis glycines. In the present study, EF2 was also stably expressed in different tissue samples of E. furcellata adults of both sexes.
The applicability of reference genes may vary depending on different biotic and abiotic factors (Table 2 and Figure 3). We also found that the optimal reference genes differed significantly among samples treated under different conditions, and the traditional dogma of reference genes may not always yield a stable expression effect. Therefore, it is necessary to determine the stability of reference genes under different experimental conditions before conducting E. furcellata gene expression studies. Prior to the development of high-throughput technologies, conventional housekeeping genes such as Tubulin and GAPDH were often used as reference genes and correction factors for relative quantification [37,38]. However, several experiments have demonstrated that conventionally used housekeeping genes are not necessarily stably expressed in different study subjects or in the same study subject under different experimental conditions. For example, a study by Lord et al. [39] revealed that the expression of both α-tubulin and β-tubulin was unstable after fungus-infested Tribolium castaneum. Furthermore, GAPDH was identified as the most unstable reference gene in samples of Diabrotica virgifera at different developmental stages [40]. As with the above findings, we observed β-1-TUB and GAPDH2 were also the most unstable housekeeping genes although GAPDH2 was more stable at different developmental stages and β-1-TUB was more stable at different temperatures, compared with other genes in this article, respectively. Our results indicate that β-1-TUB and GAPDH2 cannot be recommended as reference genes for E. furcellata qRT–PCR experiments.
In many previous studies, only one reference gene was generally selected to normalize qRT–PCR data results. However, owing to increased in-depth studies on the expression stability of reference genes, researchers have begun to normalize qRT–PCR results with two or more reference genes as a single reference gene may not be sufficient [41]. In addition, the overuse of reference genes can reduce the accuracy of standardized qRT-PCR results [42]. Therefore, it is necessary to evaluate the optimal number of reference genes under different conditions. In this study, the optimal number of reference genes was determined by the number of paired variants using the geNorm program (Figure 3). The V2/V3 was less than 0.15 at different developmental stages, in the tissues of adult males, and under different temperature and starvation treatments, indicating the requirement of only two reference genes for qRT–PCR result normalization; conversely, the V2/V3 was more than 0.15 in the tissues of adult females, wherein three reference genes were needed. We also found that among the stable values obtained from the calculation of the expression of nine candidate reference genes by different algorithms, the stable values were relatively larger for samples obtained from different tissues of adult females, indicating that the female sex had a greater influence on the stable expression of reference genes. The obtained results also reflected that it is crucial to introduce appropriate reference genes for correcting the accuracy of gene expression under different conditions; however, the use of reference genes itself may introduce more instability. Thus, too many reference genes should not be introduced [42]. In particular, after the addition of the fourth reference gene, the gene expression stability decreases and the correction accuracy and overall accuracy is reduced. Therefore, it is proposed that the number of optimal reference genes in a combination should not exceed 3 [43]. When screening for optimal reference gene combinations, we usually use up to three stably expressed reference genes as a combination for the calibration of fluorescence quantitation. Combined with RefFinder, the expression stability of each reference gene predicted by different analysis methods is comprehensively sorted, and the optimal selection of the reference gene may be finally determined. This avoids the biasedness of single software analysis and results in more reliable screening results. Therefore, the optimal gene combination for different tissues of E. furcellata adult females is RPS17, RPL4, and EF2. The optimal reference gene combination for different developmental stages, in the tissues of adult males, under temperature treatments, under starvation treatment, and for all samples was RPL32 + RPS25, RPS17 + RPL32, RPS17 + RPL32, RPS17 + RPS25, and RPS17 + RPL32, respectively. Thus, it is evident that the expression of ribosomal protein genes in E. furcellata is highly stable under different experimental conditions.

5. Conclusions

E. furcellata is an excellent natural predatory enemy. It plays an important role in the development of agricultural security and represents a green environmental solution. Therefore, gene expression analyses and functional genomics of E. furcellata will further enhance its applicability. This study is the first to screen reference genes of E. furcellata, which is of great significance for future studies on the expression of its related genes and to ensure the reliability of the gene expression data. The expression stability of nine candidate reference genes under biotic (developmental stage and tissue) and abiotic (temperature and starvation stress) conditions was determined using five commonly used algorithms (ΔCt, BestKeeper, NormFinder, geNorm, and RefFinder). Our results show that no universal reference gene was stably expressed under all experimental conditions, rather a combination of the most stable reference genes was optimal. These included RPL32 and RPS25 at different developmental stages; RPS17, RPL4, and EF2 for adult female tissues; RPS17 and RPL32 for adult male tissues; RPS17 and RPL32 for different temperature treatments of nymphs; RPS17 and RPS25 for nymph samples under starvation stress; and RPS17 and RPL32 for all samples. This study provides the most basic and important steps for standardizing qRT–PCR analysis in E. furcellata, lays a foundation for further molecular biology studies, and provides a reference for the rational selection of qRT–PCR reference genes.

Author Contributions

Conceptualization, Y.-N.P. and W.-L.C.; funding acquisition, W.-L.C.; methodology, Y.-N.P., R.-N.Z., C.Y. and D.F.; formal analysis, C.-N.P., W.Z. and C.Y.; investigation, C.-N.P., D.F. and W.Z.; writing—original draft, Y.-N.P.; writing—review & editing, Y.-N.P. and R.-N.Z. All authors have read and agreed to the published version of the manuscript.

Funding

This research received no external funding.

Institutional Review Board Statement

Not applicable.

Informed Consent Statement

All authors have consented to this publication.

Data Availability Statement

The data and materials supporting the conclusions of this study are included within the article.

Conflicts of Interest

The authors declare no conflict of interest.

References

  1. Lin, C.C.; Wang, H.; Ren, H.D.; Hang, C.F. Studies on the biological characteristics of Eocanthecona furcellata (Wolff) (Hemiptera: Pentatomidae, Asopinae). For. Res. 1998, 92–96. [Google Scholar]
  2. Pan, Y.N.; Yao, M.Y.; Fu, D.; Guo, F.; Qin, R.; Jiang, L.; Chen, W.L. Predation effects of Eocanthecona furcellata (Wolff) adults against Spodoptera frugiperda larvae. J. Mt. Agric. Biol. 2020, 39, 23–27. [Google Scholar] [CrossRef]
  3. Lenin, E.A.; Rajan, S.J. Biology of predatory bug Eocanthecona furcellata (Wolff) (Hemiptera: Pentatomidae) on Corcyra cephalonica Stainton. J. Entomol. Zool. Stud. 2016, 4, 338–340. [Google Scholar]
  4. Yu, C.; Yao, M.Y.; Zhao, R.N.; Wang, L.; Chen, W.L. Effects of breeding density on growth and development of Eocanthecona furcellata (Wolff). J. Mt. Agric. Biol. 2021, 40, 75–79. [Google Scholar] [CrossRef]
  5. He, X.N.; Xian, J.D.; Chen, R.; Zhang, Z.Y.; Zeng, R. Effects of four insect feed on development and reproduction of Eocanthecona furcellata (Wolff) (Hemiptera: Asopinae). J. Environ. Entomol. 2013, 35, 799–803. [Google Scholar] [CrossRef]
  6. Bustin, S.A.; Beaulieu, J.F.; Huggett, J.; Jaggi, R.; Kibenge, F.S.; Olsvik, P.A.; Penning, L.C.; Toegel, S. MIQE précis: Practical implementation of minimum standard guidelines for fluorescence-based quantitative real-time PCR experiments. BMC Mol. Biol. 2010, 11, 74. [Google Scholar] [CrossRef]
  7. Li, R.; Xie, W.; Wang, S.; Wu, Q.; Yang, N.; Yang, X.; Pan, H.; Zhou, X.; Bai, L.; Xu, B.; et al. Reference gene selection for qRT-PCR analysis in the sweetpotato whitefly, Bemisia tabaci (Hemiptera: Aleyrodidae). PLoS ONE 2013, 8, e53006. [Google Scholar] [CrossRef]
  8. Bustin, S.A.; Benes, V.; Nolan, T.; Pfaffl, M.W. Quantitative real-time RT-PCR—A perspective. J. Mol. Endocrinol. 2005, 34, 597–601. [Google Scholar] [CrossRef]
  9. Chapuis, M.P.; Tohidi-Esfahani, D.; Dodgson, T.; Blondin, L.; Ponton, F.; Cullen, D.; Simpson, S.J.; Sword, G.A. Assessment and validation of a suite of reverse transcription-quantitative PCR reference genes for analyses of density-dependent behavioural plasticity in the Australian plague locust. BMC Mol. Biol. 2011, 12, 7. [Google Scholar] [CrossRef]
  10. Silver, N.; Best, S.; Jiang, J.; Thein, S.L. Selection of housekeeping genes for gene expression studies in human reticulocytes using real-time PCR. BMC Mol. Biol. 2006, 7, 33. [Google Scholar] [CrossRef]
  11. Vandesompele, J.; Preter, K.D.; Roy, N.V.; Paepe, A.D. Accurate normalization of real-time quantitative RT-PCR data by geometric averaging of multiple internal control genes. Genome Biol. 2002, 3, 12. [Google Scholar] [CrossRef]
  12. Andersen, C.L.; Jensen, J.L.; Ørntoft, T.F. Normalization of real-time quantitative reverse transcription-PCR data: A model-based variance estimation approach to identify genes suited for normalization, applied to bladder and colon cancer data sets. Cancer Res. 2004, 64, 5245–5250. [Google Scholar] [CrossRef] [Green Version]
  13. Pfaffl, M.W.; Tichopad, A.; Prgomet, C.; Neuvians, T.P. Determination of stable housekeeping genes, differentially regulated target genes and sample integrity: Bestkeeper–excel-based tool using pair-wise correlations. Biotechnol. Lett. 2004, 26, 509–515. [Google Scholar] [CrossRef]
  14. Xie, F.; Xiao, P.; Chen, D.; Xu, L.; Zhang, B. MiRDeepFinder: A miRNA analysis tool for deep sequencing of plant small RNAs. Plant Mol. Biol. 2012, 80, 75–84. [Google Scholar] [CrossRef]
  15. Vogt, R.G.; Prestwich, G.D.; Lerner, M.R. Odorant-binding-protein subfamilies associate with distinct classes of olfactory receptor neurons in insects. J. Neurobiol. 1991, 22, 74–84. [Google Scholar] [CrossRef]
  16. Leal, W.S. Odorant reception in insects: Roles of receptors, binding proteins, and degrading enzymes. Annu. Rev. Entomol. 2013, 58, 373–391. [Google Scholar] [CrossRef]
  17. Livak, K.J.; Schmittgen, T.D. Analysis of relative gene expression data using real-time quantitative PCR and the 2−∆∆CT method. Methods 2001, 25, 402–408. [Google Scholar] [CrossRef]
  18. Guan, H.; Yang, K. RNA isolation and real-time quantitative. Methods Mol. Biol. 2008, 456, 259–270. [Google Scholar]
  19. Huggett, J.; Dheda, K.; Bustin, S.; Zumla, A. Real-time RT-PCR normalisation; strategies and considerations. Genes Immun. 2005, 6, 279–284. [Google Scholar] [CrossRef]
  20. Nolan, T.; Hands, R.E.; Bustin, S.A. Quantification of mRNA using real-time RT-PCR. Nat. Protoc. 2006, 1, 1559–1582. [Google Scholar] [CrossRef]
  21. Lee, P.D.; Sladek, R.; Greenwood, C.M.T.; Hudson, T.J. Control genes and variability: Absence of ubiquitous reference transcripts in diverse mammalian expression studies. Genome Res. 2002, 12, 292–297. [Google Scholar] [CrossRef]
  22. Luo, J.; Ma, C.; Li, Z.; Zhu, B.; Zhang, J.; Lei, C.L.; Jin, S.X.; Joe, J.H.; Chen, L. Assessment of suitable reference genes for qRT-PCR analysis in Adelphocoris suturalis. J. Integr. Agric. 2018, 17, 2745–2757. [Google Scholar] [CrossRef]
  23. Yuan, M.; Lu, Y.; Zhu, X.; Wan, H.; Shakeel, M.; Zhan, S.; Jin, B.R.; Li, J. Selection and evaluation of potential reference genes for gene expression analysis in the brown planthopper, Nilaparvata lugens (Hemiptera: Delphacidae) using reverse-transcription quantitative PCR. PLoS ONE 2014, 9, e86503. [Google Scholar] [CrossRef] [Green Version]
  24. Freitas, F.C.P.; Depintor, T.S.; Agostini, L.T.; Luna-Lucena, D.; Nunes, F.M.F.; Bitondi, M.M.G.; Simões, Z.L.P.; Lourenço, A.P. Evaluation of reference genes for gene expression analysis by real-time quantitative PCR (qPCR) in three stingless bee species (Hymenoptera: Apidae: Meliponini). Sci. Rep. 2019, 9, 17692. [Google Scholar] [CrossRef]
  25. Sonoda, S.; Ashfaq, M.; Tsumuki, H. Cloning and nucleotide sequencing of three heat shock protein genes (hsp90, hsc70, and hsp19.5) from the diamondback moth, Plutella xylostella (l.) and their expression in relation to developmental stage and temperature. Arch. Insect Biochem. Physiol. 2006, 62, 80–90. [Google Scholar] [CrossRef]
  26. Shu, B.S.; Hai-Kuo, Y.U.; Dai, J.H.; Xie, Z.G.; Qian, W.Q.; Lin, J.T. Stability evaluation of reference genes for real-time quantitative PCR normalization in Spodoptera frugiperda (Lepidoptera: Noctuidae). J. Integr. Agric. 2021, 20, 2471–2482. [Google Scholar] [CrossRef]
  27. Zhai, Y.; Lin, Q.; Zhou, X.; Zhang, X.; Liu, T.; Yu, Y. Identification and validation of reference genes for quantitative real-time PCR in Drosophila suzukii (Diptera: Drosophilidae). PLoS ONE 2014, 9, e106800. [Google Scholar] [CrossRef]
  28. Sagri, E.; Koskinioti, P.; Gregoriou, M.E.; Tsoumani, K.T.; Bassiakos, Y.C.; Mathiopoulos, K.D. Housekeeping in tephritid insects: The best gene choice for expression analyses in the medfly and the olive fly. Sci. Rep. 2017, 7, 45634. [Google Scholar] [CrossRef] [PubMed]
  29. Zhou, X.; Liao, W.J.; Liao, J.M.; Liao, P.; Lu, H. Ribosomal proteins: Functions beyond the ribosome. J. Mol. Cell Biol. 2015, 7, 92–104. [Google Scholar] [CrossRef] [PubMed]
  30. Feng, Z. The Rpf84 gene, encoding a ribosomal large subunit protein, RPL22, regulates symbiotic nodulation in Robinia pseudoacacia. Planta 2019, 250, 1897–1910. [Google Scholar] [CrossRef] [PubMed]
  31. Wan, P.J. Reference genes for quantitative real-time PCR analysis in symbiont entomomyces delphacidicola of Nilaparvata lugens (Stål). Sci. Rep. 2017, 7, 42206. [Google Scholar] [CrossRef]
  32. Jia, B.; Ma, Y.; Pang, B.Q.; Shan, Y.M.; Bao, Q.L.; Han, H.B.; Tan, Y. Screening of reference genes for quantitative real-time PCR in Lygus pratensis (Hemiptera: Miridae). ACTA Entomol. Sin. 2019, 62, 1379–1391. [Google Scholar] [CrossRef]
  33. Guo, Y.Q.; Yang, Y.; Chai, Y.; Gao, L.L.; Ma, R. Identification and evaluation of reference genes for quantitative PCR normalization in alligator weed flea beetle (Coleoptera: Chrysomelidae). J. Insect Sci. 2021, 21, 7. [Google Scholar] [CrossRef]
  34. Ehara, H.; Kujirai, T.; Fujino, Y.; Shirouzu, M.; Kurumizaka, H.; Sekine, S. Structural insight into nucleosome transcription by RNA polymerase II with elongation factors. Science 2019, 363, 744–747. [Google Scholar] [CrossRef]
  35. Lü, J.; Yang, C.; Zhang, Y.; Pan, H. Selection of reference genes for the normalization of RT-qPCR data in gene expression studies in insects: A systematic review. Front. Physiol. 2018, 9, 1560. [Google Scholar] [CrossRef]
  36. Bansal, R.; Mamidala, P.; Mian, M.A.R.; Mittapalli, O.; Michel, A.P. Validation of reference genes for gene expression studies in Aphis glycines (Hemiptera: Aphididae). J. Econ. Entomol. 2012, 105, 1432–1438. [Google Scholar] [CrossRef]
  37. Shakeel, M.; Rodriguez, A.; Tahir, U.B.; Jin, F. Gene expression studies of reference genes for quantitative real-time PCR: An overview in insects. Biotechnol. Lett. 2018, 40, 227–236. [Google Scholar] [CrossRef]
  38. Tan, Q.Q.; Zhu, L.; Li, Y.; Liu, W.; Ma, W.H.; Lei, C.L.; Wang, X.P. A de novo transcriptome and valid reference genes for quantitative real-time PCR in Colaphellus bowringi. PLoS ONE 2015, 10, e0118693. [Google Scholar] [CrossRef]
  39. Lord, J.C.; Hartzer, K.; Toutges, M.; Oppert, B. Evaluation of quantitative PCR reference genes for gene expression studies in Tribolium castaneum after fungal challenge. J. Microbiol. Methods 2010, 80, 219–221. [Google Scholar] [CrossRef]
  40. Rodrigues, T.B.; Khajuria, C.; Wang, H.; Matz, N.; Cunha Cardoso, D.; Valicente, F.H.; Zhou, X.; Siegfried, B. Validation of reference housekeeping genes for gene expression studies in western corn rootworm (Diabrotica virgifera virgifera). PLoS ONE 2014, 9, e109825. [Google Scholar] [CrossRef]
  41. Concha, C.; Edman, R.M.; Belikoff, E.J.; Schiemann, A.H.; Carey, B.; Scott, M.J. Organization and expression of the Australian sheep blowfly (Lucilia cuprina) hsp23, hsp24, hsp70 and hsp83 genes. Insect Mol. Biol. 2012, 21, 169–180. [Google Scholar] [CrossRef]
  42. Ling, D.; Salvaterra, P.M. Robust RT-qPCR data normalization: Validation and selection of internal reference genes during post-experimental data analysis. PLoS ONE 2011, 6, e17762. [Google Scholar] [CrossRef]
  43. Fu, W.; Xie, W.; Zhang, Z.; Wang, S.; Wu, Q.; Liu, Y.; Zhou, X.; Zhou, X.; Zhang, Y. Exploring valid reference genes for quantitative real-time PCR analysis in Plutella xylostella (Lepidoptera: Plutellidae). Int. J. Biol. Sci. 2013, 9, 792–802. [Google Scholar] [CrossRef] [Green Version]
Figure 1. Box-and-whisker plots of the expression profiles of nine candidate reference genes in different samples of E. furcellata (Wolff). (AE), the raw Ct values of the nine candidate reference genes in samples at different developmental stages (A) female tissues (B) male tissues (C) temperature treatments (D) and starvation treatments (E), respectively. (F) The Ct value distributions of the genes in all samples. Each data point represents the Ct value of each biological replicate for each treatment. The median is represented by a line in the box. The interquartile range is bordered by the upper and lower edges, which indicates the 75th and 25th percentiles, respectively. The whisker caps indicate the minimum and maximum values.
Insects 13 00773 g001
Figure 2. Expression stability ranking of the nine candidate reference genes under different treatment conditions as evaluated by RefFinder. (AF) represent the results obtained from RefFinder in samples at developmental stages (A), in adult female tissues (B), in adult male tissues (C), under temperature treatments (D), under starvation treatments (E), and in all samples (F). A lower GeoMean ranking indicates more stable expression.
Insects 13 00773 g002
Figure 3. Optimal number of E. furcellata reference genes normalized under different experimental conditions. Pairwise variation (Vn/n+1) values obtained from geNorm software were used to determine the optimal number of reference genes required for normalization of qRT–PCR data using the formula Vn/n+1 < 0.15, where n indicates the minimum number of reference genes selected for normalization of qRT–PCR data.
Insects 13 00773 g003
Figure 4. Validation of the recommended reference genes in the samples of different tissues of E. furcellata adult males. The relative expression level of EfurOBP11 was normalized using the most suited (RPS17 and RPL32) and the least suited (β-1-TUB) reference genes. MA, ML, MH, MAB, MW, and MT represent male antenna, male leg, male head, male abdomen, male wing, and male thorax, respectively. The results are depicted as the mean ± SE based on three independent biological replicates, analyzed by one-way analysis of variance (ANOVA), followed by Tukey’s multiple comparison test. The lower-case letters above the bars indicate significant differences (p < 0.05).
Insects 13 00773 g004
Table 1. Details of the primer pairs used for qPCR in Eocanthecona furcellata (Wolff).
GeneAccession NumberPrimer Sequence (5′–3′)Product Length (bp)Tm (°C)Efficiency (%)R2
β-1-TUBON505066F: ACTGACACATTCTCTTGGAGGT
R: GGTGGCGTTATAAGGTTCTACA
15755.0101.10.996
RPL4ON505068F: TTCCCGAAATCCCTCTTGTTG
R: GTCTCCTATTACGCATCTTACCT
16255.097.50.996
RPL32ON505067F: AGGAGGAACTGGCGTAAGC
R: GGAACTAACAGCATGAGCGATT
21355.0103.30.996
SDHAON505070F: GCTCCAGAACTTAATGTTGTGT
R: TACGCCAATGCTCCTCAATAG
17055.0102.60.995
RPS17ON505073F: CGCTATCATTCCTACCAAACCT
R: CTCCAACATCTTCAACATTCCA
21755.095.00.997
RPS25ON505074F: GTCTCCTATTACGCATCTTACCT
R: CTGCTTTAGTCGCCCTGGTA
11555.093.70.995
GAPDH2ON505069F: TCTGTGGTGTCAACTTGGATG
R: CGTCTTCTGAGTAGCGGTAAC
16755.099.70.996
EF2ON505072F: TGGAGGTATCTATGGTGTACTGA
R: AATGGCTTGGTGTTGGTGTC
22855.0104.80.995
UBQON505071F: CGGCAAGACTATCACACTAGAAG
R: ATACCTCCTCTGAGACGAAGTAC
20455.0100.50.990
Note: Abbreviation: β-1-TUB, tubulin beta-1; RPL4, 60S ribosomal protein L4; RPL32, 60S ribosomal protein L32; SDHA, succinate dehydrogenase; RPS17, 40S ribosomal protein S17; RPS25, 40S ribosomal protein S25; GAPDH2, glyceraldehyde-3-phosphate dehydrogenase 2; EF2, elongation factor 2, and UBQ, ubiquitin. The abbreviations are exactly the same as Table 2 and Figures 1, 2 and 4.
Table 2. Expression stability of the candidate reference genes under different experimental conditions.
Experimental ConditionsReference Gene∆CtBestKeeperNormFindergeNorm
StabilityRankStabilityRankStabilityRankStabilityRank
Developmental stagesβ-1-TUB0.90480.78980.78580.6228
RPL40.80270.88890.66270.5497
RPL320.54210.42230.15310.3061
SDHA0.99290.54470.90190.7059
RPS170.57440.4850.24830.3324
RPS250.55620.47740.21720.3061
GAPDH20.67450.37710.41750.4275
EF20.56730.52560.25640.3133
UBQ0.72860.38820.5360.4866
Female tissuesβ-1-TUB1.91591.20791.77491.2679
RPL41.05520.73940.61420.4341
RPL321.21161.0480.93370.5433
SDHA1.49780.96171.17681.0828
RPS171.0310.78850.63330.4341
RPS251.10940.70430.71340.6184
GAPDH21.17450.93160.78050.6985
EF21.10230.63110.55210.7916
UBQ1.30970.64720.90660.9447
Male tissuesβ-1-TUB1.52591.0391.41390.9669
RPL40.92450.61340.65750.5295
RPL320.79630.47130.46830.2641
SDHA1.14680.82570.90580.8068
RPS170.73710.42310.32610.2641
RPS250.82440.44420.50840.3583
GAPDH20.97670.81360.71470.6236
EF20.79420.67150.36120.4684
UBQ0.9760.84680.66160.6937
Temperature treatmentsβ-1-TUB0.40730.30250.24730.241
RPL40.41840.31660.27640.241
RPL320.39820.2110.2220.2854
SDHA0.48470.28840.35970.3847
RPS170.37610.2630.17310.2533
RPS250.47760.24120.34960.3516
GAPDH20.59890.37480.51790.4619
EF20.46050.32770.33650.3165
UBQ0.52980.41090.4280.4228
Starvation treatmentsβ-1-TUB0.65390.40760.57590.5099
RPL40.46540.41670.28640.3514
RPL320.47950.29230.31350.3011
SDHA0.45830.36540.28230.3011
RPS170.40410.28420.11410.3333
RPS250.43720.24410.22120.3755
GAPDH20.51660.43990.38160.3996
EF20.63680.42680.55380.4688
UBQ0.53570.40650.40970.4257
All samplesβ-1-TUB1.37491.18291.18091.0509
RPL40.94631.07980.60420.5103
RPL320.94220.97360.62240.3551
SDHA1.26680.72911.04280.9588
RPS170.87910.91340.48810.3551
RPS250.94641.00270.62650.6314
GAPDH20.96260.85920.62860.7075
EF20.97250.91340.62130.7706
UBQ1.12770.90930.86070.8577
Publisher’s Note: MDPI stays neutral with regard to jurisdictional claims in published maps and institutional affiliations.

