Article

Acclimation Effects of Natural Daily Temperature Variation on Longevity, Fecundity, and Thermal Tolerance of the Diamondback Moth (Plutella xylostella)

Shanxi Key Laboratory of Integrated Pest Management in Agriculture, College of Plant Protection, Shanxi Agricultural University, Taiyuan 030031, China
*
Author to whom correspondence should be addressed.
Insects 2022, 13(4), 309; https://doi.org/10.3390/insects13040309
Submission received: 16 February 2022 / Revised: 15 March 2022 / Accepted: 18 March 2022 / Published: 22 March 2022
(This article belongs to the Section Insect Physiology, Reproduction and Development)

Abstract

:

Simple Summary

Diurnal, monthly, or seasonal temperatures can fluctuate substantially. Daily temperature amplitudes (DTAs) can significantly impact the traits of insects but there is limited evidence from the natural environment. Therefore, we studied the acclimation effects of DTA on the longevity, total fecundity, early fecundity, and thermal tolerance of adult diamondback moths (Plutella xylostella) under environmental conditions. The longevity, total fecundity, early fecundity, and heat thermal tolerance of adults significantly changed under different DTAs. These findings highlight the effects of DTA on the acclimation response in the P. xylostella phenotype, and DTA should be incorporated into prediction models for assessing insect populations and the effects of climate change.

Abstract

Daily temperature amplitudes (DTAs) significantly affect the ecological and physiological traits of insects. Most studies in this field are based on laboratory experiments, while there is limited research on the effects of changes in DTA on insect phenotypic plasticity under natural conditions. Therefore, we studied the acclimation effects of DTA on the longevity, total fecundity, early fecundity, and the thermal tolerance of adult diamondback moths (Plutella xylostella L.) under naturally occurring environmental conditions. As DTAs increased, male longevity and total fecundity decreased, and early fecundity increased. An increase in DTA was significantly associated with the increased heat coma temperature (CTmax) of both males and females, but had no significant effect on their cold coma temperature (CTmin). Our findings highlight the effects of DTA on the acclimation response of P. xylostella and emphasize the importance of considering DTA in predicting models for assessing insect populations and the effects of climate change.

1. Introduction

Temperature has a significant effect on the physiological metabolism [1], growth and development [2,3], survival and reproduction [4,5,6], behavior [7,8], and other core life activities of organisms. Environmental temperatures not only vary in terms of mean temperature but also fluctuate daily, monthly, and seasonally [9]. Many researchers have focused on the effects of climate change on biological phenotypes under different mean temperatures in recent decades [10,11]. In recent years, the effect of temperature fluctuations on different organisms have attracted increasing attention [12,13,14].
Acclimation is a process in which organisms adjust to a change in their environment, such as atmospheric pressure, temperature, humidity, photoperiod, and pH. Temperature acclimation has an important effect on various organisms [15] such as mollusks [16], reptiles [17], birds [18], and fish [19], and it also has a significant effect on insects, which have a short life cycle and high sensitivity to temperature [20]. Temperature acclimation substantially affects the prospects for insect population dynamics and survival [21]. Laboratory studies have mainly focused on constant temperatures [22], while fewer studies have investigated two-step temperature variation [23,24,25] or only simulated daily high-temperature changes to investigate the responses of insect life history traits [26], heat tolerance [27], thermal escape behaviors [28], and fitness [29]. In the field, some studies have explored the mixed effect of acclimation to the environmental mean and variance in temperature on insect behavior [30], life-history traits [31], physiological and biochemical traits [32], temperature tolerance [33], and gene expression [34]. To improve ecological relevance, the effects of temperature acclimation should pay more attention to temperature amplitudes at a similar mean temperature. There is a lack of studies investigating thermal tolerance and the underlying functional transcriptomic responses in relation to insect acclimation to daily temperature amplitude [35].
Plutella xylostella L. (Lepidoptera: Plutellidae) is a major pest of cruciferous vegetables and it is distributed worldwide [36]. Studies have shown that temperature has a significant effect on not only the development [37], survival [38], and reproduction [39] of P. xylostella but also its migration pattern and regional distribution [40]. Correlation studies between P. xylostella traits and temperature have mainly focused on the changes in a constant temperature gradient or on a two-step temperature change [41,42]. The amplitude of temperature change has significant effects on the different developmental stages of P. xylostella in the laboratory [43,44,45]. The acclimation effects of natural temperature fluctuations on the life-history traits and temperature tolerance of P. xylostella need further verification.
Therefore, in this study, we examined the influence of temperature amplitudes under environmental conditions on the phenotype of P. xylostella, including adult longevity, total fecundity, early fecundity, and heat and cold tolerance. We addressed the two following questions: (1) what are the acclimation effects of natural temperature amplitudes on longevity, total fecundity, early fecundity, and other traits? (2) Do natural temperature amplitudes affect temperature tolerance?

2. Materials and Methods

2.1. Insect Rearing

Plutella xylostella individuals were collected from Wuhan, China (30.62° N, 114.13° E), and were raised indoors on an artificial diet (Southland Products, Inc., Lake Village, AK, USA) at a constant temperature of 25 ± 1 °C, relative humidity (RH) of 50–70%, and a daily cycle of 15 h of light and 9 h of darkness [45].
A 24-well orifice plate was sterilized by irradiation with ultraviolet light for 30 min. Thereafter, 1.7 mL of the artificial feed was injected into each well to feed P. xylostella. New eggs (laid within the last 4 h) were transferred to each well (one egg per well) using a paintbrush. The perforated plates were covered with a fine (200 mesh) nylon mesh for ventilation and placed outside at an ambient temperature. The artificial feed was replaced with fresh feed once daily. The development and survival of P. xylostella individuals were recorded at 08:00 h every day. Within 4 h of pupal emergence, the adults were moved indoors to mate and breed. Newly paired adults were moved to a glass tube (3 cm × 12 cm) for mating and spawning. A nylon mesh (200 mesh) was attached to both ends of the glass tube, and cotton balls (immersed in 10% honey water) were placed in the tubes for feeding. From 15:00 to 16:00 h, the egg cards (3 cm × 4 cm sealing film soaked in cabbage juice) were placed in each glass tube for egg laying. The glass tubes, egg cards, and cotton balls were replaced at 08:00 h every day until the adults died. The total number of eggs laid per day was recorded.

2.2. Experimental Protocol

Four batches of new eggs produced within 4 h (approximately 200 eggs per batch) were placed outside the lab to be exposed to different ambient temperatures in Fanshi County, a major cruciferous vegetable planting area in Shanxi Province, China. Here, the mean monthly temperature does not significantly change in summer when vegetables are usually planted; however, the monthly temperature amplitudes change significantly (Table 1 and Figure 1). Batches 1–4 were placed outdoors from 24 May to 17 June, 30 June to 18 July, 22 July to 10 August, and 14 August to 30 August 2011, respectively, and exposed to different daily temperature amplitudes.
P. xylostella were developed outside under the different daily temperature amplitudes from the egg stage to the pupal stage. During this time, the larvae were artificially fed. Then, the newly emerged adults (within 4 h of emergence) were moved indoors (at a constant temperature of 25 ± 1 °C and a moderate RH of 50–70%) and divided into two groups.
In the first group, after pupal emergence, the new females were paired with males in 4 h. The numbers of new pairs for the different temperature amplitudes were as follows: ±4.1 °C: 10; ±5.2 °C: 10; ±6.1 °C: 11; ±7.3 °C: 11. The new pairs were transferred to the glass tubes for mating and oviposition. Then, the longevity (number of days from emergence to death), total fecundity (total number of eggs), and early fecundity (percentage of eggs laid during the first three days of the oviposition period relative to the total number of eggs) were measured.
In the second group, the heat and cold tolerance of each adult was measured using Huber (Peter Huber Kältemaschinenbau AG, Offenburg, Germany). To measure heat tolerance, adults were placed in a closed and transparent reaction kettle (Huber external equipment). The ambient temperature in the reaction kettle was increased from 22 to 45 °C at a rate of 0.1 °C/min. During this period, we recorded heat coma temperature (CTmax) as the temperature at which the last movement of an individual’s foot or tentacle was observed. Sixty adults were used for each treatment with a sex ratio of 1:1. To measure the cold tolerance, adults were placed in the same equipment. The ambient temperature in the reaction kettle was decreased from 22 °C to 15 °C at a rate of 0.5 °C/min, followed by a decrease to 0 °C at a rate of 0.1 °C/min, and the individuals were maintained at this temperature for 5 min. During this period, we recorded cold coma or chill coma temperature (CTmin) as the temperature at which the last movement of an adult’s foot or tentacle was observed. Sixty adults per treatment were used with a sex ratio of 1:1.

2.3. Statistical Analysis

All data were analyzed using SPSS 21.0 (SPSS Inc., Chicago, IL, USA). All data were evaluated for normality and homoscedasticity and, if needed, were arcsine-, square root-, or log-transformed. The CTmin and CTmax of males and CTmax of females were square root-transformed, whereas the longevity of males and females was transformed using log10 (x + 1) before analysis. Pearson correlation coefficient [46] and stepwise multiple regression [47] was performed to determine how the main temperature-related factors, such as the daily mean temperature, daily temperature amplitude, daily high temperature, and daily low temperature, affected different traits of P. xylostella. The data were subjected to one-way analysis of variance (ANOVA) to assess the effects of different DTAs on the longevity of females and males, total fecundity, early fecundity, CTmin, and CTmax. Means were separated using Tukey’s honestly significant difference (HSD) test (one-way ANOVA) when significant differences were found at p < 0.05, and they are shown as mean ± standard deviation (SD).

3. Results

3.1. Correlation Analysis among P. xylostella Traits and Temperature Factors

Pearson correlation analysis was performed to explore the possible association among temperature factors and P. xylostella traits. The daily mean temperature, daily high temperature, and daily low temperature were not correlated with P. xylostella traits. The daily temperature amplitude was highly correlated with most of the traits of P. xylostella (r2 > 0.7) (Table 2). The stepwise multiple regression analysis revealed that the daily mean temperature did not affect P. xylostella traits. Daily high temperature, and daily low temperature affected female CTmax (y4 = 5.962 x1 5.102 x2 + 4.433 x3; F = 41.917; df = 3.120; p < 0.001) (Table 3). Daily temperature amplitude significantly affected the male longevity (y1 = −0.441 x1; F = 9.658; df = 1.42; p = 0.003), total fecundity (y2 = −0.479 x1; F = 11.902; df = 1.42; p = 0.001), early fecundity (y3 = −0.497 x1; F = 12.140; df = 1.42; p = 0.001), female CTmax (y4 = 5.962 x1 5.102 x2 + 4.433 x3; F = 41.917; df = 3.120; p < 0.001), and male CTmax (y5 = 0.658 x1; F = 89.926; df = 1.120; p < 0.001) (Table 3). Through these analyses, the most important factor in P. xylostella traits was assigned to the daily temperature amplitude.

3.2. Influence of Temperature Amplitude on the Longevity and Fecundity

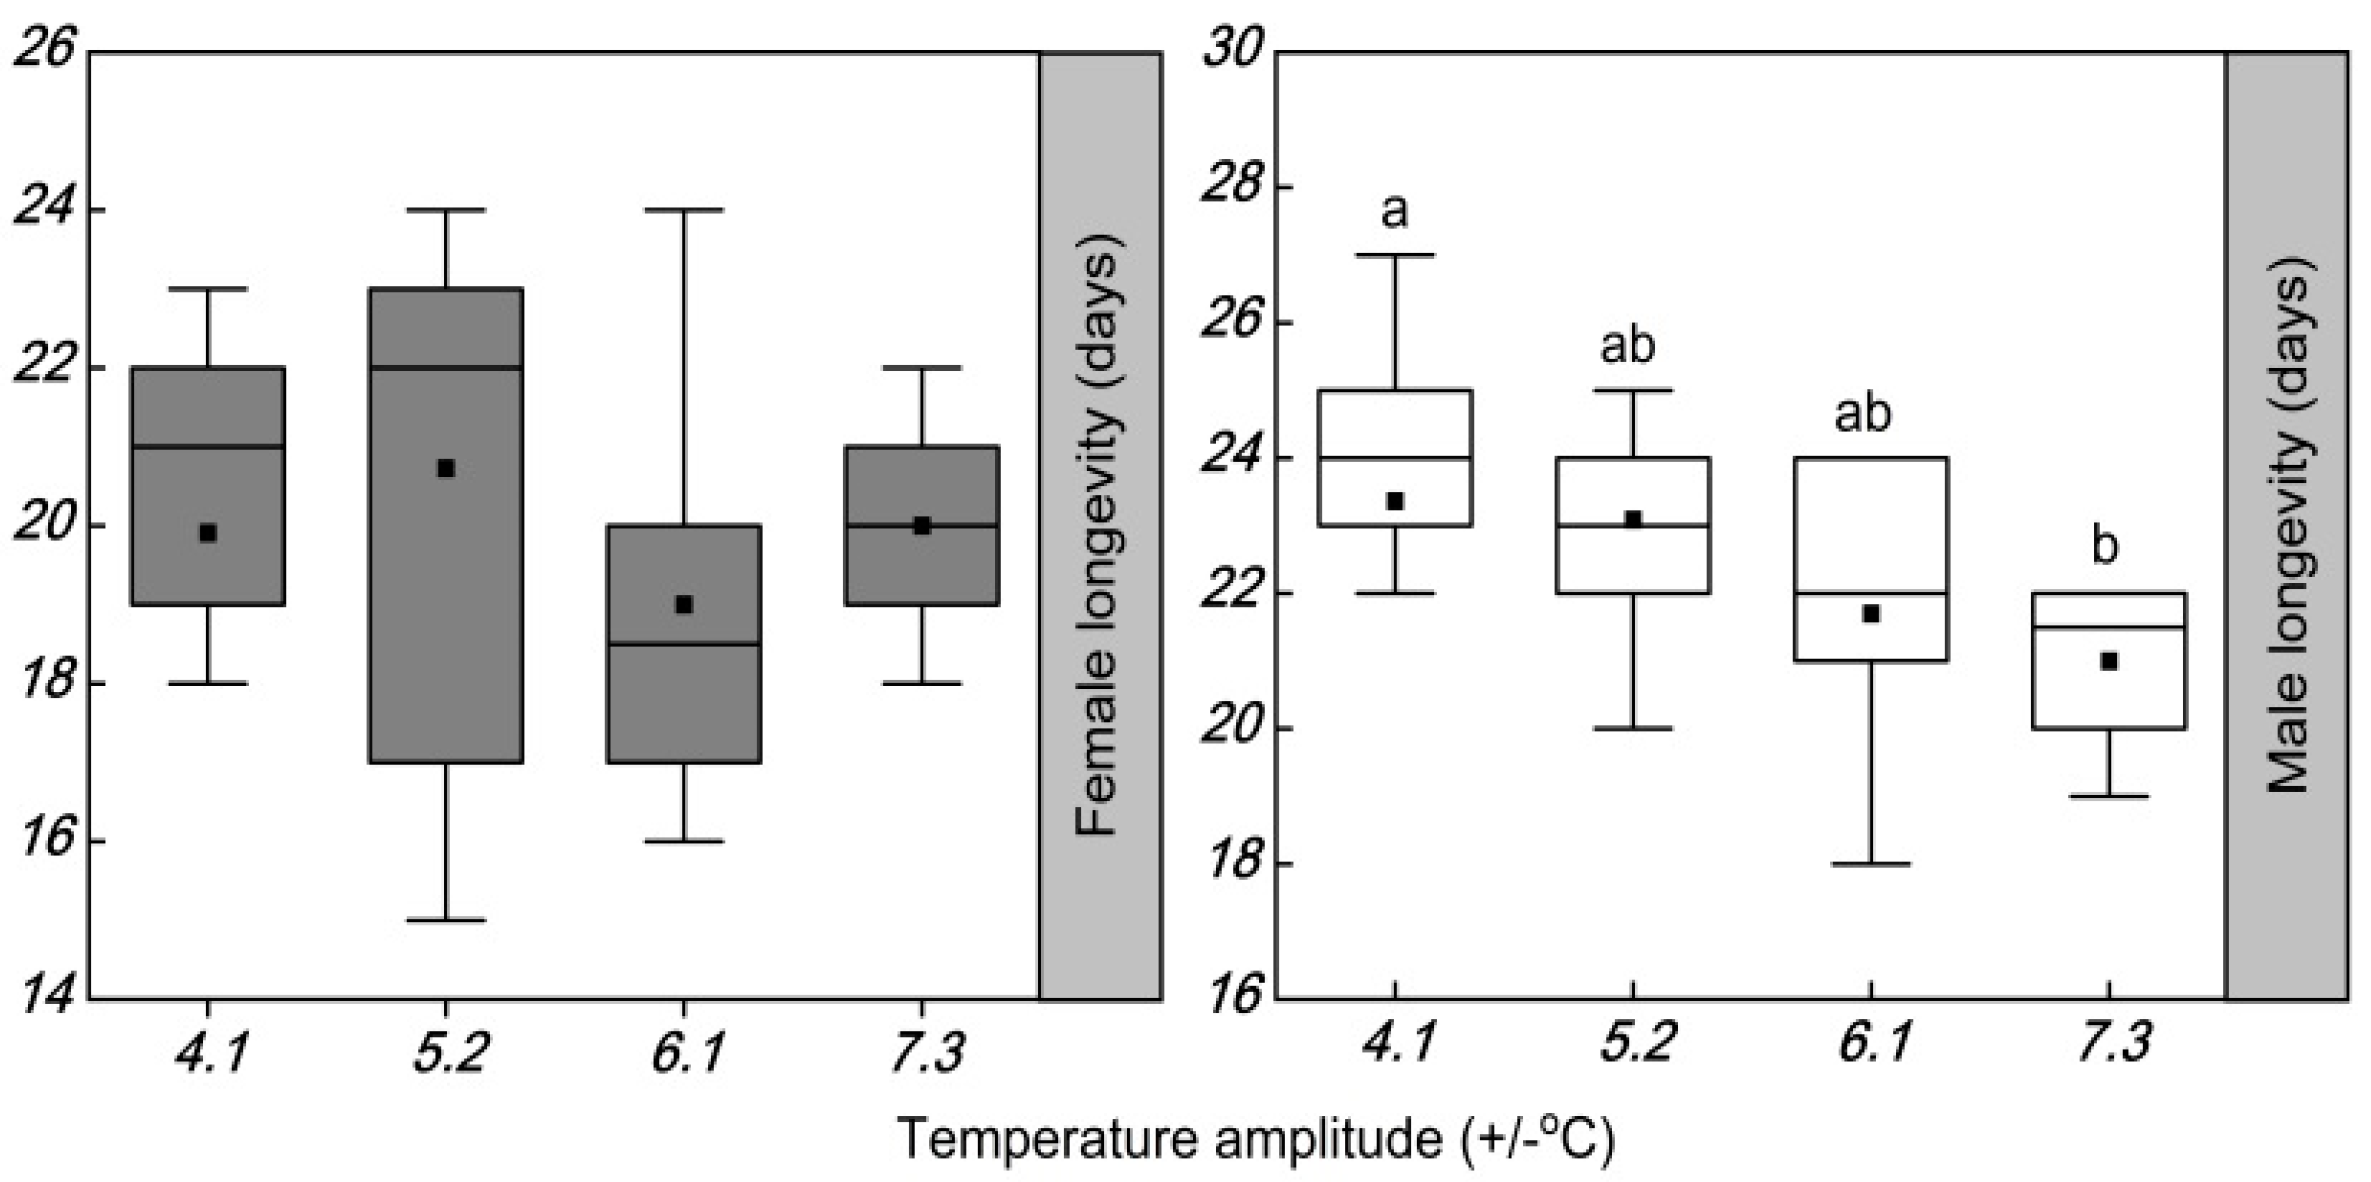
The temperature amplitudes had no significant effect on the longevity of females (F = 1.081; df = 3, 42; p = 0.369), but significantly increased the longevity of males (F = 4.309; df = 3, 42; p = 0.010) (Table 4 and Figure 2). There were significant differences in the longevity of males among the amplitude temperatures of ±4.1, ±5.2, and ±7.3 °C. The longevity of males was reduced by 0.3, 1.7, and 2.4 days at temperature amplitudes of ±5.2, ±6.1, and ±7.3 °C, respectively, compared with that at the amplitude temperature of ±4.1 °C.
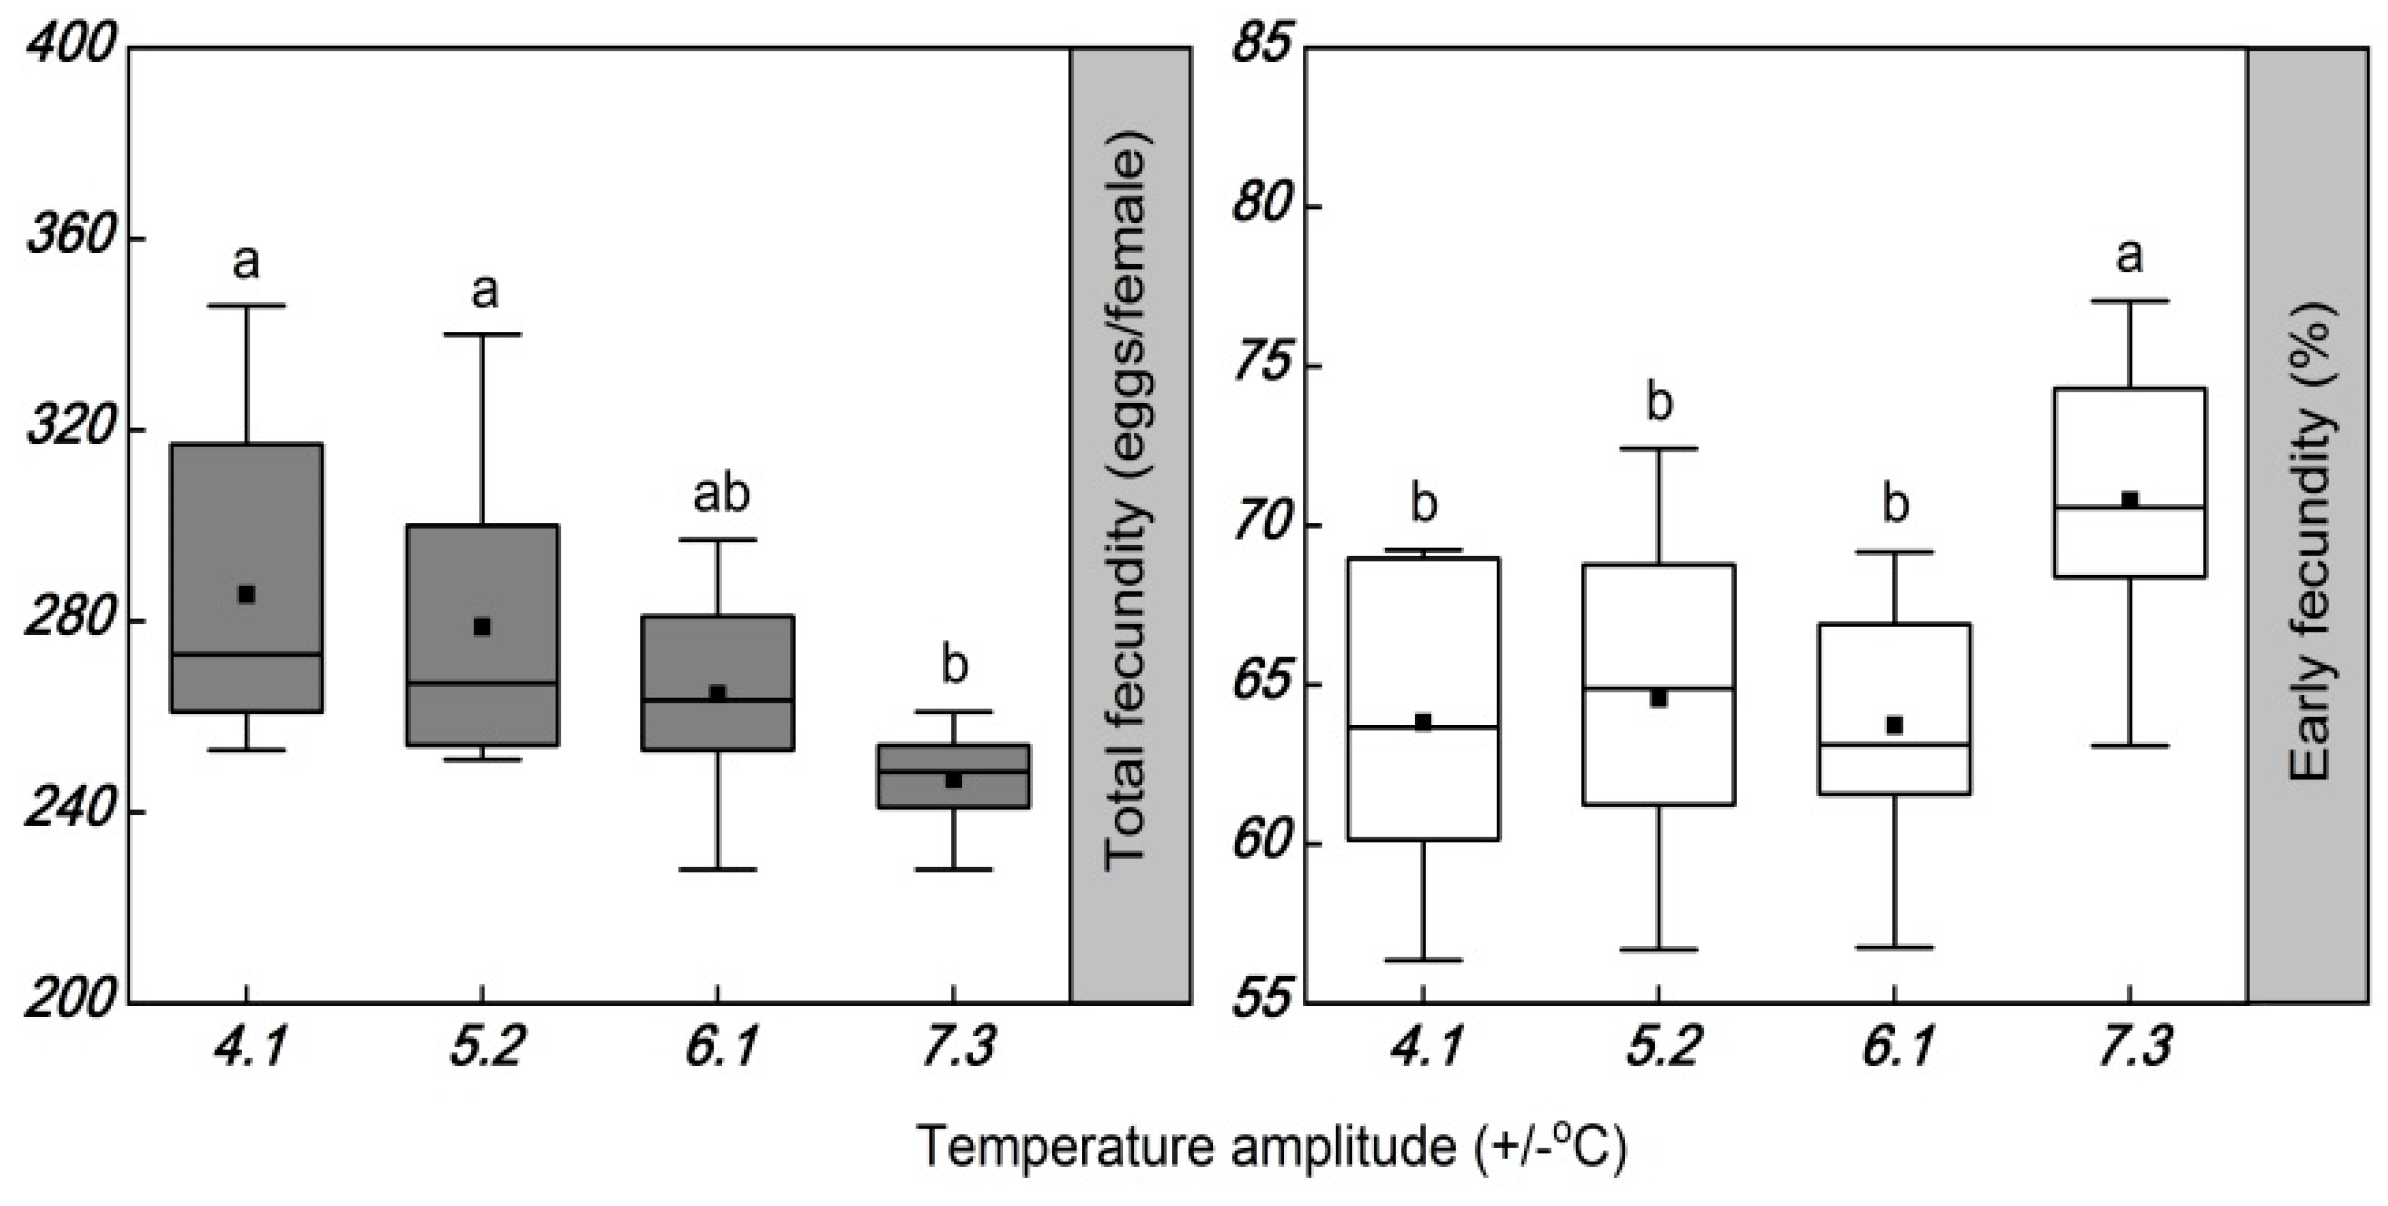
The temperature amplitudes significantly decreased the total fecundity (F = 4.094; df = 3, 42; p = 0.013) (Table 4 and Figure 3). The total fecundity was significantly different among females exposed to the temperature amplitudes of ±4.1, ±5.2, and ±7.3 °C. Compared to the temperature amplitude of ±7.3 °C, the total fecundity was increased by 36.0 and 31.9 eggs per female at temperature amplitudes of ±4.1 and ±5.2 °C, respectively.
The temperature amplitudes induced a significant increase in early fecundity (F = 6.033; df = 3, 42; p = 0.0021) (Table 4 and Figure 3). The early fecundity increased by 7.0%, 6.2%, and 7.1%, in the temperature amplitudes of ±4.1, ±5.2, and ±6.1 °C, respectively, compared with that of females exposed to the temperature amplitude of ±7.3 °C (70.8%).

3.3. Influence of Temperature Amplitude on the Thermal Tolerance

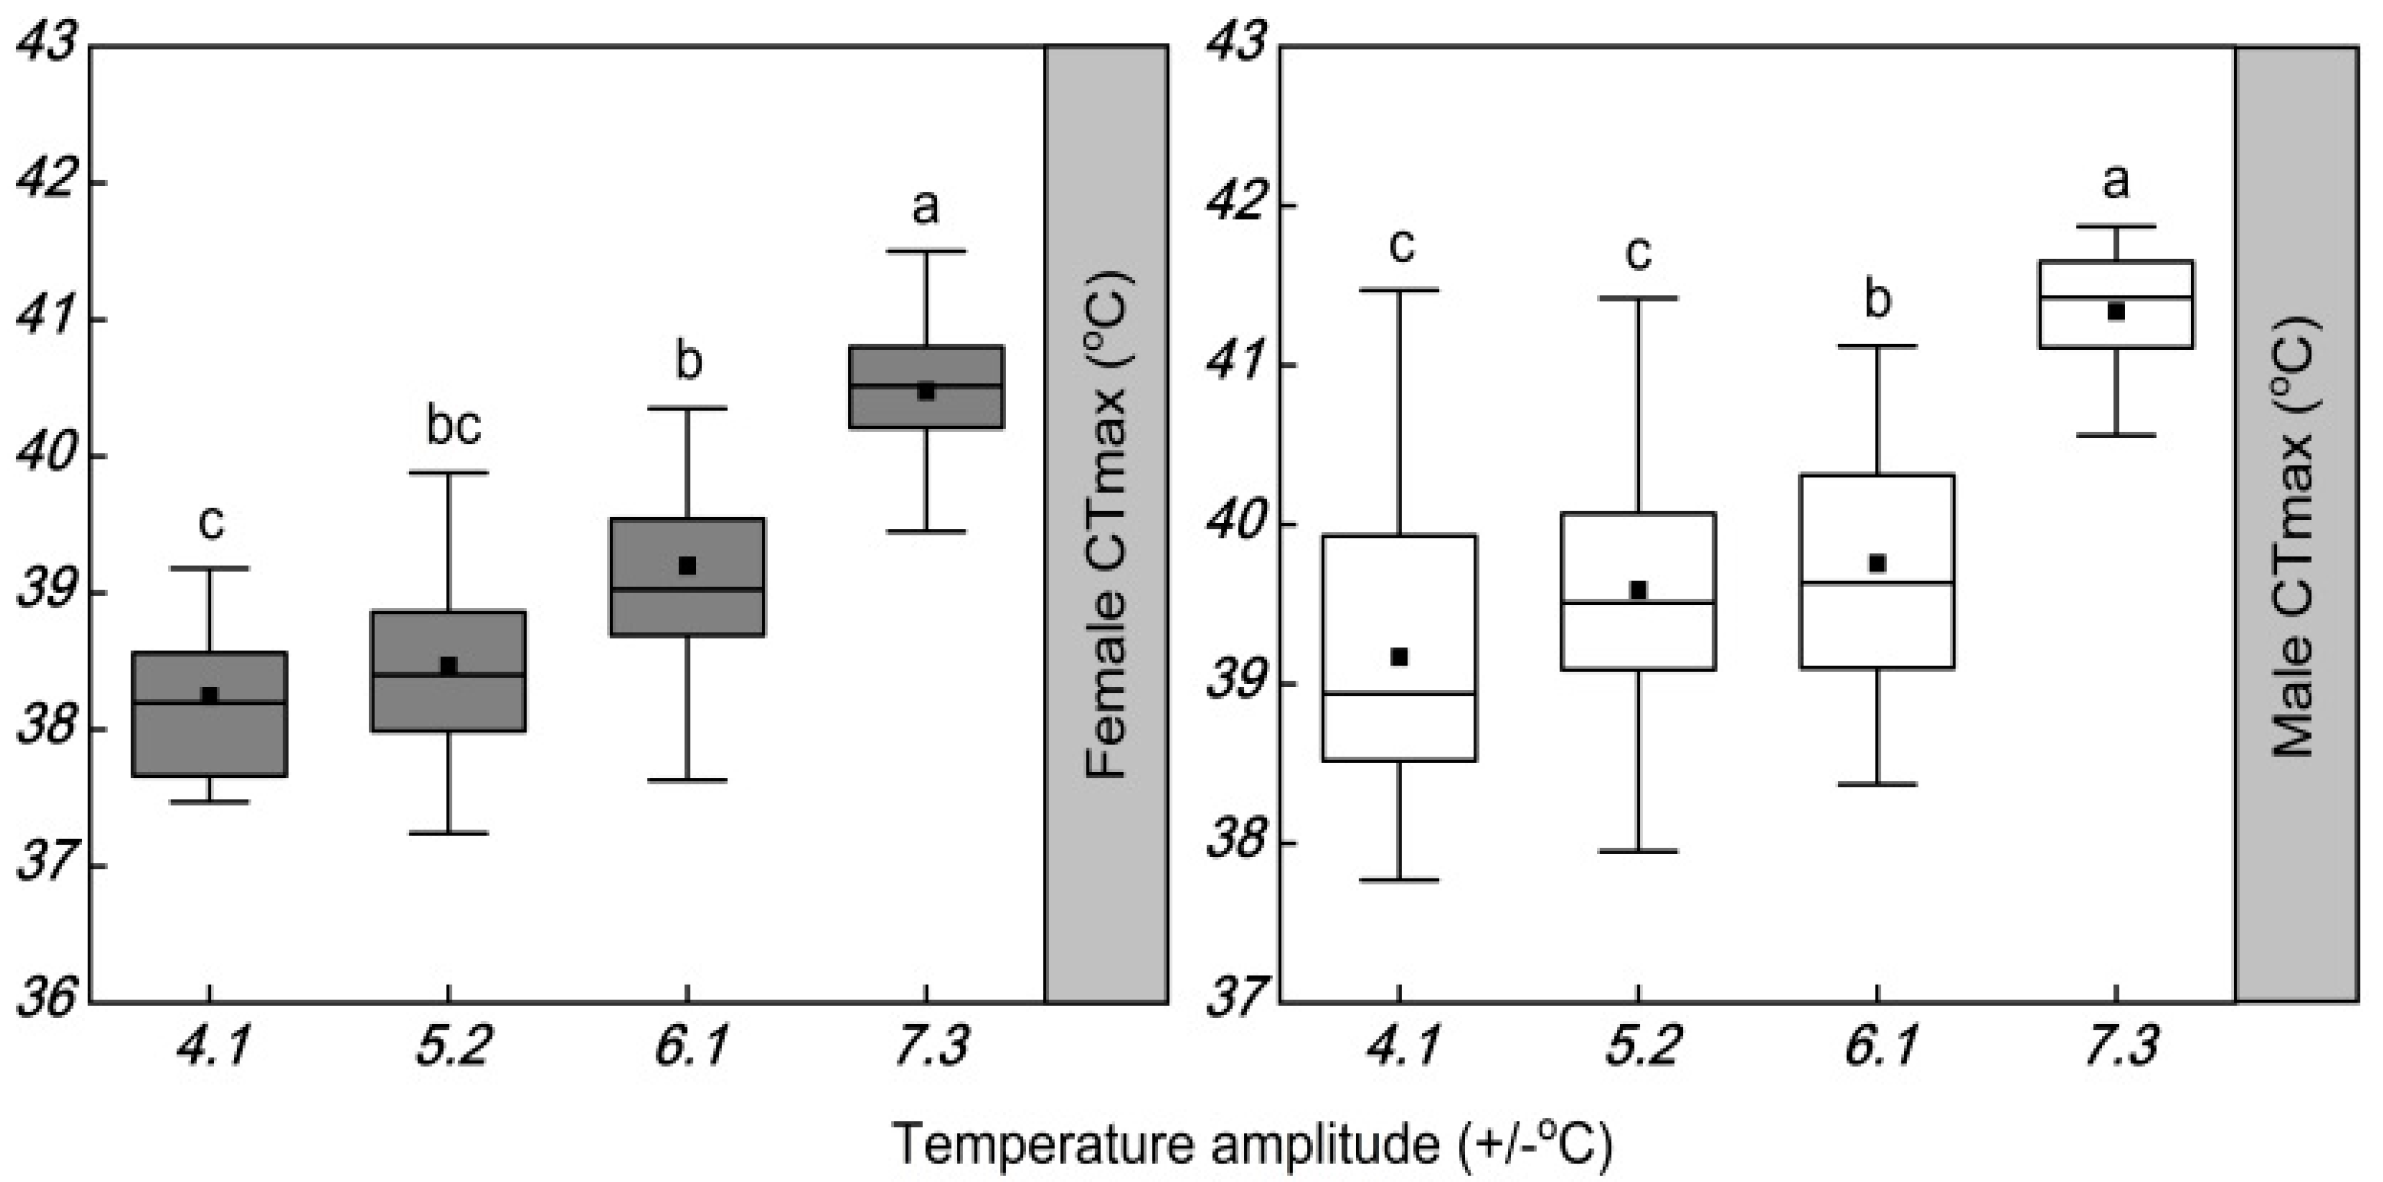
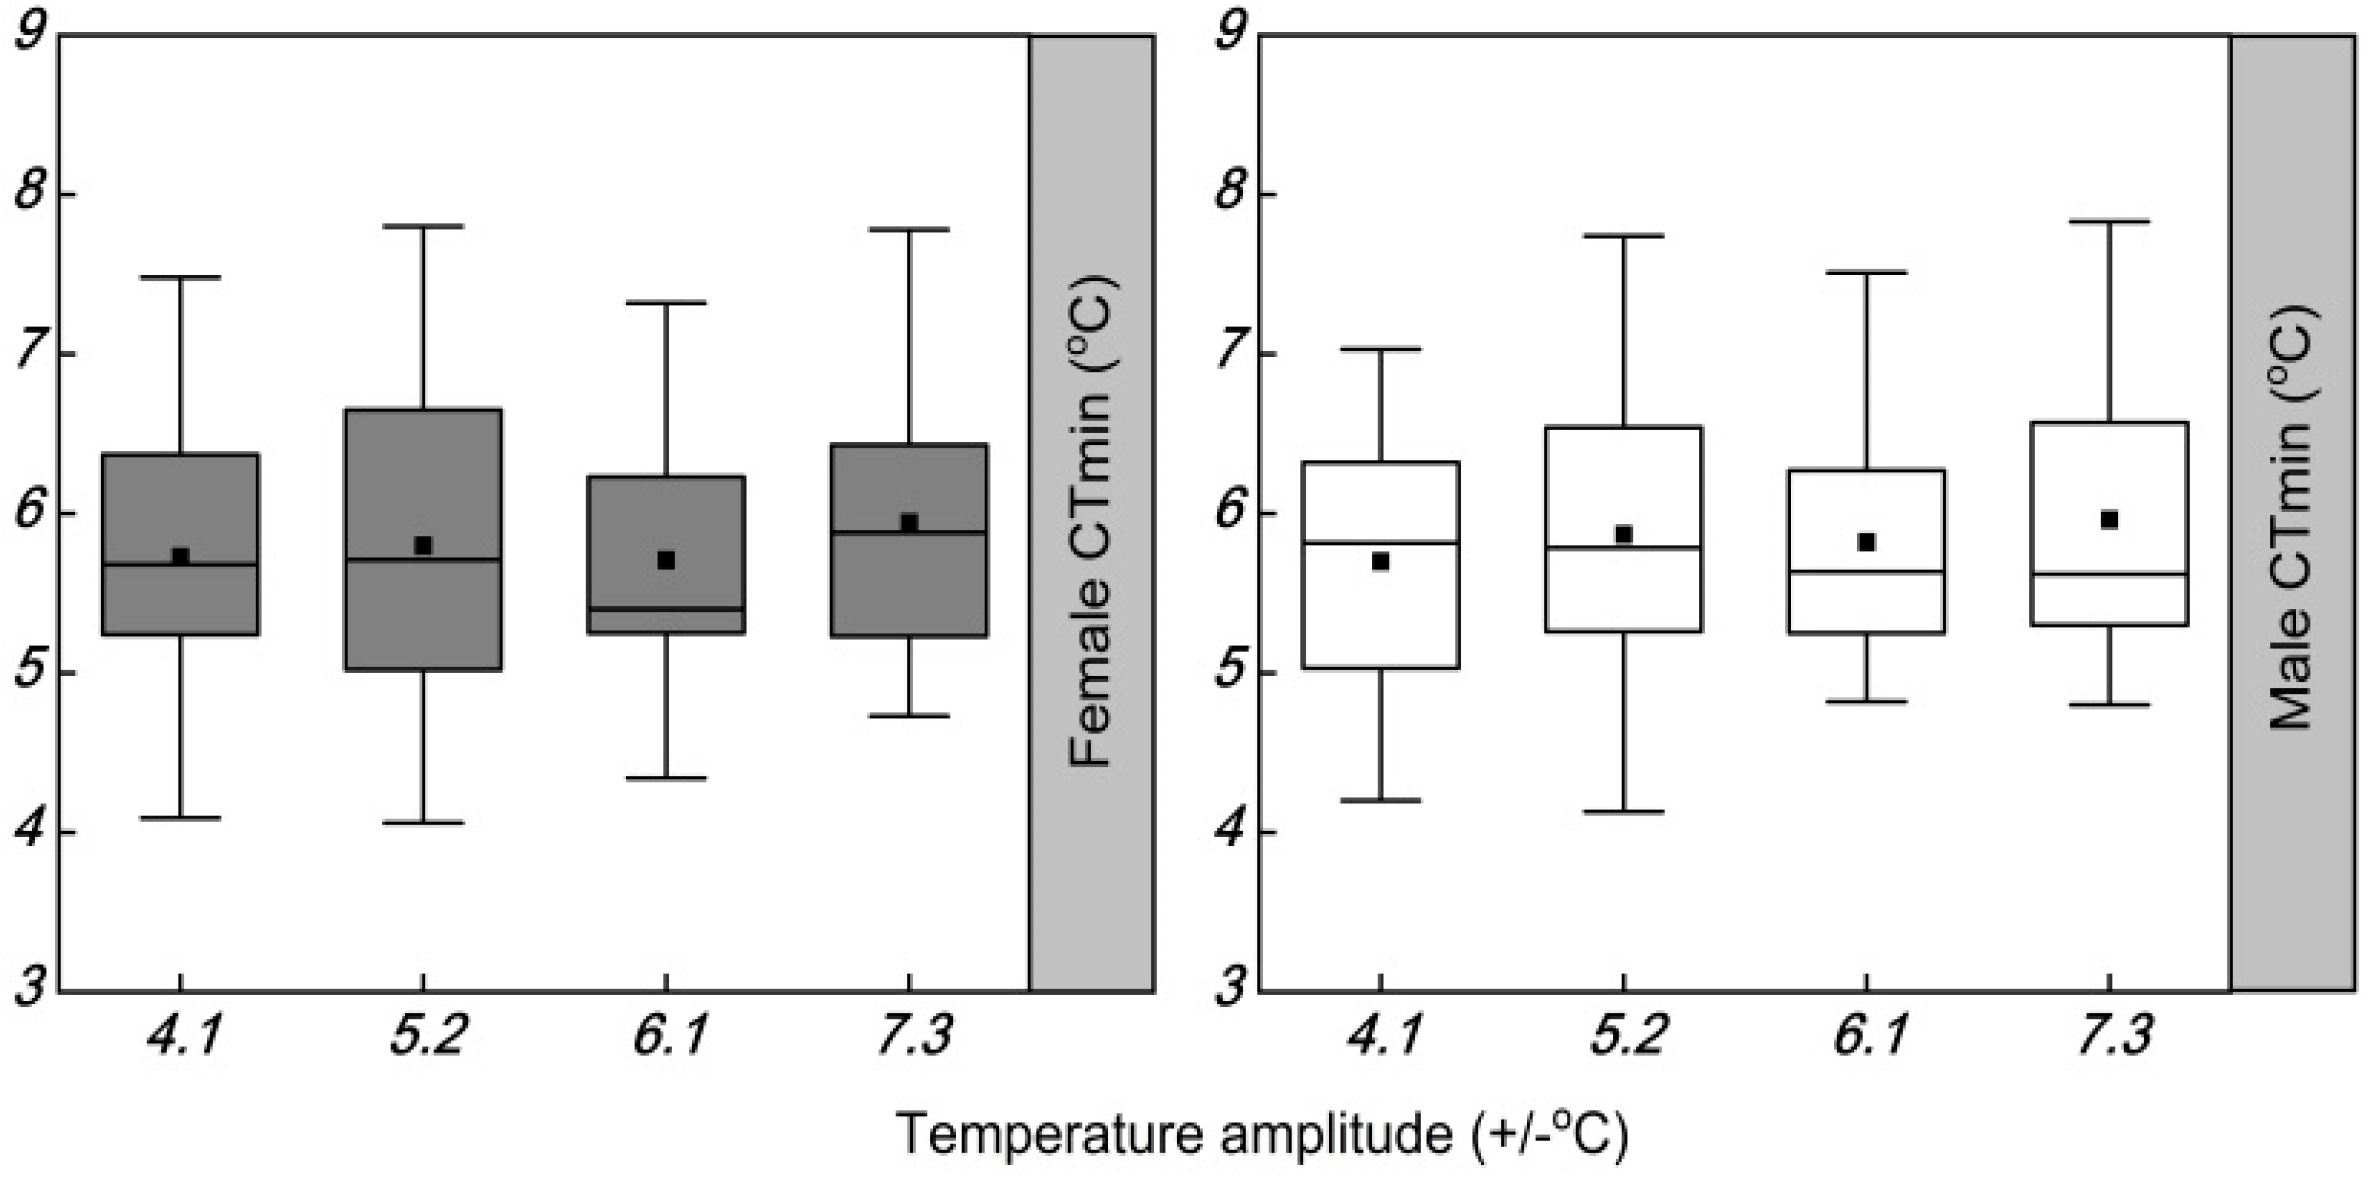
The temperature amplitudes significantly increased the CTmax of females (F = 44.374; df = 3, 120; p < 0.001) (Table 4 and Figure 4). The CTmax of females was reduced by 2.1, 1.7, and 1.6 °C at temperature amplitudes of ±4.1, ±5.2, and ±6.1 °C, respectively, compared with the widest temperature amplitude of ±7.3 °C. The temperature amplitudes also had a significant increase in the CTmax of males (F = 53.481; df = 3, 120; p < 0.001) (Table 3). The CTmax of male was significantly different between the temperature amplitudes of ±7.3 and ±6.1 °C, but not between the temperature amplitudes of ±5.2 and ±4.1 °C. Compared with the temperature amplitude of ±7.3 °C, the temperature amplitudes of ±4.1, ±5.2, and ±6.1 °C caused the CTmax of males to decrease by 2.2, 2.0, and 1.3 °C, respectively. The temperature amplitudes had no significant effect on the CTmin of females (F = 0.502; df = 3, 120; p = 0.682) or males (F = 0.374; df = 3, 120; p = 0.772) (Table 4 and Figure 5).

4. Discussion

4.1. Influence of Temperature Amplitudes on Longevity and Fecundity

Temperature amplitudes had differential effects on the longevity of adult P. xylostella. The amplitudes did not affect the longevity of females, but the longevity of males was significantly reduced with the increase in temperature amplitudes. This difference can be attributed to a higher heat tolerance in females than in males [48]. In addition, with an increase in the temperature amplitudes, when the daily high temperature was close to or exceeded 30 °C, male longevity gradually shortened. This suggests that temperature did not inhibit male longevity above 30 °C. This result differed from that which was previously reported. For example, at constant temperatures, male longevity was 8.9 days at 20 °C; at 27.5 °C, it reached its lowest value (6.7 days), but it was significantly increased up to 9.2 days at 30 °C [49]. This indicates that male longevity was significantly prolonged at 30 °C. This difference could be because when P. xylostella individuals are exposed to high daily temperatures, their metabolic rates for the synthesis of heat shock proteins and polyhydroxy compounds increase, and so does their heat resistance [50]. When an adult is exposed to a high temperature during the day, an appropriate recovery temperature at night can slow down the metabolic rate and reduce energy loss, allowing the insect to accumulate sufficient energy and resist the adverse effects of the next high-temperature period. Thus, after exposure to daily high temperatures, the appropriate recovery temperature at night plays a role in the repair of the cellular or protein structural recovery of insect [51].
The temperature amplitude of ±7.3 °C significantly inhibited the total fecundity of P. xylostella. Insects subjected to various environmental stresses, such as malnutrition [52], temperature stress [45,53], and oxygen stress [54], at a certain developmental stage can experience direct negative effects on survival, development, and reproduction. These outcomes can be attributed to no significant change in the number of cells in the body after an organism experiences environmental stress at a certain developmental stage [55], but they have a significant effect on energy distribution in the body [56]. When the P. xylostella individual was subjected to a temperature amplitude of ±7.3 °C (daily high temperature up to 30 °C), it led to a higher expression of heat shock proteins (HSPs) [57]. This process increases energy consumption [58], which may cause a significant reduction in the total fecundity [59].
We also found that early fecundity by adults significantly increased after exposure to a temperature amplitude of ±7.3 °C. The early fecundity significantly increased (up to 71%) at the temperature amplitude of ±7.3 °C, compared with 64% of females at the temperature amplitude of ±4.1 °C. Environmental stress can induce adults to lay eggs as early as possible to avoid adverse effects later in life [45,60]. In our study, the variation in early fecundity, caused by a daily high temperature (30 °C) with a temperature amplitude of ±7.3 °C, may have been a response to temperature stress, causing accelerated spawning under adverse conditions to maximize fitness before further deterioration and to prevent further damage later in the life cycle, or may be a trade-off of temperature acclimation at the expense of fecundity.

4.2. Influence of Temperature Amplitude on Thermal Tolerance

There was a significant difference in the heat tolerance of adults after a change in the temperature amplitudes. However, the cold tolerance of adults was not affected. There are two hypotheses on the relationship between cold tolerance and heat tolerance in insects. One hypothesis suggests that heat and cold tolerances in insects are relatively independent of each other [61], the other hypothesis suggests that there is a positive correlation between heat and cold tolerances in insects [62]. Our results showed that the heat and cold tolerances (CTmax and CTmin) of P. xylostella adults were relatively independent of their responses to hot and cold periods in a fluctuating-temperature experiment, suggesting that different regulatory mechanisms or pathways might be involved [13]. We also showed that even when the mean temperature in the natural environment was suitable for the survival and development of P. xylostella, its heat tolerance significantly improved when individuals experienced wide temperature amplitudes. This finding is not consistent with previous studies on the heat tolerance of P. xylostella. In particular, after feeding at constant temperatures of 20 °C, 25 °C, and 30 °C, no significant differences were observed in the heat tolerance of P. xylostella adults [63]. Insects exposed to a high temperature approaching or reaching the heat tolerance limit during a short period produced more heat shock proteins than those exposed to constant temperatures. Wide temperature amplitudes could have beneficial effects on the heat tolerance of insects [64].

4.3. Implications for Pest Population Modeling

To understand the effects of environmental conditions on insect population dynamics and distribution, the degree-day model based on the mean temperature was widely used [65,66,67]. However, the effects of daily temperature amplitude at similar mean temperatures are often overlooked. We found that the longevity, total fecundity, early fecundity, and thermal tolerance of P. xylostella significantly changed under DTAs. These temperature amplitude patterns during the day and night under similar mean temperatures should be incorporated into prediction models for insect populations to simulate the effects of complex temperature patterns in nature on the ecology of P. xylostella populations and to predict the occurrence of this pest in the field.

5. Conclusions

In summary, this study provides an overview of the longevity, total fecundity, early fecundity, and thermal tolerance of P. xylostella under temperature fluctuations in a field setting. It is imperative to employ temperature fluctuations corresponding to the field conditions experienced by P. xylostella from the egg stage to the pupal stage. Our findings highlight the effects of DTAs on the phenotype and acclimation response of P. xylostella, thus emphasizing the importance of considering DTA when predicting models for assessing insect populations and the effects of climate change.

Author Contributions

Conceptualization, K.X.; formal analysis, K.X.; funding acquisition, F.Z.; methodology, K.X.; project administration, F.Z.; writing—original draft, K.X.; writing—review and editing, K.X. and F.Z. All authors have read and agreed to the published version of the manuscript.

Funding

This research was financially supported by the National Key Research and Development Program (2021YFD1901101-4), the Natural Science Foundation of Shanxi Province (201701D121113), the Foundation of Shanxi Academy of Agricultural Sciences (YBSJJ1512, YYDZX16, and YCX2018D2BH5), and the Province Key Research and Development Program of Shanxi (201603D21110-2).

Institutional Review Board Statement

Not applicable.

Informed Consent Statement

Not applicable.

Data Availability Statement

The data used to support the findings of this study are available from the corresponding author upon request.

Acknowledgments

We thank Lin Wang and Zheng Zhusheng for assistance in completing the experiments.

Conflicts of Interest

The authors declare no conflict of interest. The funders had no role in the design of the study; in the collection, analyses, or interpretation of data; in the writing of the manuscript, or in the decision to publish the results.

References

  1. Gillooly, J.F.; Brown, J.H.; West, G.B.; Savage, V.M.; Charnov, E.L. Effects of size and temperature on metabolic rate. Science 2001, 293, 2248–2251. [Google Scholar] [CrossRef] [PubMed] [Green Version]
  2. Gillooly, J.F.; Charnov, E.L.; West, G.B.; Savage, V.M.; Brown, J.H. Effects of size and temperature on developmental time. Nature 2002, 417, 70–73. [Google Scholar] [CrossRef] [PubMed]
  3. Savage, V.M.; Gillooly, J.F.; Brown, J.H.; West, G.B.; Charnov, E.L. Effects of body size and temperature on population growth. Am. Nat. 2004, 163, 429–441. [Google Scholar] [CrossRef] [Green Version]
  4. Schmid, W.D. Survival of frogs in low temperature. Science 1982, 215, 697–698. [Google Scholar] [CrossRef]
  5. Zhou, Z.S.; Guo, J.Y.; Chen, H.S.; Wan, F.H. Effects of temperature on survival, development, longevity, and fecundity of Ophraella communa (Coleoptera: Chrysomelidae), a potential biological control agent against Ambrosia artemisiifolia (Asterales: Asteraceae). Environ. Entomol. 2010, 39, 1021–1027. [Google Scholar] [CrossRef] [Green Version]
  6. Schoeller, E.N.; Redak, R.A. Temperature-dependent development and survival of giant whitefly Aleurodicus dugesii (Hemiptera: Aleyrodidae) under constant temperatures. Environ. Entomol. 2018, 47, 1586–1595. [Google Scholar] [CrossRef]
  7. Gilbert, L.; Aungier, J.; Tomkins, J.L. Climate of origin affects tick (Ixodes ricinus) host-seeking behavior in response to temperature: Implications for resilience to climate change? Ecol. Evol. 2014, 4, 1186–1198. [Google Scholar] [CrossRef]
  8. Simmonds, E.G.; Sheldon, B.C.; Coulson, T.; Cole, E. Incubation behavior adjustments, driven by ambient temperature variation, improve synchrony between hatch dates and caterpillar peak in a wild bird population. Ecol. Evol. 2017, 7, 9415–9425. [Google Scholar] [CrossRef] [Green Version]
  9. Vasseur, D.A.; DeLong, J.P.; Gilbert, B.; Greig, H.S.; Harley, C.D.G.; McCann, K.S.; Savage, V.; Tunney, T.D.; O’Connor, M.I. Increased temperature variation poses a greater risk to species than climate warming. Proc. R. Soc. 2014, 281, 20132612. [Google Scholar] [CrossRef] [Green Version]
  10. Hoffmann, A.A.; SøRensen, J.G.; Loeschcke, V. Adaptation of Drosophila to temperature extremes: Bringing together quantitative and molecular approaches. J. Therm. Biol. 2003, 28, 175–216. [Google Scholar] [CrossRef]
  11. Schou, M.F.; Mouridsen, M.B.; SøRensen, J.G.; Loeschcke, V. Linear reaction norms of thermal limits in Drosophila: Predictable plasticity in cold but not in heat tolerance. Funct. Ecol. 2017, 31, 934–945. [Google Scholar] [CrossRef]
  12. Niehaus, A.C.; Angilletta, M.J.; Sears, M.W.; Franklin, C.E.; Wilson, R.S. Predicting the physiological performance of ectotherms in fluctuating thermal environments. J. Exp. Biol. 2012, 215, 694–701. [Google Scholar] [CrossRef] [Green Version]
  13. Colinet, H.; Sinclair, B.J.; Vernon, P.; Renault, D. Insects in fluctuating thermal environments. Annu. Rev. Entomol. 2014, 60, 123–140. [Google Scholar] [CrossRef] [PubMed] [Green Version]
  14. Sheldon, K.S.; Padash, M.; Carter, A.W.; Marshall, K.E. Different amplitudes of temperature fluctuation induce distinct transcriptomic and metabolomic responses in the dung beetle Phanaeus vindex. J. Exp. Biol. 2020, 223, jeb.233239. [Google Scholar] [CrossRef]
  15. Hoffmann, A.A. Acclimation: Increasing survival at a cost. Trends Ecol. Evol. 1995, 10, 1–2. [Google Scholar]
  16. Falfushynska, H.I.; Phan, T.; Sokolova, I.M. Long-term acclimation to different thermal regimes affects molecular responses to heat stress in a freshwater clam Corbicula Fluminea. Sci. Rep. 2016, 6, 39476. [Google Scholar] [CrossRef] [PubMed] [Green Version]
  17. Zari, T.A. Seasonal metabolic acclimatization in the herbivorous desert lizard Uromastyx philbyi (Reptilia: Agamidea) from western Saudi Arabia. J. Therm. Biol. 2016, 60, 180–185. [Google Scholar] [CrossRef]
  18. Thompson, L.J.; Brown, M.; Downs, C.T. Thermal acclimation in a small afrotropical bird. Behav. Processes 2016, 128, 113–118. [Google Scholar] [CrossRef]
  19. Moyano, M.; Candebat, C.; Ruhbaum, Y.; Álvarez-Fernández, S.; Claireaux, G.; Zambonino-Infante, J.-L.; Peck, M.A. Effects of warming rate, acclimation temperature and ontogeny on the critical thermal maximum of temperate marine fish larvae. PLoS ONE 2017, 12, e0179928. [Google Scholar] [CrossRef]
  20. Shah, A.A.; Funk, W.C.; Ghalambor, C.K. Thermal acclimation ability varies in temperate and tropical aquatic insects from different elevations. Integr. Comp. Biol. 2017, 57, 977–987. [Google Scholar] [CrossRef]
  21. Athanassiou, C.G.; Arthur, F.H.; Kavallieratos, N.G.; Hartzer, K.L. To acclimate or not to acclimate? Simultaneous positive and negative effects of acclimation on susceptibility of Tribolium confusum (Coleoptera: Tenebrionidae) and Oryzaephilus surinamsis (Coleoptera: Silvanidae) to low temperatures. J. Econ. Entomol. 2019, 112, 2441–2449. [Google Scholar] [CrossRef]
  22. Jensen, K.; Kristensen, T.N.; Overgaard, J.; Toft, S.; Sørensen, J.G.; Holmstrup, M. Cold acclimation reduces predation rate and reproduction but increases cold- and starvation tolerance in the predatory mite Gaeolaelaps aculeifer Canestrini. Biol. Control 2017, 114, 150–157. [Google Scholar] [CrossRef]
  23. Chown, S.L.; Haupt, T.M.; Sinclair, B.J. Similar metabolic rate-temperature relationships after acclimation at constant and fluctuating temperatures in caterpillars of a sub-Antarctic moth. J. Insect Physiol. 2016, 85, 10–16. [Google Scholar] [CrossRef] [Green Version]
  24. Sprenger, P.P.; Burkert, L.H.; Abou, B.; Federle, W.; Menzel, F. Coping with the climate: Cuticular hydrocarbon acclimation of ants under constant and fluctuating conditions. J. Exp. Biol. 2018, 221, jeb171488. [Google Scholar] [CrossRef] [Green Version]
  25. Mitchell, K.A.; Hoffmann, A.A. Thermal ramping rate influences evolutionary potential and species differences for upper thermal limits in Drosophila. Funct. Ecol. 2010, 24, 694–700. [Google Scholar] [CrossRef]
  26. Ma, G.; Hoffmann, A.A.; Ma, C.S. Daily temperature extremes play an important role in predicting thermal effects. J. Exp. Biol. 2015, 218, 2289–2296. [Google Scholar] [CrossRef] [Green Version]
  27. Cao, J.Y.; Xing, K.; Liu, H.P.; Zhao, F. Effects of developmental acclimation on fitness costs differ between two aphid species. J. Therm. Biol. 2018, 78, 58–64. [Google Scholar] [CrossRef]
  28. Ma, G.; Ma, C.S. Effect of acclimation on heat-escape temperatures of two aphid species: Implications for estimating behavioral response of insects to climate warming. J. Insect Physiol. 2012, 58, 303–309. [Google Scholar] [CrossRef]
  29. Ma, G.; Rudolf, V.H.W.; Ma, C.S. Extreme temperature events alter demographic rates, relative fitness, and community structure. Glob. Chang. Biol. 2015, 21, 1794–1808. [Google Scholar] [CrossRef]
  30. Chidawanyika, F.; Terblanche, J.S. Costs and benefits of thermal acclimation for codling moth, Cydia pomonella (Lepidoptera: Tortricidae): Implications for pest control and the sterile insect release programme. Ecol. Appl. 2011, 4, 534–544. [Google Scholar] [CrossRef]
  31. Brakefield, P.M.; Pijpe, J.; Zwaan, B.J. Developmental plasticity and acclimation both contribute to adaptive responses to alternating seasons of plenty and of stress in Bicyclus butterflies. J. Biosci. 2007, 32, 465–475. [Google Scholar] [CrossRef] [Green Version]
  32. Ding, L.; Li, Y.; Goto, M. Physiological and biochemical changes in summer and winter diapause and non-diapause pupae of the cabbage armyworm, Mamestra brassicae L. during long-term cold acclimation. J. Insect Physiol. 2003, 49, 1153–1159. [Google Scholar] [CrossRef]
  33. Slabber, S.; Chown, S.L. Differential responses of thermal tolerance to acclimation in the sub-Antarctic rove beetle Halmaeusa atriceps. Physiol. Entomol. 2010, 30, 195–204. [Google Scholar] [CrossRef]
  34. Parker, D.J.; Vesala, L.; Ritchie, M.G.; Laiho, A.; Hoikkala, A.; Kankare, M. How consistent are the transcriptome changes associated with cold acclimation in two species of the Drosophila virilis group? Heredity 2015, 115, 13–21. [Google Scholar] [CrossRef] [Green Version]
  35. Manenti, T.; Loeschcke, V.; Sørensen, J.G. Constitutive up-regulation of Turandot genes rather than changes in acclimation ability is associated with the evolutionary adaptation to temperature fluctuations in Drosophila simulans. J. Insect Physiol. 2017, 104, 40–47. [Google Scholar] [CrossRef]
  36. Chapman, J.W.; Nesbit, R.L.; Burgin, L.E.; Reynolds, D.R.; Smith, A.D.; Middleton, D.R.; Hill, J.K. Flight orientation behaviors promote optimal migration trajectories in high-flying insects. Science 2010, 327, 682–685. [Google Scholar] [CrossRef]
  37. Golizadeh, A.; Kamali, K.; Fathipour, Y.; Abbasipour, H. Temperature-dependent development of diamondback moth, Plutella xylostella (Lepidoptera: Plutellidae) on two brassicaceous host plants. Insect Sci. 2007, 14, 309–316. [Google Scholar] [CrossRef]
  38. Guo, S.; Qin, Y. Effects of temperature and humidity on emergence dynamics of Plutella xylostella (Lepidoptera: Plutellidae). J. Econ. Entomol. 2010, 103, 2028–2033. [Google Scholar] [CrossRef] [Green Version]
  39. Golizadeh, A.; Kamali, K.; Fathipour, Y.; Abbasipour, H. Effect of temperature on life table parameters of Plutella xylostella (Lepidoptera: Plutellidae) on two brassicaceous host plants. J. Asia Pac. Entomol. 2009, 12, 207–212. [Google Scholar] [CrossRef]
  40. Coulson, S.J.; Hodkinson, I.D.; Webb, N.R.; Mikkola, K.; Harrison, A.; Pedgley, D.E. Aerial colonization of high Arctic islands by invertebrates: The diamondback moth Plutella xylostella (Lepidoptera: Yponomeutidae) as a potential indicator species. Divers. Distrib. 2010, 8, 327–334. [Google Scholar] [CrossRef]
  41. Marchioro, C.A.; Foerster, L.A. Development and survival of the diamondback moth, Plutella xylostella (L.) (Lepidoptera: Yponomeutidae) as a function of temperature: Effect on the number of generations in tropical and subtropical regions. Neotrop. Entomol. 2011, 40, 533–541. [Google Scholar]
  42. Xing, K.; Ma, C.S.; Zhao, F.; Han, J.C. Effects of large temperature fluctuations on hatching and subsequent development of the diamondback moth (Lepidoptera: Plutellidae). Fla. Entomol. 2015, 98, 651–659. [Google Scholar] [CrossRef]
  43. Xing, K.; Hoffmann, A.A.; Ma, C.S. Does thermal variability experienced at the egg stage influence life history traits across life cycle stages in a small invertebrate. PLoS ONE 2014, 9, e99500. [Google Scholar] [CrossRef] [PubMed]
  44. Xing, K.; Zhao, F.; Ma, C.S. Effects of temperature fluctuation on life history traits of different developmental stages of the diamondback moth, Plutella xylostella (Lepidoptera: Plutellidae). Acta Entomol. Sin. 2015, 58, 160–168. [Google Scholar]
  45. Xing, K.; Hoffmann, A.A.; Zhao, F.; Ma, C.S. Wide diurnal temperature variation inhibits larval development and adult reproduction in the diamondback moth. J. Therm. Biol. 2019, 84, 8–15. [Google Scholar] [CrossRef] [PubMed]
  46. Zhang, B.; Peng, Y.; Zhao, X.J.; Hoffmann, A.A.; Li, R.; Ma, C.S. Emergence of the overwintering generation of peach fruit moth (Carposina sasakii) depends on diapause and spring soil temperatures. J. Insect Physiol. 2016, 86, 32–39. [Google Scholar] [CrossRef]
  47. 4Krechemer, F.S.; Foerster, L.A. Influence of biotic and abiotic factors on the population fluctuation of Tuta absoluta (Lepidoptera: Gelechiidae) in an organic tomato farming. Int. J. Trop. Insect Sci. 2020, 40, 199–208. [Google Scholar] [CrossRef]
  48. Li, H.B.; Shi, L.; Lu, M.X.; Wang, J.J.; Du, Y.Z. Thermal tolerance of Frankliniella occidentalis: Effects of temperature, exposure time, and gender. J. Therm. Biol. 2011, 36, 437–442. [Google Scholar] [CrossRef]
  49. Yamada, H.; Kawasaki, K. The effect of temperature and humidity on the development, fecundity and multiplication of the diamondback moth, Plutella xylostella (L.). Jpn. J. Appl. Entomol. Zool. 1983, 27, 17–21. [Google Scholar] [CrossRef]
  50. Brown, J.H.; Gillooly, J.F.; Allen, A.P.; Savage, V.M.; West, G.B. Toward a metabolic theory of ecology. Ecology 2004, 85, 1771–1789. [Google Scholar] [CrossRef]
  51. David, J.R.; Araripe, L.O.; Chakir, M.; Legout, H.; Lemos, B.; Pétavy, G.; Rohmer, C.; Joly, D.; Moreteau, B. Male sterility at extreme temperatures: A significant but neglected phenomenon for understanding Drosophila climatic adaptations. J. Evol. Biol. 2005, 18, 838–846. [Google Scholar] [CrossRef] [PubMed]
  52. Dmitriew, C.; Rowe, L. Effects of early resource limitation and compensatory growth on lifetime fitness in the ladybird beetle (Harmonia axyridis). J. Evol. Biol. 2007, 20, 1298–1310. [Google Scholar] [CrossRef] [PubMed]
  53. Potter, K.A.; Davidowitz, G.; Woods, H.A. Cross-stage consequences of egg temperature in the insect Manduca sexta. Funct. Ecol. 2011, 25, 548–556. [Google Scholar] [CrossRef]
  54. Block, M.D.; Stoks, R. Compensatory growth and oxidative stress in a damselfly. Proc. R. Soc. B Biol. Sci. 2008, 275, 781–785. [Google Scholar] [CrossRef] [PubMed] [Green Version]
  55. Zhang, W.; Rudolf, V.H.W.; Ma, C.S. Stage-specific heat effects: Timing and duration of heat waves alter demographic rates of a global insect pest. Oecologia 2015, 179, 947–957. [Google Scholar] [CrossRef] [PubMed]
  56. Metcalfe, N.B.; Monaghan, P. Compensation for a bad start: Grow now, pay later? Trends Ecol. Evol. 2001, 16, 254–260. [Google Scholar] [CrossRef]
  57. Gu, J.; Huang, L.X.; Shen, Y.; Huang, L.H.; Feng, Q.L. Hsp70 and small Hsps are the major heat shock protein members involved in midgut metamorphosis in the common cutworm, Spodoptera litura. Insect Mol. Biol. 2012, 21, 535–543. [Google Scholar] [CrossRef]
  58. Tomanek, L.; Zuzow, M.J. The proteomic response of the mussel congeners Mytilus galloprovincialis and M. trossulus to acute heat stress: Implications for thermal tolerance limits and metabolic costs of thermal stress. J. Exp. Biol. 2010, 213, 3559–3574. [Google Scholar] [CrossRef] [Green Version]
  59. Huang, L.H.; Bing, C.; Kang, L. Impact of mild temperature hardening on thermotolerance, fecundity, and Hsp gene expression in Liriomyza huidobrensis. J. Insect Physiol. 2007, 53, 1199–1205. [Google Scholar] [CrossRef]
  60. Javois, J.; Tammaru, T. Reproductive decisions are sensitive to cues of life expectancy: The case of a moth. Anim. Behav. 2004, 68, 249–255. [Google Scholar] [CrossRef]
  61. Sørensen, J.G.; Kristensen, T.N.; Loeschcke, V.; Schou, M.F. No trade-off between high and low temperature tolerance in a winter acclimatized danish Drosophila subobscura population. J. Insect Physiol. 2015, 77, 9–14. [Google Scholar] [CrossRef] [PubMed]
  62. Allen, J.L.; Clusella-Trullas, S.; Chown, S.L. The effects of acclimation and rates of temperature change on critical thermal limits in Tenebrio molitor (Tenebrionidae) and Cyrtobagous salviniae (Curculionidae). J. Insect Physiol. 2012, 58, 669–678. [Google Scholar] [CrossRef] [PubMed]
  63. Chang, X.Q.; Ma, C.S.; Zhang, S.; Liang, L. Thermal tolerance of diamondback moth Plutella xylostella. J. Appl. Ecol. 2012, 23, 772–778. [Google Scholar]
  64. Terblanche, J.S.; Nyamukondiwa, C.; Kleynhans, E. Thermal variability alters climatic stress resistance and plastic responses in a globally invasive pest, the Mediterranean fruit fly (Ceratitis capitata). Entomol. Exp. Appl. 2010, 137, 304–315. [Google Scholar] [CrossRef]
  65. Garcia, C.M.; Morrell, J.J. Development of the powderpost beetle (coleoptera: Bostrichidae) at constant temperatures. Environ. Entomol. 2009, 38, 478–483. [Google Scholar] [CrossRef]
  66. Cocuzza, G.E.; Clercq, P.D.; Lizzio, S.; Veire, M.; Tirry, L.; Degheele, D.; Vacante, V. Life tables and predation activity of Orius laevigatus and O. albidipennis at three constant temperatures. Entomol. Exp. Appl. 1997, 85, 189–198. [Google Scholar] [CrossRef]
  67. O’Neal, M.J.; Headrick, D.H.; Montez, G.H.; Grafton-Cardwell, E.E. Temperature thresholds and degree-day model for Marmara gulosa (Lepidoptera: Gracillariidae). J. Econ. Entomol. 2011, 104, 1286–1293. [Google Scholar] [CrossRef]
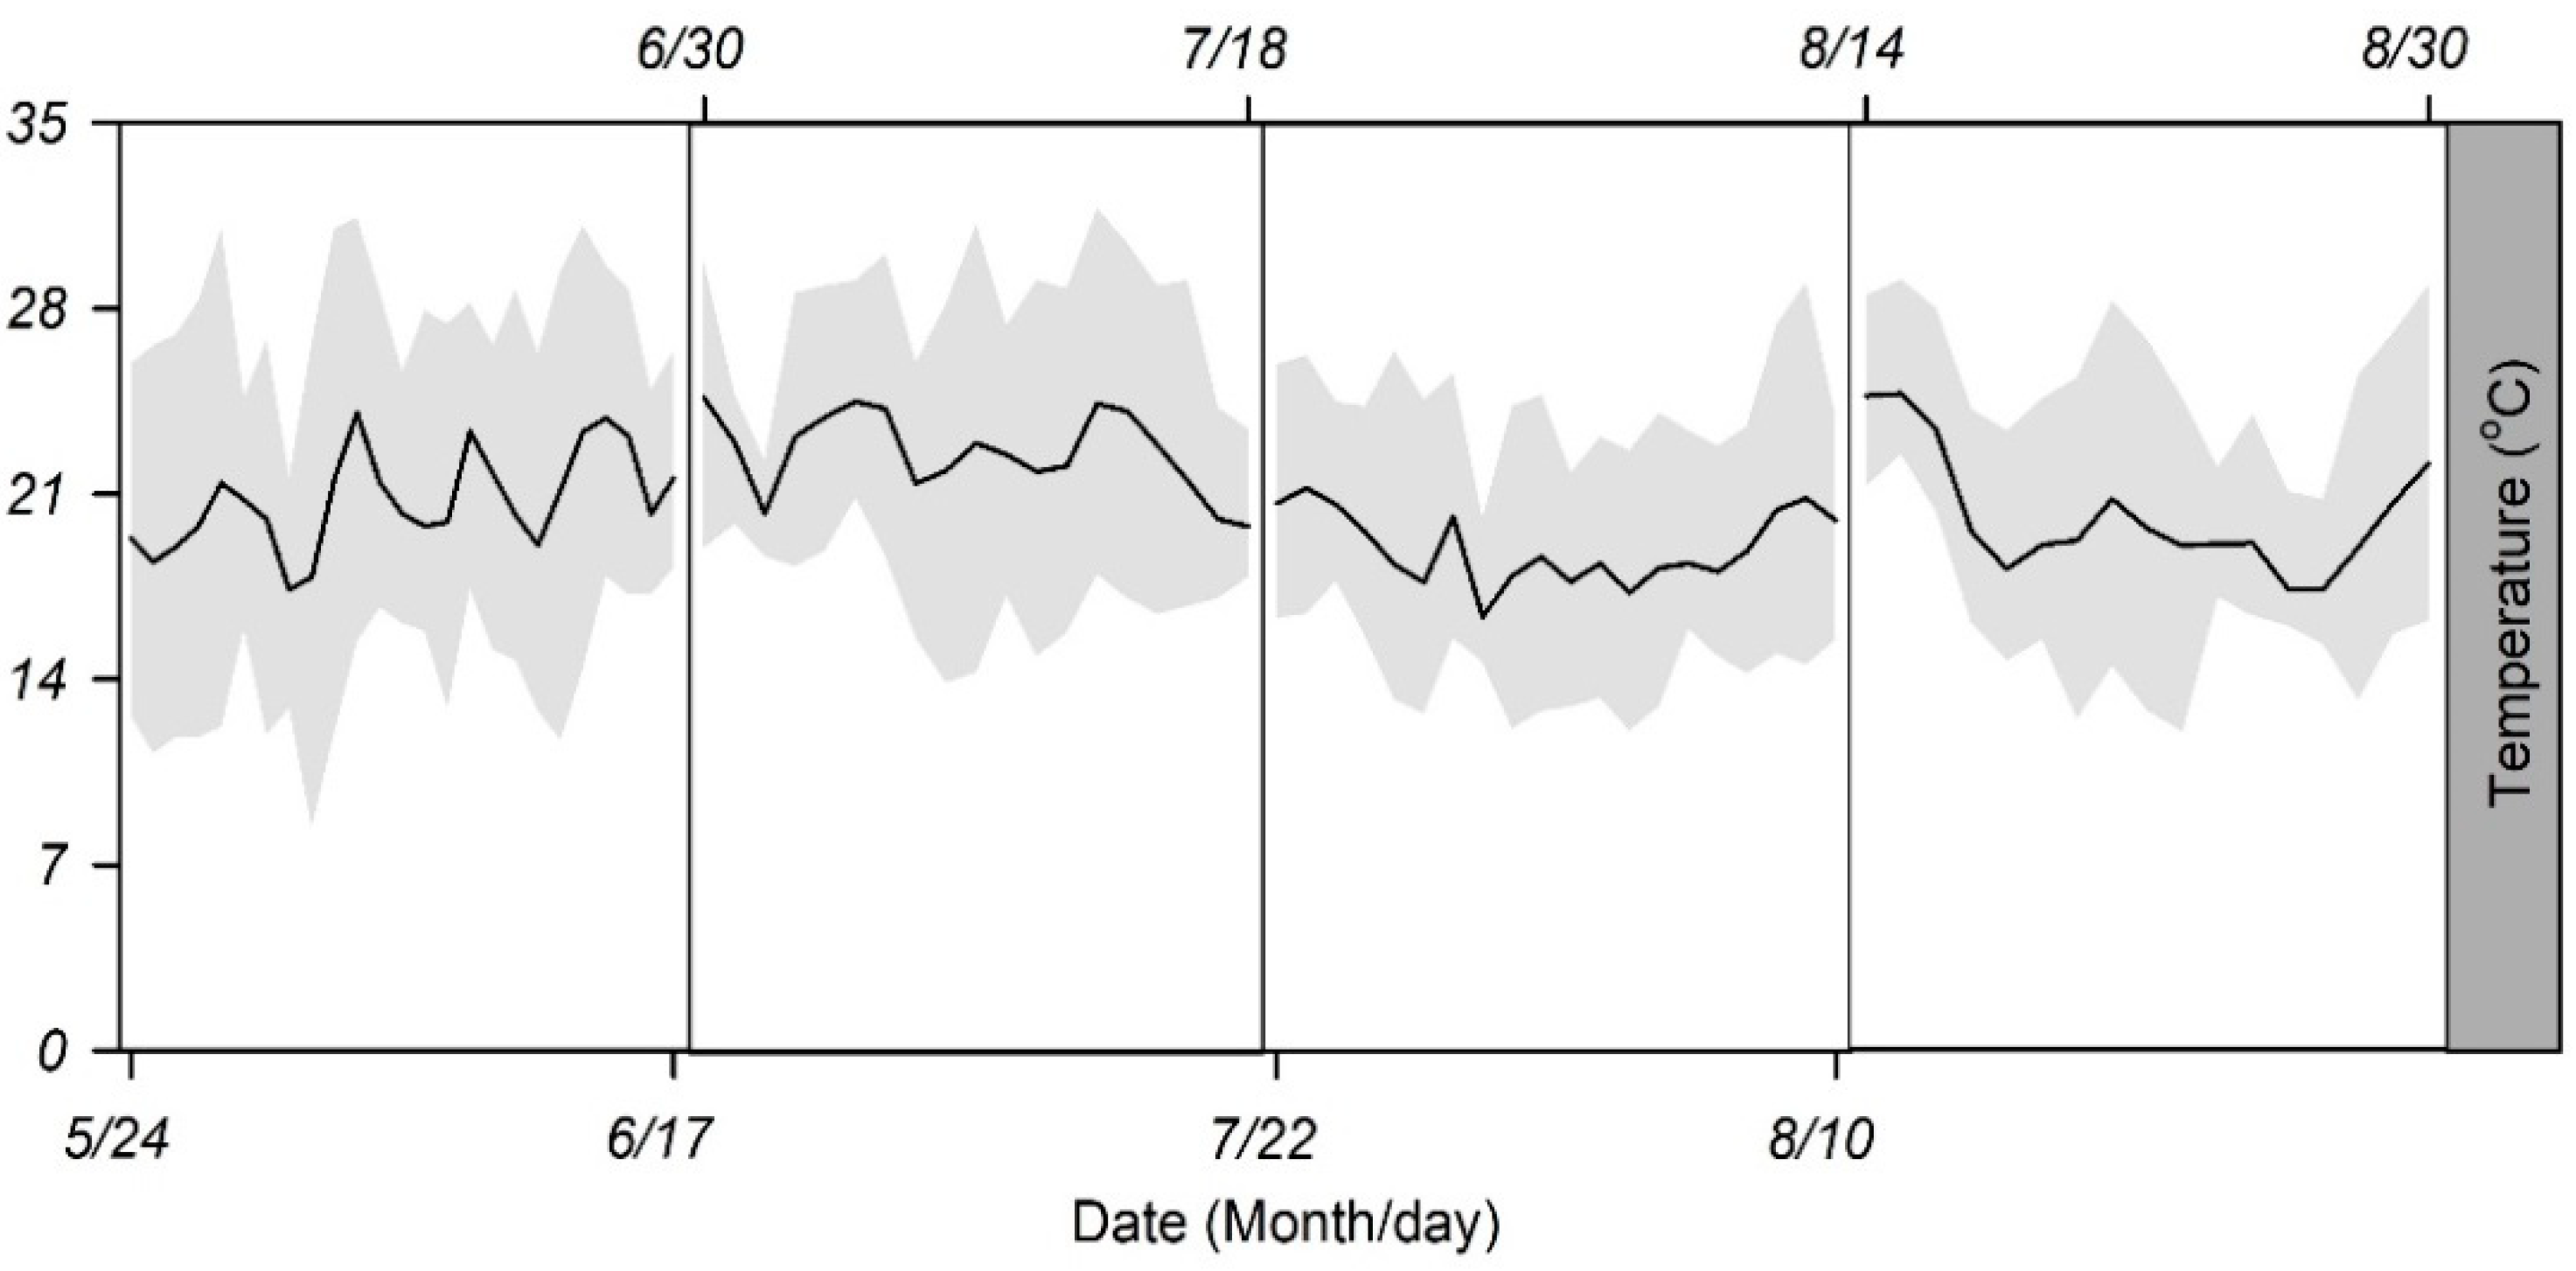
Figure 1. Daily mean temperature (DMT) (solid black line) and daily mean temperature amplitude (DTA) (grey area) experienced by cruciferous vegetable species grown in fields from 24 May to 30 August 2011 in Fanshi County, Shanxi Province, China.
Insects 13 00309 g001
Figure 2. Box plot of the longevity of females and males of Plutella xylostella developed under four daily temperature amplitudes, with a similar mean temperature. The upper and lower boundaries of the box indicate the 75th percentile and 25th percentile of the data set. The black horizontal line and black square within the box represent the median and mean values, respectively. Error bars above and below the box indicate the minimum and maximum values, respectively. Different letters above each box indicate significant differences (p < 0.05) among the treatments.
Insects 13 00309 g002
Figure 3. Box plot of the total fecundity and early fecundity in Plutella xylostella developed under four daily temperature amplitudes, with a similar mean temperature. The upper and lower boundary of the box indicate the 75th percentile and 25th percentile of the data set. The black horizontal line and black square within the box represent the median and mean values. Error bars above and below the box indicate the minimum and maximum values, respectively. Different letters above each box indicate significant differences (p < 0.05) among the treatments.
Insects 13 00309 g003
Figure 4. Box plot of the heat coma temperature (CTmax) of females and males of Plutella xylostella developed under four daily temperature amplitudes with a similar mean temperature. The upper and lower boundaries of the box indicate the 75th percentile and 25th percentile of the data set, respectively. The black horizontal line and black square within the box represent the median and mean values, respectively. Error bars above and below the box indicate the minimum and maximum values, respectively. Different letters above each box indicate significant differences (p < 0.05) among the treatments.
Insects 13 00309 g004
Figure 5. Box plot of the cold coma temperature (CTmin) of females and males of Plutella xylostella developed under four daily temperature amplitudes, with a similar mean temperature. The upper and lower boundaries of the box indicate the 75th percentile and 25th percentile of the data set, respectively. The black horizontal line and black square within the box represent the median and mean values, respectively. Error bars above and below the box indicate the minimum and maximum values, respectively. Different letters above each box indicate significant differences (p < 0.05) among the treatments.
Insects 13 00309 g005
Table 1. Actual recorded ambient temperatures (mean ± SD) in different treatment groups.
GroupDurationActual Recorded Temperature
DMT 1 (°C)DTA (±°C)DHT (°C)DLT (°C)
15/24–6/1720.8 ± 1.8 b7.3 ± 1.7 a27.6 ± 2.3 a14.2 ± 2.6 b
26/30–7/1822.6 ± 1.5 a5.2 ± 1.6 ab28.0 ± 2.6 a17.3 ± 1.9 a
37/22–8/1022.8 ± 1.6 a6.1 ± 1.2 ab29.3 ± 2.4 a17.3 ± 1.9 a
48/14–8/3020.2 ± 2.3 b4.1 ± 1.4 b25.4 ± 2.7 b16.0 ± 3.0 ab
df3.253.193.203.17
MS33.01238.27147.49351.252
F9.80916.8937.6589.120
p<0.001<0.001<0.001<0.001
1 DMT, DTA, DHT, and DLT represent the daily mean temperature, daily mean temperature amplitude, daily mean high temperature, and daily mean low temperature, respectively. Different letters indicate significant differences (p < 0.05) among the treatments with Tukey HSD test.
Table 2. Results of the Pearson correlation coefficient among Plutella xylostella traits and temperature factors.
TraitDMT (°C)DTA (±°C)DHT (°C)DLT (°C)
Female longevity−0.12−0.22−0.35−0.09
Male longevity−0.07−0.96 *1−0.56+0.52
Total fecundity+0.07−0.97 *−0.43+0.66
Early fecundity−0.39+0.79+0.02−0.88
Female CTmax−0.20+0.92+0.30−0.71
Male CTmax−0.13+0.96 *+0.51−0.46
Female CTmin−0.32+0.70+0.01−0.80
Male CTmin+0.24+0.90+0.54−0.42
1 Significant p-values are indicated in a bold typeface. * represents a significant difference at p < 0.05.
Table 3. Stepwise multiple regression with Plutella xylostella traits as the dependent variable and temperature factors as independent variables.
ModedfMSFp
y1 1 = −0.441 x1 21.4236.8239.6580.0033
y2 = −0.479 x11.427751.40811.9020.001
y3 = −0.497 x11.420.02712.1400.001
y4 = 5.962 x1 − 5.102 x2 + 4.433 x33.12024.75541.917<0.001
y5 = 0.658 x11.12062.01889.926<0.001
1y1, y2, y3, y4, and y5 represent, respectively, male longevity, total fecundity, early fecundity, female CTmax, and male CTmax. 2 x1, x2, and x3 represent, respectively, daily temperature amplitude, daily high temperature, and daily low temperature. 3 Significant p-values are indicated in a bold typeface.
Table 4. Effects of the daily temperature amplitude (DTA) on female and male Plutella xylostella traits as determined by ANOVA.
TraitdfMSFp
Female longevity3.420.0711.0810.369
Male longevity3.420.1184.3090.0101
Total fecundity3.422752.4134.0940.013
Early fecundity3.42116.5646.0330.002
Female CTmax3.1200.16544.374<0.001
Male CTmax3.12030.19453.481<0.001
Female CTmin3.1200.0150.5020.682
Male CTmin3.1200.3410.3740.772
1 Significant p-values are indicated in a bold typeface.
Publisher’s Note: MDPI stays neutral with regard to jurisdictional claims in published maps and institutional affiliations.