Article

Reference Genes for Expression Analyses by qRT-PCR in Phthorimaea operculella (Lepidoptera: Gelechiidae)

Education Ministry Key Laboratory of Integrated Management of Crop Diseases and Pests, State & Local Joint Engineering Research Center of Green Pesticide Invention and Application, Department of Entomology, College of Plant Protection, Nanjing Agricultural University, Nanjing 210095, China
*
Author to whom correspondence should be addressed.
Insects 2022, 13(2), 140; https://doi.org/10.3390/insects13020140
Submission received: 9 December 2021 / Revised: 24 January 2022 / Accepted: 26 January 2022 / Published: 28 January 2022

Abstract

:

Simple Summary

Quantitative real-time fluorescent polymerase chain reaction (qRT-PCR) is a momentous tool for calculating the expression levels of targeted genes across various experimental conditions. The selection and evaluation of stable reference genes for qRT-PCR analysis is an essential precondition for reliable expression assessment. Phthorimaea operculella is one of the most serious Lepidopteran pests that attack potatoes around the world. In the present paper, a total of 10 commonly used reference genes, namely ACT, α-TUB, 18S, 28S, GAPDH, EF1α, RPL4, RPL13, RPL27 and SOD, were selected and validated for suitability under three treatments (developmental stages, tissues/organs and temperatures) using five methods (Ct value, geNorm, NormFinder, BestKeeper and RefFinder). These results indicated that EF1α and RPL13 were the best suitable reference genes for diverse backgrounds. The relative transcript levels of the target gene chitin synthase A gene (PoChSA) were abundantly expressed in epidermal cells, and lowly transcribed in the midgut. Our findings will be beneficial for improving the accuracy of qRT-PCR analysis for future functional analysis of the target gene expression in P. operculella.

Abstract

Due to a lack of effective internal references, studies on functional genes in Phthorimaea operculella, a serious Lepidopteran pest attacking potatoes worldwide, have been greatly limited. To select suitable endogenous controls, ten housekeeping genes of actin (ACT), α-tubulin (α-TUB), glyceraldehyde-3-phosphate dehydrogenase (GAPDH), elongation factor 1α (EF1α), 18S and 28S ribosomal RNA (18S, 28S), ribosomal protein genes RPL4, RPL13 and RPL27 and superoxide dismutase (SOD) were tested. Their expression levels were determined under three different experimental conditions (developmental stages, tissues/organs and temperatures) using qRT-PCR technology. The stability was evaluated with five methods (Ct value, geNorm, NormFinder, BestKeeper and RefFinder). The results clarified that RPL13, EF1α and RPL27 are ranked as the best reference gene combination for measuring gene expression levels among different developing stages and under various temperatures; EF1α and RPL13 are recommended to normalize the gene expression levels among diverse tissues. EF1α and RPL13 are the best reference genes in all the experimental conditions. To validate the utility of the selected reference pair, EF1α and RPL13, we estimated the tissue-biased expression level of chitin synthase A gene (PoChSA). As expected, PoChSA was abundantly expressed in ectodermally derived epidermal cells, and lowly transcribed in the midgut. These findings will lay the foundation for future research on the molecular physiology and biochemistry of P. operculella.

1. Introduction

Quantitative real-time fluorescent polymerase chain reaction (qRT-PCR) is a powerful tool for the quantification of nucleic acids owing to its advantages of high specificity, sensitivity, accuracy and rapidity [1,2]. It has been widely used in scientific research [3,4]. When qRT-PCR is used to calculate the relative expression levels of target genes, it is necessary to combine relatively stable reference genes for normalization to improve the quantitative results [5]. If unsuitable references are applied, the nucleic acid quantitates will be biased. In Locusta migratoria, for instance, inappropriate selection of the reference genes results in significant differences in the expression level of the target gene chitin synthase 1 [6]. Therefore, stably expressed reference genes should be selected under different treatments, within different tissues or organs and at different developmental stages [7,8].
In general, the reference genes are housekeeping genes (HKGs) that stably transcribe in various cells or during diverse physiological states [9]. However, there is no single universal reference gene [10]. To obtain accurate results, the exact experimental conditions for the expression of each candidate reference gene must be verified [7,8].
The potato tuber moth, Phthorimaea operculella (Lepidoptera, Gelechiidae), is one of the most serious Lepidopteran pests attacking potatoes around the world [11]. It reduces potato production either via mining and damaging leaves and stems in fields or via burrowing and destroying tubers in storage [4]. In P. operculella, the ACTIN (ACT) gene is used for qRT-PCR studies when measuring the expression of two pheromone receptor genes OR1 and OR3 [4] and the level of chitin synthase A genes [3]. However, the stability and effectiveness of ACT have not been validated. This might significantly affect statistical analyses and might result in false data interpretation [12]. Therefore, it is imperative to identify the optimal endogenous controls for specific conditions in P. operculella.
The stability of reference genes has widely been evaluated in Lepidopterans [7,13,14,15,16,17,18,19,20]. For instance, the most suitable reference genes have been documented in Tuta absoluta (elongation factor 1α, EF1α; 60S ribosomal protein L28, RPL28) [7], Thitarodes armilicanus (glyceraldehyde-3-phosphate dehydrogenase, GAPDH) [21], Diaphania caesalis (ACT and 60S ribosomal protein RPL13a across developing stages, ACT and eukaryotic initiation factor EIF4A in various tissues) [22] and Sesamia inferens (18S ribosomal RNA, 18S; ribosomal protein S20, RPS20; α-tubulin, α-TUB) [23]. Generally, at least two reference genes may be necessary for each insect species as a single reference gene cannot satisfy all experimental requirements [24].
Since the top 10 most frequently used reference genes include ACT, RPL, TUB, GAPDH, RPS, 18S, EF1α, TATA, HSP and SDHA in insects [25], we accordingly selected ten HKGs, i.e., ACT, α-TUB, 18S, 28S, GAPDH, EF1α, RPL4, RPL13, RPL27 and SOD, in P. operculella. The objectives of this survey were to (i) evaluate the expression stability of the 10 candidate reference genes, (ii) screen/select the most stable internal reference genes expressed in different developing stages and tissues/organs and under different temperatures and (iii) to validate the stability and effectiveness of the selected reference gene pair by comparison with the published results. Our results provide the reference basis for further molecular studies involving P. operculella.

2. Materials and Methods

2.1. Insects

P. operculella used for this study were collected from Solanum melongena L. in Guiyang city, Guizhou Province, China in 2020. The larvae were routinely maintained in an insectary at 26 ± 1 °C under a 12 h:12 h light-dark photoperiod and 60–80% relative humidity using fresh potatoes as food. The adults were fed with a 10% honey solution.

2.2. Samples through Developing Stages

All stages of P. operculella were sampled: young and old larvae, pupae and adults. The number of individuals for each replicate across the different developmental stage was as follows: 10 young larvae, 5 old larvae, 5 pupae and 5 adults (3 males and 2 females). The collection was repeated three times.

2.3. Specimens among Various Tissues

Ten fully grown larvae were selected as a replicate. They were dissected and the head capsule, foregut, midgut, hindgut, fat body, hemocytes and epidermis were collected. The tissue collection was repeated three times. The tissue specimens were placed in RNAlater R (Thermo Fisher Scientific Inc., Waltham, MA, USA) and stored for several weeks at −80 °C before total RNA isolation.

2.4. Collections during Varied Temperature Incubation

The final instar larvae were transferred into three temperatures (4 °C, 26 °C and 35 °C). Ten larvae as a replicate were collected after 2, 6 and 12 h. A total of nine treatments were set. The collection was repeated three times and stored for several weeks at −80 °C before total RNA isolation.

2.5. Samples for the Expression Analysis of PoChSA

The ultimate instar larvae were dissected and the head capsule, foregut, midgut, hind gut and epidermis were collected. A total of 10 individuals were dissected for each replicate. The tissue collection was repeated three times. The tissue specimens were placed in RNAlater R (Thermo Fisher Scientific Inc., Waltham, MA, USA) and stored for several weeks at −80 °C before total RNA isolation.

2.6. Selection and Authentication of Candidate HKGs

Ten HKG sequences (actin, ACT; α-tubulin, α-TUB; glyceraldehyde-3-phosphate dehydrogenase, GAPDH; elongation factor 1α, EF1α; 18S and 28S ribosomal RNA, 18S and 28S; ribosomal proteins RPL4, RPL13 and RPL27; superoxide dismutase, SOD) were selected. The accession numbers of these genes are listed in Table 1.
Reverse transcription PCR (RT-PCR) was performed to authenticate the HKGs using the primers listed in Table 1. The amplified products were separated by electrophoresis on 1.5% agarose gel and purified using the Wizard® PCR Preps DNA Purification System (Promega, Madison, WI, USA). Purified DNA was ligated into the pGEM®-T easy vector (Promega, Madison, WI, USA) and several independent subclones were sequenced from both directions. The resultant sequences were submitted to GenBank; the accession numbers are listed in Table 1.

2.7. Quantitative Real-Time PCR (qRT-PCR)

The qRT-PCR primers were designed using Beacon Designer 7 (Premier Biosoft International, Palo Alto, Santa Clara, CA, USA), and are given in Table 2. The qRT-PCR reactions were performed using ChamQ Universal SYBR qPCR Master Mix (Vazyme Biotech Co., Ltd., Nanjing, China) and QuantStudio™ 7 Pro Real-Time PCR System (Applied Biosystems, Life Technologies, Carlsbad, CA, USA) according to the manufacturer’s protocol. The reaction mixture consisted of 1 μL of cDNA template, 10 μL of 2× ChamQ Universal SYBR qPCR Master Mix, 0.4 μL of forward primer (10 μM), 0.4 μL of reverse primer (10 μM) in a final reaction volume of 20 μL. A reverse transcription negative control (without reverse transcriptase) and a non-template negative control were included for each primer set to confirm the absence of genomic DNA and to check for primer dimers or contamination in the reactions, respectively. The qRT-PCR protocol included an initial step of 95 °C for 30 s, followed by 40 cycles of 95 °C for 5 s and then annealed at 60 °C for 34 s, followed by one cycle of 95 °C for 15 s, 60 °C for 60 s and 95 °C for 1 s. PCR amplicons were subjected to melting curve analysis. The specificity of the qRT-PCR reactions was monitored by melting curve analysis using QuantStudio™ Design & Analysis Software (version 1.5.0) and gel electrophoresis. Amplification efficiencies were determined by a 10-fold dilution series of template. All experiments were repeated in triplicate.

2.8. Evaluation of Reference Gene Selection

ChSA of P. operculella was used to evaluate the stability of candidate reference genes. The primer sequence of the target gene was as follows: forward (5′-GCCTGGAGTTCACAGTCAGA-3′) and reverse (5′-GCCGGTCTTTCTTAAGTTGC-3′). The average relative levels of PoChSA in different tissues were computed based on 2−ΔΔCT method and from three replicates. We used SPSS for Windows (Chicago, IL, USA) for statistical analyses. The averages (±SE) were submitted to analysis of variance with the Tukey–Kramer test.

2.9. Data Processing

The raw Ct values were obtained using the QuantStudio™ Design & Analysis Software (version 1.5.0). The algorithms, including geNorm [26], BestKeeper [27] and Normfinder [28], were used to analyze the stability of selected HKGs, strictly following the manuals of the algorithms. Finally, the comprehensive ranking of each condition was obtained according to RefFinder [29,30].

3. Results

3.1. Selection of Candidate HKGs

We selected ten HKG genes and designated them as ACT, α-TUB, 18S, 28S, GAPDH, EF1α, RPL4, RPL13, RPL27 and SOD. The resultant sequences were submitted to GenBank; the accession numbers were listed in Table 1. The correctness of the ten HKGs was proven by RT-PCR.
The products from qRT-PCR were confirmed by sequencing. The primer specificity for qRT-PCR was verified by melting curve analysis. All the primer pairs amplified a single PCR product with the expected sizes and sequences, showed a slope less than −3.0 and exhibited regression coefficient (R2) and efficacy values ranging from 0.991–0.999 and 93.80–103.89% (Table 2). These data indicate that the amplification efficiencies of the primers reached the standard requirements of conventional qRT-PCR [5].

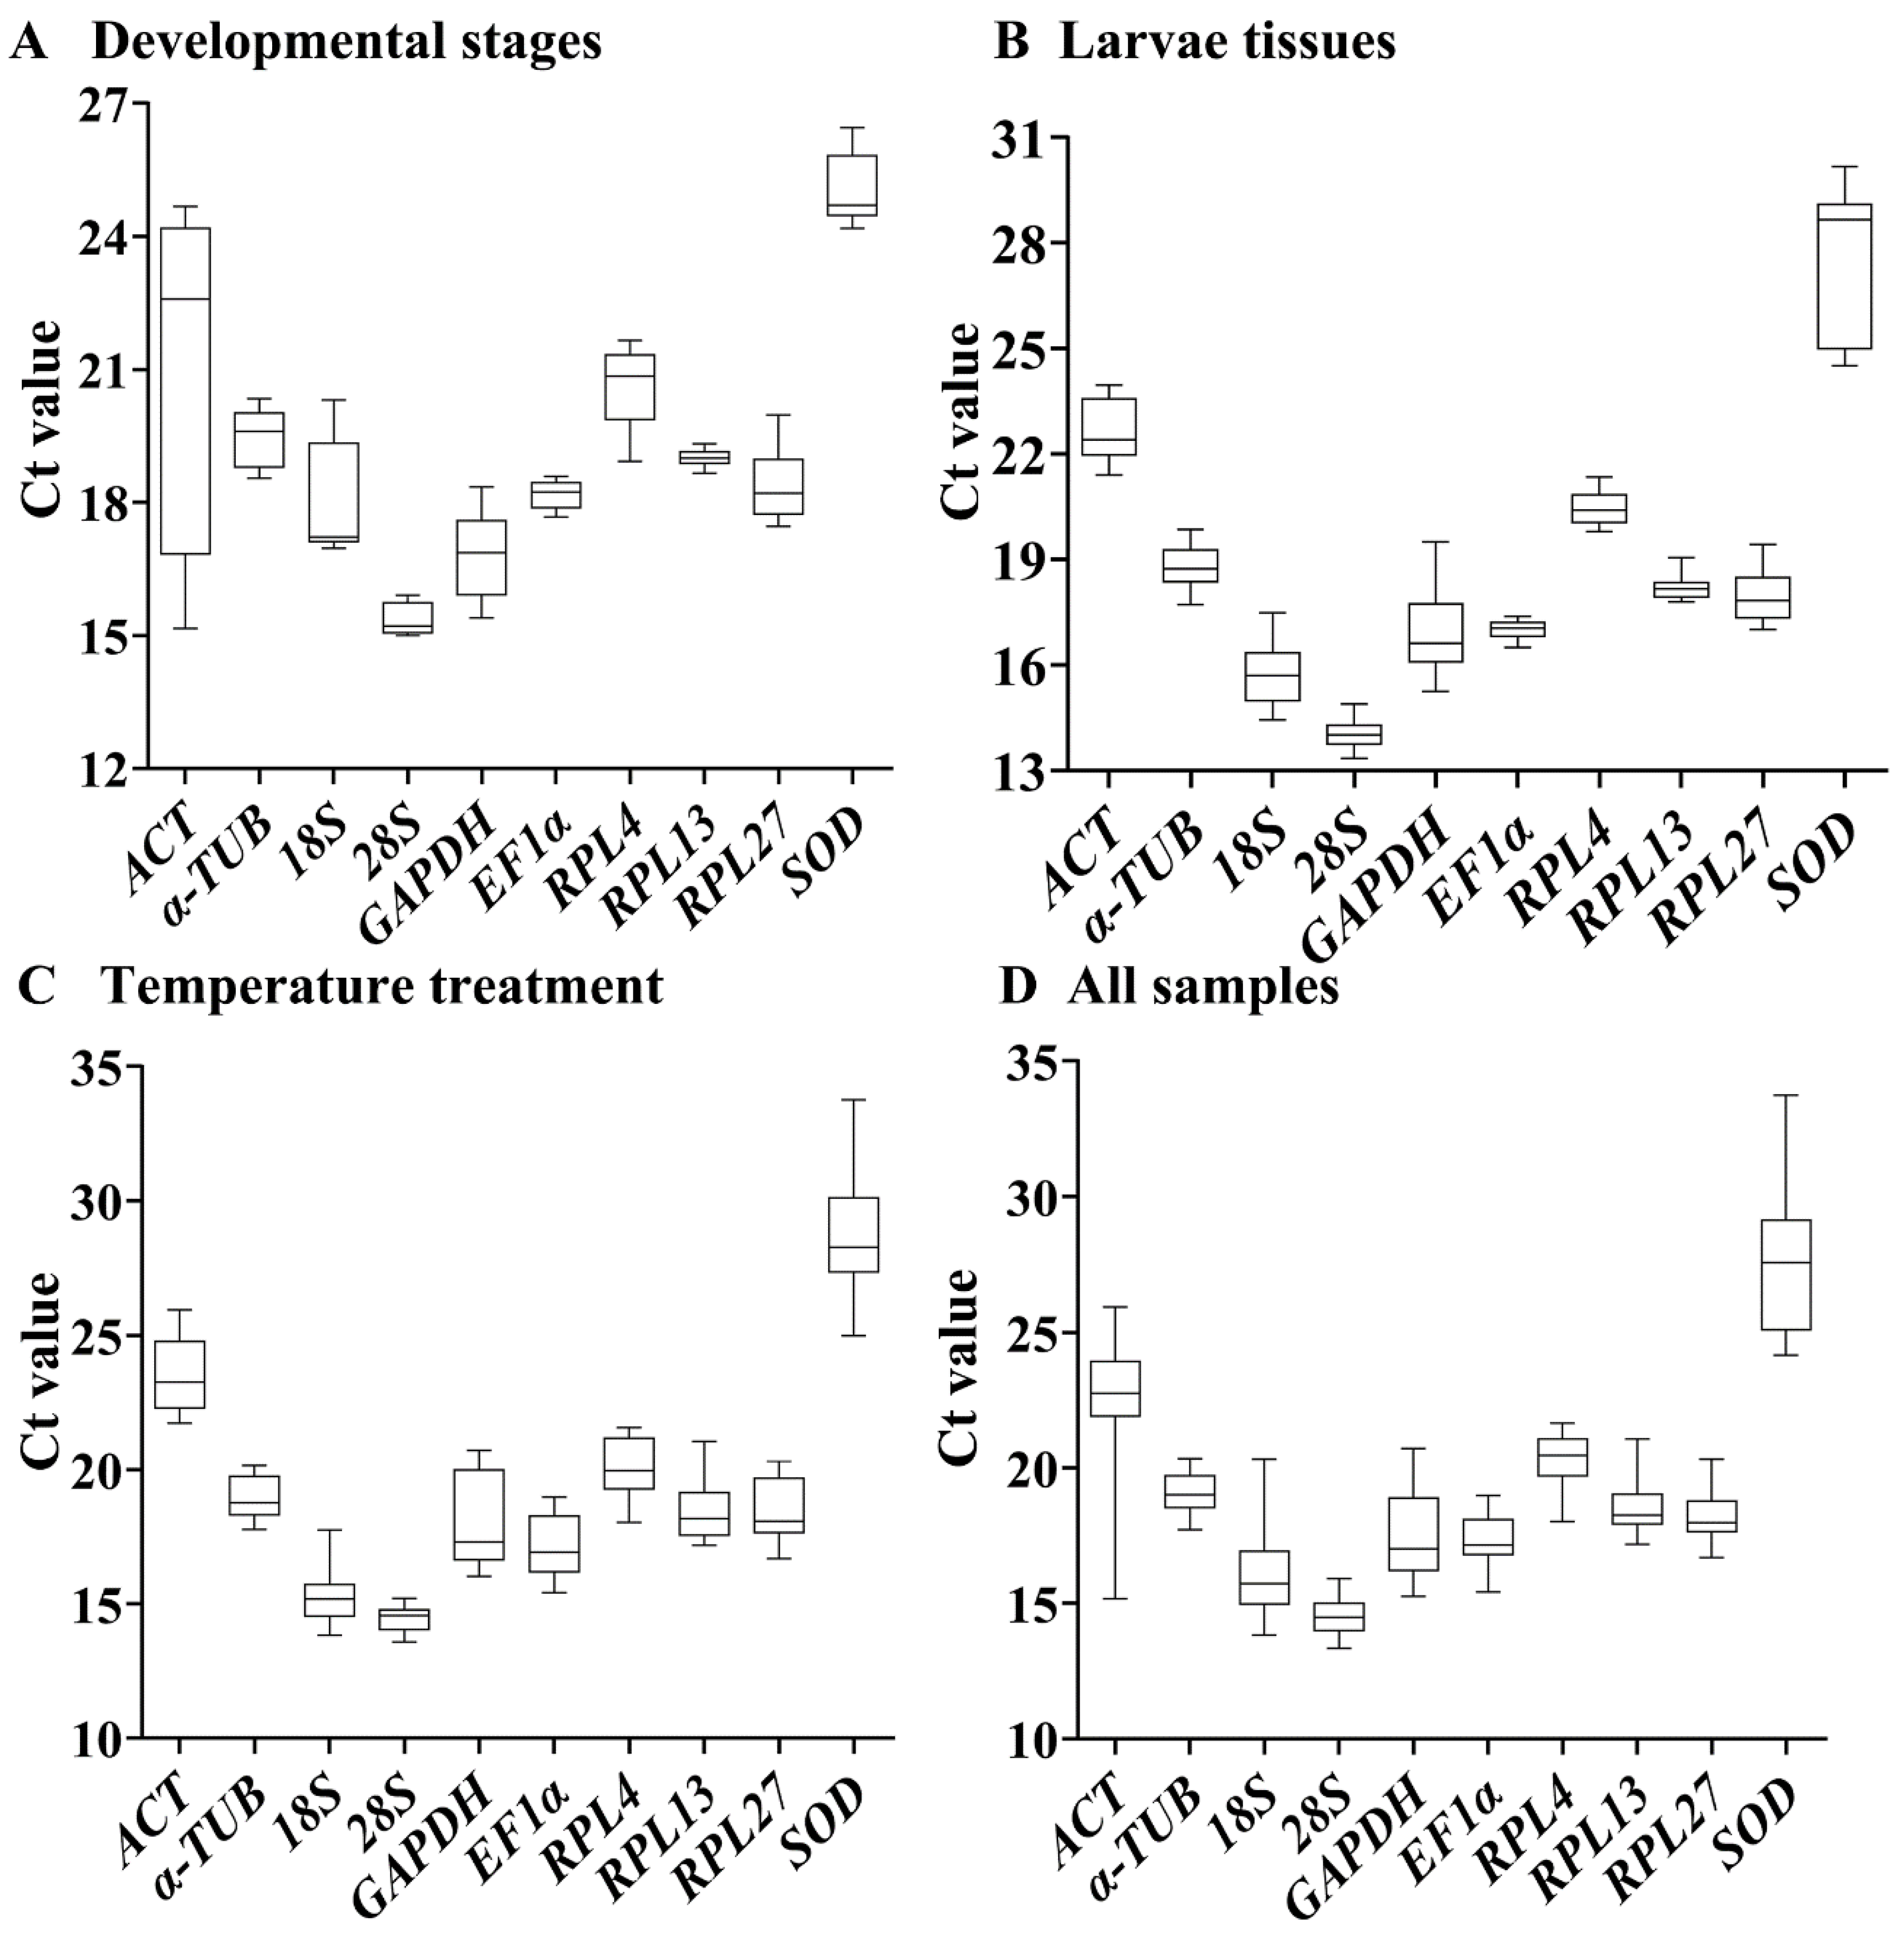
3.2. Expression Variations of the Ten HKGs

The specimens were collected from four developmental stages (young and old larvae, pupae and adults), seven larval tissues (head capsule, foregut, midgut, hindgut, fat body, hemocytes and epidermis) and three temperature treatments (4 °C, 26 °C and 35 °C). Using the products obtained by qRT-PCR for agarose gel electrophoresis, we found that all ten genes had single amplicons of expected size (data not shown). Therefore, these ten genes were expressed during different developmental stages, among different larval tissues and under different temperatures.
The overall threshold cycle (Ct) values under different experimental conditions are shown in Figure 1 and Table S1. Across developing stages, EF1α and RPL13 had the smaller gene expression variation, whereas ACT and 18S had the higher expression difference (Figure 1A). Among various tissues, except for GAPDH and SOD, the expression fluctuations were small in selected HKGs (Figure 1B). Under different temperatures, the expression fluctuations were small in selected HKGs except for SOD and GAPDH (Figure 1C). A combination of these results revealed that the variations in RPL13, EF1α, RPL27 and α-TUB were smaller, whereas the ranges in ACT, GAPDH, 18S and SOD were larger (Figure 1D).

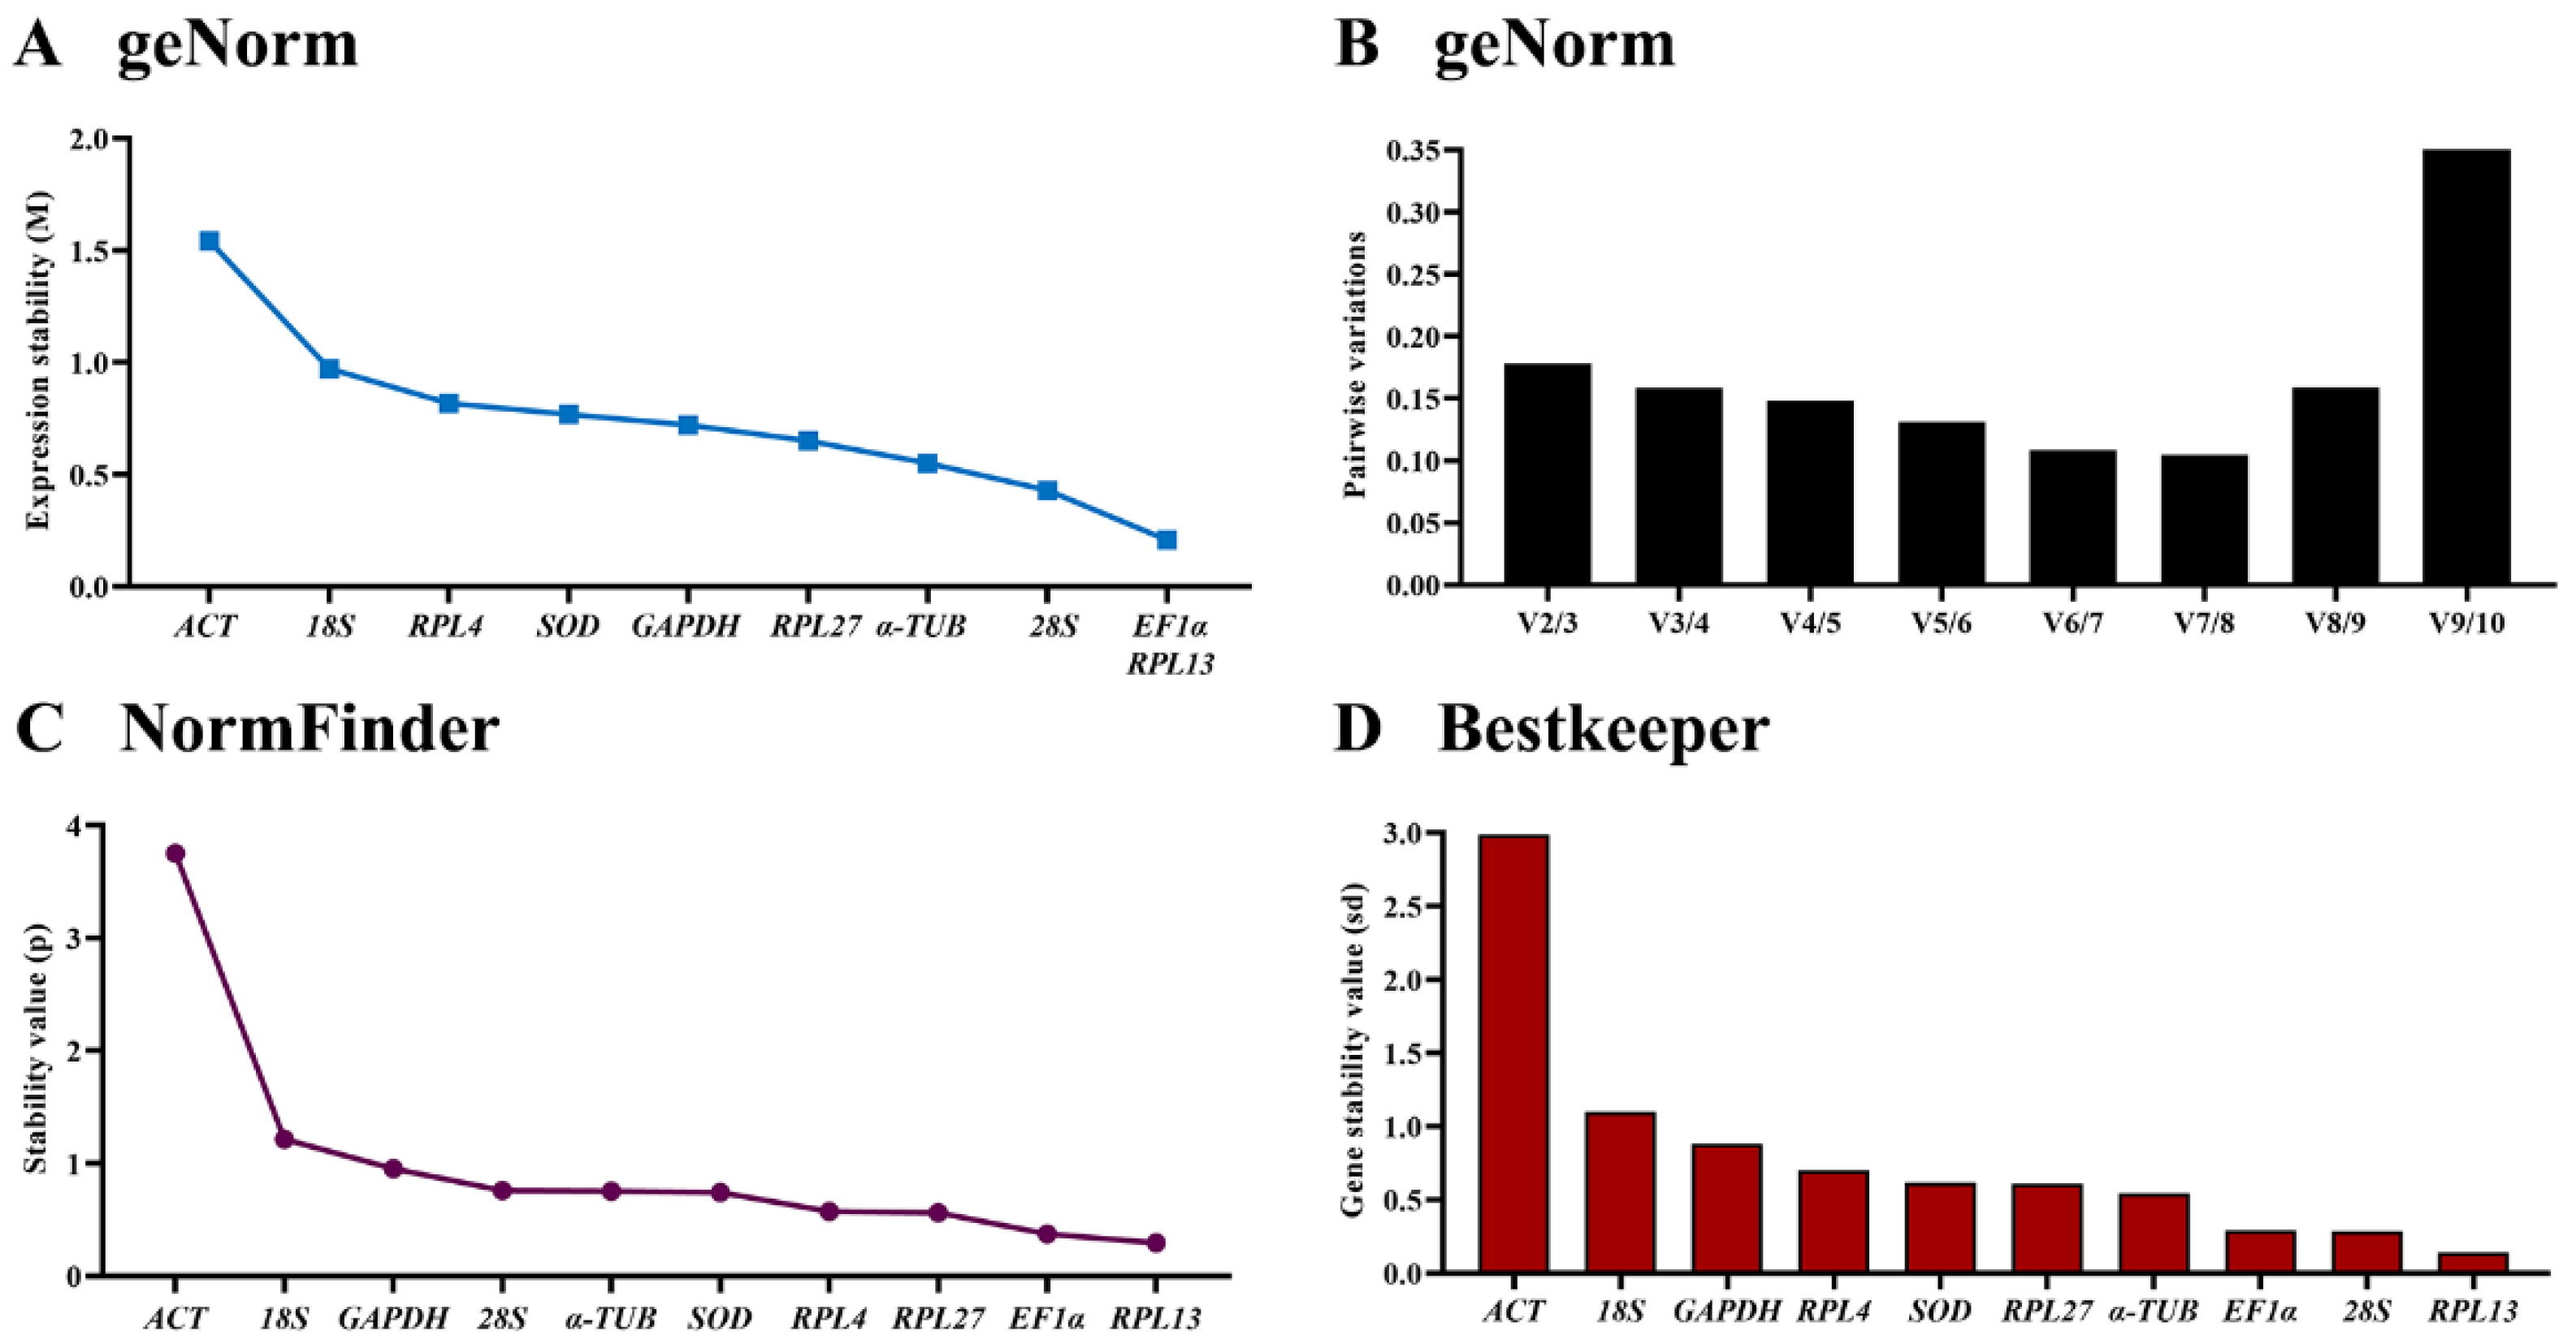
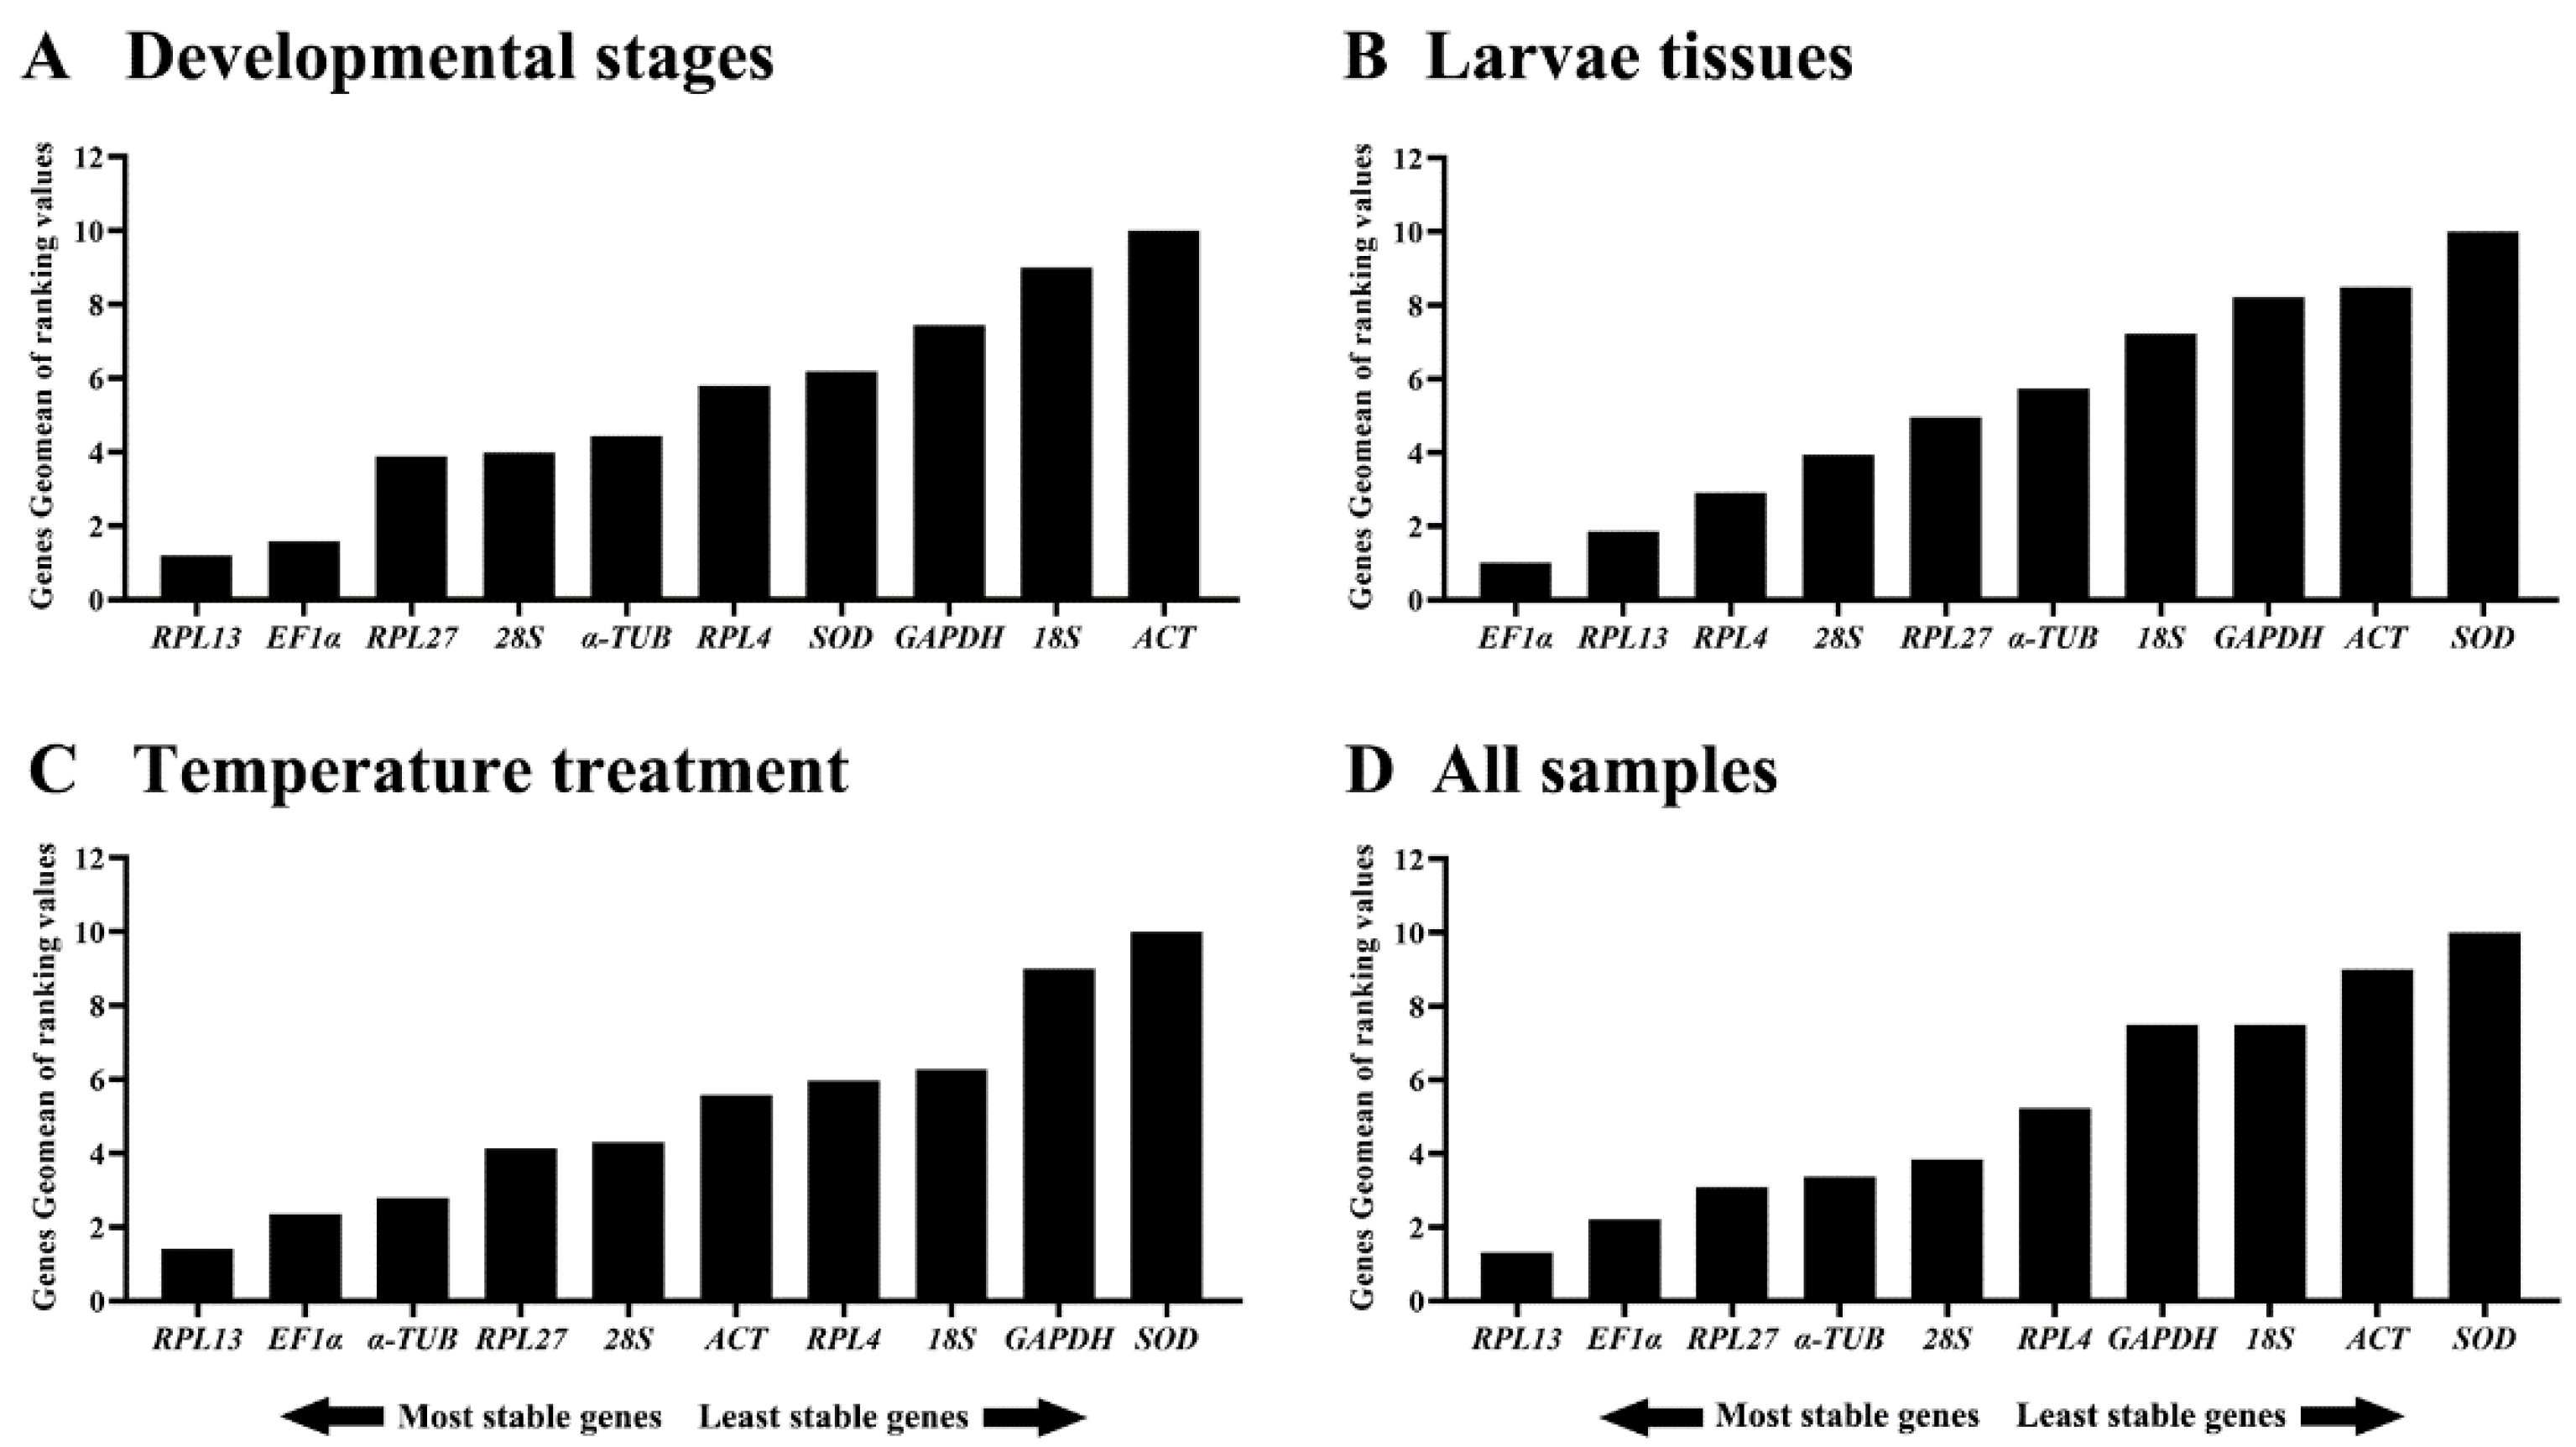
3.3. Expression Stability of the Ten HKGs during Developmental Stages

The geNorm algorithm evaluates the candidate reference genes based on their expression stability values (M-values) and pairwise variations (Vn/Vn+1). The expression stability values revealed that EF1α, RPL13 and 28S were the better reference genes during developing, with M-values below 0.5. The values of other genes were below 1, except for ACT, and their stability values were similar (Figure 2A, Table 3). The pairwise variation analysis showed that the V3/4 value was near 0.15; indicating three different reference genes are needed for gene expression analysis during development (Figure 2B).
According to the NormFinder, those genes with low stability values, based on intra- and inter-group expression variations, are considered to be the most stable reference genes. Across different development stages, the stable genes were RPL13, EF1α and RPL27, with the p value less than 1.0. The most unstable gene was ACT, with the p value of 3.8 (Figure 2C, Table 3).
Based on the BestKeeper analysis, the stable orders of selected HKGs were RPL13, 28S, EF1α, α-TUB, RPL27, SOD, RPL4, GAPDH, 18S and ACT, from the most stable to the least. The last two genes, 18S and ACT, had Cp values of more than 1 (Figure 2D, Table 3), indicating that they should be excluded as reference genes for qRT-PCR to test the expression level of the target gene.
The online tool RefFinder combines the three methods above to compare and rank the tested reference genes [29]. It ranks the selected HKGs in the following order from the most to least stable: RPL13 > EF1α > RPL27 > 28S > α-TUB > RPL4 > SOD > GAPDH > 18S > ACT (Figure 5A). Therefore, RPL13, EF1α and RPL27 are ranked as the best reference gene combination for measuring target genes among different developing stages.

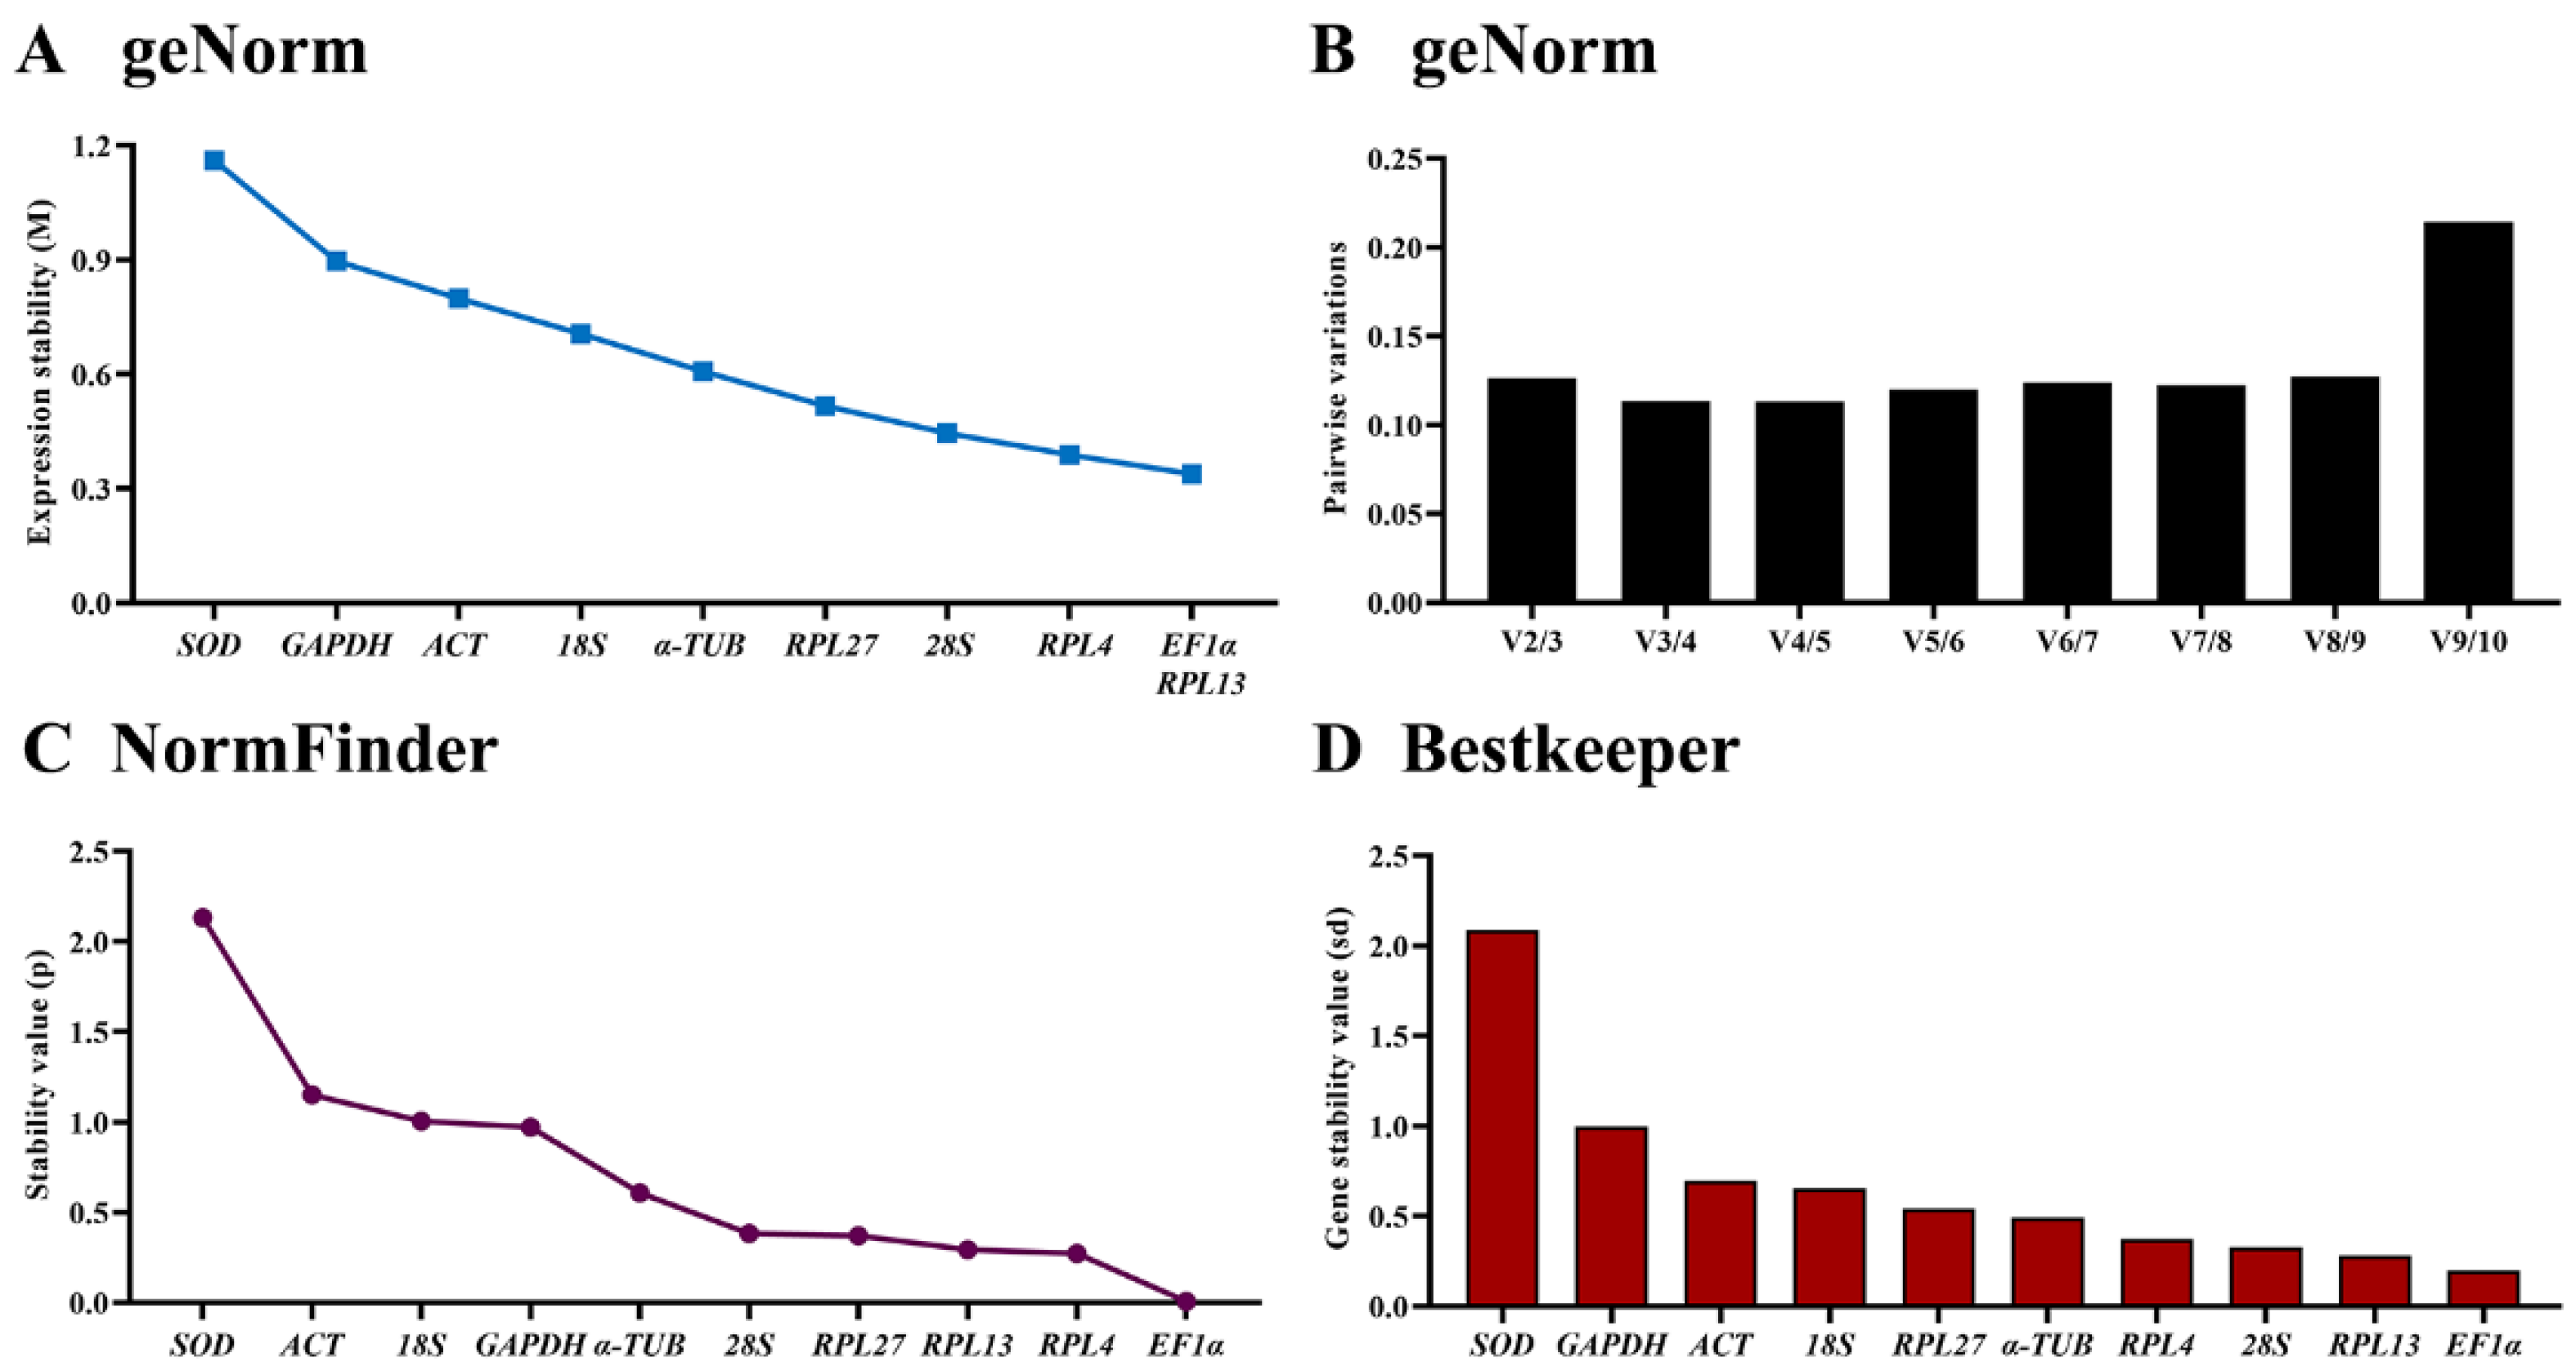
3.4. Expression Stability of the Ten HKGs among Different Tissues

Among the three tissues, the stability of the selected HKGs were EF1α = RPL13 > RPL4 > 28S > RPL27 > α-TUB > 18S > ACT > GAPDH > SOD; based on the geNorm algorithm, the M-values of EF1α, RPL4 and RPL13 were below 0.4 (Figure 3A, Table 3). The pairwise variation analysis displayed that the V2/3 to V8/9 values were below 0.15, suggesting two reference genes are enough for gene expression determination within various tissues (Figure 3B).
The NormFinder analysis revealed that the stability of the selected HKGs were EF1α > RPL4 > RPL13 > RPL27 > 28S > α-TUB > GAPDH > 18S > ACT > SOD, with the p value of 0.007, 0.272, 0.293, 0.370, 0.383, 0.608, 0.972, 1.004, 1.150 and 2.131, respectively. Again, the p values of EF1α, RPL4, RPL13, RPL27 and 28S were below 0.4 (Figure 3C, Table 3), indicating their similar stability.
The BestKeeper data uncovered that EF1α, RPL13, 28S, RPL4 were the most stable because they showed Cp values of 0.200, 0.279, 0.328 and 0.373, respectively. The Cp values of α-TUB, RPL27, 18S, ACT and GAPDH were less than 1.0., and the Cp value of SOD was more than 2.0 (Figure 3D, Table 3).
The RefFinder showed a comprehensive ranking order from the most to the least stable: EF1α > RPL13 > RPL4 > 28S > RPL27 > α-TUB > 18S > GAPDH > ACT > SOD (Figure 5B). Thus, the two HKGs (EF1α and RPL13) are recommended to be used to test the target gene expression levels among various tissues.

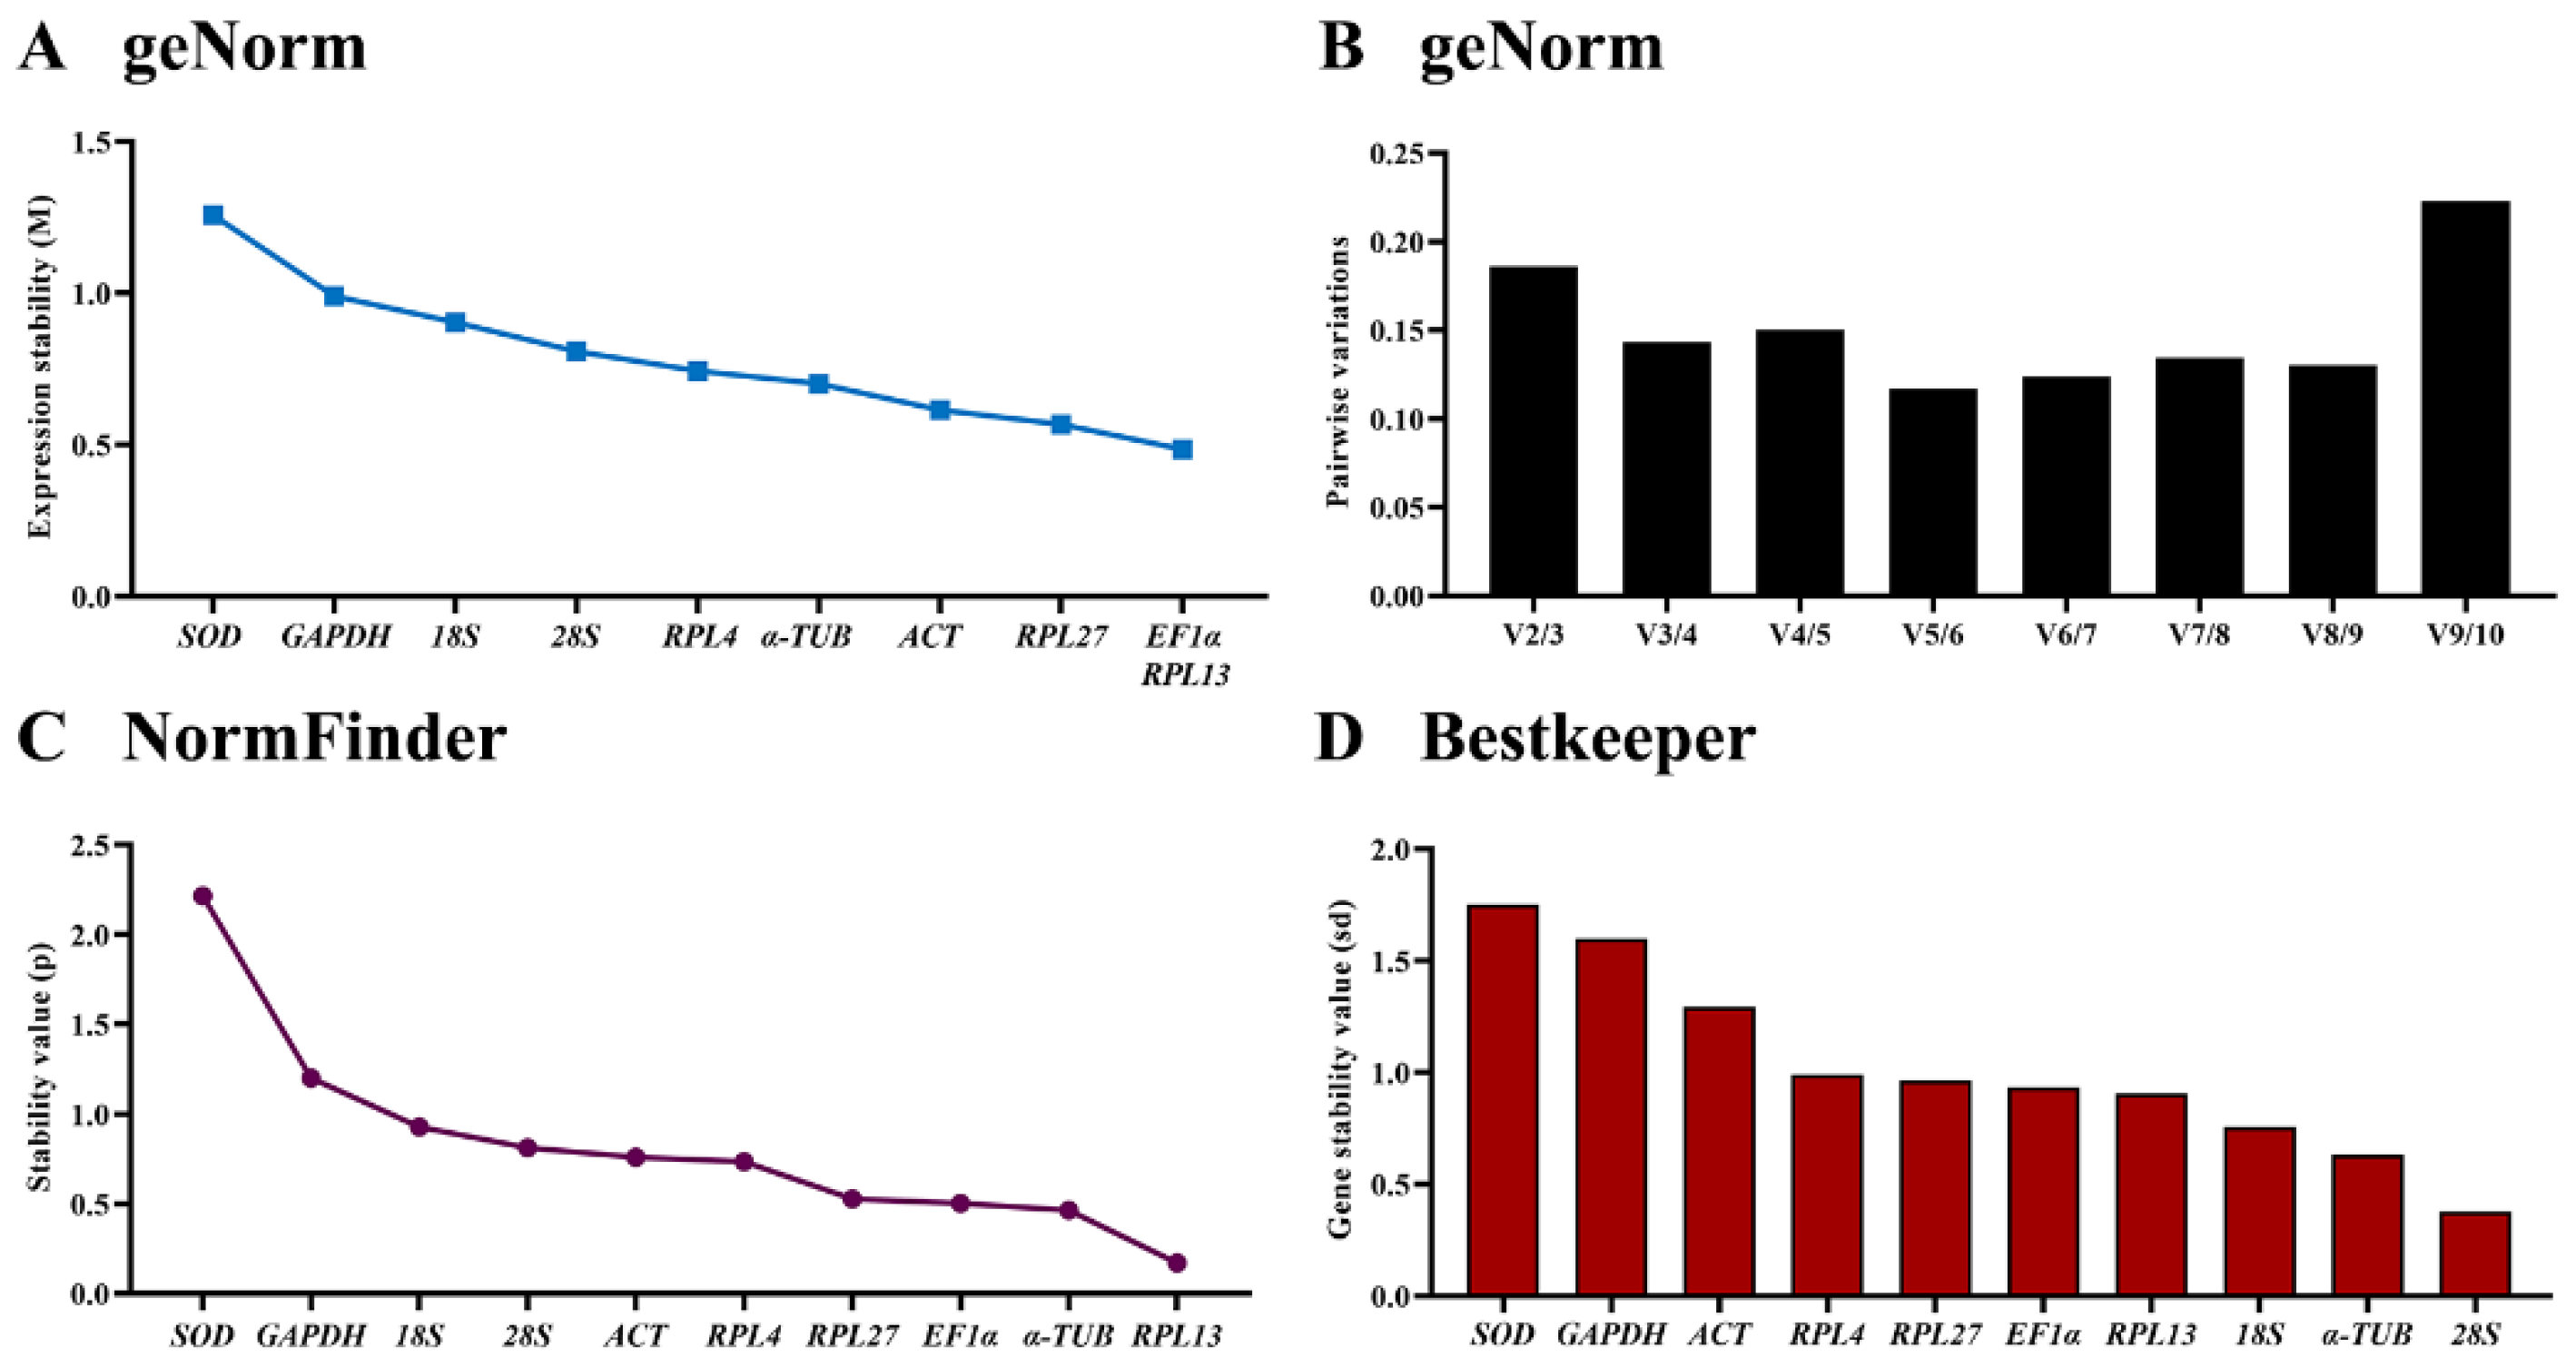
3.5. Stability of the Ten HKGs under Different Temperatures

The geNorm algorithm results showed that the comprehensive reference gene rankings from the best to the least stable were EF1α, RPL13, RPL27, ACT, α-TUB, RPL4, 28S, 18S, GAPDH and SOD (Figure 4A, Table 3). Except for SOD, the other genes in the selected HKGs showed values below 1, indicating their stabilities were similar. Moreover, the pairwise variation analysis showed that the V3/4 value was below 0.15, indicating three different reference genes are needed for gene expression analysis under different temperatures (Figure 4B).
By the NormFinder analysis, the stable orders of the selected HKGs from the most stable to the least were RPL13, α-TUB, EF1α, RPL27, RPL4, ACT, 28S, 18S, GAPDH and SOD. Again, the p values revealed by the NormFinder analysis indicated that RPL13, α-TUB, EF1α, RPL27 were smaller, demonstrating that the genes have similar stability (Figure 4C, Table 3).
The BestKeeper data unveiled that the steady orders were 28S, α-TUB, 18S, RPL13, EF1α, RPL27 and RPL4 (Figure 4D, Table 3). Since the Cp values of ACT, GAPDH and SOD were more than 1, they cannot be used as reference genes for qRT-PCR to test the expression level of the target gene. The other genes showed values below 1, indicating their stability values were similar (Figure 4D, Table 3).
According to the RefFinder results, the stability rankings were as follows: RPL13 > EF1α > α-TUB > RPL27 > 28S > ACT > RPL4 > 18S > GAPDH > SOD (Figure 5C).
When the three different conditions were combined together, the RefFinder results indicated that the stability rankings from the most to the least were RPL13, EF1α, RPL27, α-TUB, 28S, RPL4, GAPDH, 18S, ACT and SOD (Figure 5D). Thus, the two HKGs (EF1α and RPL13) can be selected as reference genes for measuring the target gene expression levels among diverse backgrounds.

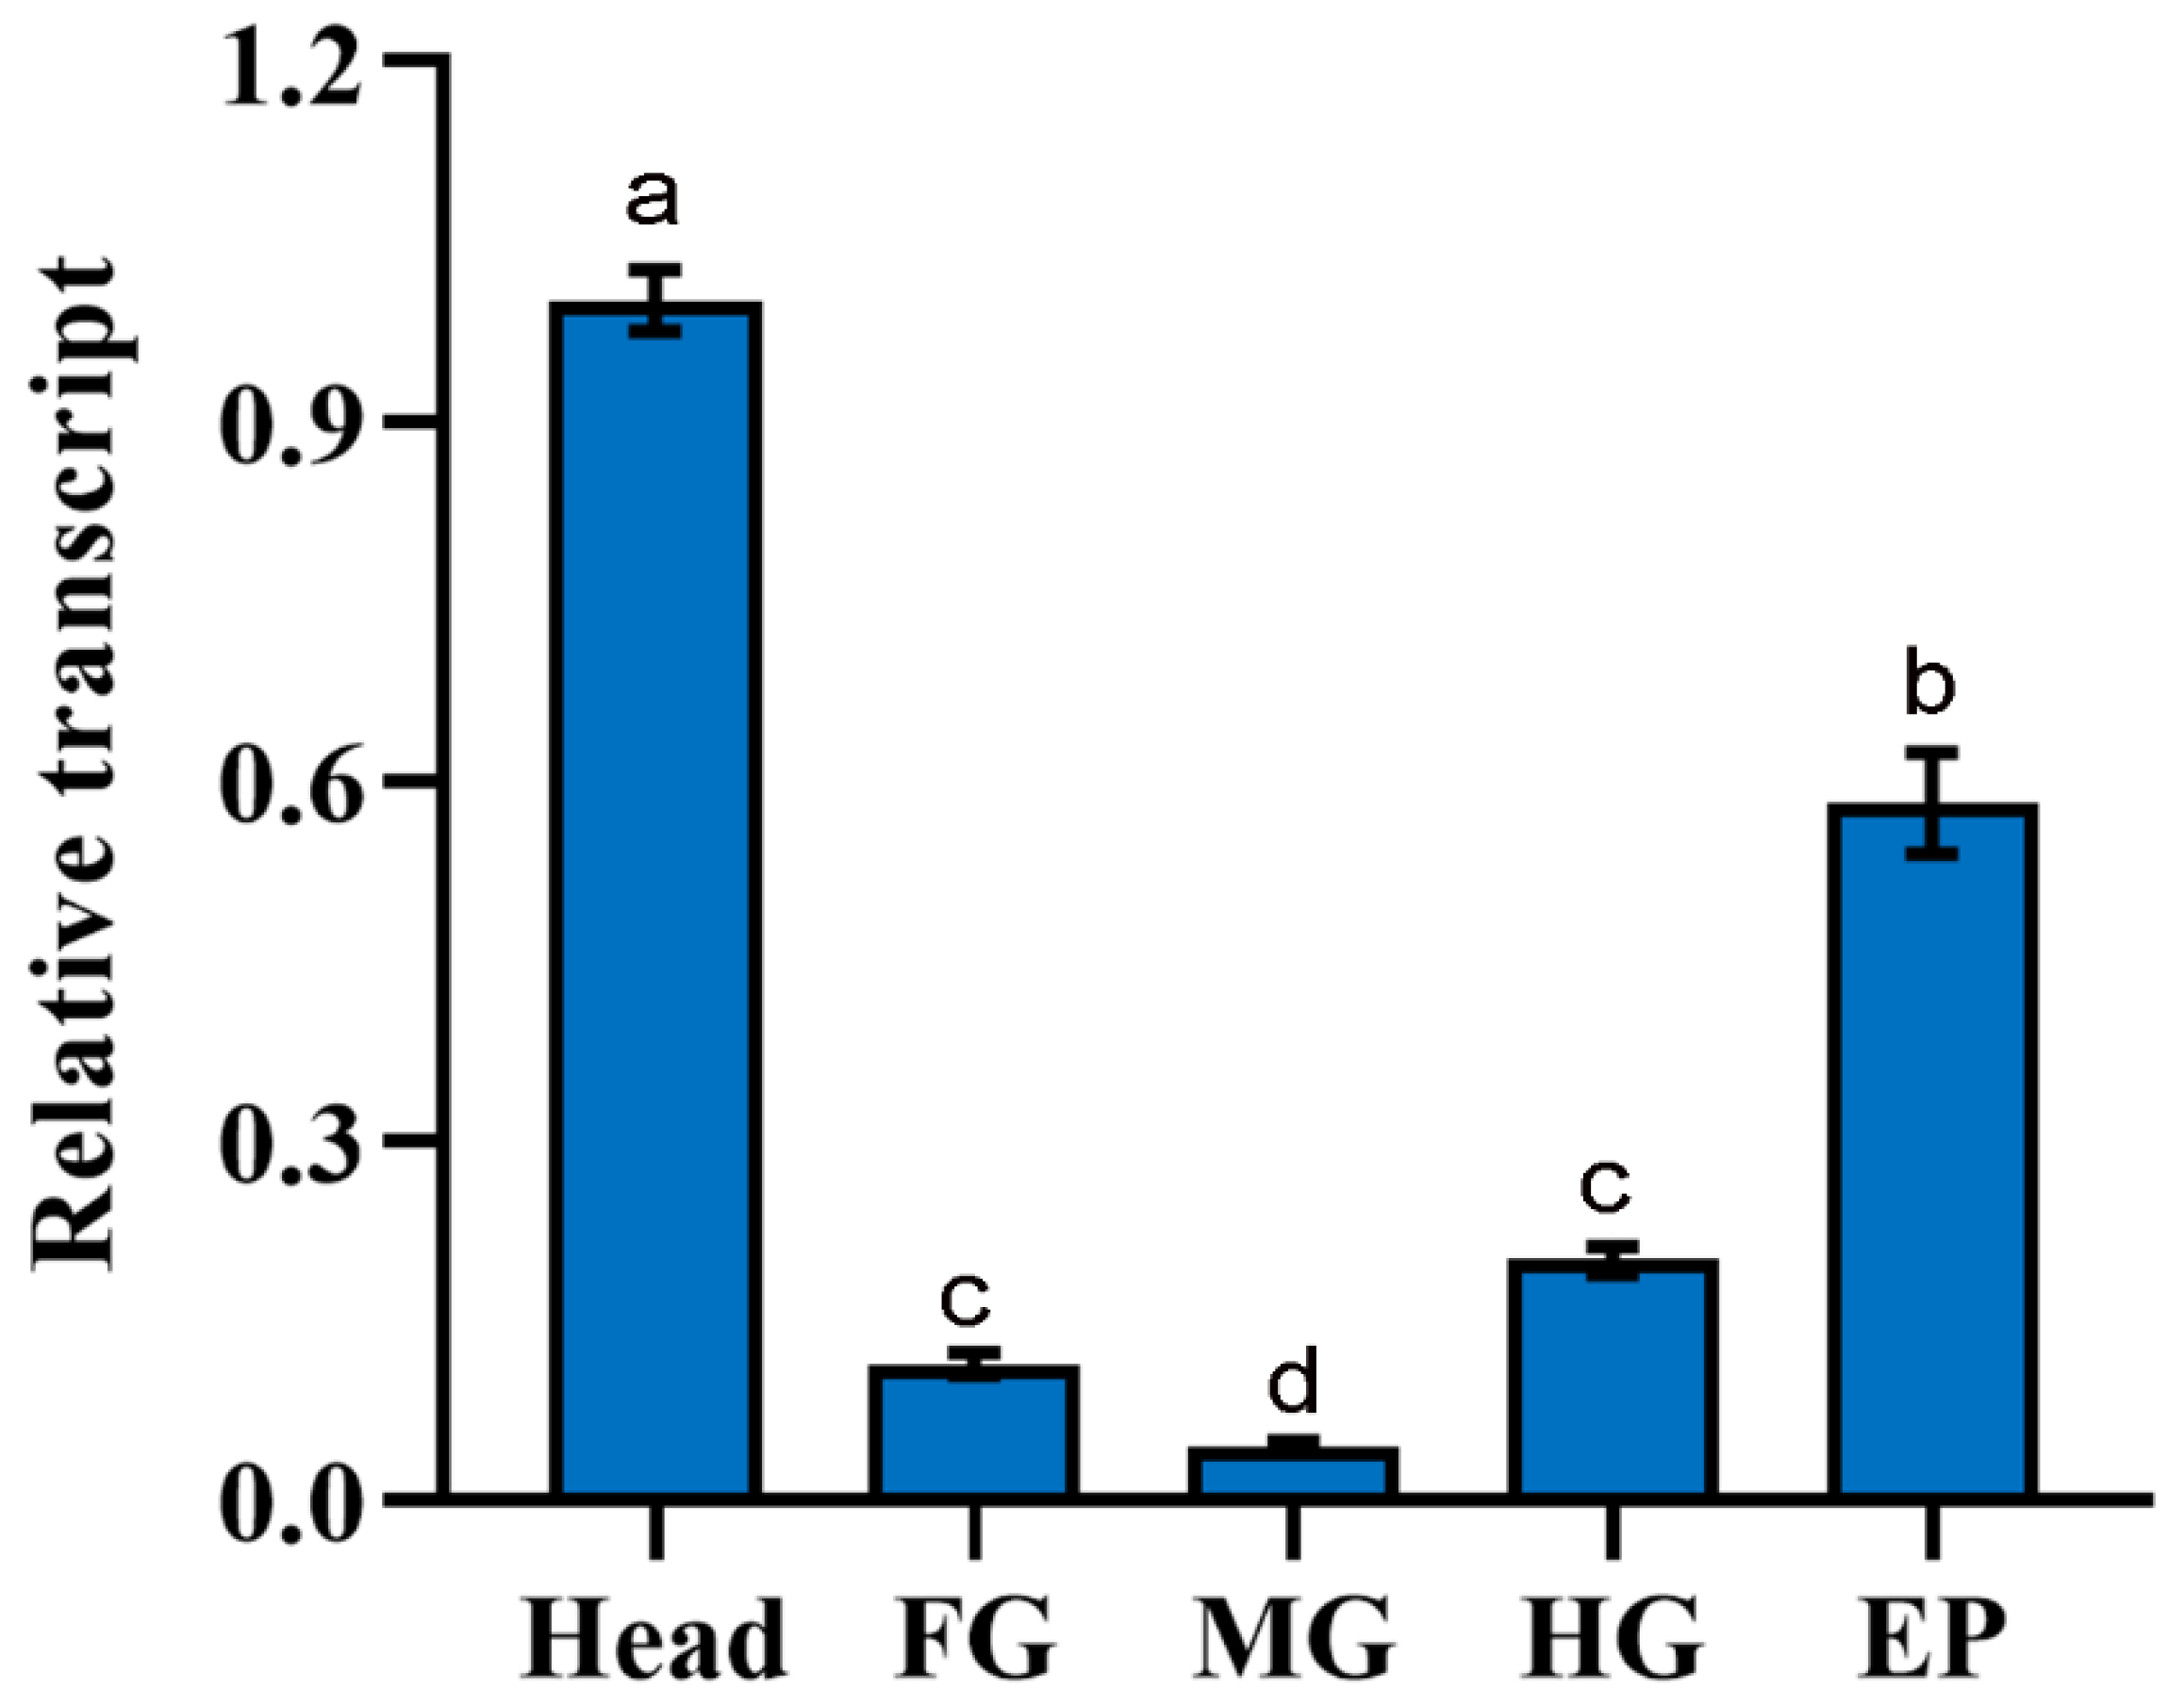
3.6. Validation of the Selected Reference Genes after Gene Expression

To demonstrate the utility of EF1α and RPL13 in accurate gene expression analysis, the expressions of chitin synthase A gene (PoChSA) in the head capsules, epidermis, foregut, midgut and hindgut were calculated after normalization with a combination of EF1α and RPL13. The highest accumulated mRNA level of PoChSA was found in the head capsule and epidermis, followed by those in the foregut and hindgut; the lowest level was detected in the midgut (Figure 6).

4. Discussion

In the present paper, we investigated the expression stability of ten HKGs in P. operculella. Out of the ten HKGs, ACT, RPL, TUB, GAPDH, 18S and EF1α are the top 10 most frequently used reference genes [25].
It is widely accepted that moderately expressed HKGs should be chosen as potential reference genes because genes with extremely high or low expression levels are less reliable [31]. According to the Ct value obtained in the present paper, ACT and SOD are the less expressed and GAPDH and 18S are the most expressed. Even though the results obtained using the BestKeeper, geNorm and NormFinder algorithms were not completely consistent, the data still revealed that the mRNA levels of ACT and SOD are changed dramatically throughout the developing stages among tissues and under different temperatures, respectively. It appears that the four genes should be excluded as reference genes for qRT-PCR.
Actin (ACT) plays an important role in cell secretion, motility cytoplasm flow and experimental cytoskeleton maintenance and is abundantly expressed in most cell types. Even though ACT is used for qRT-PCR studies when measuring the expression of target genes in P. operculella [3,4], it was verified to be one of the most unstable genes in the present paper. The transcript level of ACT is also less stable in several Coleopteran insect species, such as Phaedon brassicae, Henosepilachna vigintioctomaculata, Leptinotarsa decemlineata, Coleomegilla 11 aculate, Coccinella septempunctata and Hippodamia convergens [32,33,34,35,36,37], although ACT is one of the most stable reference genes across several developmental stages in Orthopteran (Schistocerca gregaria and Chortoicetes terminifera), Hemipteran (Diuraphis noxia), Thysanopteran (Thrips tabaci), Hymenopteran (Apis mellifera), Dipteran (Drosophila melanogaster and Liriomyza trifolii) and Lepidopteran (Plutella xylostella and Chilo suppressalis) insects [13,14,15,16,17,18,19,20].
18S ribosomal RNA is a part of the ribosomal RNA (rRNA), which accounts for more than 80% of the total RNA pool [38], whereas mRNA accounts for only 3 to 5%. This is consistent with our data that 18S is the most expressed in P. operculella (this study). Therefore, the use of rRNAs as reference genes may mask subtle changes in target mRNAs [39]. Moreover, 18S shows a large variation in different development stages in Myzus persicae [40].
Superoxide dismutase (SOD) is known as an antioxidative stress protein by scavenging the superoxide radicals, used to defend against reactive oxygen species (ROS) damage caused by a variety of unfavorable environmental stressors in some insect species [41,42,43]. In this study, the SOD gene was verified to be one of the most unstable genes under three different conditions.
Similarly, the instability of GAPDH expression has been documented in Colaphellus bowringi [44], D. caesalis [22], Mythimna separata [45], Ophraella communa [46] and P. brassicae [37]. GAPDH functions as a glycolytic enzyme involved in glycolysis and is associated with cell proliferation under adverse conditions where its catalytic activity is impaired [47]. It is presumed that any perturbation toward energy metabolism or cell proliferation would have a potential impact on GAPDH expression. Considering these issues, it is inappropriate to adopt GAPDH as a reference gene. Therefore, we focus on five genes, i.e., α-TUB, EF1α, RPL4, RPL13 and RPL27, in P. operculella for the selection of a suitable reference gene combination.
It has been suggested that multiple reference genes should be used in order to avoid biased normalization [48]. Additionally, from the present study, we recommended two reference genes, EF1α and RPL13, to normalize the gene expression levels among diverse conditions in P. operculella. Consistent with our results, the conserved nuclear gene elongation factor 1 alpha (EF1α) plays an important role in translation by catalyzing the GTP-dependent binding of aminoacyl-tRNA to the acceptor site of the ribosome. EF1α is evaluated as the most stable gene under diverse conditions in D. melanogaster [15], C. terminifera [13], Bombus terrestris and Bombus lucorum [49], Frankliniella occidentalis [50] and Helicoverpa armigera [39].
Ribosomal proteins are known to play an essential role in ribosome assembly, and they, in conjunction with four ribosomal RNAs (rRNAs), make up the ribosomal subunits responsible for cellular protein translation [51]. Similar to our results, ribosomal protein genes are the most widely selected reference genes for expression studies in insects during the past 10 years [25]. They are recommended as reference genes in Coleopteran species P. brassicae (RPL32 and RPL19) [37], Dendroctonus frontalis (RPS18) [52], H. vigintioctomaculata (RPL13 and RPS18) [36], L. decemlineata (RP18 and RP4) [32], Lethrus apterus (RP18) [53], Mylabris cichorii (RPS22e) [54] and Tribolium castaneum (RPS3, RPL13a and RPL18) [55,56], Hymenopterans such as A. mellifera (RPS18) [16] and Aphidius gifuensis (RPL13, RPS18, RPL29) [57], Lepidopterans such as P. xylostella (RPS13 and RPS23) [58] and H. armigera (RPS15 and RPL27) [39], Thysanopteran species F. occidentalis (RPL32) [50], Hemipteran species Amrasca biguttula biguttula (RP13) [59], Aphis craccivora (RPL11, RPS8 and RPL14) [60], Cimex lectularius (RPL18) [61], Lipaphis erysimi (RPL18 and RPL13) [62], Phenacoccus solenopsis (RPL32) [63], Rhodnius prolixus (RPS18) [64] and Orthopteran S. gregaria (RP49) [19], as well as Acari Tetranychus cinnabarinus (RPS18 and RP49) [65] and Tetranychus urticae (RP49) [66].
To sum up, in this study, the genes RPL13, EF1α and RPL27 are indicated to be ranked as the best reference gene combination for measuring gene expression levels among different developing stages and under various temperatures, while EF1α and RPL13 are recommended to normalize gene expression levels among diverse tissues. EF1α and RPL13 are the best reference genes in all the experimental conditions in P. operculella (Lepidoptera: Gelechiidae). Interestingly, in another Lepidoptera insect Spodoptera frugiperda (Noctuidae), based on the online program RefFinder, SOD, RPL10 and RPS24 were reported to be the most stable reference genes for different developmental stages, while α-TUB, RPL10 and ATP were for various tissues, AK, RPL10 and 18S for mating status, 18S and AK for hormone treatment, 18S, RPL10 and SOD for diets treatment, and RPL10, 18S and RPS24 for temperature treatment [67]. The results verified that the expression stability of the reference genes varied under different treatments. Similarly, the ribosomal protein genes are also the most stable reference genes selected under almost all the experimental conditions. In addition, the difference in housekeeping genes under similar treatments may be related to the phylogenetic relationship and feeding habits of the two lepidoptera insects.
In order to demonstrate the utility of EF1α and RPL13 in accurate gene expression analysis in P. operculella, we evaluated the relative gene expression level of PoChSA in the head capsules, epidermis, foregut, midgut and hindgut. Our results showed that PoChSA was abundantly expressed in the head capsule and epidermis, moderately transcribed in the foregut and hindgut and lowly expressed in the midgut. Our expression data are consistent with the fact that ChSA encodes an enzyme that catalyzes the biosynthesis of chitin in the ectodermally derived epidermal cells forming epidermis, trachea, foregut and hindgut [3,68,69,70,71]. Thus, the tissue-biased expression pattern of PoChSA demonstrates that EF1α and RPL13 can be used as endogenous controls to assess gene expression in P. operculella.

5. Conclusions

Our findings recommend EF1α and RPL13 as the optimal reference gene set under three different experimental conditions. EF1α and RPL13 combinations can be proposed as reference genes for measuring the target gene expression levels among diverse backgrounds in P. operculella. To date, this is the first study to screen out candidate reference genes for gene expression analysis in P. operculella. The results lay a foundation for molecular research. Nevertheless, the application of these loci as reference genes under other physiological or experimental conditions remains to be determined.

Supplementary Materials

The following supporting information can be downloaded at: https://www.mdpi.com/article/10.3390/insects13020140/s1, Table S1: The overall threshold cycle (Ct) values under different experimental conditions.

Author Contributions

Conceptualization, C.-H.S., L.J. and G.-Q.L.; Methodology, C.-H.S., L.-J.P., Y.-X.Z., H.-R.Z. and H.-F.Y.; Formal Analysis, C.-H.S. and L.J.; Investigation, C.-H.S., L.-J.P., Y.-X.Z., H.-R.Z. and H.-F.Y.; Data Curation, C.-H.S., L.J. and G.-Q.L.; Writing—Original Draft Preparation, C.-H.S., L.J. and G.-Q.L.; Writing—Review & Editing, L.J. and G.-Q.L.; Project Administration, L.J. and G.-Q.L.; Funding Acquisition, L.J. and G.-Q.L. All authors have read and agreed to the published version of the manuscript.

Funding

This research was supported by the National Natural Science Foundation of China (32072416), China Agriculture Research System of MOF and MARA (CARS-09-P22) and Fundamental Research Funds for the Central Universities (KYZ201819).

Informed Consent Statement

Not applicable.

Data Availability Statement

All data generated in association with this study have been made available in the Supplementary Materials published online with this article.

Acknowledgments

We acknowledge Jian-Feng Liu and Yan-Fei Song in Guizhou University for providing the P. operculella strain.

Conflicts of Interest

The authors declare no conflict of interest.

References

  1. Bustin, S.A. Quantification of mRNA using real-time reverse transcription PCR (RT-PCR): Trends and problems. J. Mol. Endocrinol. 2002, 29, 23–39. [Google Scholar] [CrossRef] [PubMed]
  2. Valasek, M.A.; Repa, J.J. The power of real-time PCR. Adv. Physiol. Educ. 2005, 29, 151–159. [Google Scholar] [CrossRef] [PubMed]
  3. Mohammed, A.M.A.; Diab, M.R.; Abdelsattar, M.; Khalil, S.M.S. Characterization and RNAi-mediated knockdown of Chitin Synthase A in the potato tuber moth, Phthorimaea operculella. Sci. Rep. 2017, 7, 9502. [Google Scholar] [CrossRef] [PubMed]
  4. He, X.; Cai, Y.; Zhu, J.; Zhang, M.; Zhang, Y.; Ge, Y.; Zhu, Z.; Zhou, W.; Wang, G.; Gao, Y. Identification and functional char-acterization of two putative pheromone receptors in the potato tuber moth, Phthorimaea operculella. Front. Physiol. 2021, 11, 618983. [Google Scholar] [CrossRef]
  5. Bustin, S.A.; Benes, V.; Garson, J.A.; Hellemans, J.; Huggett, J.; Kubista, M.; Mueller, R.; Nolan, T.; Pfaffl, M.W.; Shipley, G.L.; et al. The MIQE guidelines: Minimum information for publication of quantitative real-time PCR experiments. Clin. Chem. 2009, 55, 611–622. [Google Scholar] [CrossRef] [Green Version]
  6. Yang, Q.; Li, Z.; Cao, J.; Zhang, S.; Zhang, H.; Wu, X.; Zhang, Q.; Liu, X. Selection and assessment of reference genes for quantitative PCR normalization in migratory locust Locusta migratoria (Orthoptera: Acrididae). PLoS ONE 2014, 9, e98164. [Google Scholar] [CrossRef] [Green Version]
  7. Yan, X.; Zhang, Y.; Xu, K.; Wang, Y.; Yang, W. Selection and validation of reference genes for gene expression analysis in Tuta absoluta Meyrick (Lepidoptera: Gelechiidae). Insects 2021, 12, 589. [Google Scholar] [CrossRef]
  8. Xu, J.; Welker, D.L.; James, R.R. Variation in expression of reference genes across life stages of a bee, Megachile rotundata. Insects 2021, 12, 36. [Google Scholar] [CrossRef]
  9. Derveaux, S.; Vandesompele, J.; Hellemans, J. How to do successful gene expression analysis using real-time PCR. Methods 2010, 50, 227–230. [Google Scholar] [CrossRef]
  10. Nolan, T.; Hands, R.; Bustin, S. Quantification of mRNA using real-time RT-PCR. Nat. Protoc. 2006, 1, 1559–1582. [Google Scholar] [CrossRef]
  11. Rondon, S.I. Decoding Phthorimaea operculella (Lepidoptera: Gelechiidae) in the new age of change. J. Integr. Agric. 2020, 19, 316–324. [Google Scholar] [CrossRef]
  12. Ferguson, B.S.; Nam, H.; Hopkins, R.G.; Morrison, R.F. Impact of reference gene selection for target gene normalization on experimental outcome using real-time qRT-PCR in adipocytes. PLoS ONE 2010, 5, e15208. [Google Scholar] [CrossRef] [PubMed] [Green Version]
  13. Chapuis, M.P.; Tohidiesfahani, D.; Dodgson, T.; Blondin, L.; Ponton, F.; Cullen, D.; Simpson, S.J.; Sword, G.A. Assessment and validation of a suite of reverse transcription-quantitative PCR reference genes for analyses of density dependent behavioural plasticity in the Australian plague locust. BMC Mol. Biol. 2011, 12, 7. [Google Scholar] [CrossRef] [PubMed] [Green Version]
  14. Chang, Y.W.; Chen, J.Y.; Lu, M.X.; Gao, Y.; Tian, Z.H.; Gong, W.R.; Zhu, W.; Du, Y.Z. Selection and validation of reference genes for quantitative real-time PCR analysis under different experimental conditions in the leafminer Liriomyza trifolii (Diptera: Agromyzidae). PLoS ONE 2017, 12, e0181862. [Google Scholar] [CrossRef] [PubMed] [Green Version]
  15. Ponton, F.; Chapuis, M.P.; Pernice, M.; Sword, G.A.; Simpson, S.J. Evaluation of potential reference genes for reverse transcription-qPCR studies of physiological responses in Drosophila melanogaster. J. Insect Physiol. 2011, 57, 840–850. [Google Scholar] [CrossRef] [PubMed]
  16. Scharlaken, B.; Graaf, D.C.D.; Goossens, K.; Brunain, M.; Peelman, L.J.; Jacobs, F.J. Reference gene selection for insect expression studies using quantitative real-time PCR: The head of the honeybee, Apis mellifera, after a bacterial challenge. J. Insect Sci. 2008, 8, 1–10. [Google Scholar] [CrossRef] [Green Version]
  17. Sinha, D.K.; Smith, C.M. Selection of reference genes for expression analysis in Diuraphis noxia (Hemiptera: Aphididae) fed on resistant and susceptible wheat plants. Sci. Rep. 2014, 4, 5059. [Google Scholar] [CrossRef] [PubMed]
  18. Teng, X.; Zhang, Z.; He, G.; Yang, L.; Li, F. Validation of reference genes for quantitative expression analysis by real-time RT-PCR in four lepidopteran insects. J. Insect Sci. 2012, 12, 1–17. [Google Scholar] [CrossRef] [Green Version]
  19. Van Hiel, M.B.; Van Wielendaele, P.; Temmerman, L.; Van Soest, S.; Vuerinckx, K.; Huybrechts, R.; Broeck, J.V.; Simonet, G. Identification and validation of housekeeping genes in brains of the desert locust Schistocerca gregaria under different developmental conditions. BMC Mol. Biol. 2009, 10, 56. [Google Scholar] [CrossRef] [Green Version]
  20. Singh, S.; Gupta, M.; Pandher, S.; Kaur, G.; Goel, N.; Rathore, P.; Palli, S.R. RNA sequencing, selection of reference genes and demonstration of feeding RNAi in Thrips tabaci (Lind.) (Thysanoptera: Thripidae). BMC Mol. Biol. 2019, 20, 6. [Google Scholar] [CrossRef] [Green Version]
  21. Liu, G.; Qiu, X.; Li, C.; Zhang, Y.; Zhan, Z.; Han, R. Evaluation of reference genes for reverse transcription quantitative PCR studies of physiological responses in the ghost moth, Thitarodes armoricanus (Lepidoptera, Hepialidae). PLoS ONE 2016, 11, e0159060. [Google Scholar] [CrossRef] [PubMed]
  22. Wang, Z.; Meng, Q.Q.; Zhu, X.; Sun, S.W.; Liu, A.Q.; Gao, S.F.; Gou, Y.F. Identification and evaluation of reference genes for normalization of gene expression in developmental stages, sexes, and tissues of Diaphania caesalis (Lepidoptera, Pyralidae). J. Insect Sci. 2020, 6, 1–9. [Google Scholar] [CrossRef] [PubMed]
  23. Sun, M.; Lu, M.X.; Tang, X.T.; Du, Y.Z. Exploring valid reference genes for quantitative real-time PCR analysis in Sesamia inferens (Lepidoptera: Noctuidae). PLoS ONE 2015, 10, e0115979. [Google Scholar] [CrossRef] [PubMed]
  24. Nakamura, A.M.; Chahad-Ehlers, S.; Lima, A.L.A.; Taniguti, C.H.; Sobrinho, I.; Torres, F.R.; Torres, F.R. Reference genes for accessing differential expression among developmental stages and analysis of differential expression of OBP genes in Anastrepha obliqua. Sci. Rep. 2015, 6, 17480. [Google Scholar] [CrossRef] [PubMed]
  25. Lü, J.; Yang, C.; Zhang, Y.; Pan, H. Selection of reference genes for the normalization of RT-qPCR data in gene expression studies in insects: A systematic review. Front. Physiol. 2018, 9, 1560. [Google Scholar] [CrossRef] [Green Version]
  26. Vandesompele, J.; De Preter, K.; Pattyn, F.; Poppe, B.; Van Roy, N.; De Paepe, A.; Speleman, F. Accurate normalization of real-time quantitative RT-PCR data by geometric averaging of multiple internal control genes. Genome Biol. 2002, 3, research0034.1. [Google Scholar] [CrossRef] [Green Version]
  27. Pfaffl, M.W.; Tichopad, A.; Prgomet, C.; Neuvians, T.P. Determination of stable housekeeping genes, differentially regulated target genes and sample integrity: BestKeeper-Excel based tool using pair-wise correlations. Biotechnol. Lett. 2004, 26, 509–515. [Google Scholar] [CrossRef]
  28. Andersen, C.L.; Jensen, J.L.; Ørntoft, T.F. Normalization of real-time quantitative reverse transcription-PCR data: A model-based variance estimation approach to identify genes suited for normalization, applied to bladder and colon cancer data sets. Cancer Res. 2004, 64, 5245–5250. [Google Scholar] [CrossRef] [Green Version]
  29. Szabo, A.; Perou, C.M.; Karaca, M.; Perreard, L.; Bernard, P.S. Statistical modeling for selecting housekeeper genes. Genome Biol. 2008, 9, 405. [Google Scholar] [CrossRef] [Green Version]
  30. Yang, C.; Pan, H.; Liu, Y.; Zhou, X. Stably expressed housekeeping genes across developmental stages in the two-spotted spider mite, Tetranychus urticae. PLoS ONE 2015, 10, e0120833. [Google Scholar] [CrossRef]
  31. Rodrigues, T.B.; Dhandapani, R.K.; Duan, J.J.; Palli, S.R. RNA interference in the Asian longhorned beetle: Identification of key RNAi genes and reference genes for RT-qPCR. Sci. Rep. 2017, 7, 8913. [Google Scholar] [CrossRef] [PubMed] [Green Version]
  32. Shi, X.Q.; Guo, W.C.; Wan, P.J.; Zhou, L.T.; Ren, X.L.; Ahmat, T.; Fu, K.Y.; Li, G.Q. Validation of reference genes for expression analysis by quantitative real-time PCR in Leptinotarsa decemlineata (Say). BMC Res. Notes 2013, 6, 93. [Google Scholar] [CrossRef] [PubMed] [Green Version]
  33. Pan, H.; Yang, X.; Siegfried, B.D.; Zhou, X. A comprehensive selection of reference genes for RT-qPCR analysis in a predatory lady beetle, Hippodamia convergens (Coleoptera: Coccinellidae). PLoS ONE 2015, 10, e0125868. [Google Scholar] [CrossRef] [PubMed]
  34. Yang, C.; Pan, H.; Noland, J.E.; Hang, D.; Zhang, Z.; Liu, Y.; Zhou, X. Selection of reference genes for RT-qPCR analysis in a predatory biological control agent, Coleomegilla maculata (Coleoptera: Coccinellidae). Sci. Rep. 2015, 5, 18201. [Google Scholar] [CrossRef]
  35. Yang, C.; Preisser, E.L.; Zhang, H.; Liu, Y.; Dai, L.; Pan, H.; Zhou, X. Selection of reference genes for RT-qPCR analysis in Coccinella septempunctata to assess un-intended effects of RNAi transgenic plants. Front. Plant Sci. 2016, 7, e53006. [Google Scholar]
  36. Lü, J.; Chen, S.; Guo, M.; Ye, C.; Qiu, B.; Wu, J.; Yang, C.; Pan, H. Selection and validation of reference genes for RT-qPCR analysis of the ladybird beetle Henosepilachna vigintioctomaculata. Front. Physiol. 2018, 9, 1614. [Google Scholar] [CrossRef] [Green Version]
  37. Ma, L.; Jiang, T.; Liu, X.; Xiao, H.; Peng, Y.; Zhang, W. Evaluation of candidate reference genes for gene expression analysis in the brassica leaf beetle, Phaedon brassicae (Coleoptera: Chrysomelidae). PLoS ONE 2021, 16, e0251920. [Google Scholar] [CrossRef]
  38. Kozera, B.; Rapacz, M. Reference genes in real-time PCR. J. Appl. Genet. 2013, 54, 391–406. [Google Scholar] [CrossRef] [Green Version]
  39. Zhang, S.D.; An, S.H.; Li, Z.; Wu, F.M.; Yang, Q.P.; Liu, Y.C.; Cao, J.J.; Zhang, H.J.; Zhang, Q.W.; Liu, X.X. Identification and validation of reference genes for normalization of gene expression analysis using qRT-PCR in Helicoverpa armigera (Lepidoptera: Noctuidae). Gene 2015, 555, 393–402. [Google Scholar] [CrossRef]
  40. Rahman, S.; Zhao, Z.; Umair Sial, M.; Zhang, Y.; Jiang, H. Case study using recommended reference genes actin and 18S for reverse-transcription quantitative real-time PCR analysis in Myzus persicae. PLoS ONE 2021, 16, e0258201. [Google Scholar] [CrossRef]
  41. Jia, H.; Sun, R.; Shi, W.; Yan, Y.; Li, H.; Guo, X.; Xu, B. Characterization of a mitochondrial manganese superoxide dismutase gene from Apis cerana cerana and its role in oxidative stress. J. Insect Physiol. 2014, 60, 68–79. [Google Scholar] [CrossRef] [PubMed]
  42. Wu, H.; Zhang, Y.; Shi, X.; Zhang, J.; Ma, E. Overexpression of Mn-superoxide dismutase in Oxya chinensis mediates increased malathion tolerance. Chemosphere 2017, 181, 352–359. [Google Scholar] [CrossRef] [PubMed]
  43. Kobayashi, Y.; Nojima, Y.; Sakamoto, T.; Iwabuchi, K.; Nakazato, T.; Bono, H.; Toyoda, A.; Fujiyama, A.; Kanost, M.R.; Tabunoki, H. Comparative analysis of seven types of superoxide dismutases for their ability to respond to oxidative stress in Bombyx mori. Sci. Rep. 2019, 9, 2170. [Google Scholar] [CrossRef] [PubMed]
  44. Tan, Q.; Zhu, L.; Li, Y.; Liu, W.; Ma, W.; Lei, C.; Wang, X.-P. A de novo transcriptome and valid reference genes for quantitative Real-Time PCR in Colaphellus bowringi. PLoS ONE 2015, 10, e0118693. [Google Scholar] [CrossRef]
  45. Li, H.; Dai, C.; Zhang, C.; He, Y.; Ran, H.; Chen, S. Screening potential reference genes for quantitative real time PCR analysis in the oriental armyworm, Mythimna separata. PLoS ONE 2018, 13, e019509. [Google Scholar] [CrossRef] [Green Version]
  46. Zhang, Y.; Chen, J.; Chen, G.; Ma, C.; Chen, H.; Gao, X.; Tian, Z.; Cui, S.; Tian, Z.; Guo, J.; et al. Identification and validation of reference genes for quantitative gene expression analysis in Ophraella communa. Front. Physiol. 2020, 11, 355. [Google Scholar] [CrossRef]
  47. Nicholls, C.; Li, H.; Liu, J. GAPDH: A common enzyme with uncommon functions. Clin. Exp. Pharmacol. Physiol. 2012, 39, 674–679. [Google Scholar] [CrossRef]
  48. Bustin, S.A.; Benes, V.; Garson, J.; Hellemans, J.; Huggett, J.; Kubista, M.; Mueller, R.; Nolan, T.; Pfaffl, M.W.; Shipley, G.; et al. The need for transparency and good practices in the qPCR literature. Nat. Methods 2013, 10, 1063–1067. [Google Scholar] [CrossRef]
  49. Hornáková, D.; Matousková, P.; Kindl, J.; Valterová, I.; Pichová, I. Selection of reference genes for real-time polymerase chain reaction analysis in tissues from Bombus terrestris and Bombus lucorum of different ages. Anal. Biochem. 2010, 397, 118–120. [Google Scholar] [CrossRef]
  50. Zheng, Y.T.; Li, H.B.; Lu, M.X.; Du, Y.Z. Evaluation and validation of reference genes for qRT-PCR normalization in Frankliniella occidentalis (Thysanoptera: Thripidae). PLoS ONE 2014, 9, e111369. [Google Scholar]
  51. Zhou, X.; Liao, W.; Liao, J.; Liao, P.; Lu, H. Ribosomal proteins: Functions beyond the ribosome. J. Mol. Cell Biol. 2015, 7, 92–104. [Google Scholar] [CrossRef] [PubMed] [Green Version]
  52. Kyre, B.R.; Rodrigues, T.B.; Rieske, L.K. RNA interference and validation of reference genes for gene expression analyses using qPCR in southern pine beetle, Dendroctonus frontalis. Sci. Rep. 2019, 9, 5640. [Google Scholar] [CrossRef] [PubMed]
  53. Nagy, N.A.; Németh, Z.; Juhász, E.; Póliska, S.; Rácz, R.; Kosztolányi, A.; Barta, Z. Evaluation of potential reference genes for real-time qPCR analysis in a biparental beetle, Lethrus apterus (Coleoptera: Geotrupidae). PeerJ 2017, 5, e4047. [Google Scholar] [CrossRef] [PubMed] [Green Version]
  54. Wang, Y.; Wang, Z.; Huang, Y.; Liao, Y.; Yin, Y. Identification of suitable reference genes for gene expression studies by qRT-PCR in the blister beetle Mylabris cichorii. J. Insect Sci. 2014, 14, 1–10. [Google Scholar] [CrossRef] [PubMed] [Green Version]
  55. Lord, J.C.; Hartzer, K.; Toutges, M.; Oppert, B. Evaluation of quantitative PCR reference genes for gene expression studies in Tribolium castaneum after fungal challenge. J. Microbiol. Methods 2010, 80, 219–221. [Google Scholar] [CrossRef]
  56. Sang, W.; He, L.; Wang, X.-P.; Zhu-Salzman, K.; Lei, C.-L. Evaluation of reference genes for RT-qPCR in Tribolium castaneum (Coleoptera: Tenebrionidae) under UVB stress. Environ. Entomol. 2015, 44, 418–425. [Google Scholar] [CrossRef]
  57. Gao, X.K.; Zhang, S.; Luo, J.Y.; Wang, C.Y.; Lü, L.M.; Zhang, L.J.; Zhu, X.Z.; Wang, L.; Cui, J.J. Identification and validation of reference genes for gene expression analysis in Aphidius gifuensis (Hymenoptera: Aphidiidae). PLoS ONE 2017, 12, e0188477. [Google Scholar] [CrossRef]
  58. Fu, W.; Xie, W.; Zhang, Z.; Wang, S.; Wu, Q.; Liu, Y.; Zhou, X.; Zhou, X.; Zhang, Y. Exploring valid reference genes for quantitative real-time PCR analysis in Plutella xylostella (Lepidoptera: Plutellidae). Int. J. Biol. Sci. 2013, 9, 792–802. [Google Scholar] [CrossRef] [Green Version]
  59. Singh, S.; Gupta, M.; Pandher, S.; Kaur, G.; Rathore, P.; Palli, S.R. Selection of housekeeping genes and demonstration of RNAi in cotton leafhopper, Amrasca biguttula biguttula (Ishida). PLoS ONE 2018, 13, e0191116. [Google Scholar] [CrossRef] [Green Version]
  60. Yang, C.; Pan, H.; Liu, Y.; Zhou, X. Temperature and development impacts on housekeeping gene expression in cowpea aphid, Aphis craccivora (Hemiptera: Aphidiae). PLoS ONE 2015, 10, e0130593. [Google Scholar] [CrossRef] [Green Version]
  61. Mamidala, P.; Rajarapu, S.P.; Jones, S.C.; Mittapalli, O. Identification andvalidation of reference genes for quantitative real-time polymerse chain reaction in Cimex lectularius. J. Med. Entomol. 2011, 48, 947–951. [Google Scholar] [CrossRef] [PubMed]
  62. Koramutla, M.K.; Aminedi, R.; Bhattacharya, R. Comprehensive evaluation of candidate reference genes for qRT-PCR studies of gene expression in mustard aphid, Lipaphis erysimi (Kalt). Sci. Rep. 2016, 6, 25883. [Google Scholar] [CrossRef] [PubMed]
  63. Arya, S.K.; Jain, G.; Upadhyay, S.K.; Singh, H.; Dixit, S.; Verma, P.C. Reference genes validation in Phenacoccus solenopsis under various biotic and abiotic stress conditions. Sci. Rep. 2017, 7, 13520. [Google Scholar] [CrossRef] [PubMed] [Green Version]
  64. Majerowicz, D.; Alves-Bezerra, M.; Logullo, R.; Fonseca-de-Souza, A.L.; Meyer-Fernandes, J.R.; Braz, G.R.; Gondim, K.C. Looking for reference genes for real-time quantitative PCR experiments in Rhodnius prolixus (Hemiptera: Reduviidae). Insect Mol. Biol. 2011, 20, 713–722. [Google Scholar] [CrossRef] [PubMed]
  65. Sun, W.; Jin, Y.; He, L.; Lu, W.C.; Li, M. Suitable reference gene selection for the different strains and developmental stages of the carmine spider mite, Tetranychus cinnabarinus, using quantitative real-time PCR. J. Insect Sci. 2010, 10, 208. [Google Scholar] [CrossRef] [Green Version]
  66. Morales, M.A.; Mendoza, B.M.; Lavine, L.C.; Lavine, M.D.; Walsh, D.B.; Zhu, F. Selection of reference genes for expression studies of xenobiotic adaptation in Tetranychus urticae. Int. J. Biol. Sci. 2016, 12, 1129–1139. [Google Scholar] [CrossRef] [Green Version]
  67. Han, S.; Qin, Q.; Wang, D.; Zhou, Y.; He, Y. Selection and evaluation of reference genes for qRT-PCR in Spodoptera frugiperda (Lepidoptera: Noctuidae). Insects 2021, 12, 902. [Google Scholar] [CrossRef]
  68. Shi, J.-F.; Mu, L.-L.; Chen, X.; Guo, W.-C.; Li, G.-Q. RNA interference of chitin synthase genes inhibits chitin biosynthesis and affects larval performance in Leptinotarsa decemlineata (Say). Int. J. Biol. Sci. 2016, 12, 1319–1331. [Google Scholar] [CrossRef] [Green Version]
  69. Yang, W.-J.; Xu, K.-K.; Cong, L.; Wang, J.-J. Identification, mRNA expression, and functional analysis of Chitin Synthase 1 gene and its two alternative splicing variants in Oriental fruit fly, Bactrocera dorsalis. Int. J. Biol. Sci. 2013, 9, 331–342. [Google Scholar] [CrossRef] [Green Version]
  70. Tetreau, G.; Cao, X.; Chen, Y.-R.; Muthukrishnan, S.; Jiang, H.; Blissard, G.W.; Kanost, M.R.; Wang, P. Overview of chitin metabolism enzymes in Manduca sexta: Identification, domain organization, phylogenetic analysis and gene expression. Insect Biochem. Mol. Biol. 2015, 62, 114–126. [Google Scholar] [CrossRef] [Green Version]
  71. Shirk, P.D.; Perera, O.P.; Shelby, K.S.; Furlong, R.B.; LoVullo, E.D.; Popham, H.J.R. Unique synteny and alternate splicing of the chitin synthases in closely related heliothine moths. Gene 2015, 574, 121–139. [Google Scholar] [CrossRef] [PubMed]
Figure 1. Expression levels of ten house-keeping genes in Phthorimaea operculella. The mean Ct values for 10 candidate reference genes are shown in three independent experiments: developmental stage, tissue, and temperature. Each box indicates the 25th and 75th percentiles. The line across the box represents the median. Abbreviation: ACT, actin; α-TUB, α-tubulin; GAPDH, glyceraldehyde-3-phosphate dehydrogenase; EF1α, elongation factor 1α; 18S and 28S, 18S and 28S ribosomal RNA; RPL4, RPL13 and RPL27, ribosomal protein; SOD, superoxide dismutase. The abbreviations are exactly the same as Figure 2, Figure 3, Figure 4 and Figure 5.
Insects 13 00140 g001
Figure 2. Expression stability of ten house-keeping genes during development stage in Phthorimaea operculella. All stages of P. operculella were sampled: young and old larvae, pupae and adults (collected on the first and second days of each stage). The expression stability rankings were determined by geNorm, NormFinder and BestKeeper.
Insects 13 00140 g002
Figure 3. Expression stability of ten house-keeping genes among various tissues in Phthorimaea operculella. Head capsule, foregut, midgut, hindgut, fat body, hemocytes and epidermis were dissected from the fourth instar larvae. The expression stability rankings were determined by geNorm, NormFinder and BestKeeper.
Insects 13 00140 g003
Figure 4. Expression stability of ten house-keeping genes under different temperatures in Phthorimaea operculella. The fourth-instar larvae reared under three temperatures (4 °C, 26 °C and 35 °C) were collected. The expression stability rankings were determined by geNorm, NormFinder and BestKeeper.
Insects 13 00140 g004
Figure 5. Expression stability of ten house-keeping genes in different samples of Phthorimaea operculella. The stability of the reference genes calculated by the Geomean method of RefFinder. A lower Geomean of ranking value denotes more stable expression.
Insects 13 00140 g005
Figure 6. Tissue expression of the chitin synthase A gene (PoChSA) in Phthorimaea operculella. The head capsule (Head), foregut (FG), midgut (MG), hindgut (HG) and epidermis (EP) were dissected from the fourth-instar larvae. For each sample, 3 independent pools of 20–30 individuals were measured in technical triplicate using qRT-PCR. The values were calculated using the 2−ΔΔCT method, using the selected reference genes EF1α and RPL13. The relative transcripts are the ratios of copy numbers in different developing stages relative to the head capsule, which is set as 1. The columns represent averages, with vertical lines indicating SE. Different letters indicate significant difference at p value < 0.05 using analysis of variance with the Tukey–Kramer test.
Insects 13 00140 g006
Table 1. A list of primers used for RT-PCR of the genes.
Gene NamePrimer Sequences (5′ to 3′)Amplicon Size (bp)Accession Number
ACTForward GTGTTCCCCTCCATCGTC
Reverse ACATCGCCTGGAAAGTAG
979OL675412
α-TUBForward GCCGTGTTTGTGGACTTG
Reverse TGATGGAGGATACGATTTGA
523OL690519
18SForward ATGCCCTTAGATGTCCTGG
Reverse GGATTTCTAACCCGTCTGC
557OL655414
28SForward ACGTCGTTGTCGATGTCC
Reverse CAAGCCTTCACTTTCGTT
212OL672488
GAPDHForward GACCACTGTCCACGCTAC
Reverse GATGACACGGCTGGAGTA
451OL675413
EF1αForward CTTCTCGCCTTCACCCTT
Reverse GGCGAATCTACCCAGAGG
864OL690518
RPL4Forward TGAGAAGAGCGAGCAAGT
Reverse TTTTCCCTCAGTTTCTCG
1098OL652885
RPL13Forward ACAAGGATTGGCAAAGATT
Reverse ACCCTTGAGGACCTTCTT
365OL690517
RPL27Forward GAAGAACTACGACGAGGGG
Reverse TGTTCTTTCCGCTCTTGTAT
299OL675414
SODForward ATGGTTGCTTTGCTGAAT
Reverse AGATAGCTTTGACATAGTCGG
370OL675415
Table 2. Primers of 10 candidate house-keeping genes used in qRT-PCR.
Gene Primer Sequences (5′ to 3′)Length (bp)SlopeR2Efficiency (%)
ACTF-AATTGTGCGAGACGTCAAGG239−3.4800.99893.80
R-CGTCGCACTTCATGATGGAG
α-TUBF-CACTGGTAAAGAAGACGCGG194−3.2410.999103.49
R-AGAGACGTTCCATCAGCAGG
18SF-CGTTTGCTGGGAAGTTGACC199−3.2890.997101.39
R-GACACGACCGTAAACCCATC
28SF-GATTCAGTTTCGGGCACTCG 154−3.2320.999103.89
R-CTAGACCGACGCTCCATCC
GAPDHF-TGCCACCCAAAAGACTGTTG240−3.3380.99899.33
R-ACCTTGGCTTTGATCGCATC
EF1αF-TGTCAAGCAGCTGATCGTTG164−3.2860.999101.52
R-CTCCGTGCCATCCAGAAATG
RPL4F-GGTCTGACGTGCTCAAGGTA183−3.4520.99194.84
R-GCAGGTTCAGCTTGTCAACA
RPL13F-AACCAACCCGCTAGAAGACA97−3.2940.999101.18
R-CCACAGGTCTCAATGGTCCA
RPL27F-TGAAGAACTACGACGAGGG199−3.3840.99297.47
R-TCGAAGCTGAAGTCTACGGA
SODF-CAACCTGTCTCCCTGCAAAA159−3.3280.99899.75
R-TTCGCCAACTTGTTGTAGCC
Table 3. Expression stability of the candidate reference genes under different experimental conditions.
ConditionsCRGs *geNormNormfinderBestKeeperΔCt
StabilityRankStabilityRankStabilityRankStabilityRank
Developmental stagesACT1.54293.751102.987103.81910
EF0.20810.37420.28931.0651
18S0.97381.21491.09791.7289
28S0.42920.75970.28421.2986
SOD0.76960.74050.61761.3517
GAPDH0.72150.95180.87881.3628
α-TUB0.55130.75360.54541.2404
RPL40.81870.57340.69971.2785
RPL130.20810.29410.14111.0692
RPL270.65040.56030.60951.2113
Larvae tissuesACT0.79971.15090.69681.3449
EF0.33810.00710.20010.8331
18S0.70661.00480.65671.2527
28S0.44530.38350.32830.9344
SOD1.16192.131102.088102.21710
GAPDH0.89780.97270.99791.3028
α-TUB0.60750.60860.49351.0436
RPL40.38920.27220.37340.8693
RPL130.33810.29330.27920.8682
RPL270.51740.37040.54260.9465
Temparature treatmentACT0.61430.75961.29381.1375
EF0.48510.50230.93450.9912
18S0.90370.92880.75531.3228
28S0.80860.81270.37711.1947
SOD1.25792.215101.751102.32410
GAPDH0.99081.20091.59991.4519
α-TUB0.70140.46420.63021.0263
RPL40.74350.73450.98971.1446
RPL130.48510.17010.90640.9451
RPL270.56720.52740.96361.0.364
* Candidate reference genes.
Publisher’s Note: MDPI stays neutral with regard to jurisdictional claims in published maps and institutional affiliations.

