Article

Effects of Elevated CO2 Concentration on Host Adaptability and Chlorantraniliprole Susceptibility in Spodoptera frugiperda

1
State Key Laboratory of Conservation and Utilization of Biological Resources of Yunnan, College of Plant Protection, Yunnan Agricultural University, Kunming 650201, China
2
Yunnan Plant Protection and Quarantine Station, Kunming 650034, China
3
Yunnan Plateau Characteristic Agriculture Industry Research Institute, Kunming 650201, China
*
Author to whom correspondence should be addressed.
Insects 2022, 13(11), 1029; https://doi.org/10.3390/insects13111029
Submission received: 23 September 2022 / Revised: 3 November 2022 / Accepted: 4 November 2022 / Published: 7 November 2022
(This article belongs to the Special Issue Recent Advances in Fall Armyworm Research)

Abstract

:

Simple Summary

Elevated carbon dioxide concentrations (eCO2) have a significant direct effect on herbivorous insects during their host seeking and oviposition. On the other hand, eCO2 could dramatically alter leaf chemistry of plants, especially in C3 plants (such as wheat), which in turn is likely to affect the population performance of insects that feed on the host plant. However, the effects of eCO2 on host adaptability and insecticide resistance in the fall armyworm, Spodoptera frugiperda, are unclear. In this study, we demonstrate that elevated CO2 concentrations increased the population performance of S. frugiperda on wheat and reduced the susceptibility of S. frugiperda to chlorantraniliprole by inducing the expression of detoxification enzyme genes. This report warns that S. frugiperda may continue to be a major global pest through better host adaptation and increased insecticide resistance in the future as atmospheric CO2 continues to rise.

Abstract

Elevated atmospheric carbon dioxide concentrations (eCO2) can affect both herbivorous insects and their host plants. The fall armyworm (FAW), Spodoptera frugiperda, is a highly polyphagous agricultural pest that may attack more than 350 host plant species and has developed resistance to both conventional and novel-action insecticides. However, the effects of eCO2 on host adaptability and insecticide resistance of FAW are unclear. We hypothesized that eCO2 might affect insecticide resistance of FAW by affecting its host plants. To test this hypothesis, we investigated the effect of eCO2 on (1) FAW’s susceptibility to chlorantraniliprole after feeding on wheat, (2) FAW’s population performance traits (including the growth and reproduction), and (3) changes in gene expression in the FAW by transcriptome sequencing. The toxicity of chlorantraniliprole against the FAW under eCO2 (800 µL/L) stress showed that the LC50 values were 2.40, 2.06, and 1.46 times the values at the ambient CO2 concentration (400 µL/L, aCO2) for the three generations, respectively. Under eCO2, the life span of pupae and adults and the total number of generations were significantly shorter than the FAW under aCO2. Compared to the aCO2 treatment, the weights of the 3rd and 4th instar larvae and pupae of FAW under eCO2 were significantly heavier. Transcriptome sequencing results showed that more than 79 detoxification enzyme genes in FAW were upregulated under eCO2 treatment, including 40 P450, 5 CarE, 17 ABC, and 7 UGT genes. Our results showed that eCO2 increased the population performance of FAW on wheat and reduced its susceptibility to chlorantraniliprole by inducing the expression of detoxification enzyme genes. This study has important implications for assessing the damage of FAW in the future under the environment of increasing atmospheric CO2 concentration.

1. Introduction

Carbon dioxide (CO2) levels in the atmosphere have risen dramatically as a result of the Industrial Revolution. Today, the concentration of atmospheric CO2 is about 400 parts per million (www.esrl.noaa.gov/gmd/ccgg/trends/, accessed on 11 March 2022), but it could be twice as high by the end of the century [1].
High atmospheric CO2 levels could have a significant effect on insects. A number of hematophagous arthropods respond directly to the level of CO2 during host seeking and oviposition [2,3]. Research on Frankliniella occidentalis (Pergande) and Frankliniella intonsa (Trybom) have shown that elevated CO2 concentration (800 µL/L, eCO2) decreases development duration and increases the fecundity and daily eggs laid per female [4], implying more severe damage in the future. Nevertheless, most studies have focused only on the direct effects of eCO2 on insects. The amount of plant material consumed by phytophagous insects is inextricably linked to their suitability and nutritional quality. In addition to increasing growth rates, eCO2 in the atmosphere dramatically alters these plant traits, such as leaf chemistry [3]. The effect is especially noticeable for C3 plants, such as wheat [5]. Half of all insects, including most Orthoptera, Hemiptera, and Lepidoptera, feed on plants as larvae. Therefore, the amount of plant material taken up by insects is mainly determined by the nutrient composition of the plant. Among a variety of factors that influence plant nutritional quality, nitrogen is the most important [6,7]. In some cases, it is very common for the carbon/nitrogen (C:N) ratio in the leaf tissue to greatly increase, implying a reduction in food quality. According to the compensatory feeding theory, insects may need to eat more foliage to obtain enough nitrogen-based nutrition (mainly proteins). Therefore, phytophagous insects are indirectly affected by changes in their host plants [8]. The development, egg laying capacity, reproduction, and adult longevity of insect herbivores may be influenced by changes in host plant quality and quantity as a result of eCO2 [9].
The fall armyworm (FAW), Spodoptera frugiperda (Lepidoptera: Noctuidae), is an invasive species native to North America and is currently distributed in Asia [10], Africa, Oceania, Central America and South America (https://gd.eppo.int/taxon/LAPHFR/distribution, accessed on 11 March 2022). The FAW is regarded as a super pest because of its superior biological characteristics (including being highly polyphagous, and rapidly developing resistance to insecticides) [11,12,13]. In China, FAW causes serious damage to crop yield both directly or indirectly. The four provinces most affected by FAW in China are Yunnan ($830.51 M), Guangxi ($346.09 M), Sichuan ($116.87 M), and Shandong ($116.43 M) [14]. However, as a super-invasive pest, the impacts of eCO2 on the FAW in the future have not yet been predicted.
eCO2 could directly amplify the effect of insecticides on insects that feed only under eCO2 stress. Previous studies have shown that combining methyl bromide with an increase in 20% CO2 concentration increases the susceptibility of adult Sitophilus oryzae to methyl bromide by 1.5-fold [15]. eCO2 amplifies the efficacy of spinetoram on Frankliniella occidentalis and F. intonsa [16], which indicates that eCO2 increases the insecticidal activity of spinetoram against F. occidentalis and F. intonsa compared with aCO2. In the field, however, eCO2 tends to have a combination effect on herbivorous insects and host plants at the same time, rather than only having direct effects on insects. Therefore, it is important to study the comprehensive effects of eCO2 on insects and plants, as both insects and their host plants are exposed to eCO2 stress. Rao et al. found that in the Spodoptera litura Fab–peanut system, eCO2 caused a higher LC50 value of spinosad and deltamethrin with a comprehensive impact, showing a ‘reduction of toxicity’ [17]. In addition, the susceptibility of the brown plant hopper Nilaparvata lugens to triazophos was significantly decreased in eCO2 compared to aCO2 levels [18]. Thus, the efficacy of insecticides on insects at different CO2 concentrations depends on the experimental treatment. The direct and combined effects of CO2 may result in different insecticidal efficacies in pesticides. To date, the effect of eCO2 on the efficacy of insecticides against the FAW remains unclear. Previous studies have reported that elevated CO2 increases the activity of detoxifying enzymes such as carboxylesterases (CarEs) and glutathione S-transferases (GSTs) [16]. Detoxification enzymes play essential roles in the survival of insects exposed to adverse environments [19,20,21], therefore, higher detoxifying enzymes activity indicate that those enzymes may be involved in anti-eCO2 stress, thereby changing the insecticide susceptibility in insect. However, the exact mechanism is still unclear. Chlorantraniliprole is a diamide insecticide that has high efficacy against lepidopteran insects, low toxicity to mammals and beneficial insects, and absence of cross-resistance with traditional insecticides. Chlorantraniliprole has been shown to have a high effect on FAW control and is widely used to control the FAW in many commercial crops worldwide [22,23,24,25]. Therefore, it is important to determine the effect of eCO2 on the chlorantraniliprole susceptibility of the FAW.
eCO2 concentrations tend to have a combined effect on herbivorous insects and host plants, but most of the current studies only consider the effect in a direct or indirect way. The FAW is a devastating pest, and it is necessary to predict its potential damage in the future after the atmospheric CO2 concentration increases. To test the hypothesis that eCO2 might affect insecticide resistance of FAW by affecting its host plants, in this study, we first investigated how eCO2 affects the susceptibility of the FAW to chlorantraniliprole, then calculated the growth and reproduction of the FAW to analyse its population performance traits under eCO2. Finally, we used transcriptomic analysis and qRT-PCR to identify detoxification genes in the FAW induced under eCO2 stress.

2. Materials and Methods

2.1. Plant Materials and Insect Stocks

Wheat (Huai mai 36), Triticum aestivum L, is a C3 plant susceptible to eCO2, and is one of the FAW’s favourite host plants. Wheat was grown hydroponically in two separate climate chambers with two CO2 concentrations (400 and 800 µL/L) under the same temperature, light intensity, and humidity regimes at Yunnan Agricultural University, Kunming, Yunnan Province, China (25°07′ N, 102°44′ E). Wheat leaves under both treatment conditions were selected for FAW feeding when each plant was at least 8 days old. Wheat was watered every day, and no chemical fertilizer or insecticide was used throughout the experiment. The two treatments on wheat were named WA (wheat that grew at aCO2) and WE (wheat that grew at eCO2).
The tested FAWs were collected from Yuanjiang, Yunnan Province, China (23°35′59.52″ N, 101°58′39.64″ E) in May 2019. The larvae were reared on an artificial diet without exposure to any pesticides since then [26], and the adults were fed with a 10% honey/water solution in the laboratory under the conditions of 27 ± 0.5 °C, 70 ± 5% RH and a photoperiod of 16 h:8 h (L:D).

2.2. Effect of eCO2 on FAW Population Performance

To accurately record the effect of eCO2 on the FAW, two levels of atmospheric CO2 concentration, eCO2 (800 µL/L, the predicted level at the end of this century) and aCO2 (400 µL/L, the current atmospheric CO2 level), were set up in two artificial climate chambers (LTC-1000, SANTN, Shanghai, China), with 16 h light at 27 °C and 8 h dark at 25 °C, and 70% relative humidity (RH). CO2 gas was supplied to the climate chamber all day, and the CO2 concentrations were monitored and adjusted automatically once every 20 min. Eggs laid by the same female were separately placed into two climate chambers with different CO2 concentrations. Newly hatched larvae were randomly selected and reared individually in glass vials (d = 2.5 cm, covered with circular filter paper at the bottom of the vial). We set up three treatments: FAWs grown at 400 µL/L CO2 fed with wheat grown at aCO2 (named FAWA), FAWs grown at 800 µL/L CO2 fed with wheat grown at aCO2 (named FEWA), and FAWs grown at 800 µL/L CO2 fed with wheat grown at eCO2 (named FEWE). Each treatment had three replicates, and each replicate contained 25 individual larvae. Larval instar and body weight changes were recorded daily, all vials were cleaned, and leaves were replaced daily until the larvae pupated.

2.3. Effect of eCO2 on the Chlorantraniliprole Susceptibility of the FAW

The toxicity effect of chlorantraniliprole on the FAW under the three treatments mentioned above (FAWA, FEWA, and FEWE) were assessed and adapted from a previous study [16]. Chlorantraniliprole was diluted with distilled water to five concentrations. A larval rearing box (18 cm × 12 cm × 8 cm) and wheat leaves that grew under two carbon dioxide concentrations (elevated and ambient) were dipped for 2 h and 15 s in a chlorantraniliprole suspension and dried at room temperature. The control treatments were dipped in distilled water. Thirty random fourth larvae were selected and placed in three rearing boxes (each rearing box placed 10 larvae). The mortality rate of the FAWs was assessed after 48 h. The experiments were performed in triplicate. FAWs were presumed dead when they showed no reaction when touched with a brush. The concentration mortality regression equation and LC50 of chlorantraniliprole against the FAWs were derived and calculated. The above experiments were performed under eCO2 and aCO2. The same bioassay was performed in three generations of larvae.

2.4. Effect of eCO2 on Wheat

To investigate the influence of two CO2 concentrations on wheat (WA and WE), the length of wheat shoots and roots were measured after eight days of cultivation, after which those shoots and roots were oven-dried at 80 °C for 72 h. The dry biomass of the roots and shoots was recorded to determine the ratio of roots to shoots, and the relative biomass of the roots and shoots. For each treatment, data on the weight of the total dry plant were used to represent their biomass.

2.5. RNA Isolation, Transcriptome Library Preparation and Sequencing

To understand how eCO2 affects FAW gene expression, comparative transcriptomic analyses were carried out on larvae FAWA and FEWE. Larvae at the fifth instar were selected from three treatments. Five larvae were selected as one sample for the experiment, and three biological replicates of each concentration were performed. A total RNA extraction kit (RNeasy Mini Kit, Qiagen, Hilden, Germany) was used for RNA extraction. RNase-free agarose gel was used to check for contamination. RNA integrity and purity were measured using an Agilent 2100 Bioanalyzer system (Agilent, Santa Clara, CA, USA) and Nano Drop Spectrophotometer (THERMO, Waltham, MA, USA), respectively. The extracted RNA was reverse transcribed to cDNA for library preparation. The libraries were prepared following the manufacturer’s instructions using the BGISEQ-500 sequencing platform. Pair-end sequencing with 100 bp in length was performed using a BGISEQ-500 sequencer with the processed libraries.
The sequencing data were filtered with SOAPnuke (v1.5.2, Source: https://github.com/BGI-flexlab/SOAPnuke, accessed on 20 August 2021) by removing reads (1) containing a sequencing adapter, (2) whose low-quality base ratio (base quality less than or equal to five) was more than 20%, and (3) whose unknown base (‘N’ base) ratio was more than 5%; afterwards, clean reads were obtained and stored in FASTQ format [27]. The clean reads were mapped to the reference genome using HISAT2 (v2.0.4, Source: http://www.ccb.jhu.edu/software/hisat/index.shtml, accessed on 27 August 2021) [28]. The clean reads were aligned to the reference genome [12]. Bowtie2 (v2.2.5, Source: http://bowtiebio.sourceforge.net/%20Bowtie2%20/index.shtml, accessed on 28 August 2021) was applied to align the clean reads to the reference coding gene set, then expression level of gene was calculated by RSEM (v1.2.12, Source: https://github.com/deweylab/RSEM, accessed on 31 August 2021) [29,30]. The heatmap was drawn with pheatmap (v1.0.8, Source: https://cran.r-project.org/web/packages/pheatmap/index.html, accessed on 1 September 2021) according to the gene expression in different samples [31]. Differential expression analysis was performed using DESeq2 (v1.4.5, http://www.bioconductor.org/packages/release/bioc/html/DESeq2.html, accessed on 1 September 2021) with a Q value ≤ 0.05 [32]. Genes that were differentially expressed in each comparison group with |log2(fold change in a comparison group) > 1 and adjusted p value ≤ 0.001 were considered differentially expressed genes (DEGs). To compare the changes in phenotype, GO (http://www.geneontology.org/, accessed on 1 September 2021) and KEGG (https://www.kegg.jp/, accessed on 1 September 2021) enrichment analysis of annotated DEGs was performed using Phyper (https://en.wikipedia.org/wiki/Hypergeometric_distribution, accessed on 2 September 2021) based on the Hypergeometric test. The significance levels of terms and pathways were determined by a Q value with a rigorous threshold (Q value ≤ 0.05).

2.6. qRT-PCR

Two micrograms of total RNA of each sample were used for qRT-PCR cDNA synthesis using a FastKing RT Kit (with gDNase) (KR116, TIANGEN, Beijing, China). The TransStart® Tip Green qPCR SuperMix (AQ141, TransGen Biotech, Beijing, China) was used for qRT-PCR in a 10 μL reaction solution on a LighCycler480 II machine (Roche, Basel, Switzerland). qRT-PCR proceeded as follows: one cycle of denaturation at 94 °C for 3 min, followed by 40 cycles of denaturation at 94 °C for 10 s, annealing at 60 °C for 10 s, and elongation at 72 °C for 20 s, followed by melting curve analysis. Two reference genes, RPL10-insects and RPL13-JIA, were selected for normalisation of the qRT-PCR results. mRNA levels were analysed using the 2−△△CT method [33]. Each assay was repeated three times. Primers were designed using Primer 5.0 software. The primer sequences are listed in Supplementary Table S1.

2.7. Data Analyses

Each experiment was conducted with three biological replicates, and all data were expressed as the mean ± standard error (SE). The larvae weight and development period of the FAW, wheat shoot and root length, and dry biomass were analysed in a data analysis model based on an independent sample t-test (DMRT) (p < 0.05) in SPSS 24.0.0 (IBM, Armonk, NY, USA). Heatmaps were plotted using Origin Pro 2021b (64-bit) SR1 (9.8.5.204 Learning Edition). Bar graphs were plotted using GraphPad Prism version 8.0.0 for Windows (GraphPad Software, San Diego, CA, USA, www.graphpad.com, accessed on 15 March 2022) and Excel 2019.

3. Results

3.1. Effect of eCO2 on the Susceptibility of the FAW to Chlorantraniliprole

Log-probit regression analyses for the toxicity of different chlorantraniliprole concentrations against the FAW showed that the insecticidal activity of chlorantraniliprole was higher for FAWA than FEWE (Table 1). The LC50 values for FEWE were 2.40, 2.06, and 1.46 times that for FAWA (Table 1). The results showed that FAWA was more susceptible to chlorantraniliprole than FEWE in all three generations.
To clarify the direct effect of eCO2 on the FAW, the toxicity of chlorantraniliprole against FEWA treatment was determined in the first generation (Supplementary Table S2), and the results showed that the insecticidal activity of chlorantraniliprole was 1.84 times higher for FEWA than FAWA, indicating that FEWA was more susceptible to chlorantraniliprole than FAWA.

3.2. Effect of eCO2 on FAW Population Performance in Wheat

To examine the effect of eCO2 on the FAW, FAWA and FEWE were reared. Compared with FAWA, the pupae, adult, and total generation durations of FEWE were significantly shorter (Figure 1A). Compared with the FAWA, fourth instar larvae of FEWE and the pupae were heavier (Figure 1B). The average female fecundity of FAWA and FEWE was 918.70 and 811.80, respectively (Figure 1C); though FEWE had a lower fecundity, there was no significant difference.

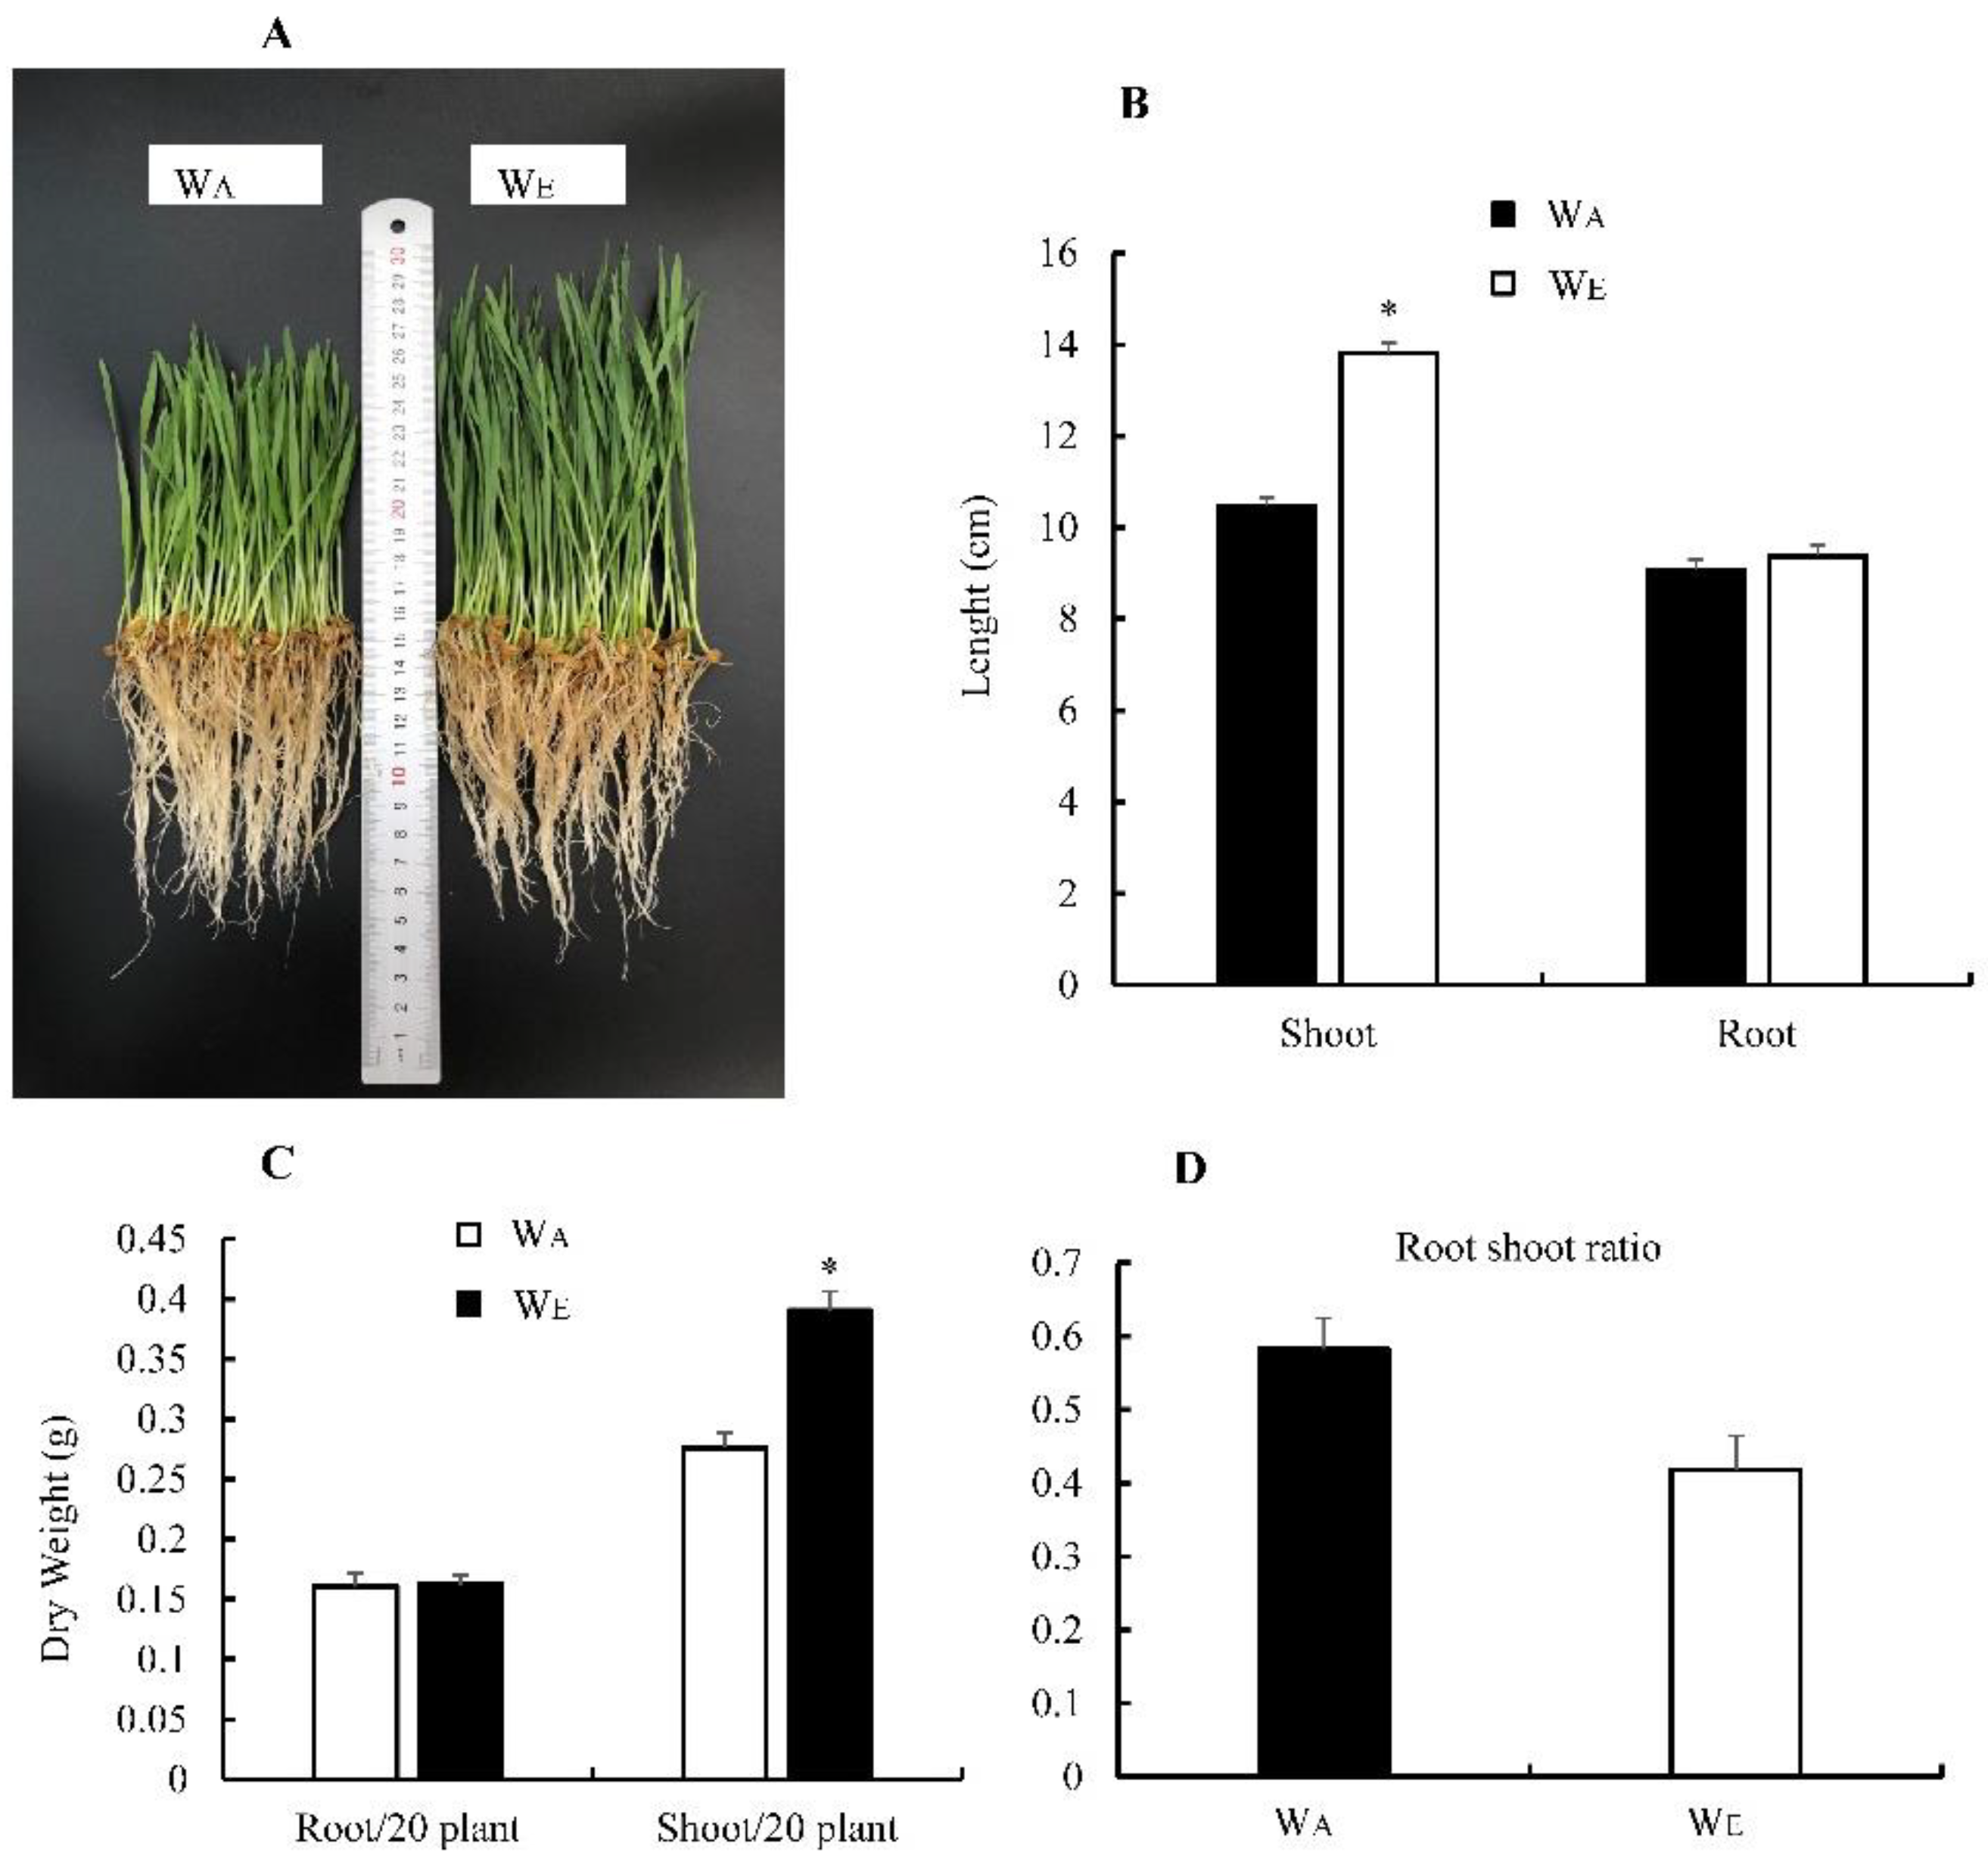
3.3. Effect of eCO2 on Wheat Biomass

The biomass of wheat was affected by the CO2 level. Overall, the weight and length of wheat shoots grown at eCO2 were significantly higher than those grown at aCO2 (Figure 2A–C). The root weight and length of wheat nurtured at eCO2 were higher than those nurtured at aCO2. Wheat grown at a high CO2 concentration had a lower root-to-shoot ratio (Figure 2D).

3.4. Effect of eCO2 on the DEGs of FAW

To investigate the transcriptomic profiles of the FAW under different CO2 conditions, the treatment (FAWA) and control (FEWE) larvae groups were used for transcriptomic analyses (Supplementary Table S3). The expression of all identified genes obtained through RNA sequencing was compared for FAWA and FEWE. There were 1542 DEGs between the two groups, with 897 upregulated and 645 downregulated genes in FEWE (Figure 3). Among the upregulated genes, 78 genes belonged to detoxification enzyme-related genes; these DEGs may lead to changes in insect tolerance to insecticides.

3.5. GO and KEGG Analyses

DEGs in the 2 comparison groups were annotated using the Gene Ontology (GO) function database, which divided them into three macroscopic groups, namely: biological process, cellular component, and molecular function (Supplementary Figure S1). For FAWA versus FEWE, DEGs were assigned to 1594 GO terms enriched in 893 terms of biological process, 212 terms of cellular component, and 489 terms of molecular function, respectively (Figure 4). Among these enriched GO terms, many have growth and development- and detoxification and metabolism-related functions, including monooxygenase activity, oxidoreductase activity, carbohydrate transport, chitin binding, cholinesterase activity, response to stress, UDP-glucose 4-epimerase activity, and so on.
Unigenes with KEGG annotations were classified into five major categories (Supplementary Figure S2). For the secondary categories, the pathways of carbohydrate metabolism, global and overview maps, and lipid metabolism were ranked as the top three subcategories in each category. There are a series of DEGs related to carbohydrate metabolism, energy metabolism, environmental adaptation, and lipid metabolism in categories. A total of 20 signalling pathways (Table 2) were enriched in FAWA compared to FEWE, and a number of DEGs related to glutathione metabolism, fatty acid metabolism, ABC transporters and peroxisome were also enriched.

3.6. Detoxification Enzyme Gene Differentially Expression and Validation

Among the 897 upregulated DEGs, many detoxification genes were upregulated, including 40 genes encoding cytochrome P450 monooxygenases (P450s) (Figure 5A), 17 ATP-binding cassette transporters (ABCs) (Figure 5B), five carboxylesterases (CarEs) (Figure 5C), 7 UDP glucosyltransferases (UGTs) (Figure 5D), four acetylcholinesterase (AchEs) (Figure 5E), and five glutathione S-transferases (GSTs) (Figure 5F).
To confirm the results of the transcriptomic analyses, 16 detoxification enzyme genes were selected for qRT-PCR validation. The expression patterns of the selected 14 detoxification enzyme genes significantly upregulated expression in FEWE based on qRT-PCR analysis (Figure 6). The changes in gene expression levels based on qRT-PCR were largely consistent with the transcriptomic data.

4. Discussion

In addition to the evolution of pest resistance to insecticides, conditional resistance can result from the reduction of insect’s susceptibility to insecticides under changed environmental conditions [34]. Rao et al. found that in S. litura, higher CO2 concentrations caused higher LC50 values for spinosad and deltamethrin, while it caused lower LC50 values for flubendiamide, emamectin benzoate, and quinalphos, indicating that the comprehensive influence of eCO2 on insect resistance depends on the pesticide type [17]. In this study, FAWA was more susceptible to chlorantraniliprole than FEWE in three generations (Table 1). Similarly, the susceptibility of N. lugens to triazophos was significantly decreased in eCO2 compared to aCO2 levels. Ge et al. suggested that this is because eCO2 accelerates the dissipation of triazophos in rice [18]. However, how pests resist pesticides at eCO2 is also important. Recently, transcriptomic analysis has become a routine method for identifying DEGs in insects in response to environmental stress [35,36]. We screened expanded gene families in the FAW to determine how eCO2 affects the susceptibility of the FAW to pesticides. We compared RNA transcription levels using RNA-seq. We determined the DEGs among FAW treated by FAWA (FAW grown at 800 µL/L CO2 fed with WA) and FEWE (FAW grown at 400 µL/L CO2 fed with WE). Our results show that there were 1542 DEGs, with 897 upregulated and 645 downregulated genes in FAWA compared to FEWE (Figure 3), and that a large number of DEGs were involved in metabolic detoxification, including P450s, ABCs, CarEs, UGTs, and GSTs (Figure 5). This indicates that eCO2 can induce the expression of detoxification enzyme genes, which is most likely caused by changes in the concentration of chemical substances in wheat leaves.
Some studies have found that eCO2 can amplify the effect of chemicals on insects. For instance, eCO2 inhibits respiratory enzymes, such as malic enzymes and succinate dehydrogenase, resulting in decreased adenosine triphosphate (ATP) generation. Insects may die as a result of insufficient energy supply. eCO2 levels may increase membrane permeability, allowing more insecticides to enter the insect’s body [37,38,39,40]. Compared to aCO2, high atmospheric CO2 can directly amplify the effect of spinetoram insecticidal activity against Thysanoptera pest F. occidentalis and F. intonsa [16]. In this study, when FAW was only directly affected by eCO2 (FEWA), it was more susceptible to chlorantraniliprole than FAWA (Supplementary Table S2); this conclusion is consistent with Fan et al. [16].
Previous studies suggest that the CO2 increase may affect plants, as it alters the chemical composition of the air, leading to modifications in plants’ secondary metabolism. Increases in the C:N ratio have been seen in plants growing at high CO2 concentrations, which are expected to affect carbon-based secondary chemistry. As a result of these changes, plant tissue nutritional quality is reduced, resulting in an increase in phenolics and a decrease in nitrogen in the plants [8,41,42,43,44]. Under elevated CO2, the reduction in N concentration across a broad range of species can exceed 14%, with C3 plants responding more than C4 plants [3]. To find out how eCO2 affects insecticide resistance of FAW by affecting its host plants, wheat (one of the FAW’s favourite C3 plants) biomass was measured. In this study, wheat biomass at two CO2 concentrations suggests its tissue nutritional quality, C:N ratio, secondary metabolism and defence chemistry content were changed (Figure 2) [3,45,46]. Similarly, many studies have shown that eCO2 increases secondary metabolism and defence chemistry content in plants. A review by Robinson reported that plants grown in eCO2 environments increased total phenolics and condensed tannins and flavonoids by 19%, 22%, and 27%, respectively [8]. eCO2 increased the concentration of quercetin, kaempferol, and fisetin in leaves and rhizomes of two ginger varieties, and exhibited more enhanced free radical scavenging power [47]. In soybean (Glycine max), quercetin-to-kaempferol ratios increase as a result of a strong increase in aliphatic glucosinolates and the methylsulfinylalkyl glucosinolates glucoraphanin and glucoiberin [48]. The total glucosinolate content increased in broccoli (Brassica oleracea) and Arabidopsis thaliana cultivated at eCO2 [49,50]. When insects feed on plants with altered secondary metabolism and defence chemistry, the expression of detoxification enzyme genes will change, which will affect their susceptibility to insecticides. Lu et al. found that in Spodoptera litura, pre-exposure to flavone induced detoxification gene expression and effectively increased larval tolerance to multiple synthetic insecticides [51]. After dietary exposure to xanthotoxin, the 20E signalling pathway and detoxification enzyme genes were modulated by the ROS/CncC pathway to improve tolerance of Spodoptera litura larvae to λ-cyhalothrin [52]. The activities of Spodoptera litura P450 and CYP6AB60 transcription levels were significantly elevated after exposure to an artificial diet supplemented with the plant secondary metabolites coumarin, xanthotoxin, or tomatine [53]. Therefore, we speculated that eCO2 not only changes the growth, development, and reproduction of FAW, but also enhanced biodegradation of xenobiotics by overproduction of a complex array of detoxification enzymes, such as cytochrome P450 monooxygenases (P450s), carboxy/cholinesterases (CCEs), ATP-binding cassette transporter (ABCs), and glutathione S-transferases (GSTs) [54,55,56,57]. Therefore, eCO2 increases wheat’s secondary metabolism and defence chemistry content to induce FAW detoxification enzyme gene upregulation, thereby decreasing FEWE susceptibility to chlorantraniliprole.
Insect’s growth, fecundity, occurrence, and population distribution could change with environmental stress as a result of metabolic rate fluctuation [4]. Elevated atmospheric CO2 concentration may have effects on insects directly or indirectly [3]. The oviposition period, sex ratio, net reproductive rate, intrinsic rate of increase, and finite rate of increase of F. occidentalis increased under eCO2 conditions, while larval duration, survival rate, mean generation time, and population doubling time decreased [58]. For the cotton bollworm, Helicoverpa armigera (Hubner), the direct effects of eCO2 significantly increased mortality and decreased fecundity [59]. When the Asian corn borer, Ostrinia furnacalis (Guenee), was fed an artificial diet under eCO2 conditions, it had a longer larval and pupal development time and decreased rates of survival and mean relative growth [60]. In terms of indirect effects, Qian et al. found that after feeding on plants grown under eCO2, acetylcholinesterase, carboxylesterase, and mixed-function oxidase activity in thrips increased to counter plant defences. Greater thrip densities induced stronger plant defences and, in turn, detoxifying enzyme levels in thrips increased [19]. In this study, the larval, pupae, adult, and total generation duration of the FAW between FAWA and FEWE were significantly different; larvae and pupae weight were also different, but average female fecundity between the two treatments was not significantly different (Figure 1), indicating that eCO2 results in faster population outbreak and more serious damage (heavier larvae and pupae) with no change in fecundity of FAW. In the future, the damage caused to crops by the FAW may increase due to a shorter developmental duration, a heavier body weight, and no difference in fertility.

5. Conclusions

In conclusion, we found that eCO2 could upregulate many detoxification genes in the FAW Spodoptera frugiperda, which were likely to be involved in insecticide susceptibility of FAW at eCO2. Furthermore, eCO2 increased the population performance of the FAW on host plants. These two responses of the FAW to eCO2 may further cause a FAW population outbreak and increase the damage caused by the FAW in the future.

Supplementary Materials

The following are available online at https://www.mdpi.com/article/10.3390/insects13111029/s1, Figure S1: GO gene function classifications of DEGs in comparison groups, Figure S2: KEGG gene function classifications of DEGs in comparison groups. Table S1: Primers of detoxification enzyme genes used in the quantitative real-time PCR, Table S2: Toxicity effect of Chlorantraniliprole on 3rd larvae of S. frugiperda under elevated CO2 and ambient CO2, Table S3: Summary of the transcriptome sequencing data.

Author Contributions

Conceptualization, F.G., Z.L., Y.C. and Z.S.; Formal analysis, F.G., Z.S., Y.C., X.Q. and B.C.; Methodology, Z.L., Z.S., X.T. and X.Q.; Software, Z.L., X.Q.; Writing—review & editing, Z.L., Z.S., Y.L., R.H., X.T. and B.C.; project administration, Z.L., Z.S., R.H. and Y.L.; funding acquisition, F.G. All authors have read and agreed to the published version of the manuscript.

Funding

This research was financially supported by National Key R&D Programs of China (Grant No. 2021YFD1400701).

Institutional Review Board Statement

Not applicable.

Data Availability Statement

The raw sequencing data from this study have been deposited in the Genome Sequence Archive in BIG Data Centre (https://ngdc.cncb.ac.cn), Beijing Institute of Genomics (BIG), Chinese Academy of Sciences, under the accession number: PRJCA012875.

Acknowledgments

We would like to acknowledge the reviewers for their helpful comments on this paper.

Conflicts of Interest

The authors declare no conflict of interest.

References

  1. IPCC. Climate change 2014: Synthesis report. In Contribution of Working Groups I, II and III to the Fifth Assessment Report of the Intergovernmental Panel on Climate Change; IPCC: Geneva, Switzerland, 2014. Available online: https://10013/epic.45156.d001 (accessed on 11 March 2022).
  2. Guerenstein, P.G.; Hildebrand, J.G. Roles and Effects of Environmental Carbon Dioxide in Insect Life. Annu. Rev. Èntomol. 2008, 53, 161–178. [Google Scholar] [CrossRef] [PubMed]
  3. Zavala, J.A.; Nabity, P.D.; DeLucia, E.H. An Emerging Understanding of Mechanisms Governing Insect Herbivory Under Elevated CO2. Annu. Rev. Èntomol. 2013, 58, 79–97. [Google Scholar] [CrossRef] [Green Version]
  4. Shuqi, H.; Ying, L.; Lei, Q.; ZhiHua, L.; Chao, X.; Lu, Y.; Furong, G. The Influence of Elevated CO2 Concentration on the Fitness Traits of Frankliniella occidentalis and Frankliniella intonsa (Thysanoptera: Thripidae). Environ. Èntomol. 2017, 46, 722–728. [Google Scholar] [CrossRef] [PubMed]
  5. DeLucia, E.H.; Nabity, P.D.; Zavala, J.A.; Berenbaum, M.R. Climate Change: Resetting Plant-Insect Interactions. Plant Physiol. 2012, 160, 1677–1685. [Google Scholar] [CrossRef] [PubMed] [Green Version]
  6. Mattson, W.J. Herbivory in Relation to Plant Nitrogen Content. Annu. Rev. Ecol. Syst. 1980, 11, 119–161. [Google Scholar] [CrossRef]
  7. Scriber, J.M.; Slansky, F., Jr. The Nutritional Ecology of Immature Insects. Annu. Rev. Èntomol. 1981, 26, 183–211. [Google Scholar] [CrossRef]
  8. Robinson, E.A.; Ryan, G.D.; Newman, J.A. A meta-analytical review of the effects of elevated CO2 on plant–arthropod interactions highlights the importance of interacting environmental and biological variables. New Phytol. 2012, 194, 321–336. [Google Scholar] [CrossRef] [PubMed] [Green Version]
  9. Wang, J.; Liu, X.; Zhang, X.; Li, L.; Lam, S.K.; Pan, G. Changes in plant C, N and P ratios under elevated [CO2] and canopy warming in a rice-winter wheat rotation system. Sci. Rep. 2019, 9, 5424. [Google Scholar] [CrossRef] [PubMed] [Green Version]
  10. Sparks, A.N. A Review of the Biology of the Fall Armyworm. Fla. Èntomol. 1979, 62, 82–87. [Google Scholar] [CrossRef]
  11. Montezano, D.G.; Specht, A.; Sosa-Gómez, D.R.; Roque-Specht, V.F.; Sousa-Silva, J.C.; Paula-Moraes, S.V.; Peterson, J.A.; Hunt, T.E. Host Plants of Spodoptera frugiperda (Lepidoptera: Noctuidae) in the Americas. Afr. Entomol. 2018, 26, 286–300. Available online: https://hdl.handle.net/10520/EJC-112bc26060 (accessed on 11 March 2022). [CrossRef]
  12. Gui, F.; Lan, T.; Zhao, Y.; Guo, W.; Dong, Y.; Fang, D.; Liu, H.; Li, H.; Wang, H.; Hao, R.; et al. Genomic and transcriptomic analysis unveils population evolution and development of pesticide resistance in fall armyworm Spodoptera frugiperda. Protein Cell 2020, 9, 1–19. [Google Scholar] [CrossRef] [PubMed]
  13. Wan, J.; Huang, C.; Li, C.-Y.; Zhou, H.-X.; Ren, Y.-L.; Li, Z.-Y.; Xing, L.-S.; Zhang, B.; Qiao, X.; Liu, B.; et al. Biology, invasion and management of the agricultural invader: Fall armyworm, Spodoptera frugiperda (Lepidoptera: Noctuidae). J. Integr. Agric. 2021, 20, 646–663. [Google Scholar] [CrossRef]
  14. Wu, P.; Wu, F.; Fan, J.; Zhang, R. Potential economic impact of invasive fall armyworm on mainly affected crops in China. J. Pest Sci. 2021, 94, 1065–1073. [Google Scholar] [CrossRef]
  15. Calderon, M.; Leesch, J.G. Effect of Reduced Pressure and CO2 on the Toxicity of Methyl Bromide to Two Species of Stored-Product Insects1. J. Econ. Èntomol. 1983, 76, 1125–1128. [Google Scholar] [CrossRef]
  16. Fan, Z.; Qian, L.; Chen, Y.; Fan, R.; He, S.; Gao, Y.; Gui, F. Effects of elevated CO2 on activities of protective and detoxifying enzymes in Frankliniella occidentalis and F. intonsa under spinetoram stress. Pest Manag. Sci. 2021, 78, 274–286. [Google Scholar] [CrossRef]
  17. Rao, M.S.; Sreelakshmi, P.; Deekshita, K.; Vanaja, M.; Srinivas, I.; Maheswari, M.; Reddy, K.S.; Bhaskar, S.; Chary, G.R. Interactive effects of temperature and CO2 on efficacy of insecticides against Spodoptera litura Fab. in a global warming context. Phytoparasitica 2021, 49, 417–431. [Google Scholar] [CrossRef]
  18. Ge, L.-Q.; Wu, J.-C.; Sun, Y.-C.; Ouyang, F.; Ge, F. Effects of triazophos on biochemical substances of transgenic Bt rice and its nontarget pest Nilaparvata lugens Stål under elevated CO2. Pestic. Biochem. Physiol. 2013, 107, 188–199. [Google Scholar] [CrossRef]
  19. Qian, L.; He, S.; Liu, X.; Huang, Z.; Chen, F.; Gui, F. Effect of elevated CO2 on the interaction between invasive thrips, Frankliniella occidentalis, and its host kidney bean, Phaseolus vulgaris. Pest Manag. Sci. 2018, 74, 2773–2782. [Google Scholar] [CrossRef]
  20. Dai, L.; Gao, H.; Chen, H. Expression Levels of Detoxification Enzyme Genes from Dendroctonus armandi (Coleoptera: Curculionidae) Fed on a Solid Diet Containing Pine Phloem and Terpenoids. Insects 2021, 12, 926. [Google Scholar] [CrossRef]
  21. Liu, B.; Tang, M.; Chen, H. Activation of the ROS/CncC Signaling Pathway Regulates Cytochrome P450 CYP4BQ1 Responsible for (+)-α-Pinene Tolerance in Dendroctonus armandi. Int. J. Mol. Sci. 2022, 23, 11578. [Google Scholar] [CrossRef]
  22. Bolzan, A.; Padovez, F.E.O.; Nascimento, A.R.; Kaiser, I.S.; Lira, E.C.; Amaral, F.S.; Kanno, R.H.; Malaquias, J.B.; Omoto, C. Selection and characterization of the inheritance of resistance of Spodoptera frugiperda (Lepidoptera: Noctuidae) to chlorantraniliprole and cross-resistance to other diamide insecticides. Pest Manag. Sci. 2019, 75, 2682–2689. [Google Scholar] [CrossRef] [PubMed]
  23. Bai-Zhong, Z.; Xu, S.; Cong-Ai, Z.; Liu-Yang, L.; Ya-She, L.; Xing, G.; Dong-Mei, C.; Zhang, P.; Ming-Wang, S.; Xi-Ling, C. Silencing of Cytochrome P450 in Spodoptera frugiperda (Lepidoptera: Noctuidae) by RNA Interference Enhances Susceptibility to Chlorantraniliprole. J. Insect Sci. 2020, 20, 3–12. [Google Scholar] [CrossRef] [PubMed]
  24. Pes, M.P.; Melo, A.A.; Stacke, R.S.; Zanella, R.; Perini, C.R.; Silva, F.M.A.; Guedes, J.V.C. Translocation of chlorantraniliprole and cyantraniliprole applied to corn as seed treatment and foliar spraying to control Spodoptera frugiperda (Lepidoptera: Noctuidae). PLoS ONE 2020, 15, e0229151. [Google Scholar] [CrossRef] [PubMed] [Green Version]
  25. Li, X.; Jiang, H.; Wu, J.; Zheng, F.; Xu, K.; Lin, Y.; Zhang, Z.; Xu, H. Drip application of chlorantraniliprole effectively controls invasive Spodoptera frugiperda (Lepidoptera: Noctuidae) and its distribution in maize in China. Crop Prot. 2020, 143, 105474. [Google Scholar] [CrossRef]
  26. Su, X.N.; Li, C.Y.; Huang, S.H.; Liu, W.L.; Zhang, Y.P.; Pan, Z.P. Optimization of artificial diet and rearing condition of fall armyworm, Spodoptera frugiperda (J. E. Smith). J. Environ. Entomol. 2019, 41, 992–998. (In Chinese) [Google Scholar]
  27. Li, R.; Li, Y.; Kristiansen, K.; Wang, J. SOAP: Short oligonucleotide alignment program. Bioinformatics 2008, 24, 713–714. [Google Scholar] [CrossRef] [Green Version]
  28. Kim, D.; Langmead, B.; Salzberg, S.L. HISAT: A fast spliced aligner with low memory requirements. Nat. Methods 2015, 12, 357–360. [Google Scholar] [CrossRef] [Green Version]
  29. Langmead, B.; Salzberg, S.L. Fast gapped-read alignment with Bowtie 2. Nat. Methods 2012, 9, 357–359. [Google Scholar] [CrossRef] [Green Version]
  30. Li, B.; Dewey, C.N. RSEM: Accurate transcript quantification from RNA-Seq data with or without a reference genome. BMC Bioinform. 2011, 12, 323. [Google Scholar] [CrossRef] [Green Version]
  31. Kolde, R. Package ‘Pheatmap’. 2019-01-04 13:50:12 UTC. Available online: https://cran.r-project.org/web/packages/pheatmap/pheatmap.pdf (accessed on 1 September 2021).
  32. Love, M.I.; Huber, W.; Anders, S. Moderated estimation of fold change and dispersion for RNA-seq data with DESeq2. Genome Biol. 2014, 15, 550. [Google Scholar] [CrossRef] [Green Version]
  33. Schmittgen, T.D.; Livak, K.J. Analyzing real-time PCR data by the comparative CT method. Nat. Protoc. 2008, 3, 1101–1108. [Google Scholar] [CrossRef] [PubMed]
  34. Matzrafi, M. Climate change exacerbates pest damage through reduced pesticide efficacy. Pest Manag. Sci. 2019, 75, 9–13. [Google Scholar] [CrossRef] [PubMed] [Green Version]
  35. Teets, N.M.; Peyton, J.T.; Ragland, G.J.; Colinet, H.; Renault, D.; Hahn, D.A.; Denlinger, D.L. Combined transcriptomic and metabolomic approach uncovers molecular mechanisms of cold tolerance in a temperate flesh fly. Physiol. Genom. 2012, 44, 764–777. [Google Scholar] [CrossRef] [PubMed] [Green Version]
  36. Ma, W.; Li, X.; Shen, J.; Du, Y.; Xu, K.; Jiang, Y. Transcriptomic analysis reveals Apis mellifera adaptations to high temperature and high humidity. Ecotoxicol. Environ. Saf. 2019, 184, 109599. [Google Scholar] [CrossRef]
  37. Lessard, F.F. Effect of modified atmospheres on insects and mites infesting stored products. In Food Preservation by Modified Atmospheres; CRC Press: Boca Raton, FL, USA, 1990; pp. 21–38. Available online: https://www.researchgate.net/publication/305042923_Effect_of_modified_atmospheres_on_insects_and_mites_infesting_stored_products (accessed on 14 April 2022).
  38. Edwards, L.J. Carbon dioxide anaesthesia and succinic dehydrogenase in the corn earworm, Heliothis zea. J. Insect Physiol. 1968, 14, 1045–1048. [Google Scholar] [CrossRef]
  39. Friedlander, A.; Navarro, S. The effect of controlled atmospheres on carbohydrate metabolism in the tissue of Ephestia cautella (walker) pupae. Insect Biochem. 1979, 9, 79–83. [Google Scholar] [CrossRef]
  40. Zhou, S.; Criddle, R.S.; Mitcham, E.J. Metabolic response of Platynota stultana pupae during and after extended exposure to elevated CO2 and reduced O2 atmospheres. J. Insect Physiol. 2001, 47, 401–409. [Google Scholar] [CrossRef]
  41. Sun, Y.; Guo, H.; Ge, F. Plant–Aphid Interactions Under Elevated CO2: Some Cues from Aphid Feeding Behavior. Front. Plant Sci. 2016, 7, 502. [Google Scholar] [CrossRef] [Green Version]
  42. Liu, J.; Fang, X.; Deng, Q.; Han, T.; Huang, W.; Li, Y. CO2 enrichment and N addition increase nutrient loss from decomposing leaf litter in subtropical model forest ecosystems. Sci. Rep. 2015, 5, srep07952. [Google Scholar] [CrossRef] [Green Version]
  43. Manimanjari, D.; Rao, M.S.; Swathi, P.; Rao, C.A.R.; Vanaja, M.; Maheswari, M. Temperature- and CO2-dependent life table parameters of Spodoptera litura (Noctuidae: Lepidoptera) on sunflower and prediction of pest scenarios. J. Insect Sci. 2014, 14, 297. [Google Scholar] [CrossRef] [Green Version]
  44. Satishchandra, N.K.; Vaddi, S.; Naik, S.O.; Chakravarthy, A.K.; Atlihan, R. Effect of Temperature and CO2 on Population Growth of South American Tomato Moth, Tuta absoluta (Meyrick) (Lepidoptera: Gelechiidae) on Tomato. J. Econ. Èntomol. 2018, 111, 1614–1624. [Google Scholar] [CrossRef] [PubMed]
  45. Högy, P.; Fangmeier, A. Effects of elevated atmospheric CO2 on grain quality of wheat. J. Cereal Sci. 2008, 48, 580–591. [Google Scholar] [CrossRef]
  46. Cotrufo, M.F.; Ineson, P.; Scott, A. Elevated CO 2 reduces the nitrogen concentration of plant tissues. Glob. Chang. Biol. 1998, 4, 43–54. [Google Scholar] [CrossRef]
  47. Ghasemzadeh, A.; Jaafar, H.Z.; Rahmat, A. Elevated Carbon Dioxide Increases Contents of Flavonoids and Phenolic Compounds, and Antioxidant Activities in Malaysian Young Ginger (Zingiber officinale Roscoe.) Varieties. Molecules 2010, 15, 7907–7922. [Google Scholar] [CrossRef] [PubMed] [Green Version]
  48. O’Neill, B.F.; Zangerl, A.R.; Dermody, O.; Bilgin, D.D.; Casteel, C.L.; Zavala, J.A.; DeLucia, E.H.; Berenbaum, M.R. Impact of Elevated Levels of Atmospheric CO2 and Herbivory on Flavonoids of Soybean (Glycine max Linnaeus). J. Chem. Ecol. 2010, 36, 35–45. [Google Scholar] [CrossRef]
  49. Bidart-Bouzat, M.G.; Mithen, R.; Berenbaum, M.R. Elevated CO2 influences herbivory-induced defense responses of Arabidopsis thaliana. Oecologia 2005, 145, 415–424. [Google Scholar] [CrossRef]
  50. Schonhof, I.; Kläring, H.-P.; Krumbein, A.; Schreiner, M. Interaction Between Atmospheric CO2 and Glucosinolates in Broccoli. J. Chem. Ecol. 2006, 33, 105–114. [Google Scholar] [CrossRef]
  51. Lu, K.; Cheng, Y.; Li, Y.; Li, W.; Zeng, R.; Song, Y. Phytochemical Flavone Confers Broad-Spectrum Tolerance to Insecticides in Spodoptera litura by Activating ROS/CncC-Mediated Xenobiotic Detoxification Pathways. J. Agric. Food Chem. 2021, 69, 7429–7445. [Google Scholar] [CrossRef]
  52. Lu, K.; Li, Y.; Cheng, Y.; Li, W.; Zeng, B.; Gu, C.; Zeng, R.; Song, Y. Activation of the ROS/CncC and 20-Hydroxyecdysone Signaling Pathways Is Associated with Xanthotoxin-Induced Tolerance to λ-Cyhalothrin in Spodoptera litura. J. Agric. Food Chem. 2021, 69, 13425–13435. [Google Scholar] [CrossRef]
  53. Sun, Z.; Shi, Q.; Li, Q.; Wang, R.; Xu, C.; Wang, H.; Ran, C.; Song, Y.; Zeng, R. Identification of a cytochrome P450 CYP6AB60 gene associated with tolerance to multi-plant allelochemicals from a polyphagous caterpillar tobacco cutworm (Spodoptera litura). Pestic. Biochem. Physiol. 2019, 154, 60–66. [Google Scholar] [CrossRef]
  54. Liu, N. Insecticide Resistance in Mosquitoes: Impact, Mechanisms, and Research Directions. Annu. Rev. Èntomol. 2015, 60, 537–559. [Google Scholar] [CrossRef] [PubMed]
  55. Heidel-Fischer, H.M.; Vogel, H. Molecular mechanisms of insect adaptation to plant secondary compounds. Curr. Opin. Insect Sci. 2015, 8, 8–14. [Google Scholar] [CrossRef] [PubMed]
  56. Berenbaum, M.R.; Johnson, R.M. Xenobiotic detoxification pathways in honey bees. Curr. Opin. Insect Sci. 2015, 10, 51–58. [Google Scholar] [CrossRef] [PubMed] [Green Version]
  57. Lu, K.; Song, Y.; Zeng, R. The role of cytochrome P450-mediated detoxification in insect adaptation to xenobiotics. Curr. Opin. Insect Sci. 2020, 43, 103–107. [Google Scholar] [CrossRef]
  58. Qian, L.; Chen, F.; Liu, J.; He, S.; Liu, J.; Li, Z.; Gui, F. Effects of elevated CO2 on life-history traits of three successive generations of Frankliniella occidentalis and F. intonsa on kidney bean, Phaseolus vulgaris. Èntomol. Exp. Appl. 2017, 165, 50–61. [Google Scholar] [CrossRef]
  59. Yin, J.; Sun, Y.; Wu, G.; Ge, F. Effects of elevated CO2 associated with maize on multiple generations of the cotton bollworm, Helicoverpa armigera. Èntomol. Exp. Appl. 2010, 136, 12–20. [Google Scholar] [CrossRef]
  60. Xie, H.; Zhao, L.; Yang, Q.; Wang, Z.; He, K. Direct Effects of Elevated CO2 Levels on the Fitness Performance of Asian Corn Borer (Lepidoptera: Crambidae) for Multigenerations. Environ. Èntomol. 2015, 44, 1250–1257. [Google Scholar] [CrossRef]
Figure 1. Development period (A); larvae weight (B); female fecundity (C) (Mean ± SE) of FAWA and FEWE. Note: Asterisks denote a significant difference between ambient and eCO2 by the independent-sample t-test at p < 0.05.
Insects 13 01029 g001
Figure 2. Length (A,B); root and shoot weight (C); and root-to-shoot ratio (D) of wheat at aCO2 and eCO2. Note: Asterisks denote significant difference between ambient and elevated CO2 by the independent-sample t-test at p < 0.05. WA: wheat that grew at aCO2, WE: wheat that grew at eCO2. The same is true for the following figures.
Insects 13 01029 g002
Figure 3. DEGs in FAWA versus FEWE. A volcano plot of DEGs obtained from different comparative analyses. DEGs upregulated in the FAW are represented by red dots, and those that were downregulated are represented by blue dots; genes with no significant differences in expression are represented in grey.
Insects 13 01029 g003
Figure 4. GO function enrichment analysis. GO enrichment results for DEGs in FAWA versus FEWE. Note: The length of the X-axis column represents the size of the Q value (−log10(Q value)), and the value of the point on the polyline on the upper X is the number of differential genes annotated to the GO term.
Insects 13 01029 g004
Figure 5. Heatmap of differentially expressed genes of FAWA versus FEWE. (A) Heatmap of cytochrome P450 monooxygenase (P450) DEGs. (B) Heatmap of ATP-binding cassette transporter (ABC) DEGs. (C) Heatmap of carboxylesterase (CarE) DEGs. (D) Heatmap of UDP glucosyltransferase (UGT) DEGs. (E) Heatmap of acetylcholinesterase (AchE) DEGs. (F) Heatmap of glutathione S-transferase (GST) DEGs. Note: Heatmaps show the average values of FPKM. The x-axis shows the different treatments (FAWA and FEWE). The colour represents the fold change of DEGs; red indicates upregulation, and blue indicates downregulation.
Insects 13 01029 g005
Figure 6. Quantitative real-time PCR (qRT-PCR) data of selected genes. Sixteen upregulated DEGs were selected for PCR analysis. RPL10-insects and RPL13-JIA were used as reference genes for qRT-PCR normalisation. The mRNA expression levels of the selected genes were calculated using the 2−△△CT method. Note: Asterisks denote significant difference between ambient and elevated CO2 by the independent-sample t-test at p < 0.05, ns indicates insignificant.
Insects 13 01029 g006
Table 1. Toxicity effect of chlorantraniliprole on 4th larvae of the FAW under eCO2 and aCO2.
GenerationTreatmentConcentration Response Regression Equationχ2pLC50 (mg L−1) 95% CI
1stFAWAy = 4.2826 + 0.7447x51.970.00019.19 (1.57−59.67)
FEWEy = 2.6994 + 1.7117x33.900.000122.08 (9.00−64.63)
2ndFAWAy = 3.4718 + 1.5021x40.160.000110.41 (4.25−27.20)
FEWEy = 3.9791 + 0.7667x8.710.033421.45 (13.49−39.63)
3rdFAWAy = 4.2871 + 0.5890x23.200.000116.82 (13.44−51.72)
FEWEy = 3.5639 + 1.0336x7.990.046324.52 (12.96−71.98)
Note: 95% CI, 95% confident intervals; LC50, the concentration of chlorantraniliprole that is lethal to 50% of FAWs. The fall armyworm grown at 400 µL/L CO2 fed with wheat grown at ambient CO2 concentration (400 µL/L, aCO2) was named FAWA, and FAWs grown at 800 µL/L CO2 fed with wheat grown at elevated atmospheric carbon dioxide concentrations (800 µL/L, eCO2) were named FEWE, similarly hereinafter.
Table 2. KEGG pathway enrichment results of DEGs in FAWA versus FEWE.
Pathway IDPathway Namep ValueQ Value
ko00563Glycosylphosphatidylinositol (GPI)-anchor biosynthesis0.0000000010.0000000581
ko00965Betalain biosynthesis0.0000000010.0000000581
ko00950Isoquinoline alkaloid biosynthesis0.0000000160.0000006040
ko00790Folate biosynthesis0.0000157000.0004409770
ko00350Tyrosine metabolism0.0000211000.0004722640
ko03450Non-homologous end-joining0.0000746000.0013931500
ko03420Nucleotide excision repair0.0001697180.0027154880
ko00310Lysine degradation0.0005310000.0074340010
ko00052Galactose metabolism0.0009146000.0113816900
ko00590Arachidonic acid metabolism0.0017038900.0173487000
ko00561Glycerolipid metabolism0.0028042810.0261732900
ko03060Protein export0.0050707930.0436868300
Note: Enriched signalling pathways with Q < 0.05 were considered statistically significant.
Publisher’s Note: MDPI stays neutral with regard to jurisdictional claims in published maps and institutional affiliations.

