Simple Summary
The application of nanotechnology in textiles is limited by the difficulties of loading the fabrics with nanoparticles (NPs) and by their subsequent uncontrolled leakage. More fundamentally, there is a need to answer the question of the “space available” in textile fibers, and generally, other natural polymers for NPs loading. Due to these challenges, there is a risk that uncontrolled leakage of NPs from the textile industry could harm the environment and human health. Here, with a green and straightforward approach, using supercritical carbon dioxide (scCO2) as a carrier fluid, we explored the impregnation in four types of Indian textile silks (Mulberry, Eri, Muga, and Tasar) with five standard sizes of gold NPs (5, 20, 50, 100 and 150 nm). The results suggested that all silks could be permanently impregnated with the gold nanoparticles (Au NPs) up to 150 nm. Knowing the available space in silk or other natural polymers can help us understand how and which natural polymers are suitable for use as catalysts, antimicrobial materials, UV-protective agents, and other valuable properties.
Abstract
How many nanoparticles can we load in a fiber? How much will leak? Underlying is the relatively new question of the “space available” in fibers for nanoparticle loading. Here, using supercritical carbon dioxide (scCO2) as a carrier fluid, we explored the impregnation in four Indian silks (Mulberry, Eri, Muga, and Tasar) with five standard sizes of gold nanoparticles (5, 20, 50, 100 and 150 nm in diameter). All silks could be permanently impregnated with nanoparticles up to 150 nm in size under scCO2 impregnation. Accompanying structural changes indicated that the amorphous silk domains reorganized to accommodate the gold NPs. The mechanism was studied in detail in degummed Mulberry silk fibers (i.e., without the sericin coating) with the 5 nm nanoparticle. The combined effects of concentration, time of impregnation, scCO2 pressure, and temperature showed that only a narrow set of conditions allowed for permanent impregnation without deterioration of the properties of the silk fibers.
1. Introduction
The primary purpose of impregnating nanoparticles (NPs) in fibers is to increase mechanical strength, improve physical properties, such as electrical conductivity and antistatic behavior, and add functionalities, such as antimicrobial, UV protection, flame retardance, and self-cleaning [1,2,3]. If homogeneously distributed, NPs in polymer matrices can increase the composite toughness and abrasive resistance. There are several ways to impregnate/synthesize nanoparticles, and most importantly, stabilize them on or in fibers. Now, standard methods include plasma treatment [4], in situ synthesis [5], sol-gel synthesis, chemical assembly [6], deposition [7], dip-coating [8,9], radiolysis [10], and sonochemical reduction [11].
The methods above have drawbacks, specifically a decrease in the tensile strength of the fibers; the process demands harsh chemical pretreatment, and leakage of nanoparticles occurs with time [12,13]. The severe chemical pretreatment step and leakage of NPs from fibers lead to serious environmental and health issues [12,13,14].
Within this context, the use of supercritical carbon dioxide (scCO2) is an attractive alternative [15,16,17,18,19]. The synthesis/impregnation of NPs on a polymeric substrate under scCO2 has several advantages due to some of its unique properties: low toxicity, non-flammable, inexpensive, low surface tension, and no residue in the treated medium after removal [15,20,21,22,23]. Typically, the exposure of natural and synthetic polymers to scCO2 results in swelling and enhanced chain mobility of the polymers, which helps to load the additives [24,25,26]. Recent examples and applications using scCO2 with dyes [25,27], conductive monomers [28,29], inorganic NPs [30], such as TiO2 [31], Ag [32] into fibers have demonstrated the usefulness of the method [33]. However, the leakage, particle stabilization, and impregnation mechanism were unclear.
In 1995, NPs were synthesized on a polymer substrate for the first time using a supercritical fluid [34,35]. Afterward, substantial research led to the incorporation of metal NPs on various inorganic and organic substrates [20,32,35,36,37,38]. Silk has had a limited application with scCO2. This is mainly within silk fibers dyeing [25,39], grafting [40,41], and controlled drug delivery application [42]. To the best of our knowledge, no report yet of metal/metal-oxide NPs impregnation in silk fibers using scCO2.
Therefore, in the present work, we explored the impregnation in four different types of silks of standardized gold NPs. The choice of gold NPs was motivated by their colloidal stability, monodispersity and low chemical reactivity. For example, a careful evaluation of the plasmon peak of the gold NPs left in solution after impregnation provided a qualitative estimate for their chemical stability. Finally, the choice of size was limited to 150 nm since, at 200 nm, the colloidal stability of the gold NPs was poor.
The combined results demonstrated the usefulness of scCO2 for impregnation and determined that the space available in silks was finite if no structural damage was the limiting factor.
2. Materials and Methods
Gold NPs of different diameters (5, 20, 50, 100, and 150 nm) were purchased from Sigma-Aldrich (Darmstadt, Germany). The NPs were phosphate stabilized and suspended in 0.1 mM phosphate buffer saline (PBS, Sigma-Aldrich, Darmstadt, Germany), having an optical density of 1 (O.D. = 1). At this O.D. the corresponding concentration were 5 nm (69 µg/mL, 3.5 × 10⁻⁷ M), 20 nm (53 µg/mL, 2.7 × 10⁻⁷ M), 50 nm (44 µg/mL, 2.2 × 10⁻⁷ M), 100 nm (38 µg/mL, 1.97 × 10⁻⁷ M) and 150 nm (63 µg/mL, 3.2 10−7 M). Details are in Table S1. The NPs were used without further treatment. Silk yarns from Mulberry (Bombyx mori), Eri (Samia Cynthia ricini), Muga (Antheraea assamensis), and Tasar (Antheraea mylitta) were purchased from Adarsha Traders, Davangere, Karnataka, India. Degummed (soap and sodium carbonate) silk fibers from Mulberry (Bombyx mori) were obtained from an online silk supplier (Wild Fibres, http://www.wildfibres.co.uk, accessed on 1 November 2021).
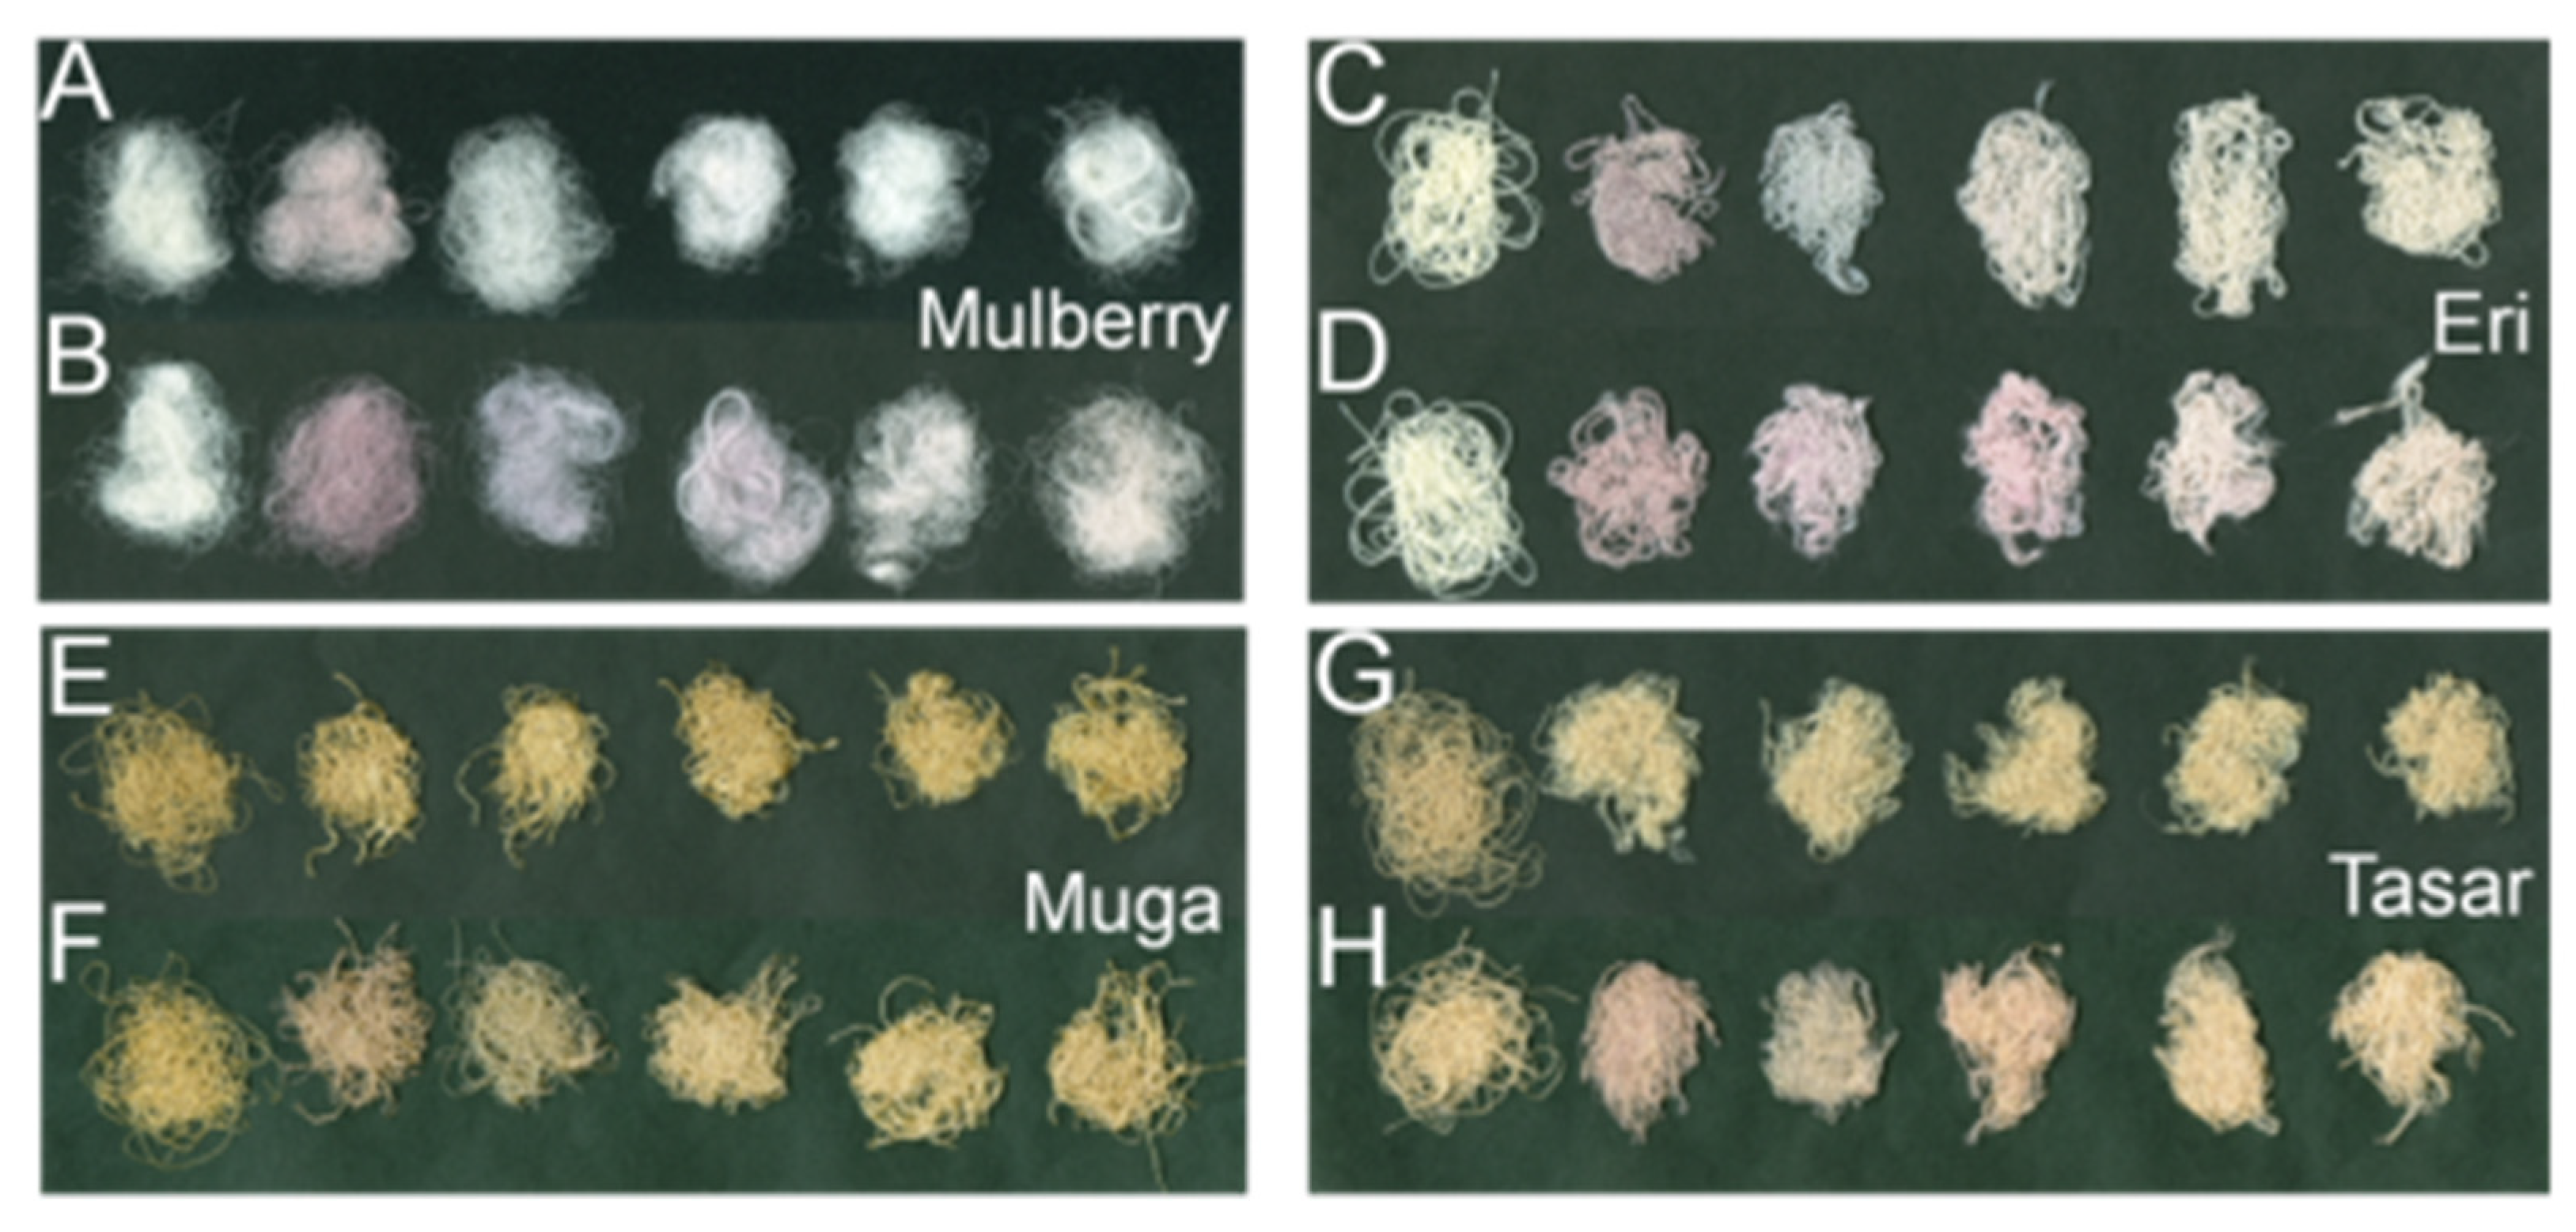
2.1. Preparation of Silks Fibers to Be Impregnated with Gold NPs
A bundle of fibers was weighed (0.051 ± 0.003 g), gently rinsed with 10 mL of double-distilled water twice and dried at room temperature for 12 h on the lab bench. The dry silk fibers were then immersed in 10 mL of reacting solution (9 mL of water and 1 mL of NPs) in a 20 mL glass vial. We used aluminum foil to cover the glass vial and magnetic bars to mix the solutions (see Figure 1). Total loading would yield the following μg of gold per mg of silk 1.4, 1, 0.9, 0.8 and 1.2 for the 5, 20, 50, 100 and 150 nm, respectively.
Figure 1.
Schematic diagram of supercritical CO2 set up. Briefly, when reaching supercritical conditions, the water and gold NPs become a ternary mixture of water/gold NPs/scCO2. The new mixture has enhanced diffusion and interfacial properties allowing the gold NPs to be transported in the fibers.
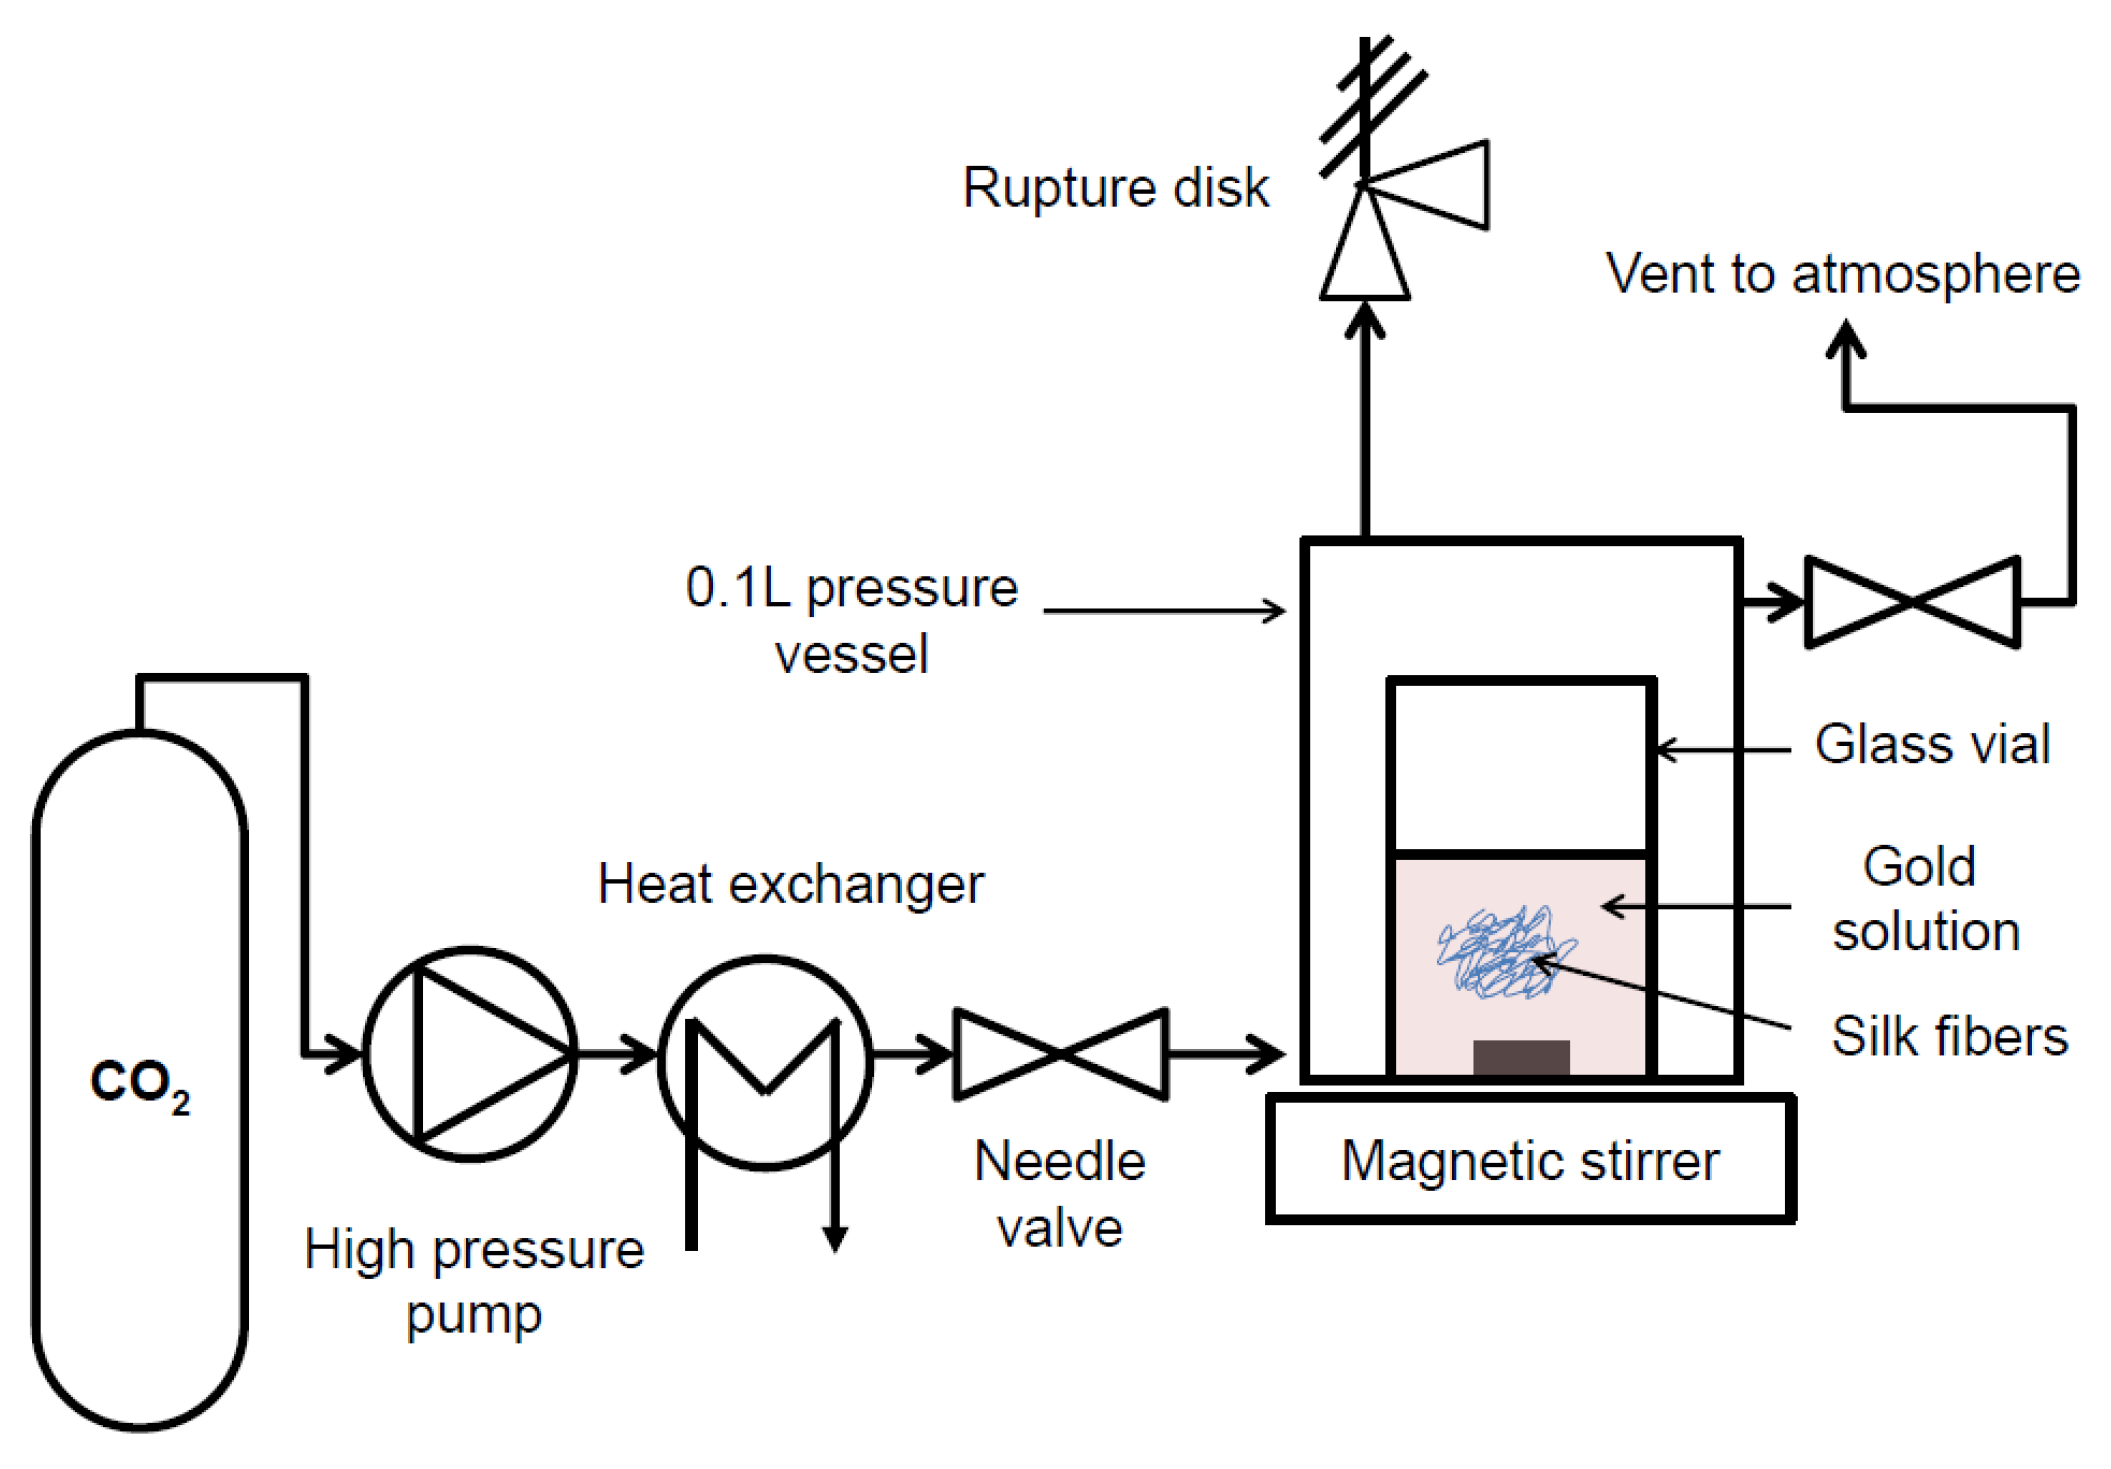
2.2. Impregnation of Silk Fibers under Supercritical and Atmospheric Conditions
The scCO2 impregnation was performed in a modified SFE-100 from Thar Technologies, Inc. (Pittsburg, PA, USA). Figure 1 illustrates the experimental apparatus. Although not intuitive, the CO2 in the supercritical state permeates the whole reactor and mixes with the water/g NPs solution. The new mixture (water/gold NPs/scCO2) has new diffusion and interfacial properties, transporting the gold NPs onto/into the fibers.
The setup consisted of a steel reaction vessel of 100 mL volume immersed in a thermostated water bath (see temperature details in the results section) with a magnetic stirrer.
The glass vial (20 mL) was inside the reaction vessel. The CO2 was pumped in at 11 g per minute to reach the desired pressure. For the impregnation of the four silks, the temperature was kept at 40 °C and the pressure at 200 bars. For the detailed study of the impregnation using the fully degummed Mulberry silk fiber, the final pressure and temperature were adjusted according to the experimental design table (Table 1). The control impregnation happened at atmospheric pressure and at the corresponding temperature and time to match the supercritical conditions. The magnetic agitation speed of impregnation was kept constant at 300 rpm. Each experiment was run in triplicate.
Table 1.
Factorial design parameters.
Note that direct attempts with the NPs resulted in the partial coloration of the fibers, thus incomplete and uneven impregnation (data not shown). Henceforth, the impregnation was carried on in the presence of water. The depressurizing effect was not studied, but the return to atmospheric conditions happened as slowly as the instrument allowed (i.e., 20 min). Another result is the known low pH under CO2 conditions. Immediately after opening the reaction vessel, we found that the pH of the final solution had a pH of 3. Attempts to maintain the pH at 7 using a 1 M phosphate buffer did not significantly differ. Henceforth, the impregnation happened in water.
2.3. Fiber Post-Processing
Washing and fastness test: after the impregnation step, the fibers were recovered for post-processing, namely, washing and fastness treatment successively. The remaining liquid after impregnation was referred to as gold loading. Next, the washing step, the silk fibers, were transferred in a new glass vial and rinsed with 10 mL of water for 1 h. The remaining liquid is referred to as wash leakage. The final step is the fastness test; the silk fibers were transferred to a new glass vial containing 10 mL of water and heated to 50 °C for 1 h. This step is referred to as fastness leakage. The procedure is illustrated in Figure S1 in the Supplementary Information.
The liquid supernatants were measured by UV absorbance, and we calculated the gold loading, wash leakage, fastness leakage, and total efficiency as follows:
where A0 was the absorbance of gold suspension before impregnation, while A1, A2, and A3 were the absorbance of the liquid supernatant after impregnation, water wash, and fastness treatment, respectively, the efficiencies were statistically compared using a general linear model on the arcsine transformed efficiencies (to avoid truncation) with a Tukey posthoc test for multiple comparisons. The analysis was performed using Minitab (Minitab, Inc., Philadelphia, PA, USA).
2.4. Characterization
2.4.1. UV-Visible Absorption Spectroscopy
The UV-Visible (UV-Vis) absorption measurements were performed with a Cary 60 UV-Vis spectrophotometer (Agilent) in the 200–800 nm wavelength range at a scan rate of 600 nm·min−1; and a 1 cm plastic cuvette.
2.4.2. Fourier Transform Infrared Spectroscopy-Attenuated Total Reflectance (FTIR-ATR)
The Fourier transform infrared attenuated total reflectance (FTIR-ATR) spectra of silk fibers were measured at different steps: after the impregnation process (scCO2 or atmospheric conditions), after washing and after fastness test using a Nicolet iS5 infrared spectrometer with an iD5 ATR accessory with diamond crystal (Thermo Scientific). Each spectrum was background corrected and collected between 550–4000 cm−1 (see supporting information Figure S2). Each spectrum was an average of 32 scans at 4 cm−1 resolution. The FTIR-ATR spectra were further processed to extract four structural parameters: the crystallinity degree (see Supplementary Materials Figure S3), the tyrosine ratio (see Supplementary Materials Figure S4), Amide I/II ratio and the hydrogen bond index. The silk fibers degree of crystallinity [43] was calculated by comparing the peaks’ intensities at 1263 and 1230 cm−1 as follows:
A1263 and A1230 are the intensities of the peaks at 1263 and 1230 cm−1, respectively.
The tyrosine ratio was calculated by estimating the area under the tyrosine peaks at ±830 and ±850 cm−1 and computing the ratio of intensities at 850/830 cm−1. The weak features at ±850 and ±830 cm−1 make a doublet attributed to the Fermi resonance of the aromatic side chain of the tyrosine residue. The ratio is indicative of the local environment of tyrosine residues within the fibers and, by extension, the local environment of the amorphous regions of the silks [44].
Further, the ratio of the maximum intensities of Amide I (at around 1640 cm−1) and II (at about 1510 cm−1) peaks was calculated to estimate the total change in secondary structure upon treatment [45,46]. Typically, for silk fibers, the two peaks at ≈1620 cm−1 and ≈1510 cm−1 are mainly assigned to amide I (C=O and C–N) and amide II (N–H and C–N) β-sheet structures. The ratio will measure any changes due to water hydration and β-sheet structures. Additionally, the Amide I region (1600–1700 cm−1) was deconvoluted to extract the secondary structure composition of the silks (see Supplementary Materials Figure S5).
An estimate of hydrogen bond intensity [47] was calculated using the ratio of intensities of N-H vibrations between 3200 cm−1 to 3500 cm−1. In this region, a careful decomposition of the N-H stretching mode provides some information on the “free” (non-hydrogen bonded ±3400 cm−1) and hydrogen-bonded N-H (±3320 cm−1). The hydrogen bond index (HBI) was the ratio of bonded to free N-H intensities.
2.4.3. Scanning Electron Microscopy-Degummed Bombyx Mori
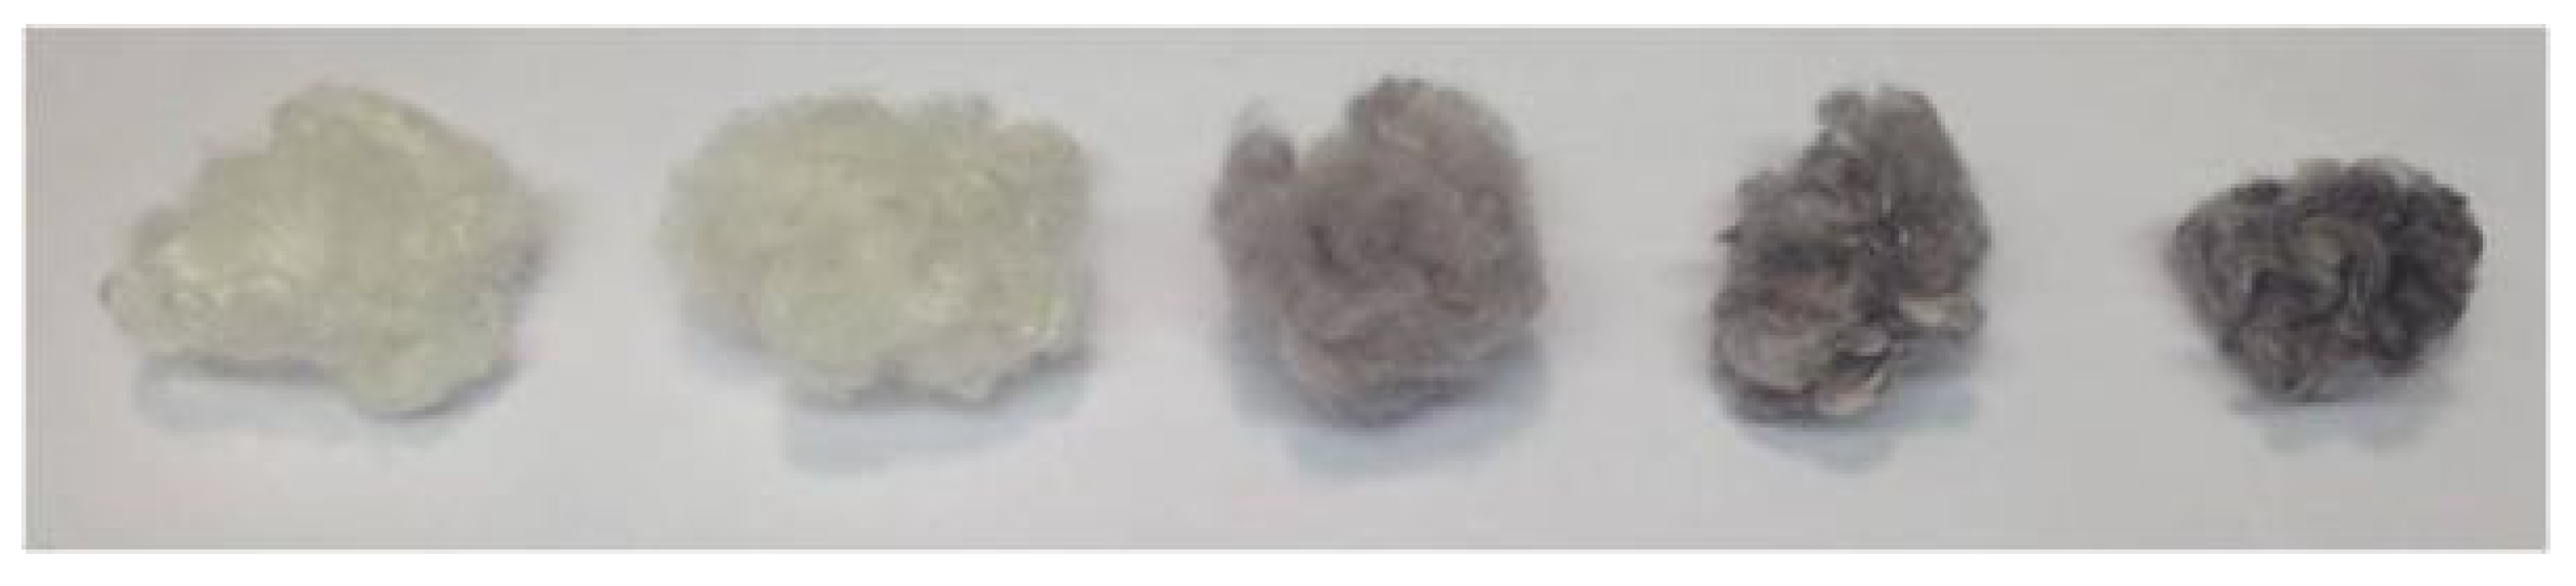
Scanning electron microscopy (SEM) images for degummed Bombyx mori were acquired on a JEOL JSM 6700F. The energy-dispersive X-ray spectroscopy (EDXS) analysis was performed using an Oxford X-MAX add-on. The spectra and images were reduced and analyzed using the Aztec software. Before SEM and EDXS, the fibers were carbon-coated.
2.4.4. Photographs
The silk fibers were captured using HP Scanjet G 4050 against a black background.
2.5. Factorial Design for Degummed Bombyx Mori Study
To test the effects of temperature, pressure, and time we designed a full factorial table. We measured the following responses: total efficiency and FTIR-ATR results (i.e., Amide I/II ratio, crystallinity, and tyrosine ratio). Table 1 summarizes the factorial table parameters. A total of 17 sample conditions were investigated.
3. Results
The four silks chosen are among the most common silks produced in India. Table 2 summarizes their most salient chemical and physical properties [48,49,50].
Table 2.
Silk properties.
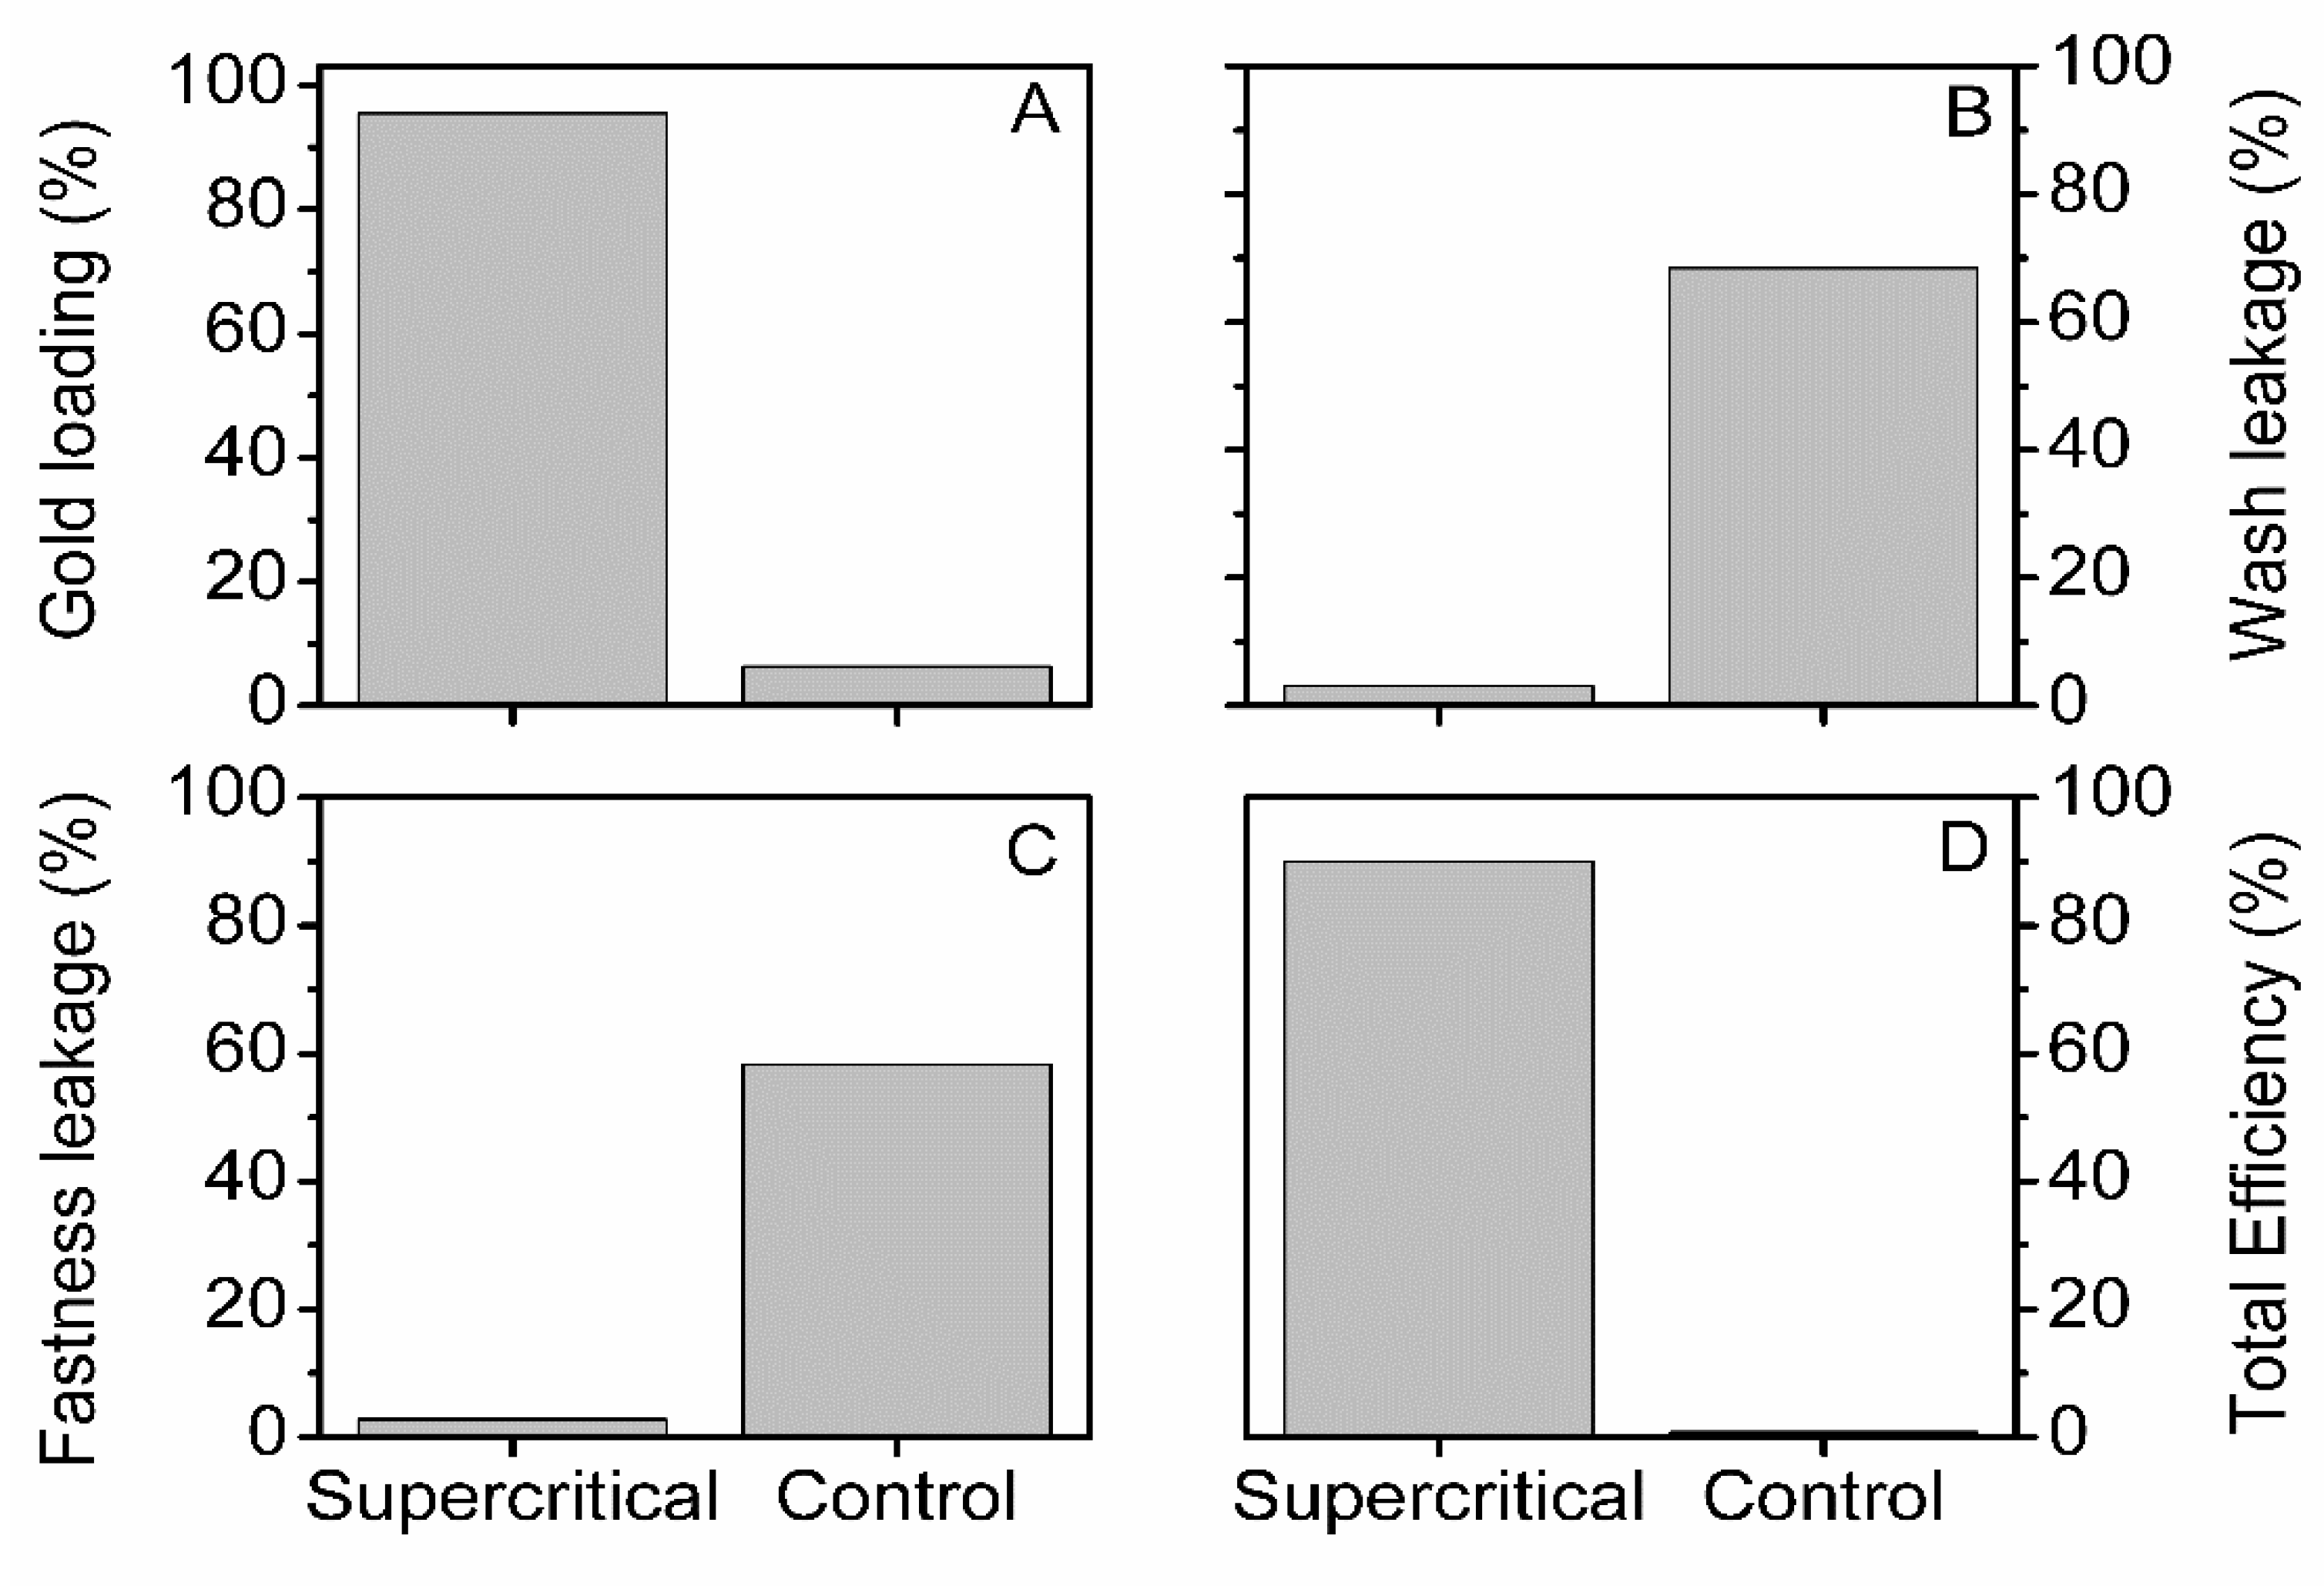
3.1. The Efficiency of the Impregnation Process and Fibers Color Change
After correction for wash leakage and fastness leakage (see materials and methods), the total efficiencies are summarized in Figure 2. The total efficiency of gold loading was above 90% for the scCO2 treated Mulberry silk fiber with gold NPs size 5, 20, 50, 100 nm, except for 150 nm, where the efficiency dropped to 75.9 ± 3.4%. In the controls, at atmospheric pressure, the total efficiency was constant from 5 to 100 nm at 24.0 ± 6.2%; and dropped to approximately 12% for the 150 nm particle sizes.
Figure 2.
Comparison of total efficiency at supercritical and control impregnation of Indian silks: (A) Mulberry (B) Eri (C) Tasar (D) Muga with five different sizes of gold nanoparticle (5, 20, 50, 100 and 150 nm). Black squares (□) are scCO2 samples, red circles (O) are control samples. The control and scCO2 efficiencies were significantly different (N = 30, p < 0, α = 0.05) for Mulberry, Tasar and Muga silks for all gold nanoparticles sizes. For Eri below 100 nm the efficiencies were not significant (N = 30, p5nm = 0.35 p20nm = 0.12 p50nm = 0.09, α = 0.05), above 100 nm the efficiencies were significantly different (N = 30, p < 0, α = 0.05).
For the other three silks, namely: Eri, Tasar, and Muga, the total efficiency of gold loading was above 90% for scCO2 impregnated regardless of the gold NPs’ sizes. For those three silks, the scCO2 treatment efficiencies were significantly larger (see caption Figure 2). However, Eri silks showed exceptionally high efficiency in the controls at 98.3 ± 0.01, 89.6 ± 2.9, and 94.6 ± 0.7% for 5, 20, and 50 nm size nanoparticles, respectively (not significantly different; see caption Figure 2). Beyond, the total efficiency dropped to 77.2 ± 2.1 and 61.9 ± 2.3% for 100 nm and 150 nm NPs (significantly different; see caption Figure 2).
Tasar and Muga, in the controls, showed a total efficiency of about 10% regardless of the size of the NPs. Increasing concentration, three times more gold at 5 nm, resulted in a decrease in total efficiency for all silks except Eri that stayed constant (see Supplementary Materials Figure S6).
Our observations of the total efficiencies for gold NPs in the four silks studies collectively showed an all-or-nothing effect, which meant that the process parameters have little influence. The four silks behaved identically under scCO2 impregnation with no correlation to any of the silk properties shown in Table 2.
The two most remarkable observations were the loss of efficiency for Mulberry after 100 nm. The control sample from Eri silk displayed efficiencies comparable to the scCO2 ones and up to 50 nm gold NP. We found, however, no significant properties of Eri that could explain this behavior. A possibility, therefore, was the sericin coating on each of the fibers. There is considerable variability in the sericin from each silk; even though we applied a pre-wash step before scCO2 impregnation, we cannot fully control the sericin effect. The sericin is the natural target for dying silk fibers and would likely host the gold nanoparticles. The alternative is to remove the sericin and only use the remaining fibroin brins. The difficulty in sericin removal for Eri, Muga, and Tasar meant that only Mulberry silk fiber was further investigated.
Figure 3 shows the color changes in the silks from the gold plasmonic effect. Note that the color change for Muga and Tasar silks was not as evident as Mulberry and Eri since the formers are naturally colored.
Figure 3.
Photographs of the various silks after Gold NPs impregnation. Mulberry: scCO2 (A), control (B); Eri: scCO2 (C), control (D); Muga: scCO2 (E), control (F); and Tasar: scCO2 (G), control (H). The first fiber bundle from the left was the native untreated silk in all photographs. Then the fibers were treated with five different sizes of gold nanoparticles (5, 20, 50, 100, and 150 nm), respectively. The color change correlates with the initial gold solutions’ color.
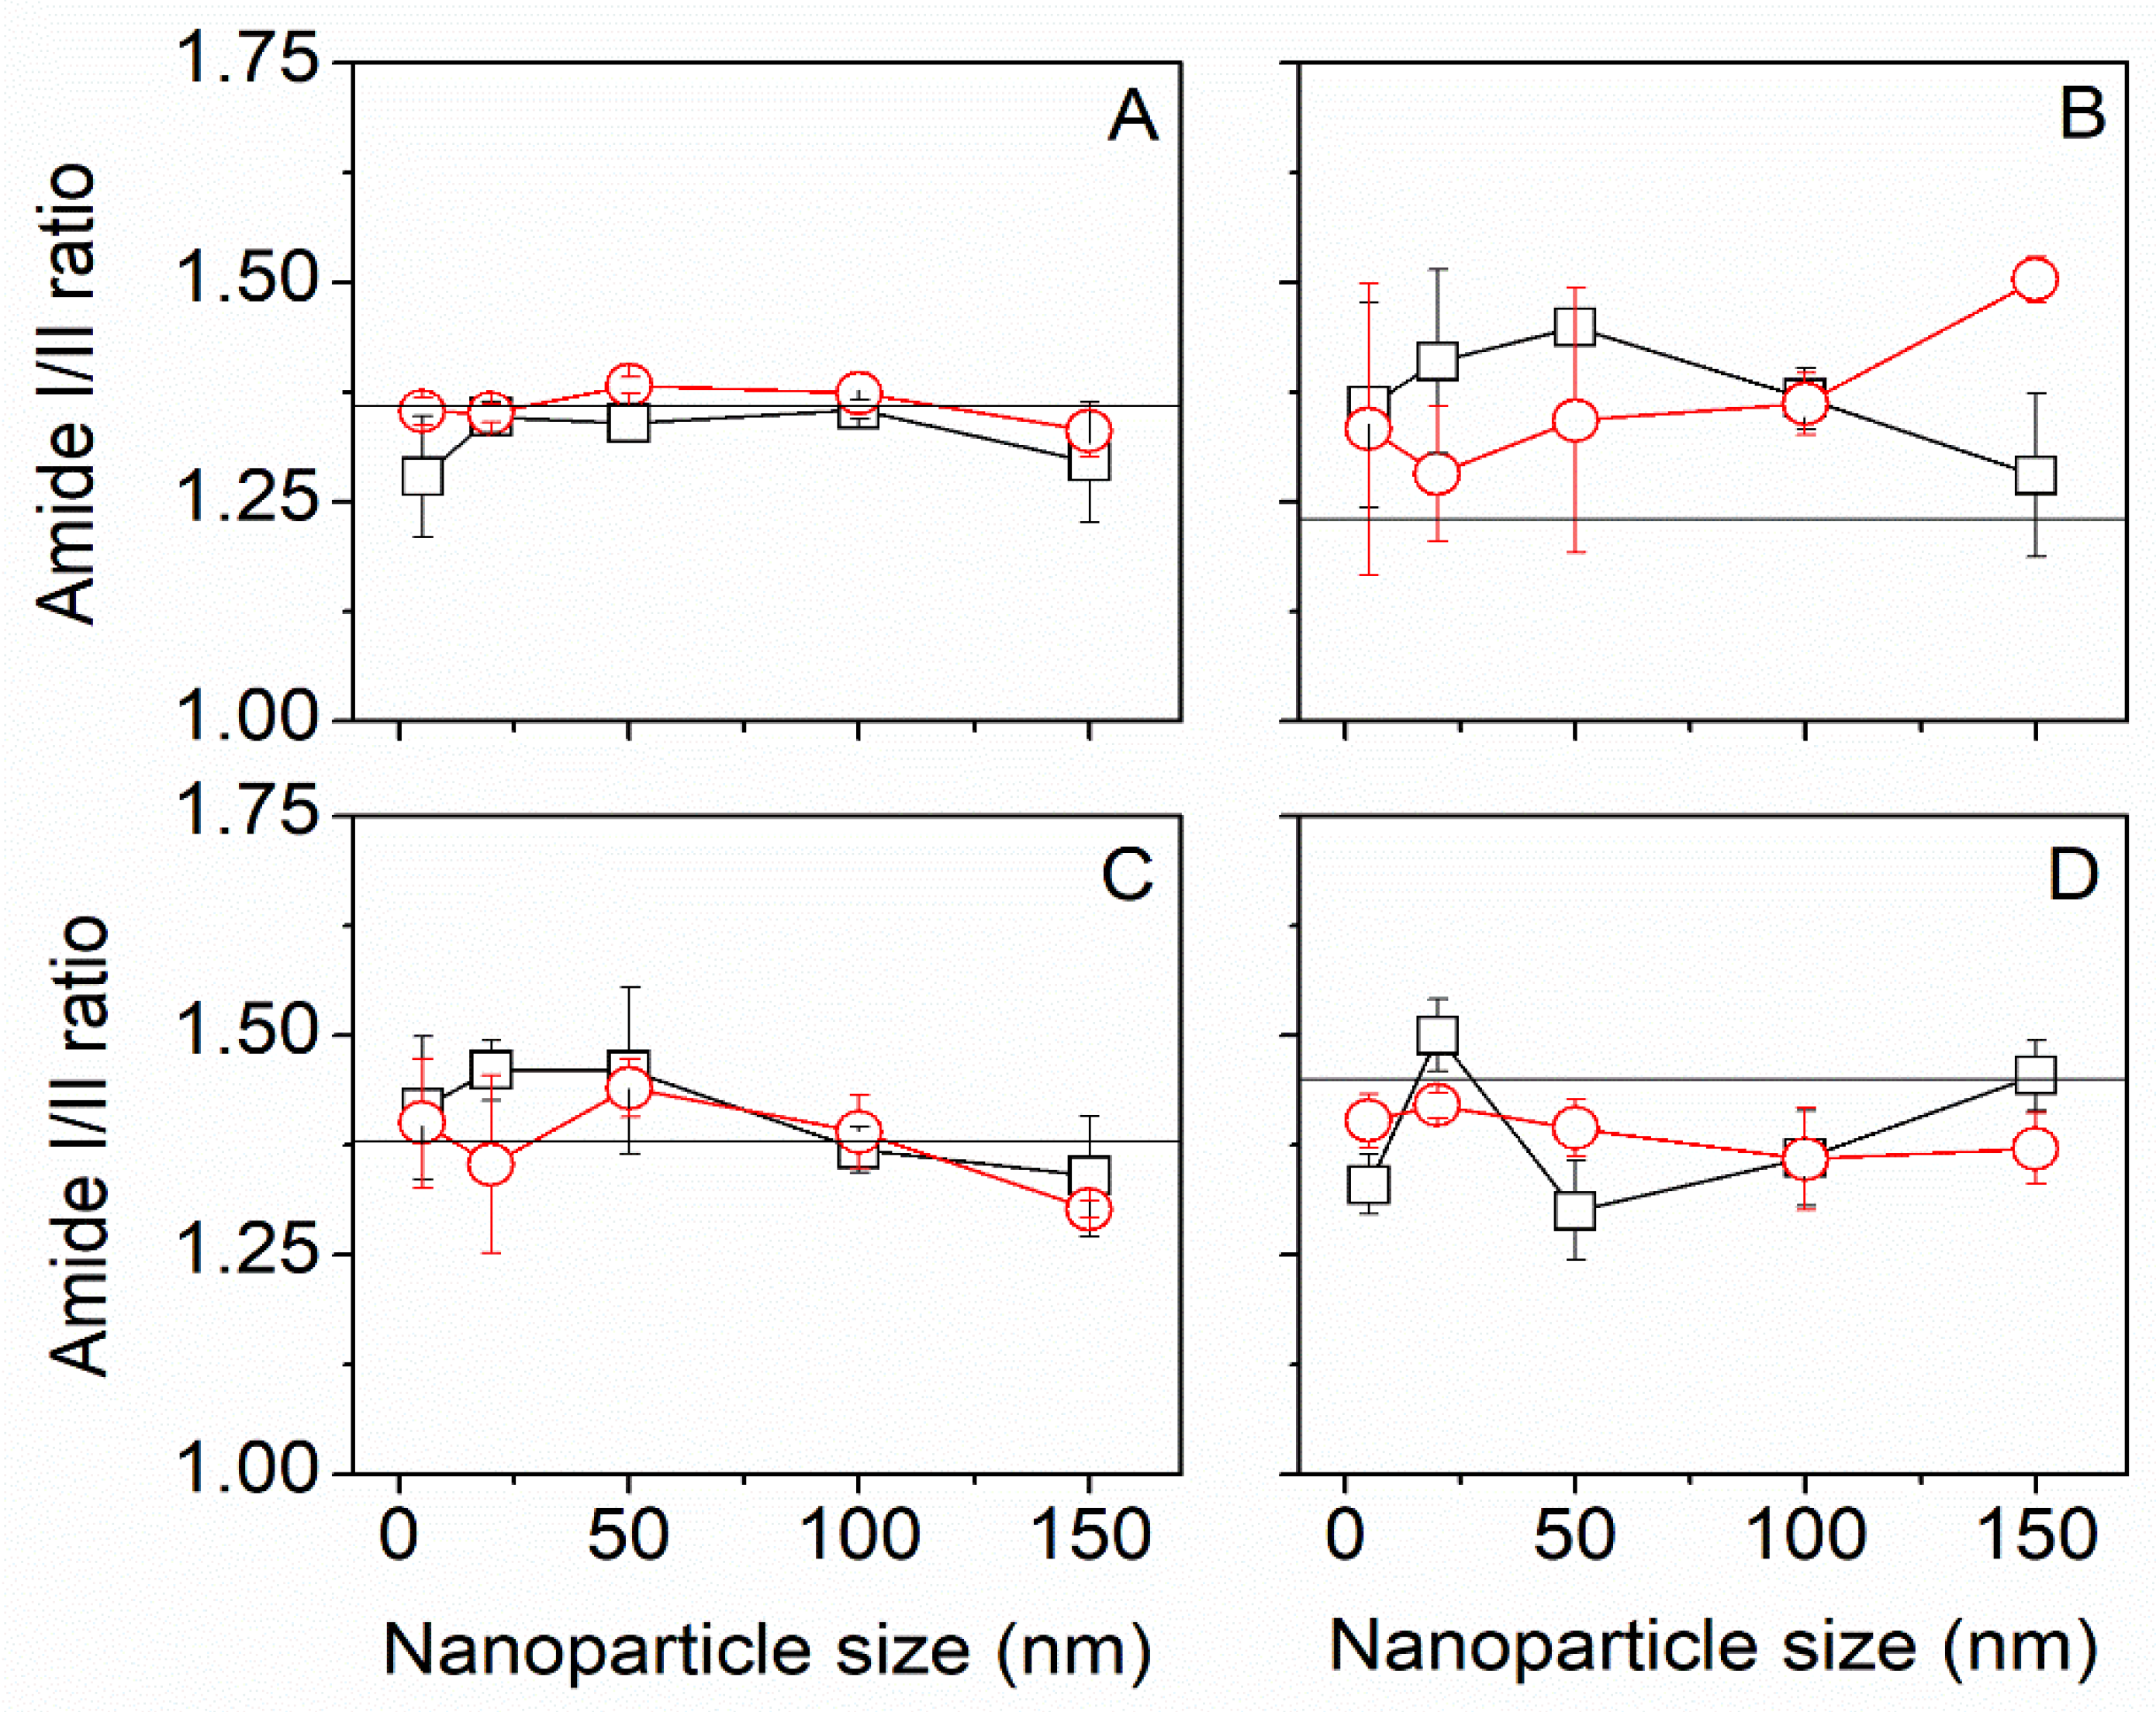
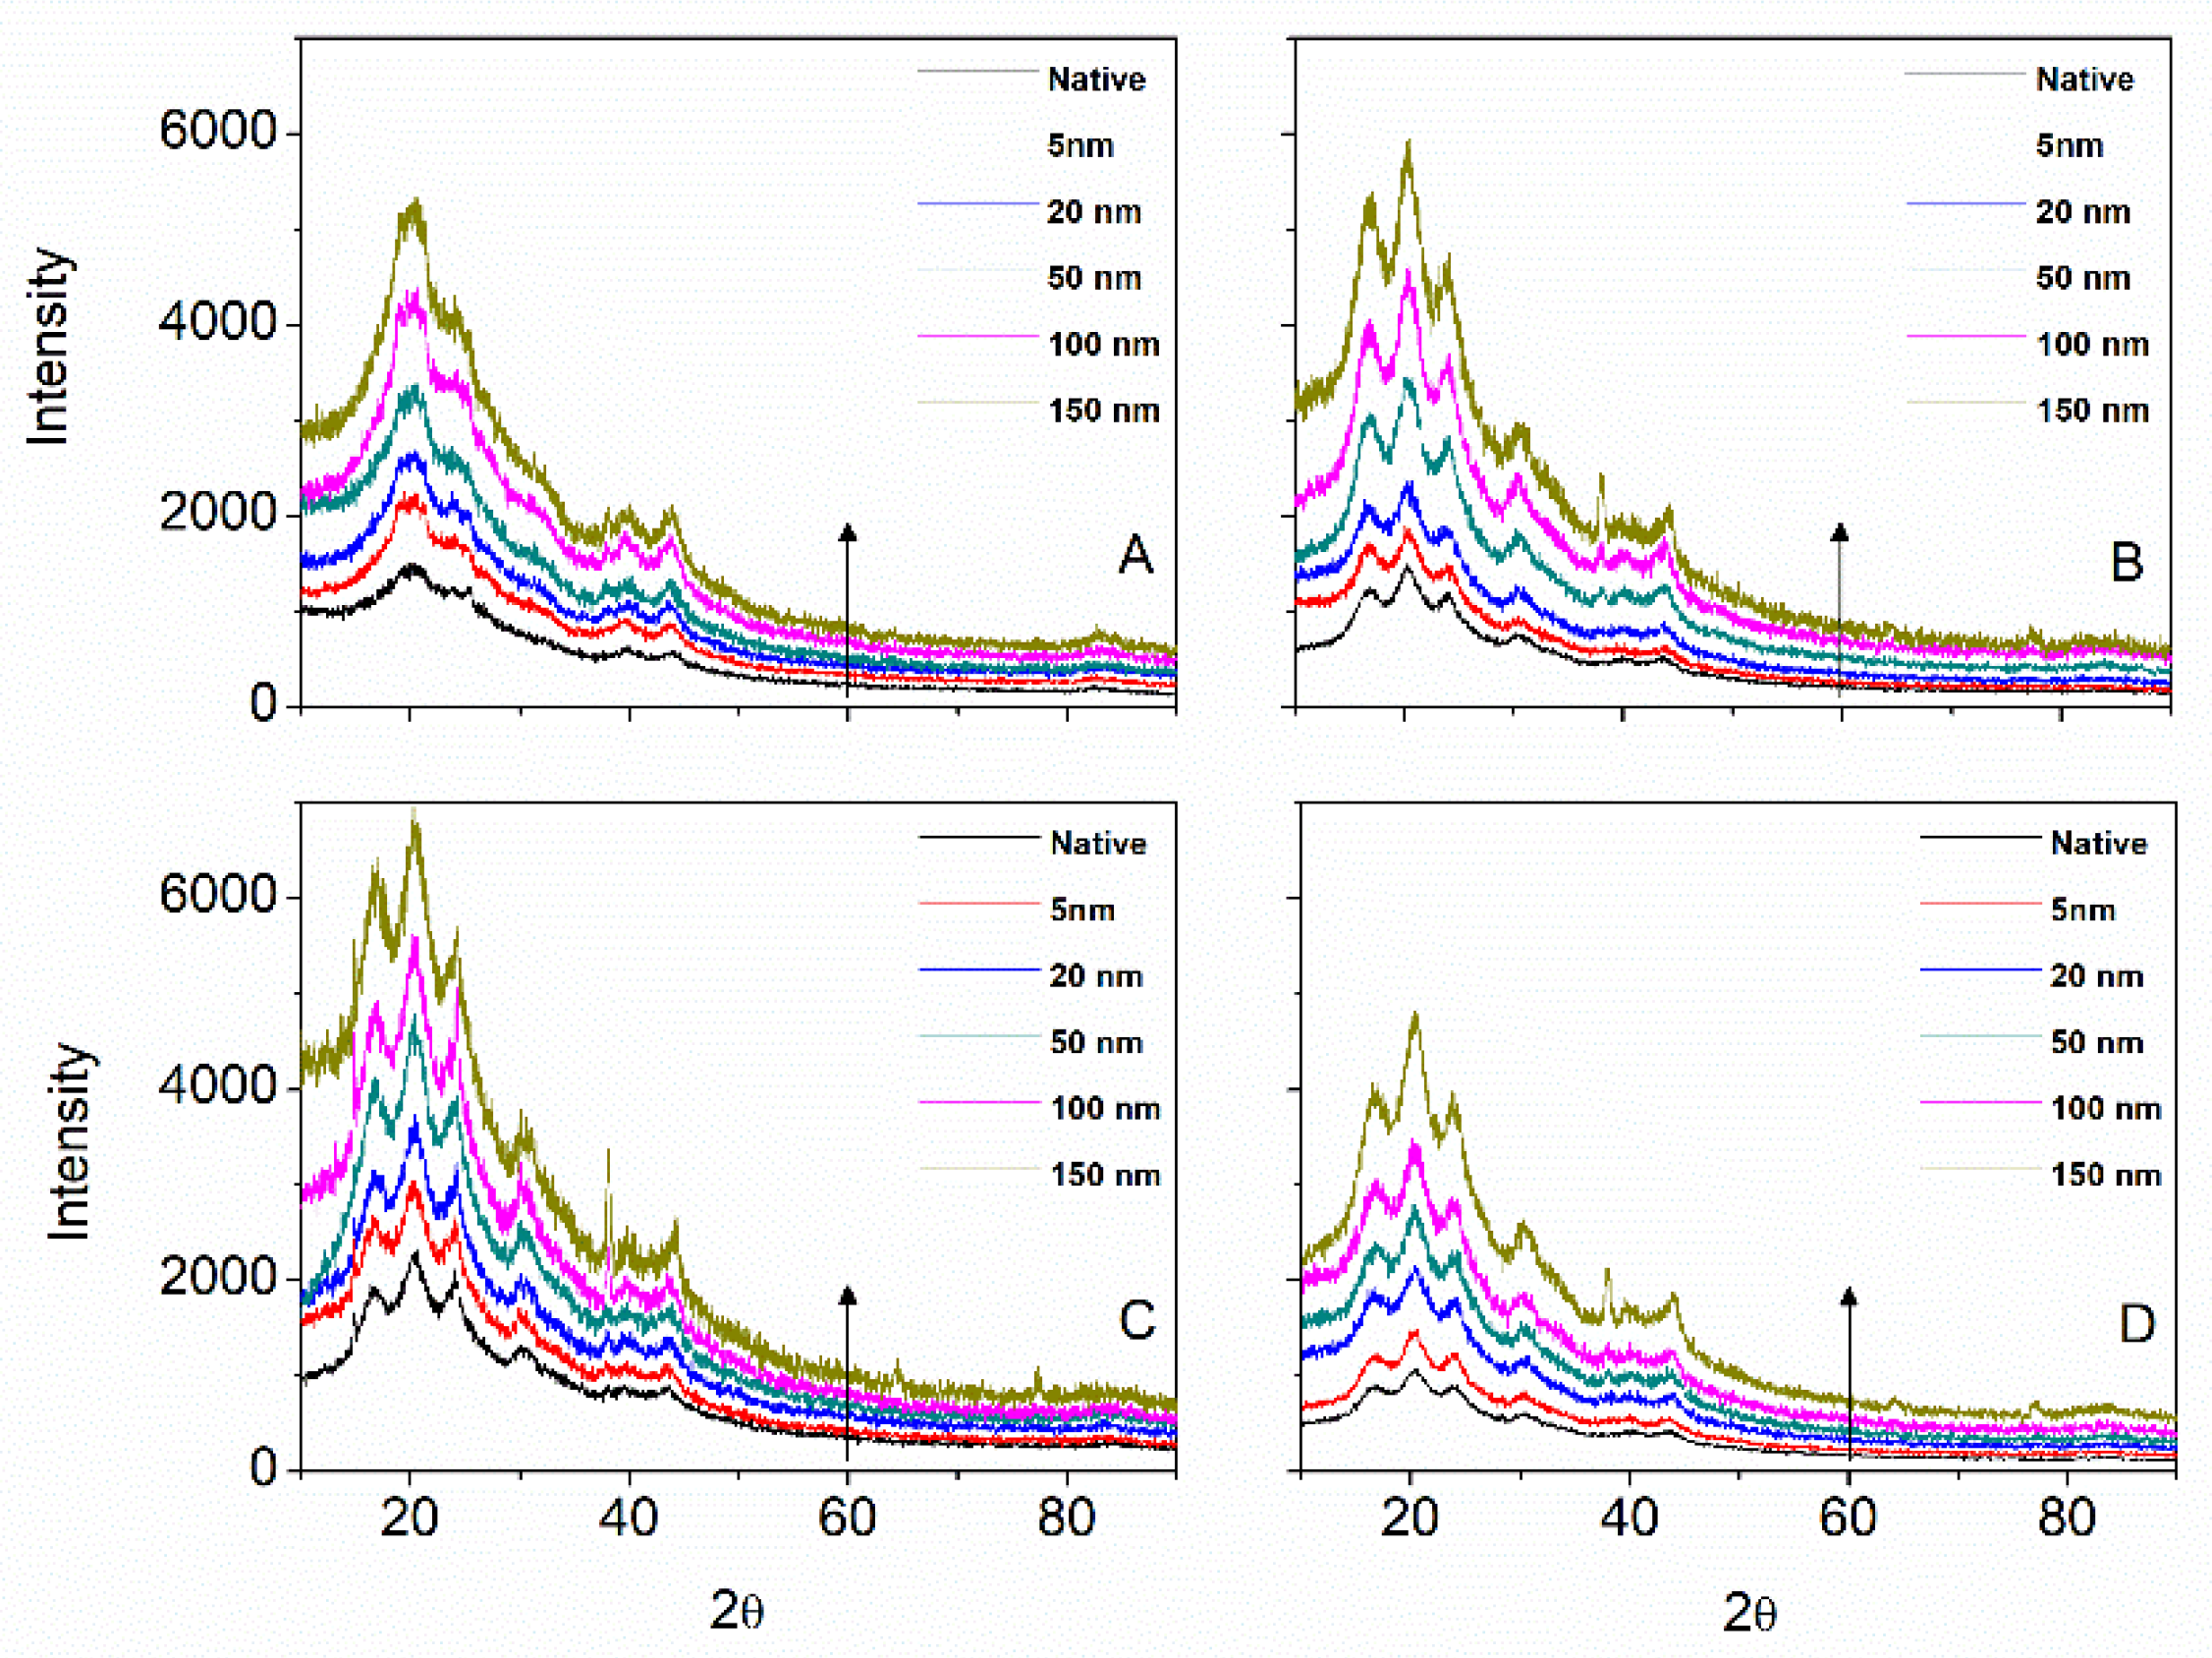
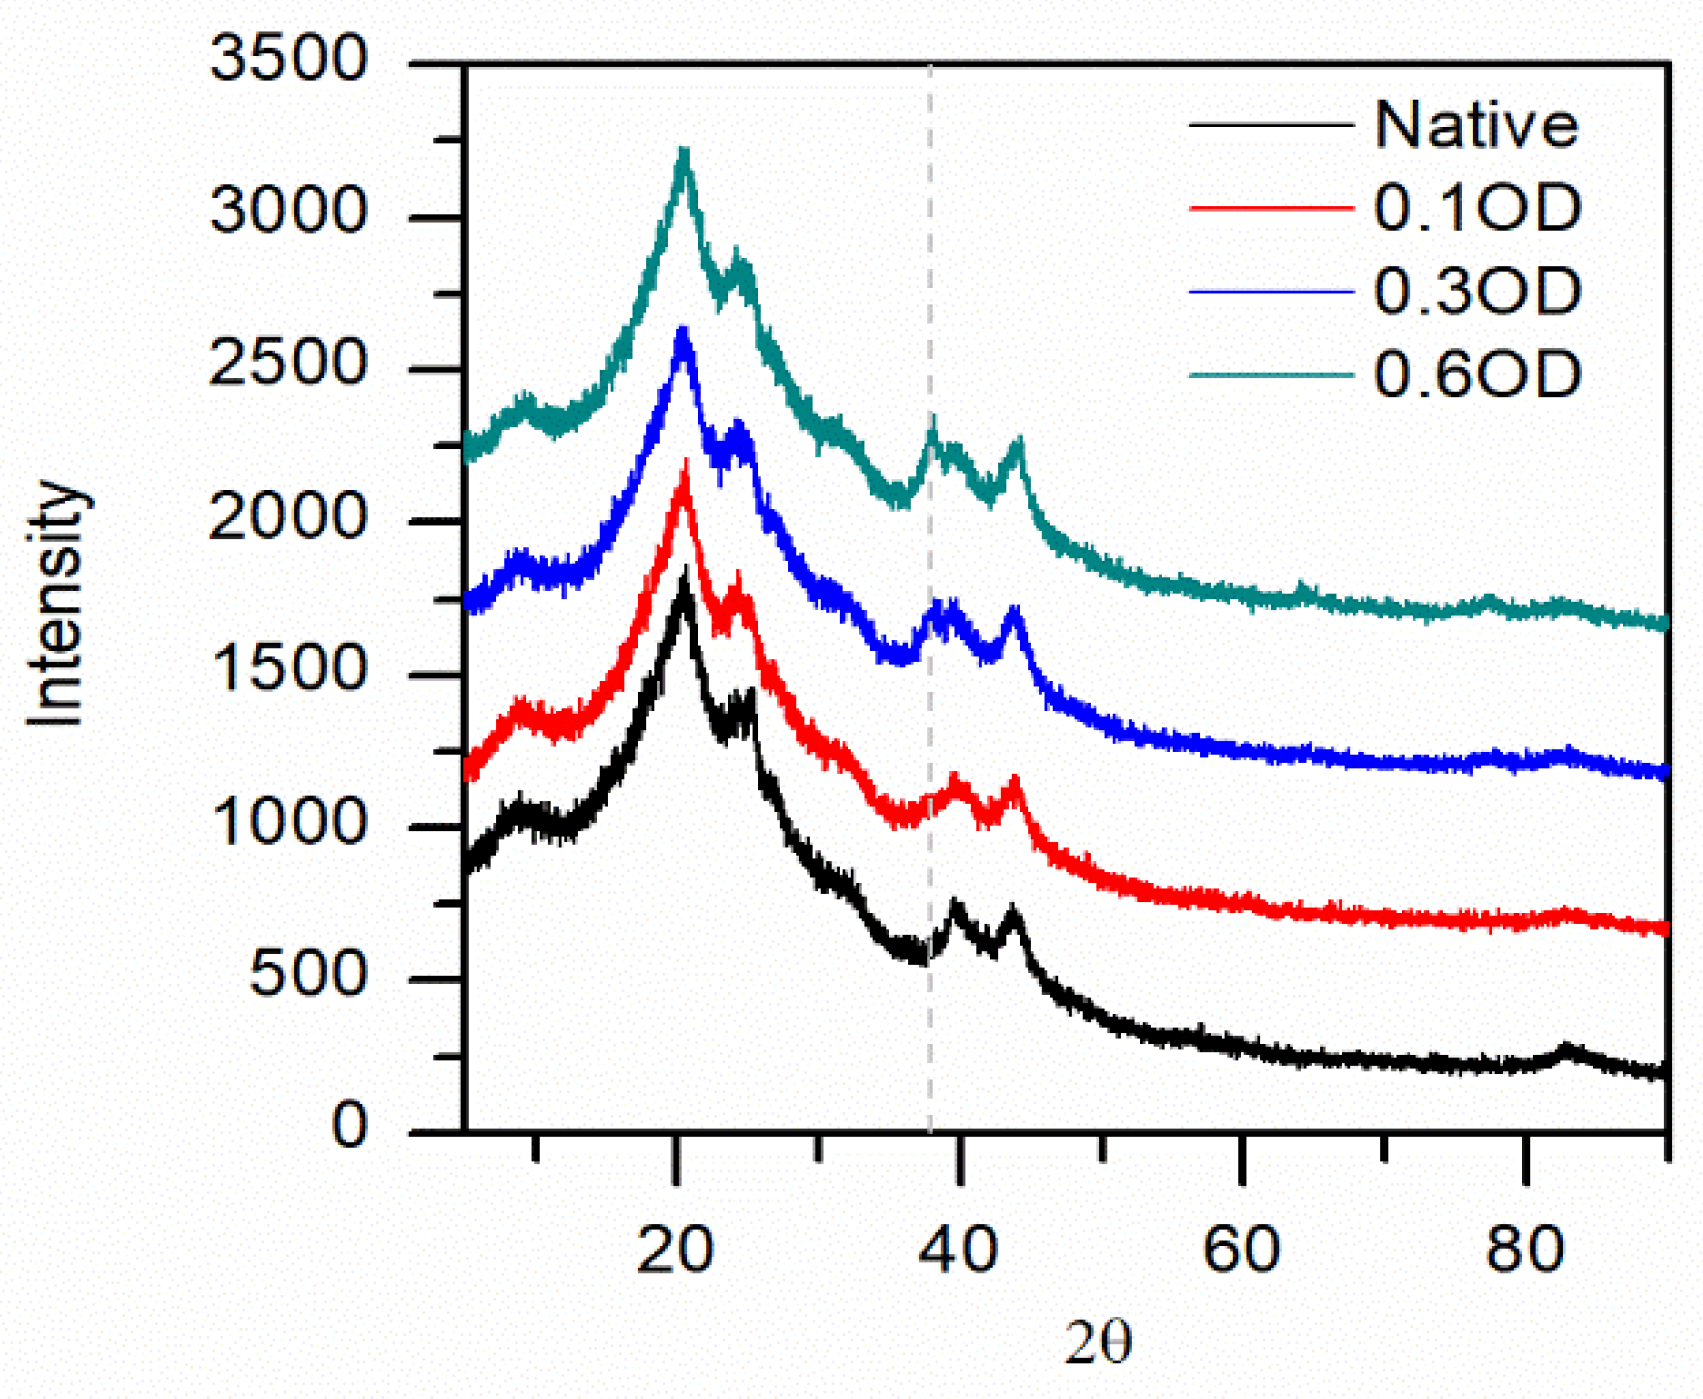
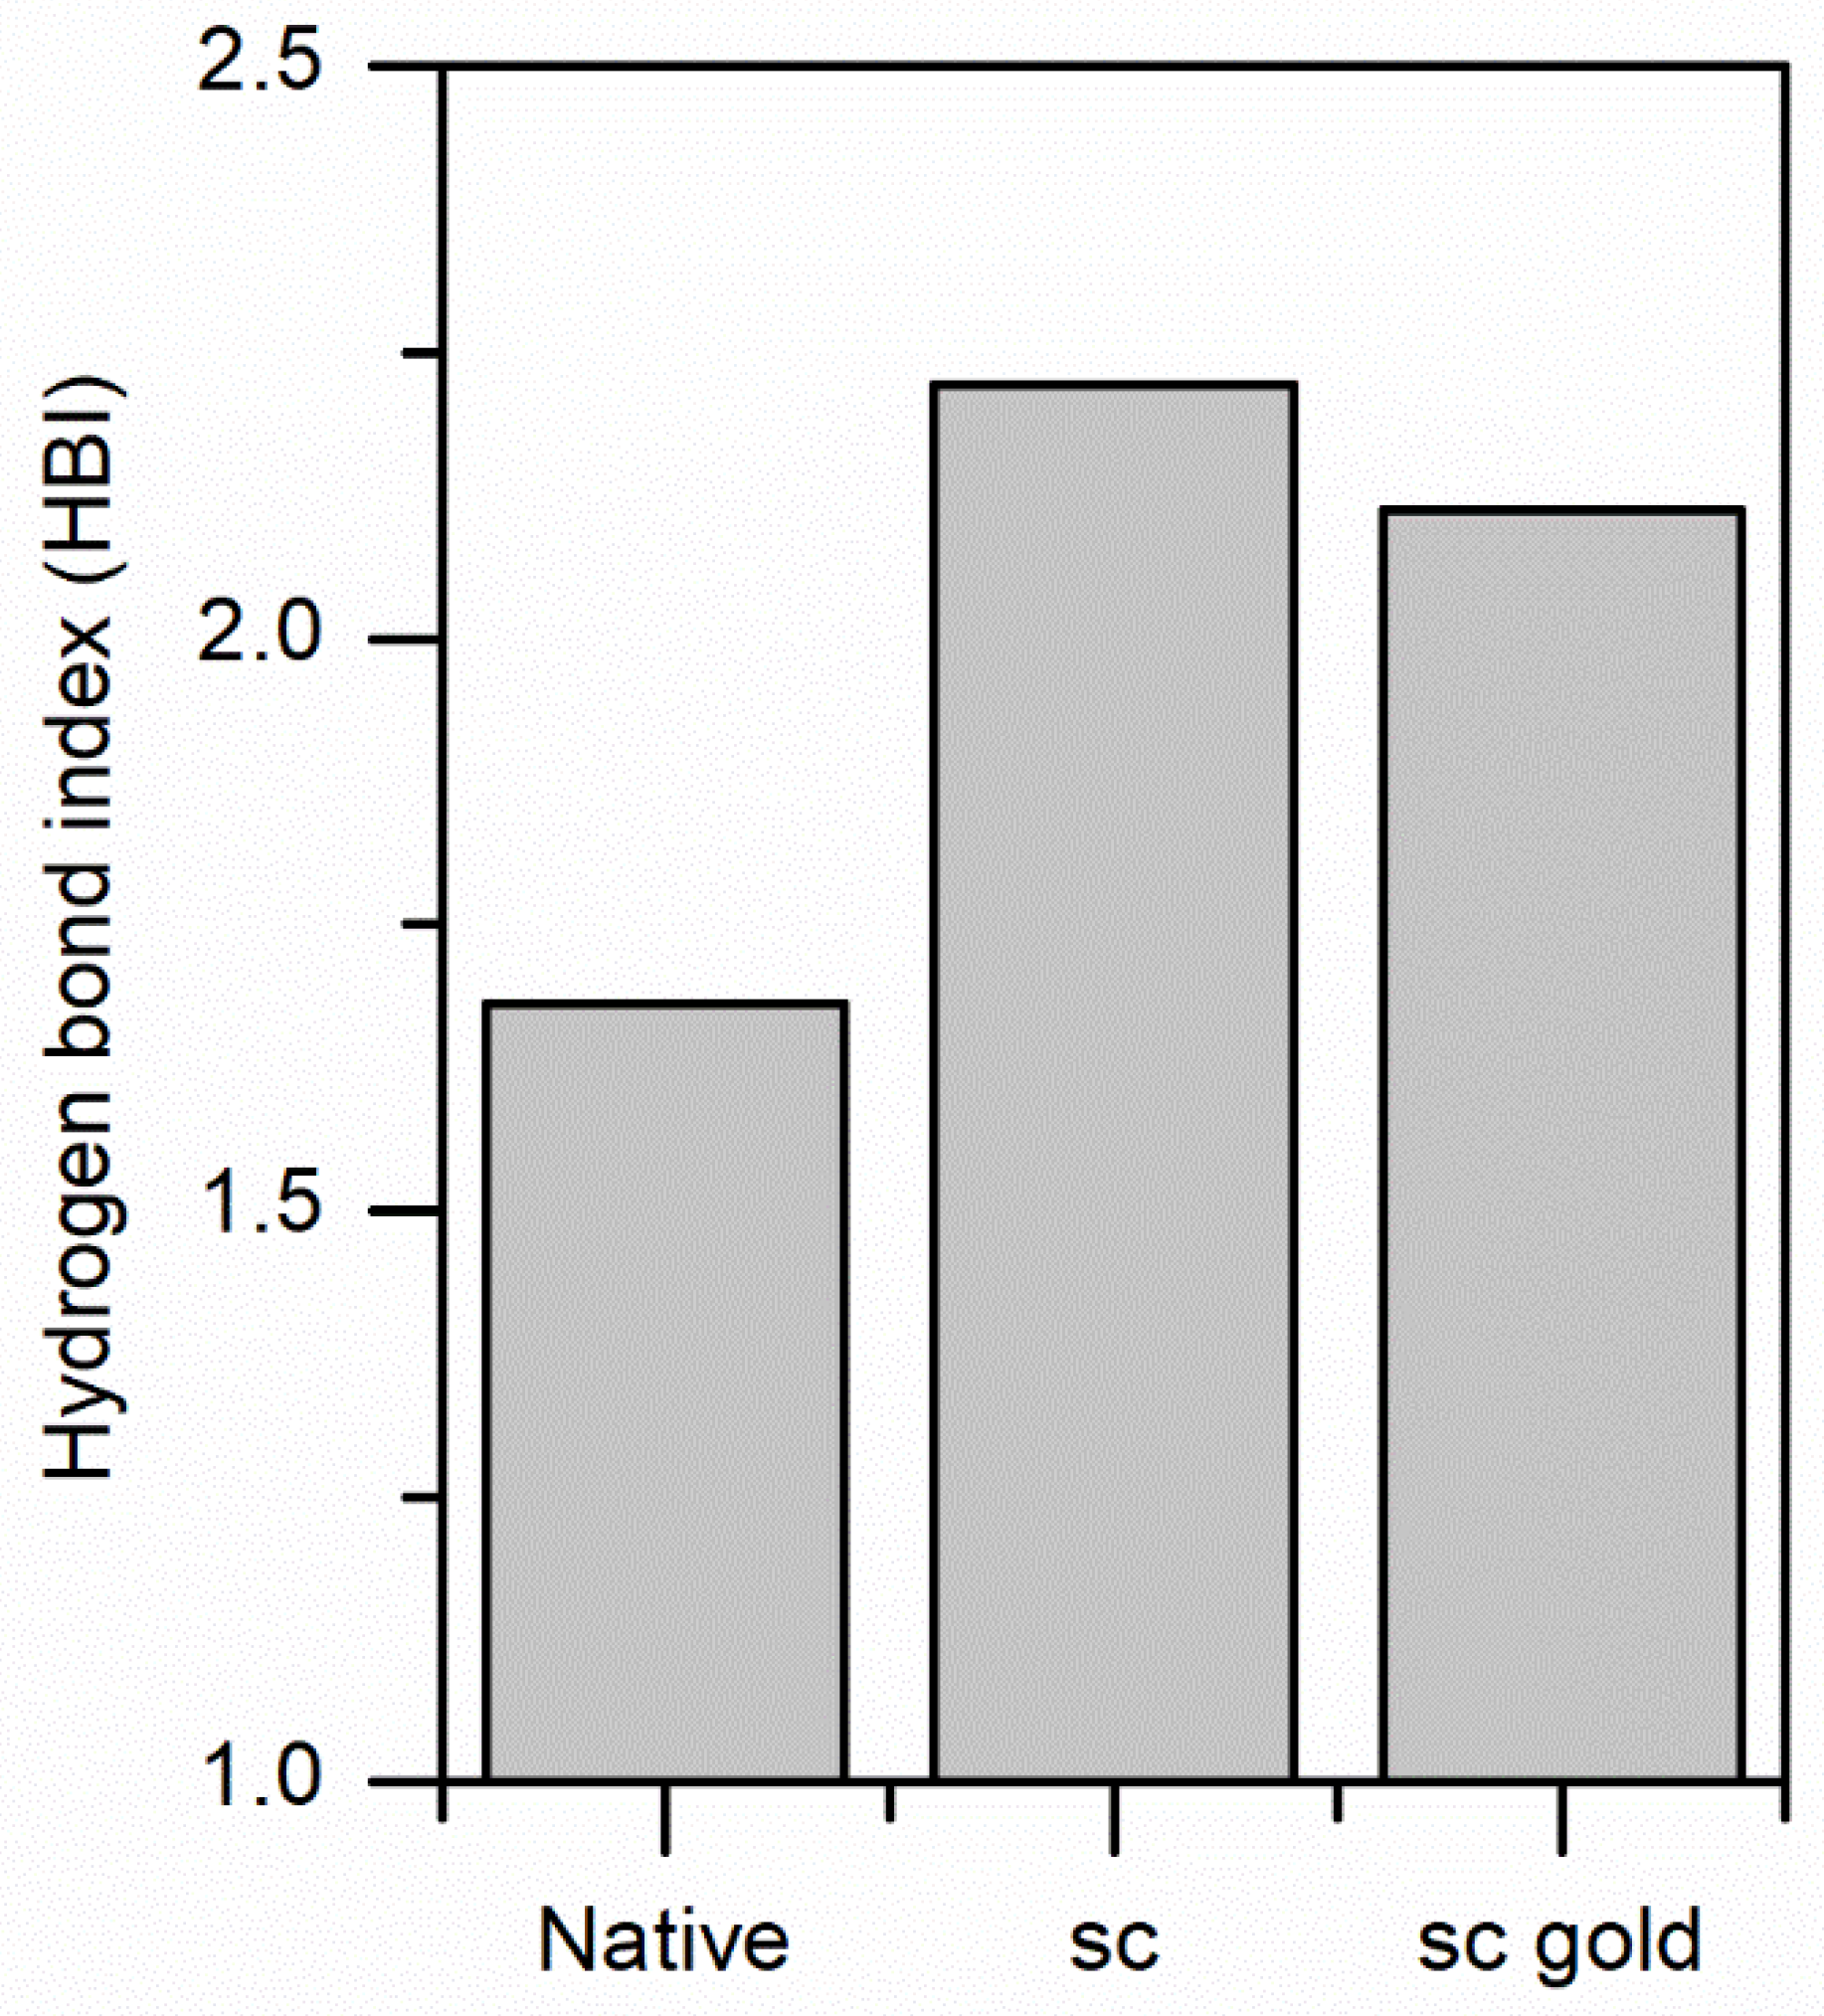
3.2. ScCO2 Impregnation Induced Structural Changes
The evaluation of the impact of the impregnation procedure was principally conducted using FTIR-ATR and XRD. Figure 4 shows the effect of gold NPs size on a global structural parameter: amide I/II ratio. Changes in the amide I/II ratio indicate that a structural change has occurred. For Mulberry silk fiber, we observed no differences between scCO2 treatment and control at different gold NPs sizes. Interestingly both traces overlapped with the Amide I /II ratio of the native silk (horizontal line in Figure 4A).
Figure 4.
FTIR-ATR change in amide I/ II ratio for Mulberry (A), Eri (B), Muga (C), and Tasar (D) silks. Black squares (□) are scCO2 samples, red circles (O) are control samples. The horizontal line is the amide I/II ratio in native silk. We found that for scCO2 treatment alone, the amide I/II ratio was not significantly different from the native silks.
Muga silk behaved similarly. The Tasar silk presented a similar trend to Mulberry and Muga, except that the amide I/II ratio was consistently lower than the native Tasar silk. The Eri silk, on the other hand, the amide I/II ratio showed differences between treatments and departed from the native Eri silk amide I/II ratio.
The Amide I/II ratio changes can be resolved by fitting the Amide I peak with a sum of Gaussian contribution. The position and relative area of the Gaussian peaks were then interpreted in terms of secondary structure content and fraction (Table S2). Four secondary structures were extracted for the four silks, namely, a peak centered at around 1620 cm−1 representing intermolecular β-sheets; a peak centered at 1655 cm−1 representing a mixture of random coils and α-helices; a peak centered at about 1678 cm−1 representing β-turns and a weak peak centered at around 1695 cm−1 representing β-sheets structures (see supporting information Figure S5).
In all silks, the β-sheets content appeared constant regardless of the impregnated gold NPs (see Supplementary Materials Figure S7). In Mulberry only, we found an inter-conversion from the random coil/α-helical structures to β-turns with increasing gold NP sizes (see Supplementary Materials Figure S7). Noteworthy is the overlapping signal from water in the Amide I region that may bias the decomposition of secondary structures. For example, scCO2 drying followed by washing and high-temperature treatment may affect the water signal contribution in the Amide I differently. Additionally, the contribution of the sericin coating may not be constant throughout the process. These, among others, were the reason for the next section study with the degummed silk.
Besides, we found that the crystallinity index (similar to the β-sheets structure content) did vary marginally from the native silks’ crystallinity, only for Eri, Muga, and Tasar. In Eri, the crystallinity index from the gold impregnated silks was higher than the native Eri fibers but similar to the controls. For Muga and Tasar, we observed the opposite trend, a lower crystallinity (see Supplementary Materials Figure S8). The crystallinity index was independent of the gold NP size in all fibers.
The relative intensity of the tyrosine doublet (Intensity at 850 cm−1/Intensity at 830 cm−1) was used as a spectral marker of the environment of the hydroxyl groups and the strength of hydrogen bonds involving these groups. The tyrosine residues usually exist in the amorphous regions, containing most amino acids with bulky and polar side chains. An increase in the tyrosine ratio led to the conclusion that the hydrogen bonds involving the tyrosine residues were weak, and consequently, the mobility of the tyrosine residues was higher [44].
For Mulberry, Muga, and Tasar, we found that the tyrosine ratio was constant and closed to the value from the respective native silks (see Supplementary Materials Figure S9). On the other hand, Eri silk showed a constant tyrosine ratio with increasing gold NP size. Still, a systematically lower ratio than native Eri silk, suggesting the amorphous region in Eri was stiffer after the treatment.
The XRD confirmed the gold NPs with an increasing diffraction peak at 38° (Figure 5). The silks diffraction peaks were conserved regardless of the gold NP size used. No further attempt at analyzing the XRD was deemed necessary.
Figure 5.
X-ray diffractogram as a function of gold NP size for Mulberry (A), Eri (B), Muga (C), and Tasar (D) silks. The arrow indicates an increasing gold NP size. Note at around 37° the (111) reflection for the gold.
In the next section, we focus only on the Mulberry silk fiber and the 5 nm gold NP to unravel the processes underlying the gold impregnation capacity of silk fibers.
3.3. Effect of Degumming on Bombyx Mori and 5 nm Gold NPs
3.3.1. Facile Gold Impregnation in Supercritical Carbon Dioxide at 40 °C and 200 Bars
The supercritical treatment of silk fibers resulted in a high gold loading (95.5%—Figure 6A), while the control treatment yielded a poor gold loading (6.3%—Figure 6A). The high percentage of wash leakage (68.4%—Figure 6B) and fastness leakage (58.3%—Figure 6C) for the control silk suggested that the gold NPs were weakly attached to the surface of silk fibers.
Figure 6.
Comparative gold loading (%)—(A), wash leakage (%)—(B), fastness leakage (%)—(C), and total efficiency (%)—(D), for supercritical impregnated and control degummed silk fibers. See the materials and methods for details.
The scCO2 impregnated silk was, on the other hand, in sharp contrast with the control. We found a low percentage of wash leakage (3.0%—Figure 6B) and fastness leakage (2.8%—Figure 6C), thus a small amount of weakly attached gold NPs to silk fibers. The substantial difference in the total efficiency of scCO2 and control-treated silk fibers stressed the effectiveness of the former over the latter (Figure 6D).
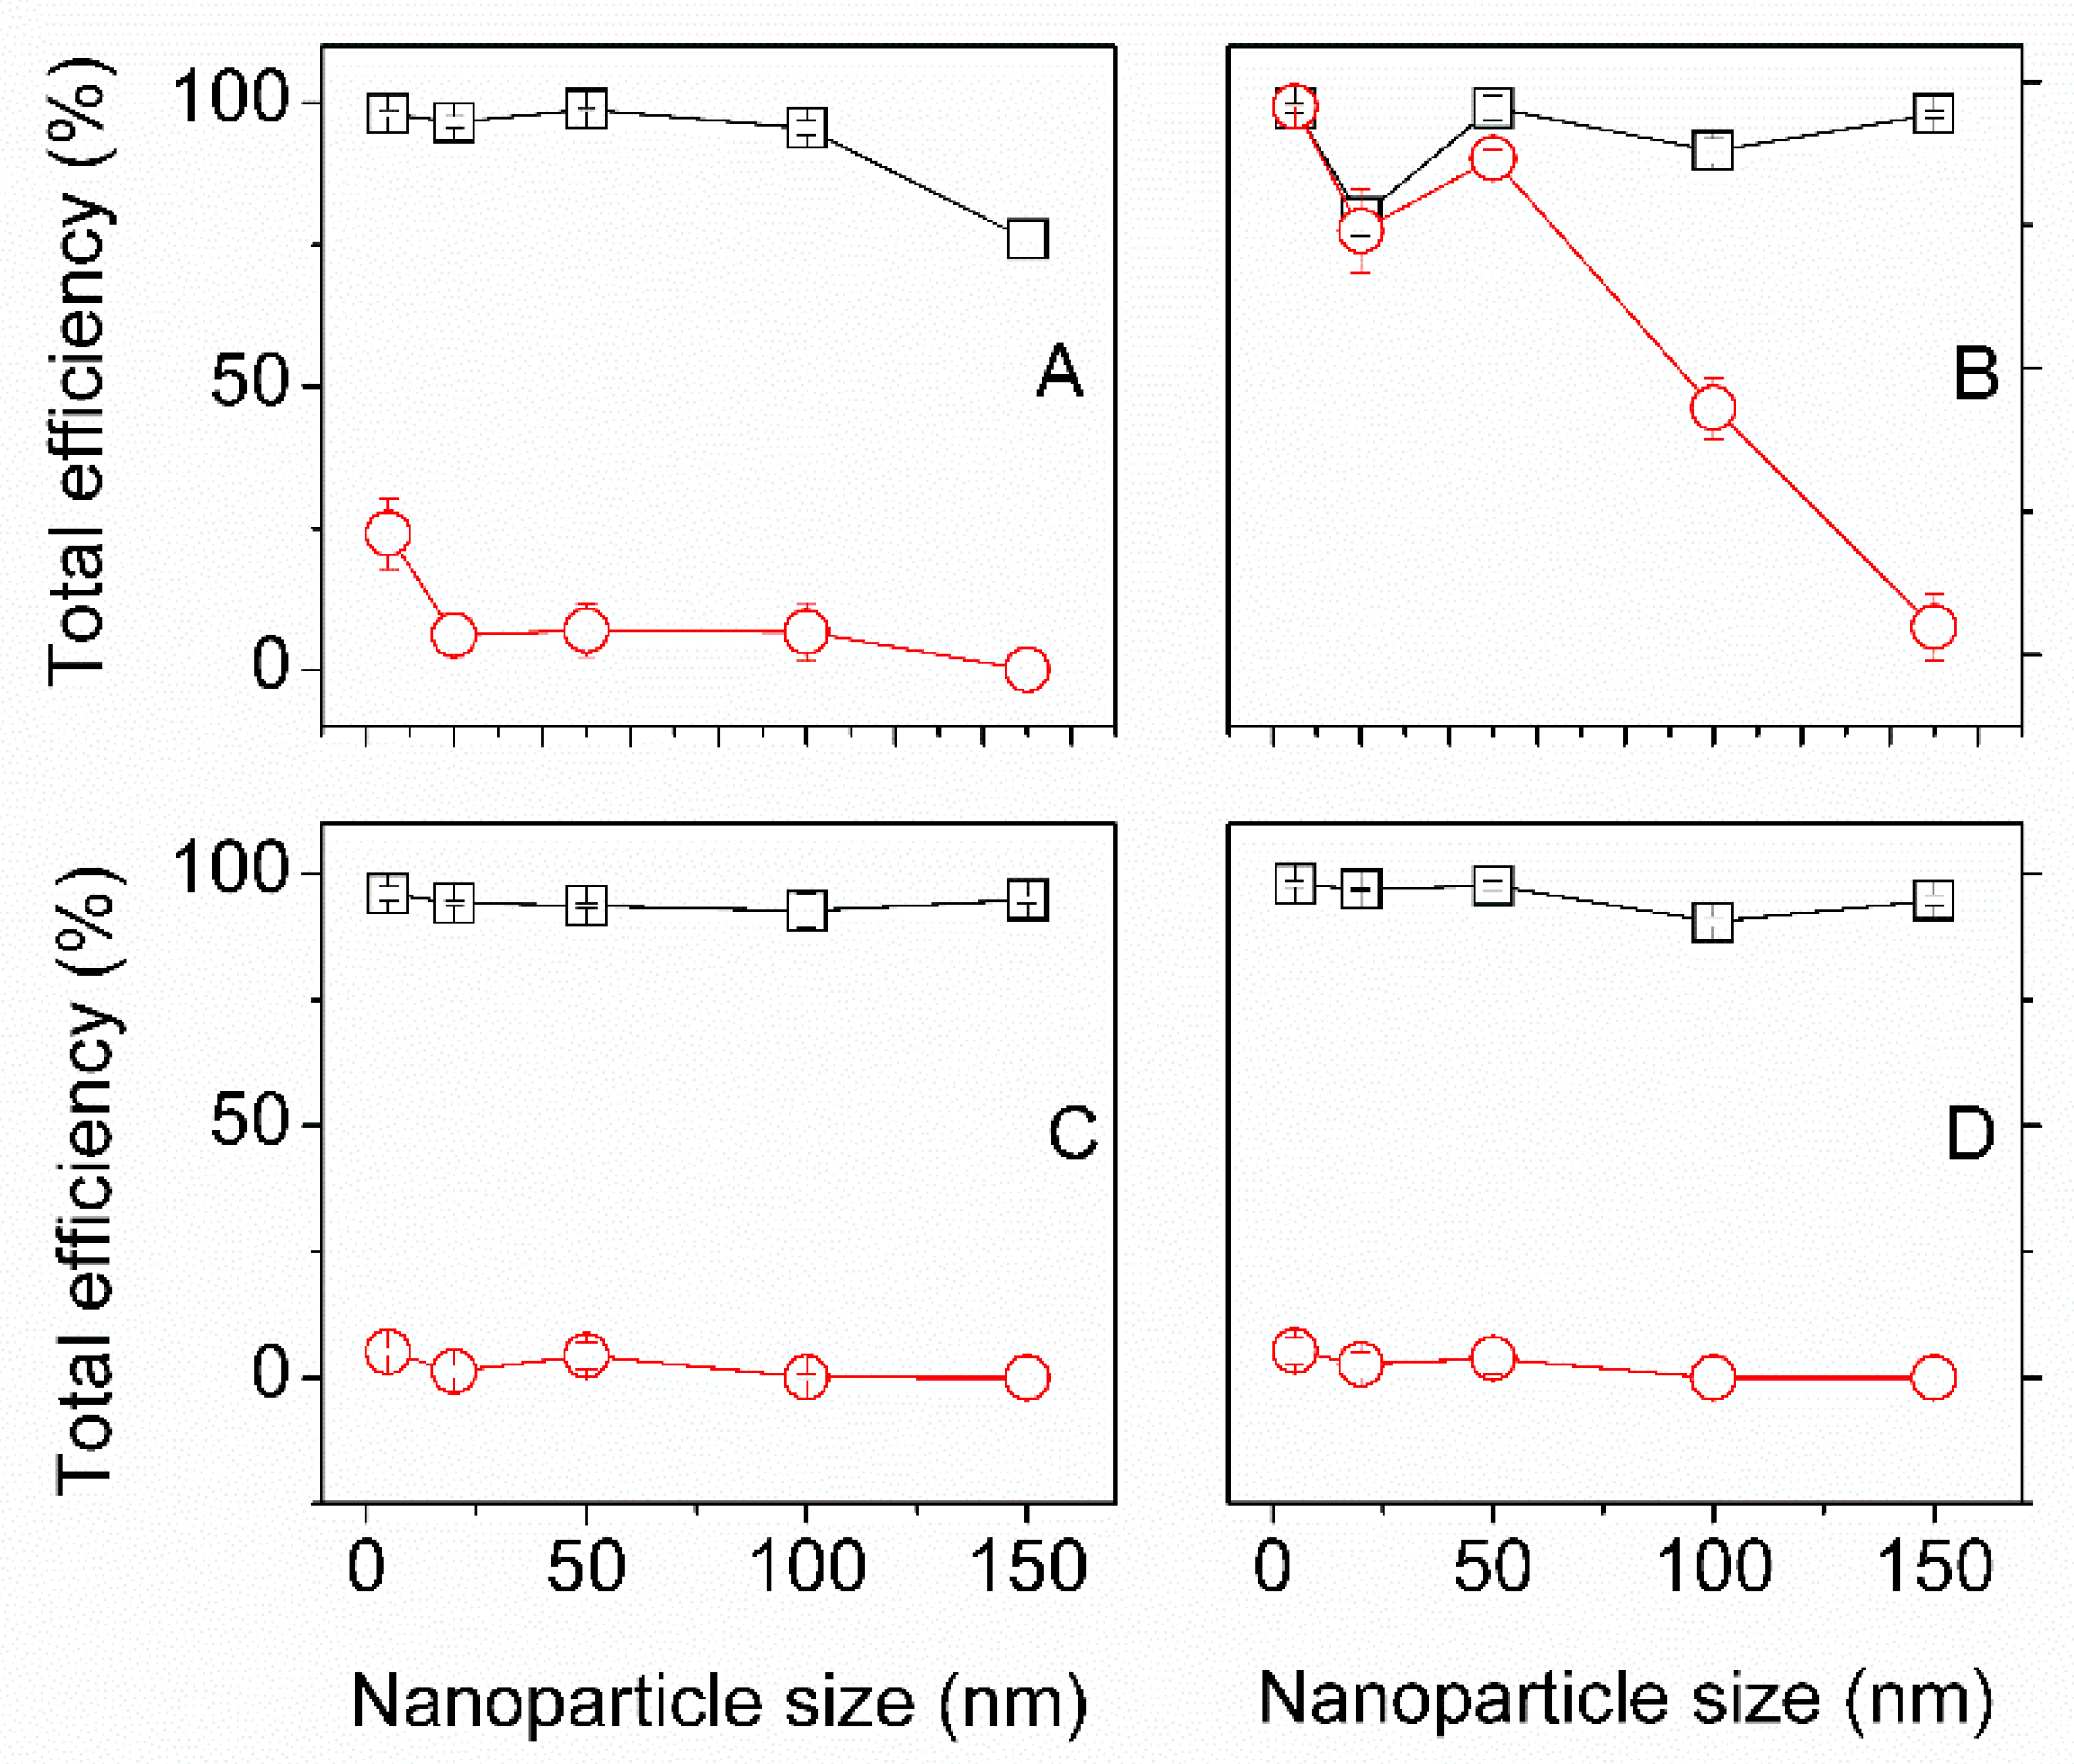
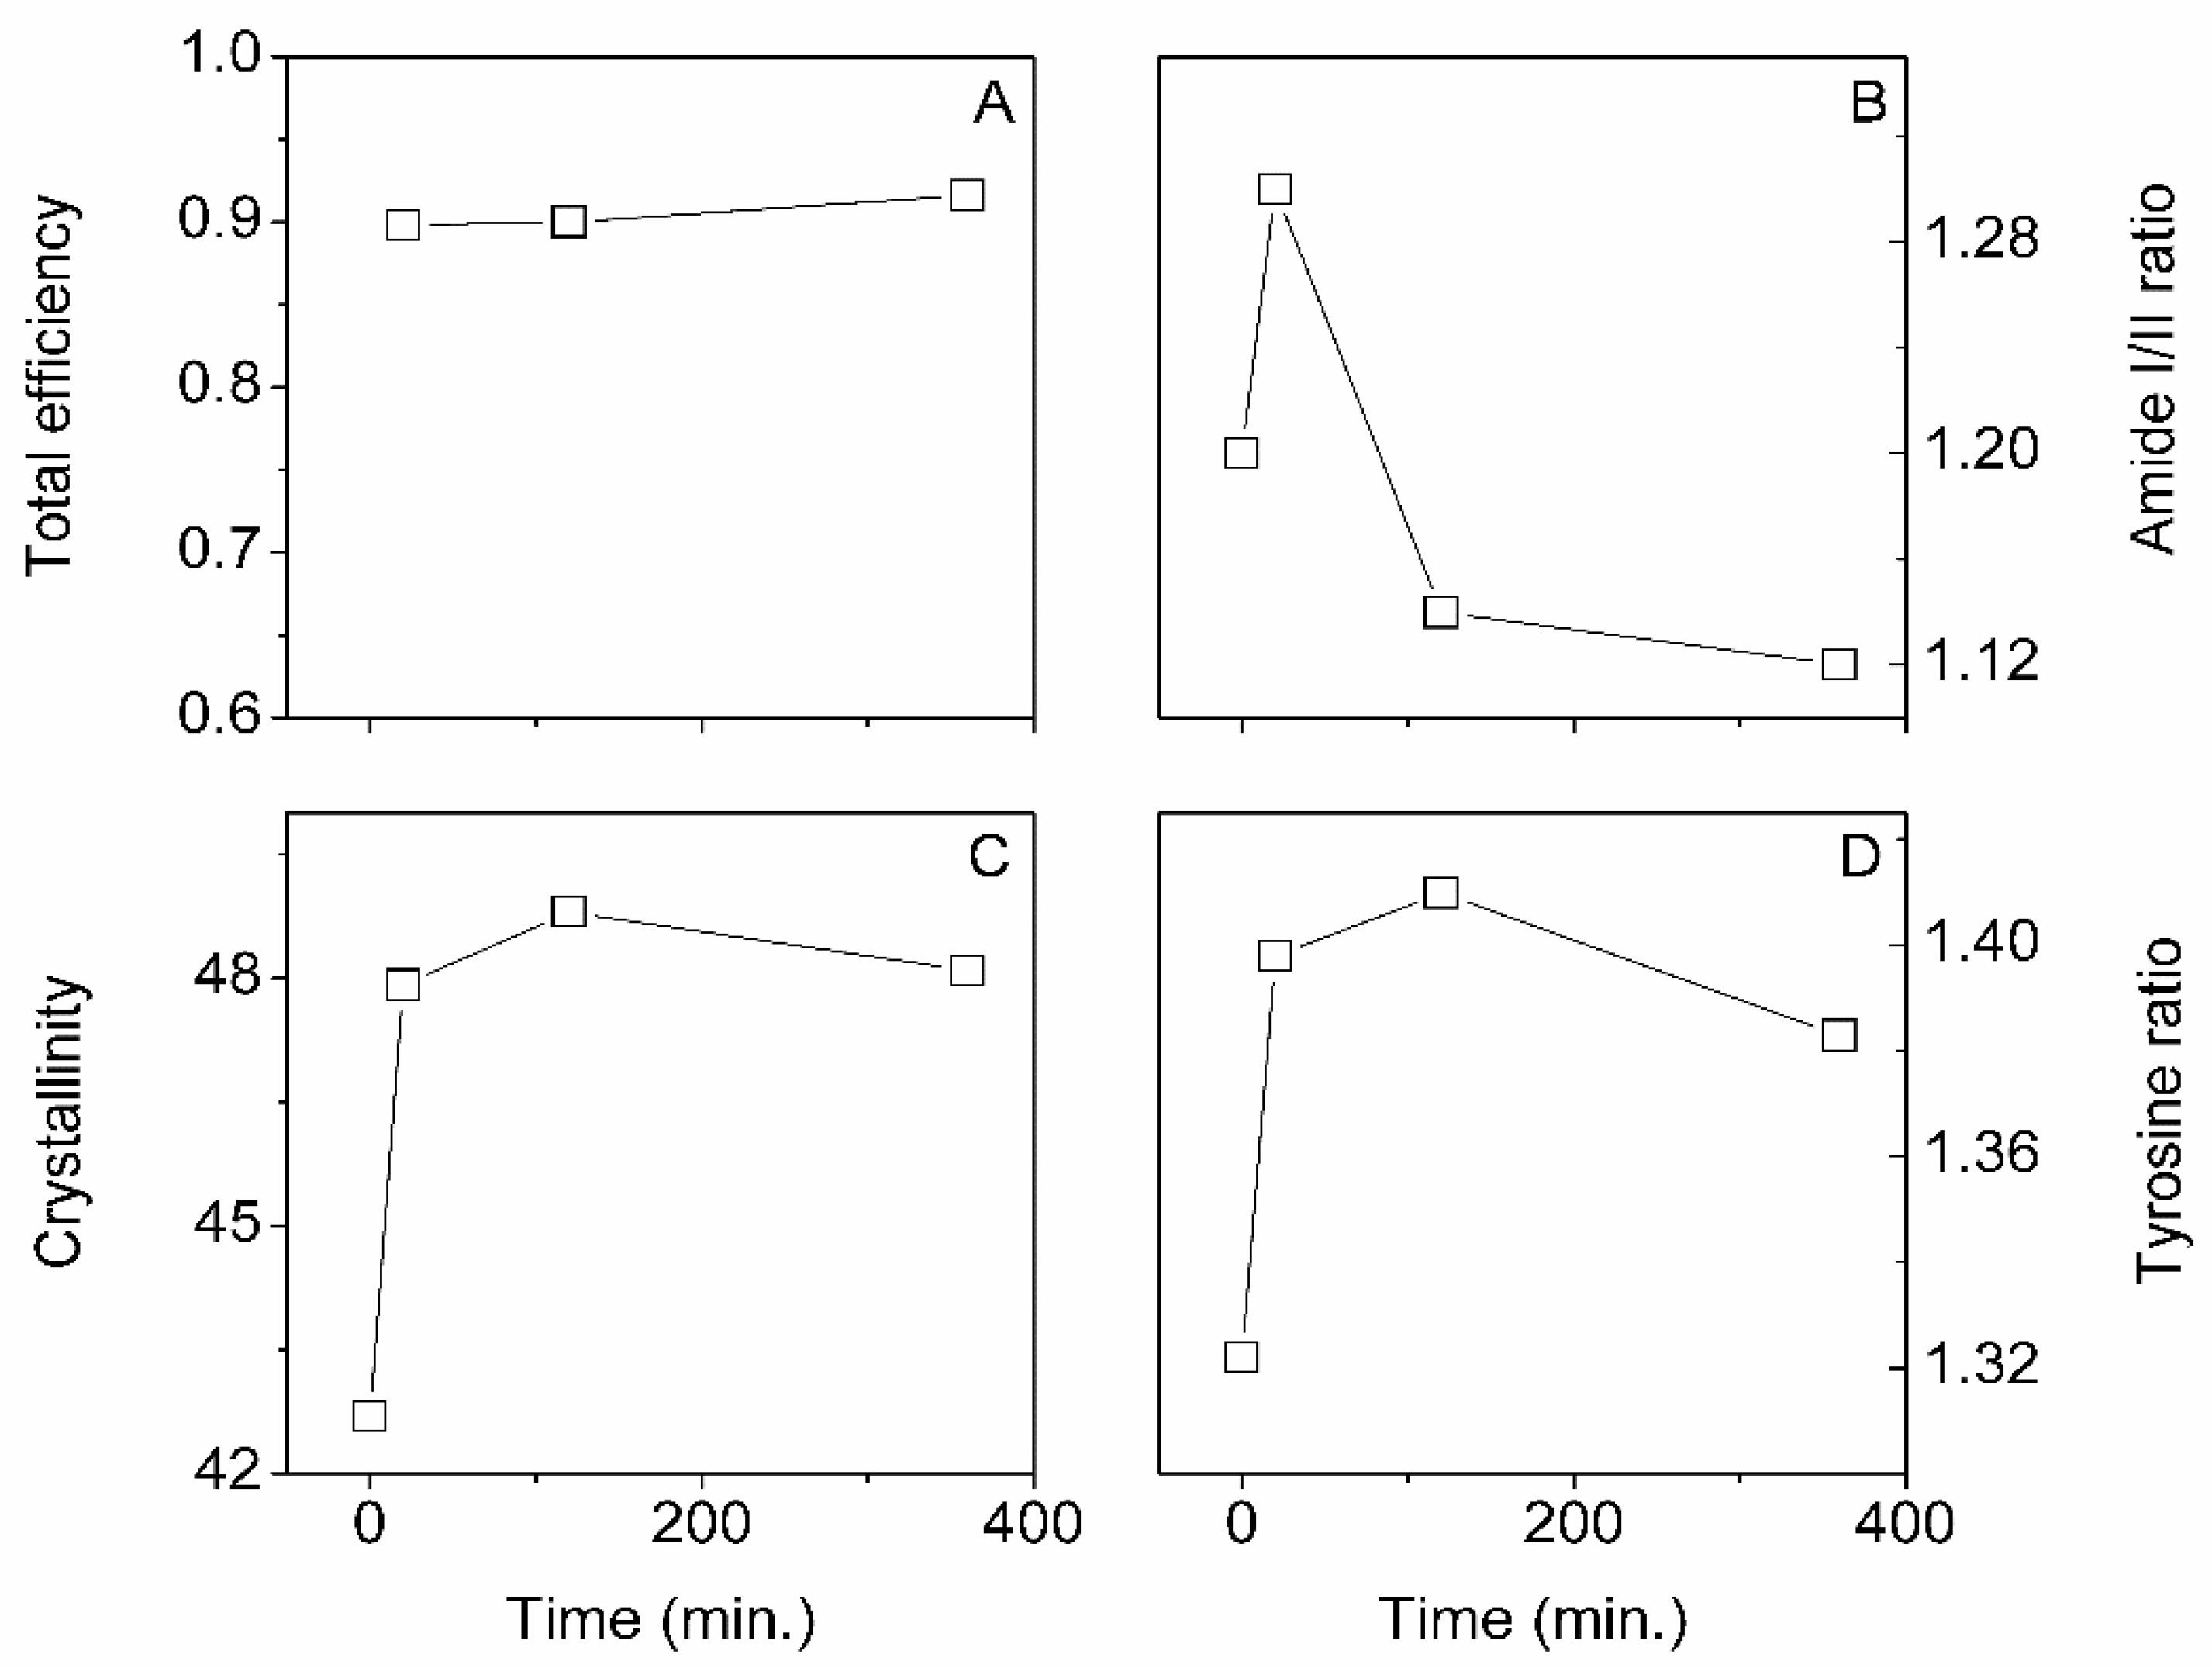
3.3.2. Effect of Initial Gold NPs Concentration and Time of Impregnation
An essential set of parameters is gold NP concentration and time. Figure 7 summarizes our three FTIR-ATR markers and the total impregnation efficiency. Figure 7B–D shows that the first point at t = 0 min represents native degummed silk.
Figure 7.
Effect of increasing gold concentration (in optical density O.D.) on total efficiency (A), Amide I/II ratio (B), Crystallinity (C), and Tyrosine ratio (D). Interestingly, even though we observed no changes in the amide I/II ratio, we found that the crystallinity and tyrosine ratio were affected. The O.D. concentrations correspond to approximately 6.9, 20.7 and 41.3 µg/mL for the 0.1, 0.3 and 0.6 O.D.
We found that the total efficiency and Amide I/II ratio were independent of the gold NP concentration. On the other hand, the silk crystallinity increased with concentration, whereas the tyrosine ratio decreased. It is important to note that the crystallinity and tyrosine ratio’s positive and negative changes would result in a zero net change in structure, as shown in the amide I/II ratio plot (Figure 7B). The result suggested that some amorphous silk was converted in [-sheet structures (crystallinity)] the typical Silk I to Silk II conversion with increasing gold NP concentration. The existing β-sheets structures were becoming larger through interchain crystallization.
The contribution from the gold NPs to the FTIR-ATR spectra was measured to be at around 1734, 1599, 1448, and 1245 cm−1 (data not shown). However, we did not observe significant peaks in those regions, suggesting that silk most likely covered the gold signal.
A photograph (Figure 8) illustrates the sharp color change with increasing concentration.
Figure 8.
Photograph of impregnated silks, from left to right: native silk, control impregnation (no scCO2), scCO2 impregnation 0.1, 0.3, and 0.6 O.D, respectively.
Figure 9 illustrates the effect of scCO2 impregnation time. Similarly to the gold NP concentration, we found that the efficiency was constant at around 90%. Interestingly, the amide I/II ratio decreased sharply with increasing times, whereas the crystallinity appeared steady, and the tyrosine ratio showed a slight decrease with time.
Figure 9.
Effect of increasing scCO2 impregnation time on total efficiency (A), Amide I/II ratio (B), Crystallinity (C), and Tyrosine ratio (D). The gold NP concentration was kept constant at 0.1 O.D.
Figure S10 shows the SEM images of a native degummed and scCO2 impregnated silk (panel A and C, respectively). EDX spectra of selected features on the silk surface showed no gold for the control and traces of gold for the scCO2 (panel B and D, respectively).
Taken together, the low amount of gold NPs on the surface and no gold NPs in the solution, we could suggest that most of the gold NPs were inside the silk, as expected from the efficiencies. A more precise quantification was obtained by XRD (See Figure 10) with the characteristic gold peak at 38° (note that the other peaks at 65° and 78° were barely visible for the highest gold NP concentration used). The distinct silk peaks [48] at 25°, 40°, and 42° appeared unchanged with increasing gold NPs concentrations.
Figure 10.
Intensities versus diffraction angle (2θ) as derived by our X-ray diffraction for silk fibers with different amounts of gold. For three times and six times gold addition, the gold peaks were at 2θ = 38°, 65° and 78°. No gold was detected for one-time gold addition. The silk characteristic peaks were at 20°, 25°, 40° and 42°. The grey dotted line indicates the gold reflection at 38°.
The detailed peak deconvolution of the amide I (see Supplementary Materials Figure S11) showed that the β-sheets structures were constant with gold concentration and impregnation time. We observed, however, a conversion from the random coil/α-helical structures to β-turns with increasing gold concentration and time.
Throughout the analysis so far, we found that changes happened in the amorphous region of the silk. A complementary analysis of the interactions within the silk structures was the hydrogen bond index (HBI) from N-H vibration (ratio of intensities at 3320 to 3400 cm−1). Alternatively, one could use the carbonyl signal C=O between 1600 to 1700 cm−1. The presence of other strongly overlapping bands in the C=O region precluded a correct estimation of the HBI.
The results for the HBI of the three samples (Figure 11) suggested that the hydrogen bond index increased relative to the native silk but was not different from the two scCO2 treated silks. Overall, the structural effects observed were predominantly coming from scCO2 treatment.
Figure 11.
Change in Hydrogen bond index for N-H vibration for native silk, scCO2 only treated silk, and scCO2 plus gold NPs impregnated silk.
To help understand further the effect of the scCO2 process parameters (temperature, time, pressure, and mixing), we used a factorial design.
3.4. Factorial Design—Relationships between Process Parameters and Multiple Responses
In the factorial design table (see Table 1), we combined the various factors of interest at different levels. We explored our four typical responses: total efficiency, crystallinity, Amide I/II ratio, and tyrosine ratio.
We found for the total efficiency that only pressure and time contributed significantly (significance level α = 0.1) to explain the total efficiency variance. We also noted that both pressure and time contributed equally. For the Amide I/II ratio, we found that pressure and time were significant, except that pressure had a more substantial effect than time. For the crystallinity, only the temperature contributed significantly to the effect. Eventually, only the time had a more significant effect on the tyrosine ratio, and the pressure was marginally significant (see Supplementary Materials Figure S12).
One advantage of the factorial design is that one can seek the optimal conditions for a set of parameters. Optimally, we wished to maximize efficiency while maintaining the crystallinity at the lowest level possible. We found an optimal set of conditions: 35 °C for temperature, 250 bar for pressure, 1 h for the time, and 300 rpm for the mixing speed.
4. Discussion
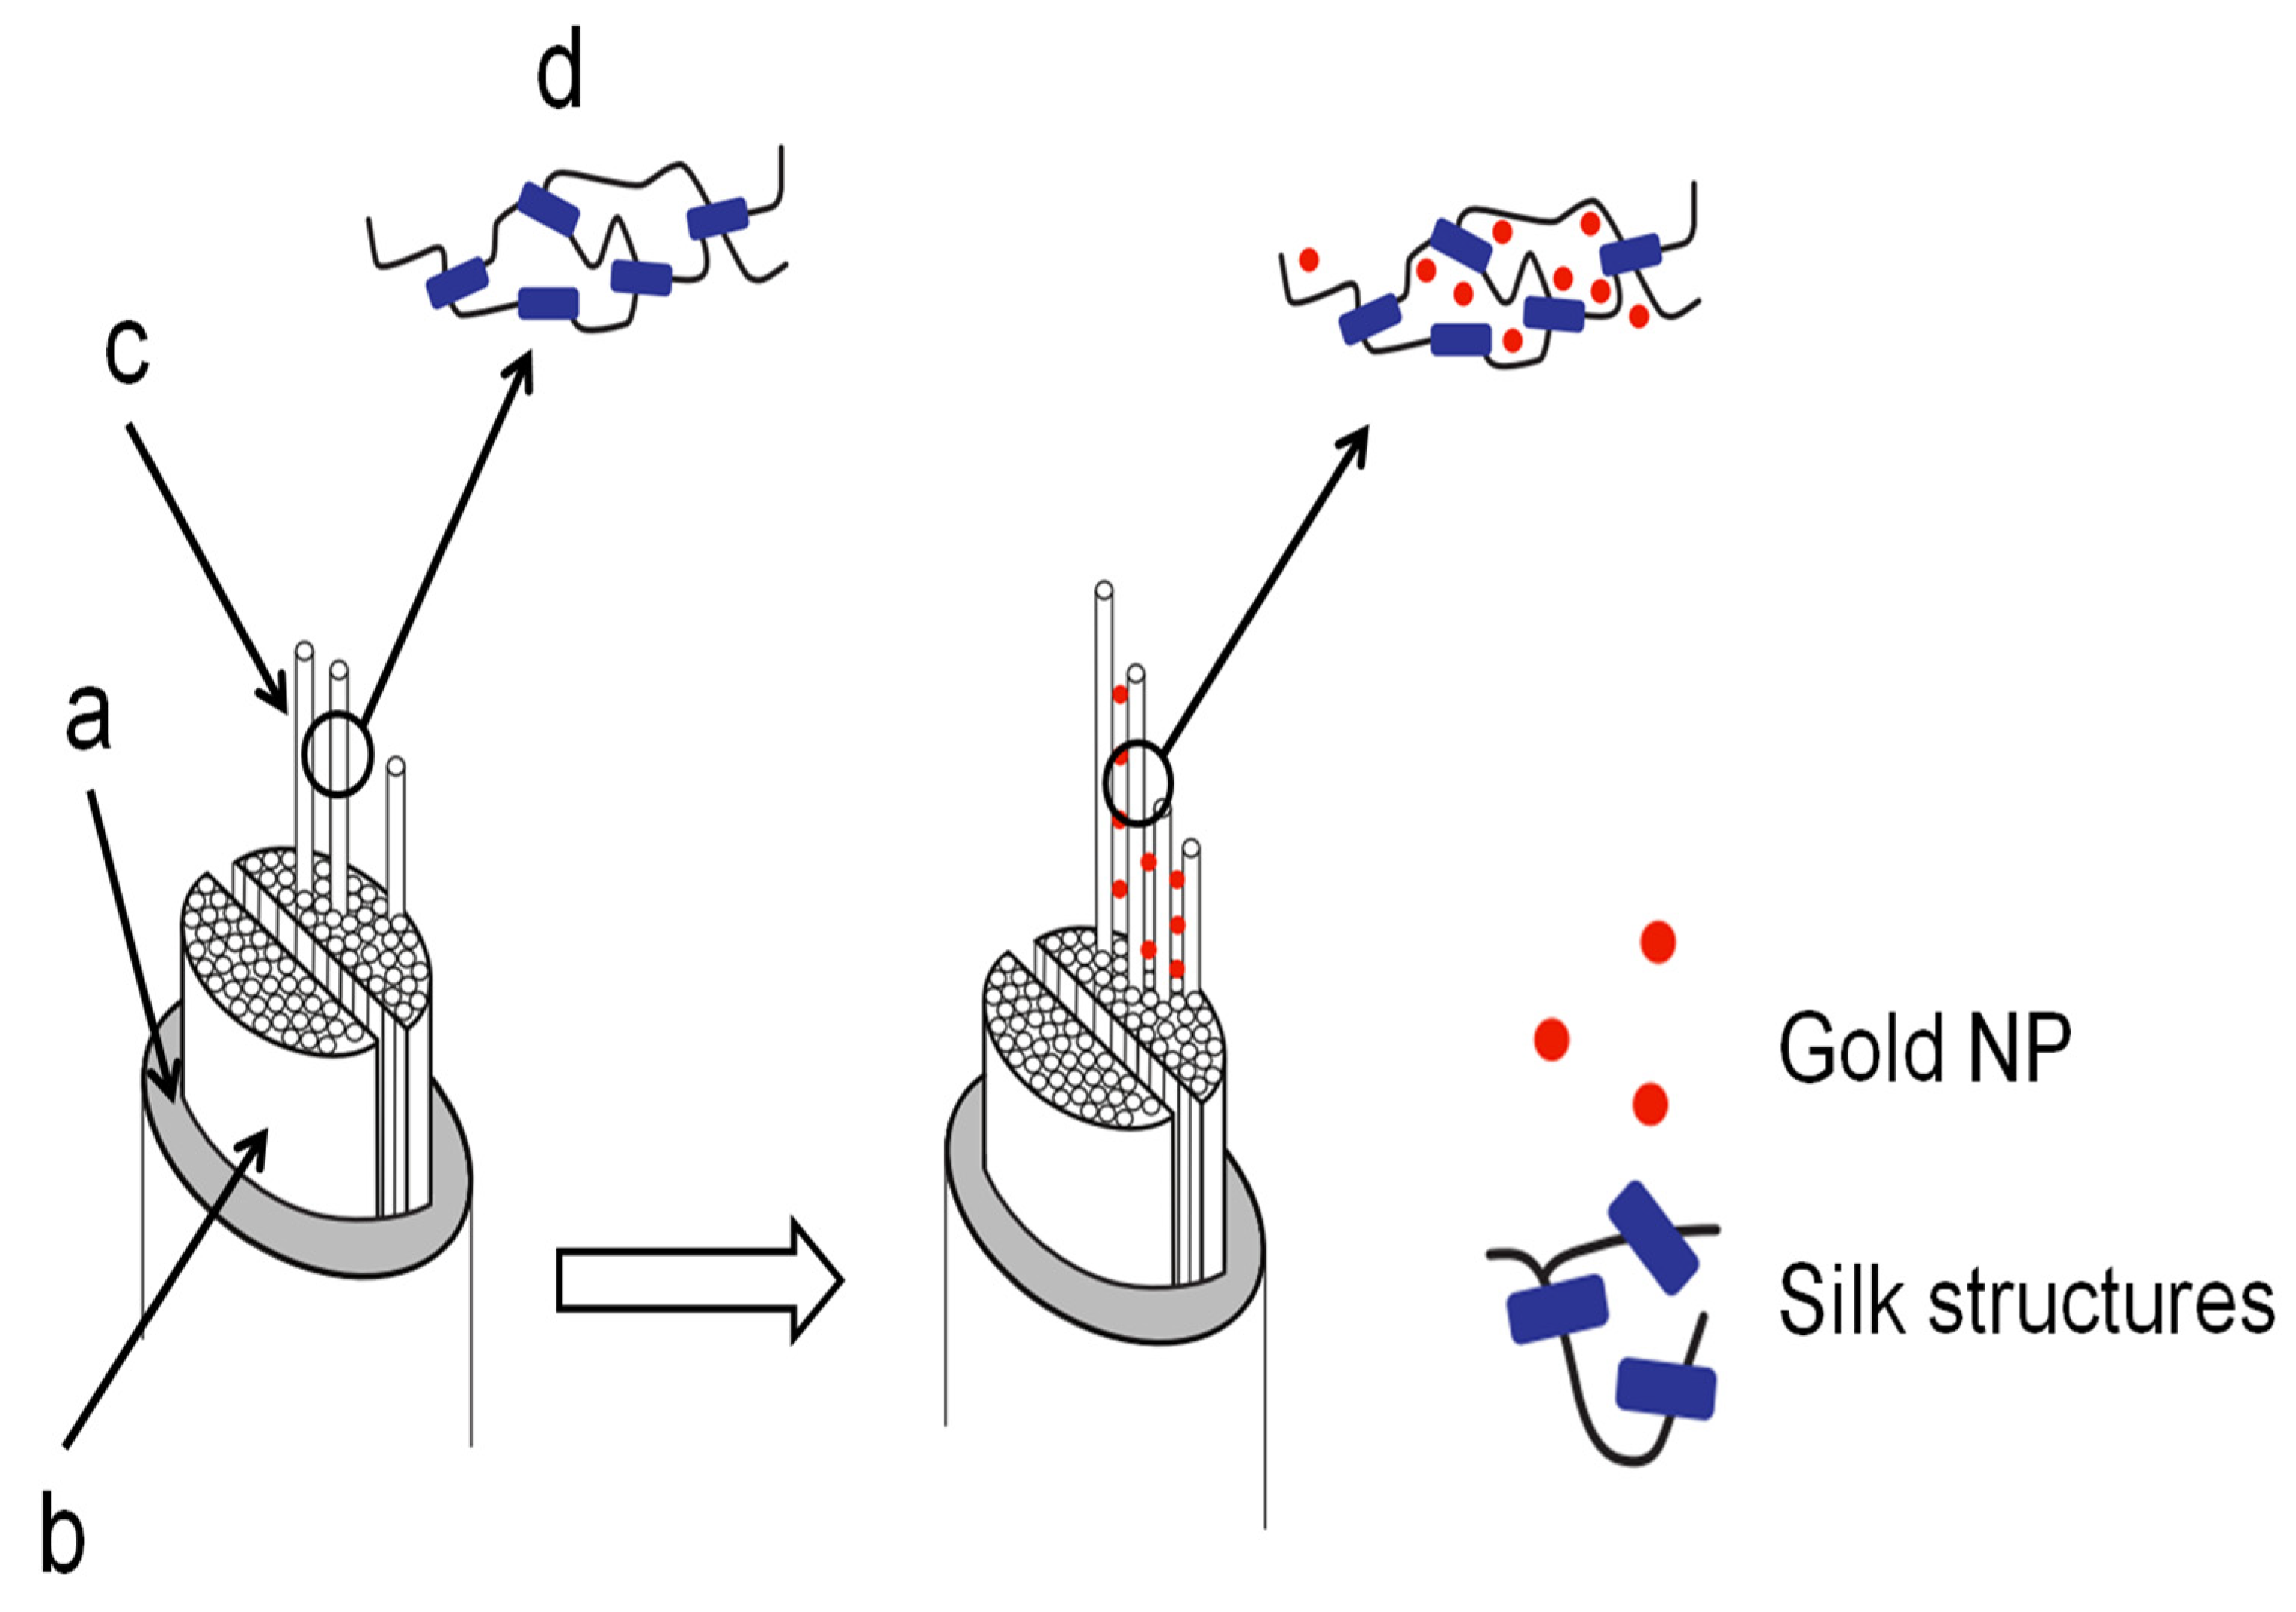
Mechanism of Impregnation and Gold Nanoparticles Location
The permeation of scCO2 into a polymer causes it to swell. Aided by its zero-surface tension, the addition of scCO2 into the polymer phase gives the chains higher mobility. The CO2 molecules act as lubricants, which reduce chain-chain interactions by increasing the polymer’s inter-chain distance and free volume [53,54,55,56], also known as plasticization. The physical properties of the polymer are changed dramatically, including the depression of the glass transition temperature (Tg), the lowering of interfacial tension and a reduction of the viscosity of the polymer melt. ScCO2 may increase the crystallinity of the polymers because the polymer chains are freer to align themselves with a more favorable order [57]. The above phenomena describe well the impregnation of soluble molecules into polymers. In the case of NPs, however, little is known.
Nevertheless, the studied silks could host gold NPs with sizes up to 150 nm using SCO2. However, it is unclear as to the location specificity of the gold NPs with size. For example, would the smaller NPs be preferentially located more in-depth, and, as the size increases, the NPs would be nearer the silk surface.
The details of the degummed Mulberry silk fiber impregnation mechanism suggested that the gold NPs were limited to the silk inter-fibrillar space and, more specifically, around the amorphous regions. Figure 12 illustrates our findings.
Figure 12.
Gold NPs impregnation in silk. The typical silk fiber consists of (a) sericin coating, (b) fibroin brins, (c) fibrils, and (d) the secondary structure (idealized here the β-sheet as blue rectangles and the α-helices, random coils and turns as curvy black lines). After impregnation, the gold NPs were found in the inter-fibrillar spaces.
Further research on ternary systems comprising “CO2 + Nonsoluble NPs + fibers (solid substrates)” is required for a detailed understanding of mass transfer and diffusion in the substrate and of influences on the properties of the bulk material as crystallinity, morphology, anisotropy, and reactivity [58].
Collectively our results lead to the hypothesis that, under the supercritical conditions used in our experiment, the transport of the NPs would happen due to a gradient in surface tension. Park et al. [59] found, for example, that polystyrene (a polymer close to silks) surface tension decreases with CO2 increased solubility in the polymer (i.e., higher pressures and higher temperatures). They also found that the polymer surface tension was independent of the polymer conformational entropy; in other words, its internal organization.
One could envision a transport phenomenon akin to the Marangoni flow [60]. The nature of the gradient remains unclear.
5. Conclusions
In conclusion, we demonstrated the permanent loading of gold NPs in four types of silk (Bombyx, Eri, Tasar, and Muga) using green and scalable technology like scCO2. This work addressed the existing problem of uncontrolled leakage of the loaded particles from fibers, which is a significant concern for the environment and a hurdle in nanotechnology applications for synthetic and natural fibers’ functionalization.
Further, we reported space availability in silk fibers by scCO2 assisted impregnation at low temperatures. The four silks (Mulberry, Eri, Muga, and Tasar) displayed a remarkable capacity for the size of gold NPs (up to 150 nm). The detailed study of the impregnation mechanism in degummed mulberry silk fiber suggested a narrow window of process parameters with no detrimental effect on the fiber. The mechanism of impregnation of NPs into a solid fiber substrate is yet to be resolved; we hypothesized that the transport of the NPs was possible because of a surface tension gradient at the liquid-solid interface.
This developed approach is scalable, environmentally friendly. The results could help predict the application of natural fiber loaded with NPs as catalysts, self-cleaning, antimicrobial materials, UV-protective agents, and other valuable properties.
Supplementary Materials
The following are available online at https://www.mdpi.com/article/10.3390/insects13010018/s1, Figure S1: wash procedure and leakage calculation. Figure S2: Typical FTIR-ATR spectra of Mulberry, eri, muga, and tasar silks., Figure S3: Crystallinity index. The spectrum is truncated between 1180 and 1300 cm−1, and a linear baseline is subtracted. The crystallinity index is computed using the intensities of the peaks at 1263 and 1230 cm−1 (red stars). Figure S4: Tyrosine ratio estimate. The spectra are truncated between 790 and 870 cm−1, and a linear baseline is subtracted. The ratio is computed from the peak maxima at around 830 and 850 cm−1 (red stars in the figure). Figure S5: Secondary structure decomposition and analysis. Typical peak deconvolution of the Amide I and Amide II (top panel) and associated residuals (bottom panel). Briefly, a series of Gaussian peaks are fitted simultaneously to the Amide I and II. The initial position of the peaks is determined by secondary derivative analysis [37]. The final number of peaks is determined using an F-test to compare different models. The Amide I/II ratio is computed directly from the two main peaks in the upper panel. Figure S6: Comparison of total efficiency of 5 nm gold NP impregnation at 0.1 and 0.3 O.D. Figure S7: FTIR-ATR changes in secondary structure content as a function of Au NP size for Mulberry (A), Eri (B), Muga (C), and Tasar (D) silks. Black squares (□) are inter β-sheets, red circles (O) are β-turns, blue triangles (∆) are α-helices and random coils, inverted green triangles (∇) are intra β-sheets. Figure S8: FTIR-ATR change in crystallinity for Mulberry (A), Eri (B), Muga (C), and Tasar (D) silks. Black squares (□) are scCO2 samples, red circles (O) are control samples. The horizontal line is the crystallinity in native silk. We found that for scCO2 treatment alone, the crystallinity was not significantly different from the native silks. Figure S9: FTIR-ATR changes in tyrosine ratio for Mulberry (A), Eri (B), Muga (C), and Tasar (D) silks. Black squares (□) are scCO2 samples, red circles (O) are control samples. The horizontal line is the tyrosine ratio in native silk. We found that for scCO2 treatment alone, the tyrosine ratio was not significantly different from the native silks. Figure S10: SEM images of native (A, scale bar 5 µ) and impregnated (C, scale bar 10 µ) silk fibers. The white squares represent the areas where the EDX spectra were collected. EDX spectra of native (B) and impregnated (C) silk fibers. The spectra showed only weak gold signals at 2.5, 7, 9.5, 10.5, 11.5, and 13.5 keV (D). Figure S11: FTIR-ATR changes in secondary structure content as a function of Au NP concentration. Black squares (□) are inter β-sheets, red circles (O) are β-turns, blue triangles (∆) are α-helices and random coils, inverted green triangles (∇) are intra β-sheets. Figure S12: Pareto charts of the standardized effect from the full factorial analysis. The red dotted line is the standardized value above which a factor or combination of factors is considered significant (α level = 0.1). Table S1: Gold nanoparticles concentration and mass. Table S2. Consensus assignment for silk secondary structures determination by FTIR.
Author Contributions
Conceptualization, M.S., E.S.D., S.B. and C.D.; methodology, M.S.; validation, M.S., E.S.D. and C.D.; investigation, M.S.; data curation, C.D.; writing—original draft preparation, M.S.; writing—review and editing, M.S., E.S.D., S.B. and C.D. All authors have read and agreed to the published version of the manuscript.
Funding
The Swedish Science Research Council funded this research under grant number 348-2013-6218.
Institutional Review Board Statement
Not applicable.
Informed Consent Statement
Not applicable.
Data Availability Statement
The data presented in this study are available in the manuscript.
Acknowledgments
The authors acknowledge the Swedish Science Research Council for support (VR-grant 348-2013-6218).
Conflicts of Interest
The authors declare no conflict of interest.
References
- El-Shishtawy, R.M.; Asiri, A.M.; Abdelwahed, N.A.M.; Al-Otaibi, M.M. In situ production of silver nanoparticle on cotton fabric and its antimicrobial evaluation. Cellulose 2011, 18, 75–82. [Google Scholar] [CrossRef]
- Alongi, J.; Malucelli, G. Cotton flame retardancy: State of the art and future perspectives. RSC Adv. 2015, 5, 24239–24263. [Google Scholar] [CrossRef]
- Onar, N.; Aksit, A.C.; Sen, Y.; Mutlu, M. Antimicrobial, UV-protective and self-cleaning properties of cotton fabrics coated by dip-coating and solvothermal coating methods. Fiber Polym. 2011, 12, 461–470. [Google Scholar] [CrossRef]
- Alongi, J.; Carosio, F.; Malucelli, G. Current emerging techniques to impart flame retardancy to fabrics: An overview. Polym. Degrad. Stab. 2014, 106, 138–149. [Google Scholar] [CrossRef]
- Dong, B.H.; Hinestroza, J.P. Metal nanoparticles on natural cellulose fibers: Electrostatic assembly and in situ synthesis. ACS Appl. Mater. Interfaces 2009, 1, 797–803. [Google Scholar] [CrossRef]
- Li, G.; Liu, H.; Zhao, H.; Gao, Y.; Wang, J.; Jiang, H.; Boughton, R.I. Chemical assembly of TiO2 and TiO2@Ag nanoparticles on silk fiber to produce multifunctional fabrics. J. Colloid Interface Sci. 2011, 358, 307–315. [Google Scholar] [CrossRef]
- Shateri-Khalilabad, M.; Yazdanshenas, M.E.; Etemadifar, A. Fabricating multifunctional silver nanoparticles-coated cotton fabric. Arab. J. Chem. 2017, 10, S2355–S2362. [Google Scholar] [CrossRef]
- Tang, B.; Sun, L.; Kaur, J.; Yu, Y.; Wang, X. In-situ synthesis of gold nanoparticles for multifunctionalization of silk fabrics. Dye. Pigm. 2014, 103, 183–190. [Google Scholar] [CrossRef]
- Tang, B.; Li, J.; Hou, X.; Afrin, T.; Sun, L.; Wang, X. Colorful and antibacterial silk fiber from anisotropic silver nanoparticles. Ind. Eng. Chem. Res. 2013, 52, 4556–4563. [Google Scholar] [CrossRef]
- Grand, J.; Ferreira, S.R.; de Waele, V.; Mintova, S.; Nenoff, T.M. Nanoparticle alloy formation by radiolysis. J. Phys. Chem. C 2018, 122, 12573–12588. [Google Scholar] [CrossRef]
- Park, J.-E.; Atobe, M.; Fuchigami, T. Sonochemical synthesis of conducting polymer–metal nanoparticles nanocomposite. Electrochim. Acta 2005, 51, 849–854. [Google Scholar] [CrossRef]
- Mitrano, D.M.; Rimmele, E.; Wichser, A.; Erni, R.; Height, M.; Nowack, B. Presence of nanoparticles in wash water from conventional silver and nano-silver textiles. ACS Nano 2014, 8, 7208–7219. [Google Scholar] [CrossRef]
- Hristozov, D.; Malsch, I. Hazards and risks of engineered nanoparticles for the environment and human health. Sustainability 2009, 1, 1161–1194. [Google Scholar] [CrossRef]
- Rastogi, A.; Zivcak, M.; Sytar, O.; Kalaji, H.M.; He, X.; Mbarki, S.; Brestic, M. Impact of metal and metal oxide nanoparticles on plant: A critical review. Front. Chem. 2017, 5, 78. [Google Scholar] [CrossRef] [PubMed]
- Wakayama, H.; Fukushima, Y. Supercritical CO2 for making nanoscale materials. Ind. Eng. Chem. Res. 2006, 45, 3328–3331. [Google Scholar] [CrossRef]
- Zhang, X.; Heinonen, S.; Levänen, E. Applications of supercritical carbon dioxide in materials processing and synthesis. RSC Adv. 2014, 4, 61137–61152. [Google Scholar] [CrossRef]
- Cansell, F.; Chevalier, B.; Demourgues, A.; Etourneau, J.; Even, C.; Pessey, V.; Petit, S.; Tressaud, A.; Weill, F. Supercritical fluid processing: A new route for materials synthesis. J. Mater. Chem. 1999, 9, 67–75. [Google Scholar] [CrossRef]
- Xu, Y.; Musumeci, V.; Aymonier, C. Chemistry in supercritical fluids for the synthesis of metal nanomaterials. React. Chem. Eng. 2019, 4, 2030–2054. [Google Scholar] [CrossRef]
- Lane, M.K.M.; Zimmerman, J.B. Controlling metal oxide nanoparticle size and shape with supercritical fluid synthesis. Green Chem. 2019, 21, 3769–3781. [Google Scholar] [CrossRef]
- Chih, Y.-W.; Cheng, W.-T. Supercritical carbon dioxide-assisted synthesis of silver nanoparticles in polyol process. Mater. Sci. Eng. B 2007, 145, 67–75. [Google Scholar] [CrossRef]
- Parandhaman, T.; Dey, M.D.; Das, S.K. Biofabrication of supported metal nanoparticles: Exploring the bioinspiration strategy to mitigate the environmental challenges. Green Chem. 2019, 21, 5469–5500. [Google Scholar] [CrossRef]
- Hua, M.; Hua, X. polymer nanoparticles prepared by supercritical carbon dioxide for in vivo anti-cancer drug delivery. Nano-Micro Lett. 2014, 6, 20–23. [Google Scholar] [CrossRef]
- Wang, Y.; Dave, R.N.; Pfeffer, R. Polymer coating/encapsulation of nanoparticles using a supercritical anti-solvent process. J. Supercrit. Fluids 2004, 28, 85–99. [Google Scholar] [CrossRef]
- Liu, Z.-T.; Zhang, L.; Liu, Z.; Gao, Z.; Dong, W.; Xiong, H.; Peng, Y.; Tang, S. Supercritical CO2 dyeing of ramie fiber with disperse dye. Ind. Eng. Chem. Res. 2006, 45, 8932–8938. [Google Scholar] [CrossRef]
- van der Kraan, M.; Fernandez Cid, M.V.; Woerlee, G.F.; Veugelers, W.J.T.; Witkamp, G.J. Dyeing of natural and synthetic textiles in supercritical carbon dioxide with disperse reactive dyes. J. Supercrit. Fluids 2007, 40, 470–476. [Google Scholar] [CrossRef]
- Guney, O.; Akgerman, A. Synthesis of controlled-release products in supercritical medium. AIChE J. 2002, 48, 856–866. [Google Scholar] [CrossRef]
- Fernandez Cid, M.V.; van Spronsen, J.; van der Kraan, M.; Veugelers, W.J.T.; Woerlee, G.F.; Witkamp, G.J. Excellent dye fixation on cotton dyed in supercritical carbon dioxide using fluorotriazine reactive dyes. Green Chem. 2005, 7, 609–616. [Google Scholar] [CrossRef]
- Singh, M.; Bollella, P.; Gorton, L.; Dey, E.; Dicko, C. Conductive and enzyme-like silk fibers for soft sensing application. Biosens. Bioelectron. 2019, 150, 111859. [Google Scholar] [CrossRef]
- Cooper, A.I. Polymer synthesis and processing using supercritical carbon dioxide. J. Mater. Chem. 2000, 10, 207–234. [Google Scholar] [CrossRef]
- Jiang, N.; Wang, Y.; Li, D.; Niu, J.; Wang, S.; Chen, A. Carbon-doped metal oxide nanoparticles prepared from metal nitrates in supercritical CO2-enabled polymer nanoreactors. Part. Part. Syst. Charact. 2019, 36, 1900016. [Google Scholar] [CrossRef]
- Yu, Q.; Wu, P.; Xu, P.; Li, L.; Liu, T.; Zhao, L. Synthesis of cellulose/titanium dioxide hybrids in supercritical carbon dioxide. Green Chem. 2008, 10, 1061–1067. [Google Scholar] [CrossRef]
- Gittard, S.D.; Hojo, D.; Hyde, G.K.; Scarel, G.; Narayan, R.J.; Parsons, G.N. Antifungal textiles formed using silver deposition in supercritical carbon dioxide. J. Mater. Eng. Perform. 2009, 19, 368–373. [Google Scholar] [CrossRef]
- Ding, X.; Yu, M.; Wang, Z.; Zhang, B.; Li, L.; Li, J. A promising clean way to textile colouration: Cotton fabric covalently-bonded with carbon black, cobalt blue, cobalt green, and iron oxide red nanoparticles. Green Chem. 2019, 21, 6611–6621. [Google Scholar] [CrossRef]
- Watkins, J.J.; McCarthy, T.J. Polymer/metal nanocomposite synthesis in supercritical CO2. Chem. Mater. 1995, 7, 1991–1994. [Google Scholar] [CrossRef]
- Zhang, Y.; Kang, D.; Saquing, C.; Aindow, M.; Erkey, C. Supported Platinum Nanoparticles by Supercritical Deposition. Ind. Eng. Chem. Res. 2005, 44, 4161–4164. [Google Scholar] [CrossRef]
- Ye, X.-R.; Lin, Y.; Wang, C.; Engelhard, M.H.; Wang, Y.; Wai, C.M. Supercritical fluid synthesis and characterization of catalytic metal nanoparticles on carbon nanotubes. J. Mater. Chem. 2004, 14, 908–913. [Google Scholar] [CrossRef]
- Hasell, T.; Thurecht, K.J.; Jones, R.D.W.; Brown, P.D.; Howdle, S.M. Novel one pot synthesis of silver nanoparticle–polymer composites by supercritical CO2 polymerization in the presence of a RAFT agent. Chem. Commun. 2007, 38, 3933–3935. [Google Scholar] [CrossRef]
- Wong, B.; Yoda, S.; Howdle, S.M. The preparation of gold nanoparticle composites using supercritical carbon dioxide. J. Supercrit. Fluids 2007, 42, 282–287. [Google Scholar] [CrossRef]
- Fan, Y.; Zhang, Y.-Q.; Yan, K.; Long, J.-J. Synthesis of a novel disperse reactive dye involving a versatile bridge group for the sustainable coloration of natural fibers in supercritical Carbon Dioxide. Adv. Sci. 2019, 6, 1801368. [Google Scholar] [CrossRef] [PubMed]
- Peng, Q.; Xu, Q.; Sun, D.; Shao, Z. Grafting of methyl methacrylate onto Antheraea pernyi silk fiber with the assistance of supercritical CO2. J. Appl. Polym. Sci. 2006, 100, 1299–1305. [Google Scholar] [CrossRef]
- Peng, L.; Guo, R.; Lan, J.; Jiang, S.; Wang, X.; Lin, S.; Li, C. Silver nanoparticles coating on silk fabric with pretreatment of 3-aminopropyltrimethoxysilane in supercritical carbon dioxide. J. Ind. Text. 2016, 47, 883–896. [Google Scholar] [CrossRef]
- Marin, M.A.; Mallepally, R.R.; McHugh, M.A. Silk fibroin aerogels for drug delivery applications. J. Supercrit. Fluids 2014, 91, 84–89. [Google Scholar] [CrossRef]
- Bhat, N.V.; Nadiger, G.S. Crystallinity in silk fibers: Partial acid hydrolysis and related studies. J. Supercrit. Fluids 1980, 25, 921–932. [Google Scholar] [CrossRef]
- Monti, P.; Freddi, G.; Bertoluzza, A.; Kasai, N.; Tsukada, M. Raman spectroscopic studies of silk fibroin from bombyx mori. J. Raman Spectrosc. 1998, 29, 297–304. [Google Scholar] [CrossRef]
- Boulet-Audet, M.; Vollrath, F.; Holland, C. Identification and classification of silks using infrared spectroscopy. J. Exp. Biol. 2015, 218, 3138–3149. [Google Scholar] [CrossRef]
- Ishida, K.P.; Griffiths, P.R. Comparison of the amide I/II intensity ratio of solution and solid-state proteins samples by transmission, attenuated total reflectance, and diffuse reflectance spectrometry. Appl. Spectrosc. 1993, 47, 584–589. [Google Scholar] [CrossRef]
- Chen, Z.; Huang, W.; Fang, P.F.; Yu, W.; Wang, S.J.; Xiong, J.; Xu, Y.S. The hydrogen bond and free volume property of poly(ether-urethane) irradiated by neutron. J. Polym. Sci. B Polym. Phys. 2010, 48, 381–388. [Google Scholar] [CrossRef]
- Sen, K.; Babu, K.M. Studies on Indian silk. II. Structure–property correlations. J. Appl. Polym. Sci. 2004, 92, 1098–1115. [Google Scholar] [CrossRef]
- Sen, K.; Babu, M.K.; Babu, K.M. Studies on Indian silk. III. Effect of structure on dyeing behavior. J. Appl. Polym. Sci. 2004, 92, 1116–1123. [Google Scholar] [CrossRef]
- Sen, K.; Babu, K.M. Studies on Indian silk. I. macrocharacterization and analysis of amino acid composition. Polymer 2003, 92, 1080–1097. [Google Scholar] [CrossRef]
- Guan, J.; Wang, Y.; Mortimer, B.; Holland, C.; Shao, Z.; Porter, D.; Vollrath, F. Glass transitions in native silk fibres studied by dynamic mechanical thermal analysis. Soft Matter 2016, 12, 5926–5936. [Google Scholar] [CrossRef] [PubMed]
- Mazzi, S.; Zulker, E.; Buchicchio, J.; Anderson, B.; Hu, X. Comparative thermal analysis of Eri, Mori, Muga, and Tussar silk cocoons and fibroin fibers. J. Therm. Anal. Calorim. 2014, 116, 1337–1343. [Google Scholar] [CrossRef]
- Aymonier, C.; Loppinet-Serani, A.; Reverón, H.; Garrabos, Y.; Cansell, F. Review of supercritical fluids in inorganic materials science. J. Supercrit. Fluids 2006, 38, 242–251. [Google Scholar] [CrossRef]
- Brunner, G.J. Application of Supercritical Fluids. Annu. Rev. Chem. Biomol. Enginering 2010, 1, 321–342. [Google Scholar] [CrossRef] [PubMed]
- Kikic, I.; Vecchione, F. Supercritical impregnation of polymers. Curr. Opin. Solid State Mater. Sci. 2003, 7, 399–405. [Google Scholar] [CrossRef]
- Zhao, X.; Lv, L.; Pan, B.; Zhang, W.; Zhang, S.; Zhang, Q. Polymer-supported nanocomposites for environmental application: A review. Chem. Eng. J. 2011, 170, 381–394. [Google Scholar] [CrossRef]
- Kazarian, S.G. Polymer processing with supercritical fluids. Polym. Sci. 2000, 42, 78–101. [Google Scholar]
- Weidner, E. Impregnation via supercritical CO2—What we know and what we need to know. J. Supercrit. Fluids 2018, 134, 220–227. [Google Scholar] [CrossRef]
- Park, H.; Thompson, R.B.; Lanson, N.; Tzoganakis, C.; Park, C.B.; Chen, P. Effect of temperature and pressure on surface tension of polystyrene in supercritical carbon dioxide. J. Phys. Chem. B 2007, 111, 3859–3868. [Google Scholar] [CrossRef][Green Version]
- Rengasamy, R.S. Wetting phenomena in fibrous materials. In Thermal and Moisture Transport in Fibrous Materials; Pan, N., Gibson, P., Eds.; Woodhead: Melbourne, Australia, 2006. [Google Scholar]
Publisher’s Note: MDPI stays neutral with regard to jurisdictional claims in published maps and institutional affiliations. |
© 2021 by the authors. Licensee MDPI, Basel, Switzerland. This article is an open access article distributed under the terms and conditions of the Creative Commons Attribution (CC BY) license (https://creativecommons.org/licenses/by/4.0/).


