
Data Reliability in a Citizen Science Protocol for Monitoring Stingless Bees Flight Activity

 ,
,  ,
,  , , ,
, , ,  and
and
Abstract
:Simple Summary
Abstract
1. Introduction
2. Material and Methods
Data Analysis
3. Results
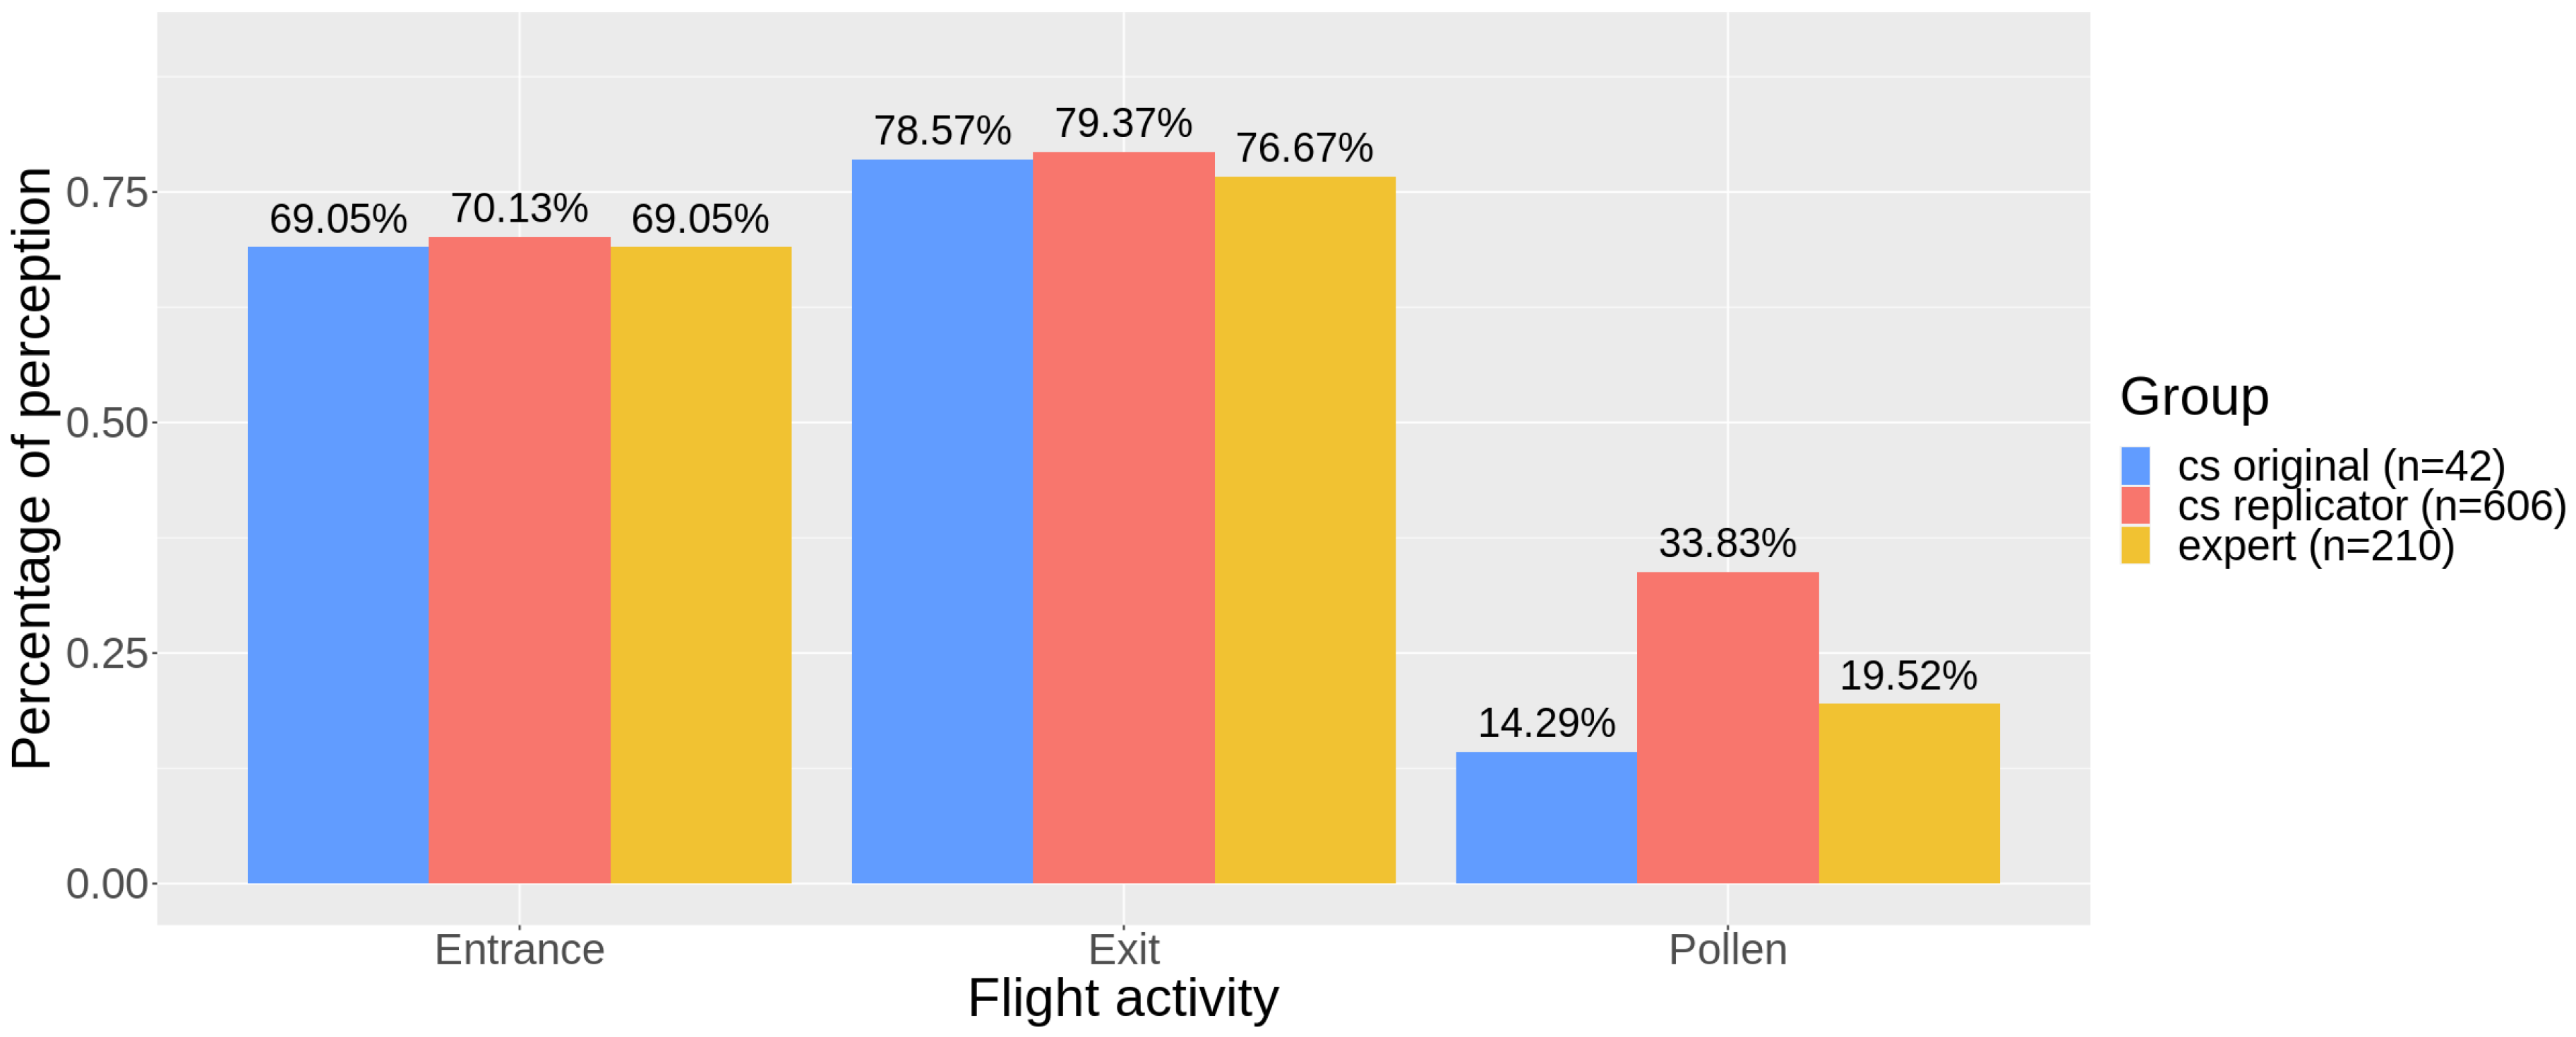
3.1. Perception and Effective Countings
3.2. Accuracy
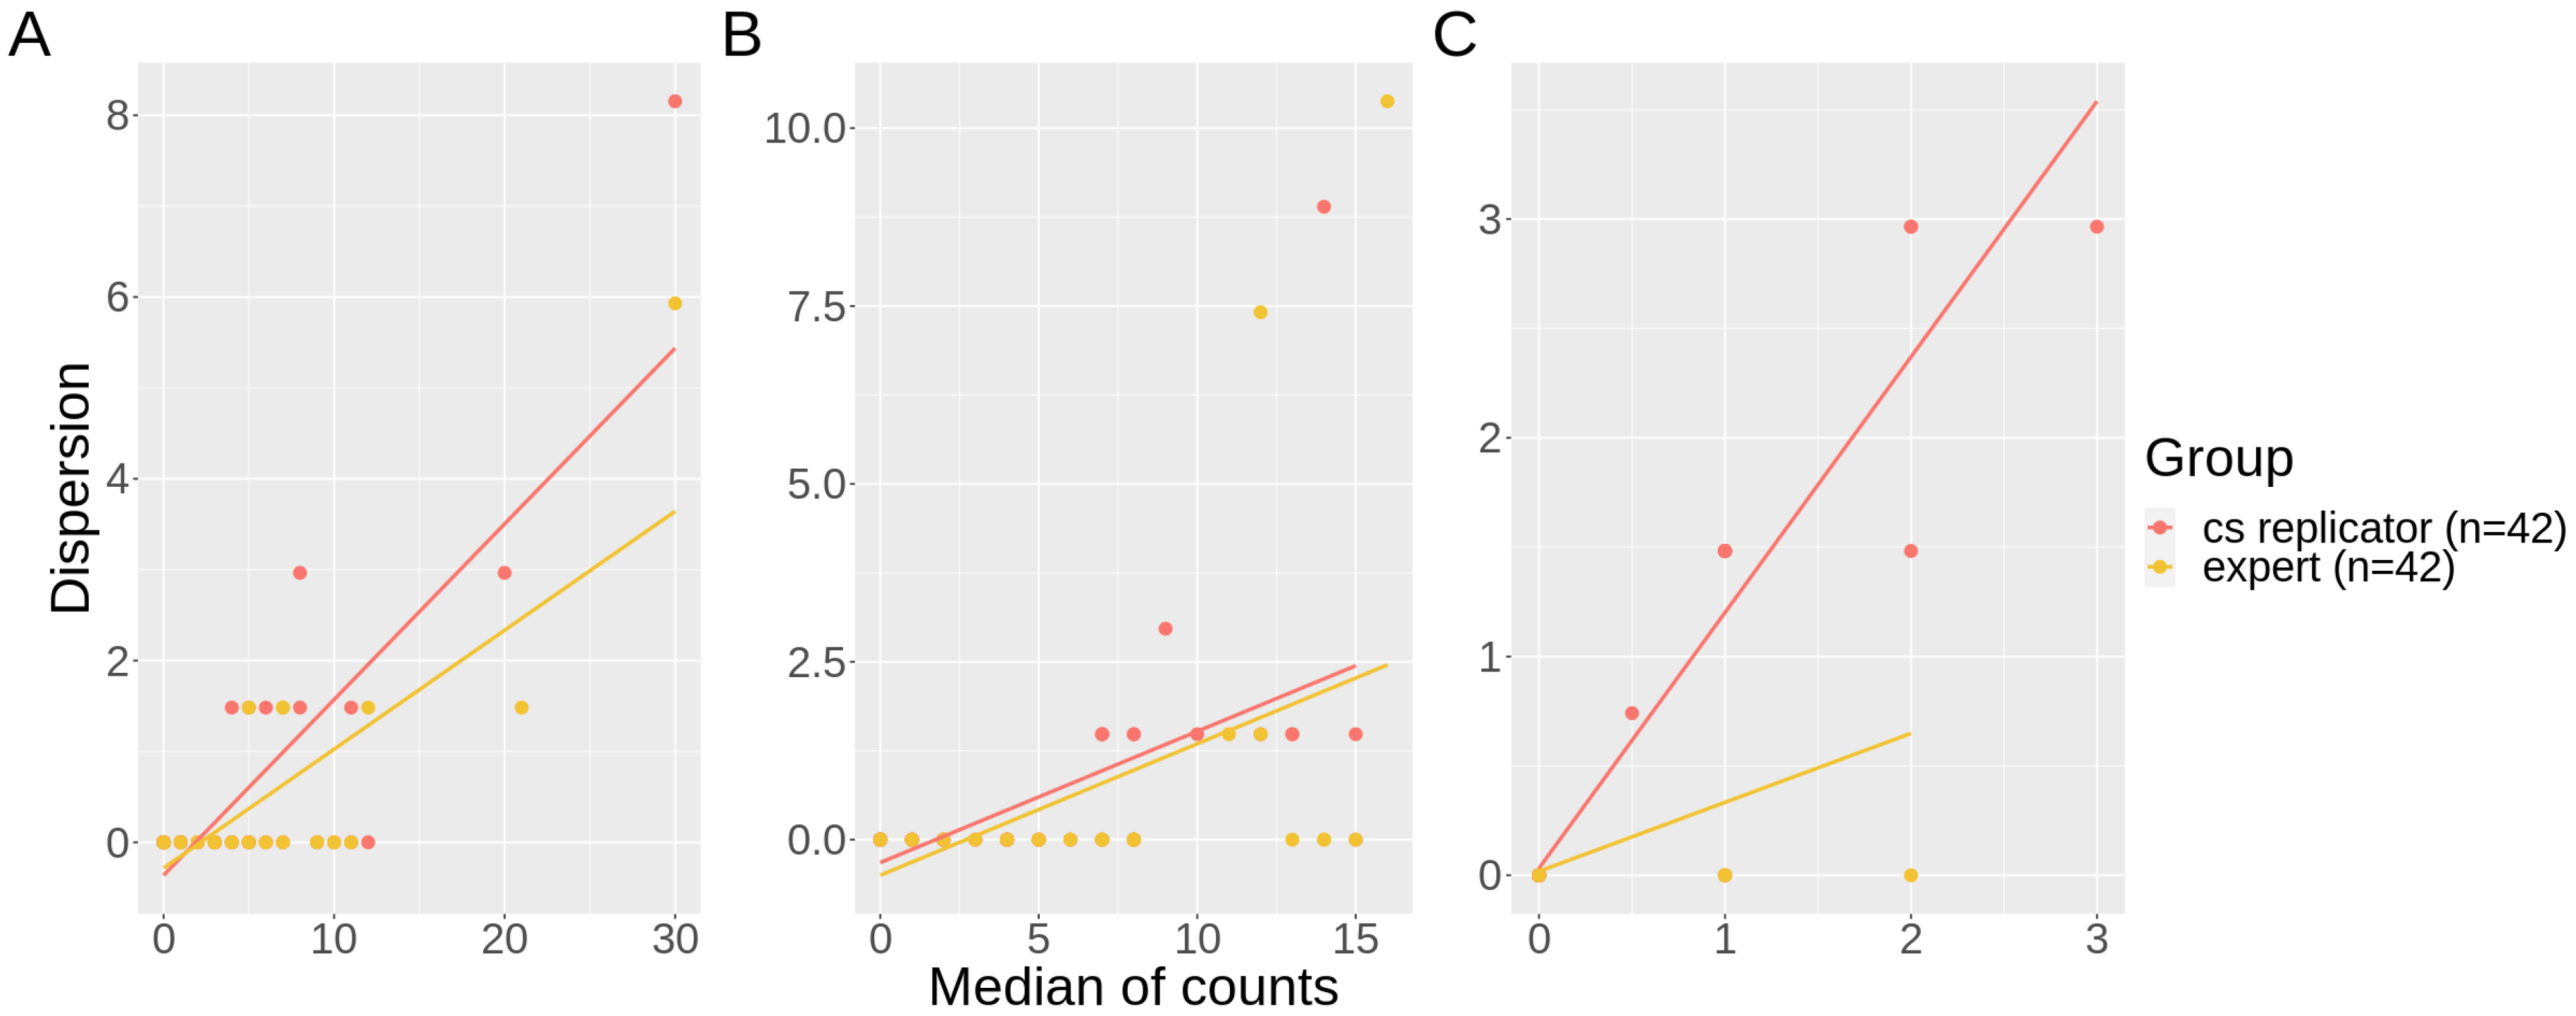
3.3. Precision
4. Discussion
5. Conclusions
Supplementary Materials
Author Contributions
Funding
Institutional Review Board Statement
Informed Consent Statement
Data Availability Statement
Acknowledgments
Conflicts of Interest
Abbreviations
| CS | Citizen Science |
| cs | Citizen Scientist |
| Df | Degrees of Freedom |
| DQ | Data Quality |
| FPS | Frames per Second |
| GLMER | Generalized Linear Mixed-Effects Model |
| MAD | Median Absolute Deviation |
| MSE | Mean Square Error |
| MSSIM | Mean Structural SIMilarity |
| PCA | Principal Component Analysis |
| PSNR | Peak Signal-to-Noise Ratio |
| QA | Quality Assurance |
| QC | Quality Control |
| sd | Standard Deviation |
| SE | Standard Error |
References
- Bonney, R.; Ballard, H.; Jordan, R.; McCallie, E.; Phillips, T.; Shirk, J.; Wilderman, C.C. Public Participation in Scientific Research: Defining the Field and Assessing Its Potential for Informal Science Education; A CAISE Inquiry Group Report. Online Submission; Center for Advancement of Informal Science Education (CAISE): Washington, DC, USA, 2009. [Google Scholar]
- Wiggins, A.; Crowston, K. From Conservation to Crowdsourcing: A Typology of Citizen Science. In Proceedings of the 2011 44th Hawaii International Conference on System Sciences, Kauai, HI, USA, 4–7 January 2011; pp. 1–10. [Google Scholar] [CrossRef] [Green Version]
- Theobald, E.J.; Ettinger, A.K.; Burgess, H.K.; DeBey, L.B.; Schmidt, N.R.; Froehlich, H.E.; Wagner, C.; HilleRisLambers, J.; Tewksbury, J.; Harsch, M.A.; et al. Global change and local solutions: Tapping the unrealized potential of citizen science for biodiversity research. Biol. Conserv. 2015, 181, 236–244. [Google Scholar] [CrossRef] [Green Version]
- Chandler, M.; See, L.; Copas, K.; Bonde, A.M.; López, B.C.; Danielsen, F.; Legind, J.K.; Masinde, S.; Miller-Rushing, A.J.; Newman, G.; et al. Contribution of citizen science towards international biodiversity monitoring. Biol. Conserv. 2017, 213, 280–294. [Google Scholar] [CrossRef] [Green Version]
- Fritz, S.; See, L.; Carlson, T.; Haklay, M.M.; Oliver, J.L.; Fraisl, D.; Mondardini, R.; Brocklehurst, M.; Shanley, L.A.; Schade, S.; et al. Citizen science and the United Nations sustainable development goals. Nat. Sustain. 2019, 2, 922–930. [Google Scholar] [CrossRef]
- Pipino, L.L.; Lee, Y.W.; Wang, R.Y. Data Quality Assessment. Commun. ACM 2002, 45, 211–218. [Google Scholar] [CrossRef]
- United States Environmental Protection Agency. Guidance for Data Quality Assessment: Practical Methods for Data Analysis EPA QA/G-9 (QA00 Update); United States Environmental Protection Agency: Washington, DC, USA, 2000.
- Kosmala, M.; Wiggins, A.; Swanson, A.; Simmons, B. Assessing data quality in citizen science. Front. Ecol. Environ. 2016, 14, 551–560. [Google Scholar] [CrossRef] [Green Version]
- Ottinger, G. Buckets of resistance: Standards and the effectiveness of citizen science. Sci. Technol. Hum. Values 2010, 35, 244–270. [Google Scholar] [CrossRef]
- Zhang, G.; Zhu, A.X. The representativeness and spatial bias of volunteered geographic information: A review. Ann. GIS 2018, 24, 151–162. [Google Scholar] [CrossRef]
- Fowler, A.; Whyatt, J.D.; Davies, G.; Ellis, R. How reliable are citizen-derived scientific data? Assessing the quality of contrail observations made by the general public. Trans. GIS 2013, 17, 488–506. [Google Scholar] [CrossRef]
- Lewandowski, E.; Specht, H. Influence of volunteer and project characteristics on data quality of biological surveys. Conserv. Biol. 2015, 29, 713–723. [Google Scholar] [CrossRef]
- Callaghan, C.; Lyons, M.; Martin, J.; Major, R.; Kingsford, R. Assessing the reliability of avian biodiversity measures of urban greenspaces using eBird citizen science data. Avian Conserv. Ecol. 2017, 12, 12. [Google Scholar] [CrossRef] [Green Version]
- Steinke, J.; van Etten, J.; Zelan, P.M. The accuracy of farmer-generated data in an agricultural citizen science methodology. Agron. Sustain. Dev. 2017, 37, 32. [Google Scholar] [CrossRef] [Green Version]
- Gardiner, M.M.; Allee, L.L.; Brown, P.M.; Losey, J.E.; Roy, H.E.; Smyth, R.R. Lessons from lady beetles: Accuracy of monitoring data from US and UK citizen-science programs. Front. Ecol. Environ. 2012, 10, 471–476. [Google Scholar] [CrossRef] [Green Version]
- Swanson, A.; Kosmala, M.; Lintott, C.; Packer, C. A generalized approach for producing, quantifying, and validating citizen science data from wildlife images. Conserv. Biol. 2016, 30, 520–531. [Google Scholar] [CrossRef]
- Fuccillo, K.K.; Crimmins, T.M.; de Rivera, C.E.; Elder, T.S. Assessing accuracy in citizen science-based plant phenology monitoring. Int. J. Biometeorol. 2015, 59, 917–926. [Google Scholar] [CrossRef] [PubMed]
- Ratnieks, F.L.; Schrell, F.; Sheppard, R.C.; Brown, E.; Bristow, O.E.; Garbuzov, M. Data reliability in citizen science: Learning curve and the effects of training method, volunteer background and experience on identification accuracy of insects visiting ivy flowers. Methods Ecol. Evol. 2016, 7, 1226–1235. [Google Scholar] [CrossRef]
- van der Velde, T.; Milton, D.A.; Lawson, T.; Wilcox, C.; Lansdell, M.; Davis, G.; Perkins, G.; Hardesty, B.D. Comparison of marine debris data collected by researchers and citizen scientists: Is citizen science data worth the effort? Biol. Conserv. 2017, 208, 127–138. [Google Scholar] [CrossRef]
- Alabri, A.; Hunter, J. Enhancing the quality and trust of citizen science data. In Proceedings of the 2010 IEEE Sixth International Conference on E-Science, Brisbane, QLD, Australia, 7–10 December 2010; pp. 81–88. [Google Scholar]
- Yu, J.; Wong, W.K.; Hutchinson, R.A. Modeling experts and novices in citizen science data for species distribution modeling. In Proceedings of the 2010 IEEE International Conference on Data Mining, Sydney, NSW, Australia, 13–17 December 2010; pp. 1157–1162. [Google Scholar]
- Tweddle, J.C.; Robinson, L.D.; Pocock, M.; Roy, H.E. Guide to Citizen Science: Developing, Implementing and Evaluating Citizen Science to Study Biodiversity and the Environment in the UK; NERC/Centre for Ecology & Hydrology: Wallingford, UK, 2012. [Google Scholar]
- Freitag, A.; Meyer, R.; Whiteman, L. Strategies employed by citizen science programs to increase the credibility of their data. Citiz. Sci. Theory Pract. 2016, 1, 2. [Google Scholar] [CrossRef] [Green Version]
- Bonter, D.N.; Cooper, C.B. Data validation in citizen science: A case study from Project FeederWatch. Front. Ecol. Environ. 2012, 10, 305–307. [Google Scholar] [CrossRef]
- Follett, R.; Strezov, V. An analysis of citizen science based research: Usage and publication patterns. PLoS ONE 2015, 10, e0143687. [Google Scholar] [CrossRef] [PubMed] [Green Version]
- Kelling, S.; Johnston, A.; Hochachka, W.M.; Iliff, M.; Fink, D.; Gerbracht, J.; Lagoze, C.; La Sorte, F.A.; Moore, T.; Wiggins, A.; et al. Can observation skills of citizen scientists be estimated using species accumulation curves? PLoS ONE 2015, 10, e0139600. [Google Scholar] [CrossRef] [PubMed] [Green Version]
- Aceves-Bueno, E.; Adeleye, A.M.S.; Feraud, M.; Huang, Y.; Tao, M.; Yang, Y.; Anderson, S.E. The accuracy of citizen science data: A quantitative review. Bull. Ecol. Soc. Am. 2017, 98, 278–290. [Google Scholar] [CrossRef] [Green Version]
- Koffler, S.; Barbiéri, C.; Ghilardi-Lopes, N.P.; Leocadio, J.N.; Albertini, B.; Francoy, T.M.; Saraiva, A.M. A buzz for sustainability and conservation: The growing potential of citizen science studies on bees. Sustainability 2021, 13, 959. [Google Scholar] [CrossRef]
- Wolowski, M.; Agostini, K.; Rech, A.; Varassin, I.; Maués, M.; Freitas, L.; Carneiro, L.; BUENO, R.d.O.; Consolaro, H.; Carvalheiro, L.; et al. Relatório Temático Sobre Polinização, Polinizadores e Produção de Alimentos No Brasil; Editora Cubo: São Carlos, Brazil, 2019. [Google Scholar]
- Cortopassi-Laurino, M.; Imperatriz-Fonseca, V.L.; Roubik, D.W.; Dollin, A.; Heard, T.; Aguilar, I.; Venturieri, G.C.; Eardley, C.; Nogueira-Neto, P. Global meliponiculture: Challenges and opportunities. Apidologie 2006, 37, 275–292. [Google Scholar] [CrossRef] [Green Version]
- Jaffé, R.; Pope, N.; Carvalho, A.T.; Maia, U.M.; Blochtein, B.; de Carvalho, C.A.L.; Carvalho-Zilse, G.A.; Freitas, B.M.; Menezes, C.; de Fátima Ribeiro, M.; et al. Bees for development: Brazilian survey reveals how to optimize stingless beekeeping. PLoS ONE 2015, 10, e0121157. [Google Scholar] [CrossRef] [PubMed]
- Ascher, J.S.; Pickering, J. Discover Life Bee Species Guide and World Checklist (Hymenoptera: Apoidea: Anthophila). Available online: http://www.discoverlife.org/mp/20q?guide=Apoidea_species (accessed on 24 August 2021).
- Lemelin, R.H. Entomotourism and the stingless bees of Mexico. J. Ecotourism 2020, 19, 168–175. [Google Scholar] [CrossRef]
- Barbiéri, C.; Francoy, T.M. Theoretical model for interdisciplinary analysis of human activities: Meliponiculture as an activity that promotes sustainability. Ambiente Soc. 2020, 23, 1–19. [Google Scholar] [CrossRef]
- Gray, A.; Adjlane, N.; Arab, A.; Ballis, A.; Brusbardis, V.; Charrière, J.D.; Chlebo, R.; Coffey, M.F.; Cornelissen, B.; Amaro da Costa, C.; et al. Honey bee colony winter loss rates for 35 countries participating in the COLOSS survey for winter 2018–2019, and the effects of a new queen on the risk of colony winter loss. J. Apic. Res. 2020, 59, 744–751. [Google Scholar] [CrossRef]
- Gary, N.E. A method for evaluating honey bee flight activity at the hive entrance. J. Econ. Entomol. 1967, 60, 102–105. [Google Scholar] [CrossRef]
- Wang, Z.; Bovik, A.C.; Sheikh, H.R.; Simoncelli, E.P. Image quality assessment: From error visibility to structural similarity. IEEE Trans. Image Process. 2004, 13, 600–612. [Google Scholar] [CrossRef] [Green Version]
- Lin, D.C.C.; Chau, P.M. Objective human visual system based video quality assessment metric for low bit-rate video communication systems. In Proceedings of the 2006 IEEE Workshop on Multimedia Signal Processing, Victoria, BC, Canada, 3–6 October 2006; pp. 320–323. [Google Scholar]
- Wood, S.A.; Robinson, P.W.; Costa, D.P.; Beltran, R.S. Accuracy and precision of citizen scientist animal counts from drone imagery. PLoS ONE 2021, 16, e0244040. [Google Scholar] [CrossRef]
- R Core Team. R: A Language and Environment for Statistical Computing; R Foundation for Statistical Computing: Vienna, Austria, 2021. [Google Scholar]
- Bieluch, K.H.; Willis, T.; Smith, J.; Wilson, K.A. The complexities of counting fish: Engaging citizen scientists in fish monitoring. Maine Policy Rev. 2017, 26, 9–18. [Google Scholar]
- Wittmann, D. Aerial defense of the nest by workers of the stingless bee Trigona (Tetragonisca) angustula (Latreille) (Hymenoptera: Apidae). Behav. Ecol. Sociobiol. 1985, 16, 111–114. [Google Scholar] [CrossRef]
- Tichit, P.; Alves-dos Santos, I.; Dacke, M.; Baird, E. Accelerated landing in a stingless bee and its unexpected benefits for traffic congestion. Proc. R. Soc. B 2020, 287, 20192720. [Google Scholar] [CrossRef] [PubMed] [Green Version]
- Schmeller, D.S.; HENRY, P.Y.; Julliard, R.; Gruber, B.; Clobert, J.; Dziock, F.; Lengyel, S.; Nowicki, P.; Deri, E.; Budrys, E.; et al. Advantages of volunteer-based biodiversity monitoring in Europe. Conserv. Biol. 2009, 23, 307–316. [Google Scholar] [CrossRef] [PubMed]
- Fanelli, D. How many scientists fabricate and falsify research? A systematic review and meta-analysis of survey data. PLoS ONE 2009, 4, e5738. [Google Scholar] [CrossRef] [Green Version]
- Sewell, D.; Beebee, T.J.; Griffiths, R.A. Optimising biodiversity assessments by volunteers: The application of occupancy modelling to large-scale amphibian surveys. Biol. Conserv. 2010, 143, 2102–2110. [Google Scholar] [CrossRef]
- Hochachka, W.M.; Fink, D.; Hutchinson, R.A.; Sheldon, D.; Wong, W.K.; Kelling, S. Data-intensive science applied to broad-scale citizen science. Trends Ecol. Evol. 2012, 27, 130–137. [Google Scholar] [CrossRef]
- Miller, D.A.; Weir, L.A.; McClintock, B.T.; Grant, E.H.C.; Bailey, L.L.; Simons, T.R. Experimental investigation of false positive errors in auditory species occurrence surveys. Ecol. Appl. 2012, 22, 1665–1674. [Google Scholar] [CrossRef] [PubMed]
- Soul, L.C.; Barclay, R.S.; Bolton, A.; Wing, S.L. Fossil Atmospheres: A case study of citizen science in question-driven palaeontological research. Philos. Trans. R. Soc. B 2019, 374, 20170388. [Google Scholar] [CrossRef] [Green Version]
- Hurlbert, A.H.; Hayes, T.E.; McKinnon, T.N.; Goforth, C.L. Caterpillars Count! A citizen science project for monitoring foliage arthropod abundance and phenology. Citiz. Sci. Theory Pract. 2019, 4, 1–12. [Google Scholar] [CrossRef] [Green Version]
- Elliott, K.C.; Rosenberg, J. Philosophical foundations for citizen science. Citiz. Sci. Theory Pract. 2019, 4, 9. [Google Scholar] [CrossRef] [Green Version]
- Grüter, C.; Menezes, C.; Imperatriz-Fonseca, V.L.; Ratnieks, F.L. A morphologically specialized soldier caste improves colony defense in a neotropical eusocial bee. Proc. Natl. Acad. Sci. USA 2012, 109, 1182–1186. [Google Scholar] [CrossRef] [Green Version]
- Fehri, R.; Khlifi, S.; Vanclooster, M. Testing a citizen science water monitoring approach in Tunisia. Environ. Sci. Policy 2020, 104, 67–72. [Google Scholar] [CrossRef]
- Crall, A.W.; Newman, G.J.; Stohlgren, T.J.; Holfelder, K.A.; Graham, J.; Waller, D.M. Assessing citizen science data quality: An invasive species case study. Conserv. Lett. 2011, 4, 433–442. [Google Scholar] [CrossRef]
- Foster-Smith, J.; Evans, S.M. The value of marine ecological data collected by volunteers. Biol. Conserv. 2003, 113, 199–213. [Google Scholar] [CrossRef]
- Hunter, J.; Alabri, A.; van Ingen, C. Assessing the quality and trustworthiness of citizen science data. Concurr. Comput. Pract. Exp. 2013, 25, 454–466. [Google Scholar] [CrossRef]
- Geoghegan, H.; Dyke, A.; Pateman, R.; West, S.; Everett, G. Understanding Motivations for Citizen Science; Final Report on Behalf of UKEOF, University of Reading, Stockholm Environment Institute (University of York) and University of the West of England; UKEOF: Wiltshire, UK, 2016. [Google Scholar]
- Bain, R. Citizen science and statistics: Playing a part. Significance 2016, 13, 16–21. [Google Scholar] [CrossRef] [Green Version]
- Surowiecki, J. The Wisdom of Crowds; Anchor: New York, NY, USA, 2005. [Google Scholar]
- Torre, M.; Nakayama, S.; Tolbert, T.J.; Porfiri, M. Producing knowledge by admitting ignorance: Enhancing data quality through an “I don’t know” option in citizen science. PLoS ONE 2019, 14, e0211907. [Google Scholar] [CrossRef]
- Bird, T.J.; Bates, A.E.; Lefcheck, J.S.; Hill, N.A.; Thomson, R.J.; Edgar, G.J.; Stuart-Smith, R.D.; Wotherspoon, S.; Krkosek, M.; Stuart-Smith, J.F.; et al. Statistical solutions for error and bias in global citizen science datasets. Biol. Conserv. 2014, 173, 144–154. [Google Scholar] [CrossRef] [Green Version]
- Silvertown, J. A new dawn for citizen science. Trends Ecol. Evol. 2009, 24, 467–471. [Google Scholar] [CrossRef]
- Krabbenhoft, C.A.; Kashian, D.R. Citizen science data are a reliable complement to quantitative ecological assessments in urban rivers. Ecol. Indic. 2020, 116, 106476. [Google Scholar] [CrossRef]


| Response | Starting Model | Fixed Effect Removed | Df | p-Value | |||
|---|---|---|---|---|---|---|---|
| Replication | Perception | entrance | group + video quality | group | 0.156 | 1 | 0.693 |
| video quality | video quality | 0.045 | 1 | 0.832 | |||
| exit | group + video quality | group | 0.356 | 1 | 0.551 | ||
| video quality | video quality | 0.065 | 1 | 0.799 | |||
| pollen | group + video quality | group | 10.852 | 1 | 0.001 * | ||
| group + video quality | video quality | 0.064 | 1 | 0.801 | |||
| group | group | 10.857 | 1 | 0.001 * | |||
| Count | entrance | group + video quality | group | 1.674 | 1 | 0.196 | |
| video quality | video quality | 0.003 | 1 | 0.957 | |||
| exit | group + video quality | group | 0.658 | 1 | 0.417 | ||
| video quality | video quality | 0.001 | 1 | 0.981 | |||
| pollen | group + video quality | group | 1.367 | 1 | 0.242 | ||
| video quality | video quality | 0.063 | 1 | 0.802 | |||
| Validation | Perception | entrance | group + video quality | group | 0.516 | 1 | 0.472 |
| video quality | video quality | 0.056 | 1 | 0.812 | |||
| exit | group + video quality | group | 0.592 | 1 | 0.442 | ||
| video quality | video quality | 0.003 | 1 | 0.958 | |||
| pollen | group + video quality | group | 22.325 | 1 | 0.001 * | ||
| group + video quality | video quality | 0.077 | 1 | 0.781 | |||
| group | group | 22.330 | 1 | 0.001 * | |||
| Count | entrance | group + video quality | group | 0.039 | 1 | 0.843 | |
| video quality | video quality | 0.038 | 1 | 0.845 | |||
| exit | group + video quality | group | 0.035 | 1 | 0.851 | ||
| video quality | video quality | 0.001 | 1 | 0.981 | |||
| pollen | group + video quality | group | 0.315 | 1 | 0.575 | ||
| video quality | video quality | 0.219 | 1 | 0.640 |
| Model | Comparison | Predictor | Estimate | SE | Pr(>|z|) | Odds/Odds Ratio |
|---|---|---|---|---|---|---|
| Pollen perception | Replication | cs original (intercept) | −2.7561 | 0.333 | <0.001 | 0.06 |
| cs replicators | 1.5332 | 0.508 | 0.003 | 4.63 | ||
| Validation | experts (intercept) | −2.3004 | 0.344 | <0.001 | 0.1 | |
| cs replicators | 1.0529 | 0.229 | <0.001 | 2.87 |
Publisher’s Note: MDPI stays neutral with regard to jurisdictional claims in published maps and institutional affiliations. |
© 2021 by the authors. Licensee MDPI, Basel, Switzerland. This article is an open access article distributed under the terms and conditions of the Creative Commons Attribution (CC BY) license (https://creativecommons.org/licenses/by/4.0/).
Share and Cite
Leocadio, J.N.; Ghilardi-Lopes, N.P.; Koffler, S.; Barbiéri, C.; Francoy, T.M.; Albertini, B.; Saraiva, A.M. Data Reliability in a Citizen Science Protocol for Monitoring Stingless Bees Flight Activity. Insects 2021, 12, 766. https://doi.org/10.3390/insects12090766
Leocadio JN, Ghilardi-Lopes NP, Koffler S, Barbiéri C, Francoy TM, Albertini B, Saraiva AM. Data Reliability in a Citizen Science Protocol for Monitoring Stingless Bees Flight Activity. Insects. 2021; 12(9):766. https://doi.org/10.3390/insects12090766
Chicago/Turabian StyleLeocadio, Jailson N., Natalia P. Ghilardi-Lopes, Sheina Koffler, Celso Barbiéri, Tiago M. Francoy, Bruno Albertini, and Antonio M. Saraiva. 2021. "Data Reliability in a Citizen Science Protocol for Monitoring Stingless Bees Flight Activity" Insects 12, no. 9: 766. https://doi.org/10.3390/insects12090766
APA StyleLeocadio, J. N., Ghilardi-Lopes, N. P., Koffler, S., Barbiéri, C., Francoy, T. M., Albertini, B., & Saraiva, A. M. (2021). Data Reliability in a Citizen Science Protocol for Monitoring Stingless Bees Flight Activity. Insects, 12(9), 766. https://doi.org/10.3390/insects12090766