Article

Age and Behavior-Dependent Differential miRNAs Expression in the Hypopharyngeal Glands of Honeybees (Apis mellifera L.)

1
School of Plant Protection, Anhui Agricultural University, Hefei 230036, China
2
School of Animal Science and Technology, Anhui Agricultural University, Hefei 230036, China
*
Author to whom correspondence should be addressed.
These authors contributed equally to this work.
Insects 2021, 12(9), 764; https://doi.org/10.3390/insects12090764
Submission received: 17 July 2021 / Revised: 13 August 2021 / Accepted: 21 August 2021 / Published: 26 August 2021
(This article belongs to the Special Issue Insect Genomics)

Abstract

:

Simple Summary

The hypopharyngeal glands (HPGs) are a pair of aciniform glands that are located in the frontal area of the heads of worker bees (Apis mellifera L.) that exhibit age and behavior-dependent development. Little is known about whether/how miRNAs regulate the HPGs development. In this study, small RNA sequencing was employed to analyze the miRNA profiles of HPGs in newly-emerged bees (NEB), nurse bees (NB), and forager bees (FB). We found that there were a total of 31 known miRNAs differentially expressed among the three stages, which might have regulatory roles in the growth and development, protein synthesis, and carbohydrate and energy metabolism in the HPGs. Additionally, the downregulation of ame-miR-184-3p and ame-miR-252a-5p in nurse bees may be involved in royal jelly secretion, while the lower expression of ame-miR-11-3p and ame-miR-281-3p in forager bees are responsible for honey processing.

Abstract

This study aims to investigate the expression differences of miRNAs in the hypopharyngeal glands (HPGs) of honeybees at three developmental stages and to explore their regulation functions in the HPGs development. Small RNA sequencing was employed to analyze the miRNA profiles of HPGs in newly-emerged bees (NEB), nurse bees (NB), and forager bees (FB). Results showed that a total of 153 known miRNAs were found in the three stages, and ame-miR-276-3p, ame-miR-375-3p, ame-miR-14-3p, ame-miR-275-3p, and ame-miR-3477-5p were the top five most abundant ones. Furthermore, the expression of 11 miRNAs, 17 miRNAs, and 18 miRNAs were significantly different in NB vs. FB comparison, NB vs. NEB comparison, and in FB vs. NEB comparison, respectively, of which ame-miR-184-3p and ame-miR-252a-5p were downregulated in NB compared with that in both the FB and NEB, while ame-miR-11-3p, ame-miR-281-3p, and ame-miR-31a-5p had lower expression levels in FB compared with that in both the NB and NEB. Bioinformatic analysis showed that the potential target genes of the differentially expressed miRNAs (DEMs) were mainly enriched in several key signaling pathways, including mTOR signaling pathway, MAPK signaling pathway-fly, FoxO signaling pathway, Hippo signaling pathway-fly. Overall, our study characterized the miRNA profiles in the HPGs of honeybees at three different developmental stages and provided a basis for further study of the roles of miRNAs in HPGs development.

1. Introduction

Honeybees (Apis mellifera L.) are eusocial insects, and a typical colony consists of three castes, including queen, drones, and worker bees. Amongst those, worker bees are the predominant ones that exhibit a complex age-dependent division of labor [1]. In general, within the first two weeks after emergence, the worker bees mainly perform tasks inside the hive, such as brood and queen rearing (nurse bees). After that, most of the worker bees will grow into foragers, which are responsible for collecting pollen and nectar outside the hive [2].
The structure and function of some glands, such as hypopharyngeal glands (HPGs), which are a pair of aciniform glands that are located in the frontal area of the heads of worker bees, will change accompanying the role change of bees [3,4]. In young bees within six days after eclosion, the HPGs are small and have no secretory activity [5]. However, the HPGs of 6–15-day-old nurse bees are well-developed and have strong ability to biosynthesize and secrete royal jelly (RJ), which is the primary food for queen and young larvae [6,7,8]. However, when the worker bees mature into foragers, this gland almost shrinks, but it can also produce various carbohydrate-metabolizing enzymes, such as α-glucosidase III, α-amylase, and glucose oxidase, which are used for honey processing [7,9,10,11].
Previous studies have demonstrated that age and behavior-dependent physiological and functional changes of HPGs are closely associated with differential gene expression in honeybees [12,13]. Liu et al. (2014) carried out a digital gene expression analysis of HPGs of two bee species, A. mellifera and A. cerana at three developmental stages (newly emerged bees, nurses, and foragers), and they found that there were 1482 genes in A. mellifera and 1313 genes in A. cerana differentially expressed among the three stages, respectively [14]. To identify the molecular basis of RJ production, Nie et al. (2020) recently compared the transcriptome of HPGs between nurses and foragers at the same age. Their results showed that 510 upregulated genes in nurse bees related to translation, transcription, DNA replication, and energy metabolism were strongly involved with the secretion of RJ. However, related studies on non-coding RNAs (ncRNAs) expression, such as miRNAs expression, are still elusive [15].
MicroRNA (miRNA) is a class of small (18–24 nt), single-strand, and endogenous ncRNA that plays important roles in the post-transcriptional regulation of target gene expression [16,17] related to various biological processes, such as tissue development [18]. Previous studies on honeybee miRNAs revealed their key roles in mediating diverse physiological processes, such as caste differentiation [19,20], division of labor [21,22], memory formation [23,24], queen reproductive performance [25,26], immune defense [27,28], and embryonic and midgut development [29,30]. However, little is known about whether/how miRNAs regulate the HPGs development in worker bees.
To identify the association between differential miRNAs expression and the age and behavior-dependent HPGs development, small RNA sequencing (sRNA-seq) was conducted to analyze the miRNA profiles of HPGs in worker bees at three different developmental stages (newly emerged bees, nurses, and foragers). Our results uncovered that the differentially expressed miRNAs have regulatory roles in growth and development, protein synthesis, and carbohydrate and energy metabolism in the HPGs of honeybees.

2. Materials and Methods

2.1. Honeybees and RNA Extraction

The bee samples were collected from three healthy sister-queen honeybee (A. mellifera L.) colonies, which were maintained at the Institute of Apicultural Research, Anhui Agricultural University, Hefei, China (GPS: 31°53′ N, 117°20′ E). The newly-emerged bees (NEB), nurse bees (NB), and forager bees (FB) were collected following the method of Nie et al. [15]. The obtained bees were first narcotized by N2, then we dissected the bee heads and obtained the HPGs on ice. Pools of 10–15 pairs of HPGs from each sample were prepared for total RNA extraction using trizol reagent (Invitrogen, Carlsbad, CA, USA). Additionally, 1.5% agarose gel was used to monitor RNA degradation and contamination, especially DNA contamination. We used the NanoDrop 2000 Spectrophotometer (Thermo Fisher Scientific, Wilmington, NC, USA) to measure RNA concentration and purity. The RNA Nano 6000 Assay Kit was used to assess RNA integrity on Agilent Bioanalyzer 2100 System (Agilent Technologies, Carlsbad, CA, USA).

2.2. Small RNA Sequencing and Analysis

A total of three micrograms of RNA per sample was used to prepare the sequencing sample. Sequencing libraries were generated using NEBNextR UltraR small RNA Sample Library Prep Kit for IlluminaR (New England Biolabs, Beijing, China) following manufacturer’s recommendations, and index codes were added to attribute sequences to each sample. In total, nine sequencing libraries were constructed, and each group (NEB, NB, and FB) contained three libraries. The clustering of the index-coded samples was performed on a cBot Cluster Generation System using TruSeq PE Cluster Kit v4-cBot-HS (Illumina, San Diego, CA, USA) according to the manufacturer’s instructions. After cluster generation, the library preparations were sequenced on an Illumina Hiseq 4000 platform and 1 × 50 bp single-end reads were generated (Illumina). After quality control, the filter ribosomal RNA (rRNA), transfer RNA (tRNA), small nuclear RNA (snRNA), small nucleolar RNA (snoRNA), other ncRNA. and repeat sequences were removed based on high-quality clean reads mapped to Silva database, GtRNAdb database, Rfam database, and Repbase database using Bowtie software [31]. Then, the remaining reads were used to detect known miRNA by comparing with known miRNAs in A. mellifera from miRbase, while RNAfold software [32] was used for novel miRNA secondary structure prediction.

2.3. Differential Expression Analysis

The miRNA expression levels were calculated by transcript per million (TPM). Differential expression analysis between the following comparisons: (1) NB vs. FB, (2) NB vs. NEB, and (3) FB vs. NEB, were calculated by the DESeq R package [33]. The miRNAs with a p-value < 0.01 and |log2-fold change| > 1 were assigned as significantly differentially expressed. The 3′-untranslated region (3′-UTR) sequences from the A. mellifera genome were used to predict the target genes of the differentially expressed miRNAs (DEMs) with miRanda [34] and TargetScan [35] software. The predicted target genes with miranda_energy < −10 or TargetScan_score ≥ 50 were obtained. We extracted the overlapping target genes identified using the two pieces of software. Gene ontology (GO) enrichment analysis of the predicted target genes was implemented by the topGO R package [36], while we used KOBAS software [37] to test the statistical enrichment of predicted target genes in Kyoto Encyclopedia of Genes and Genomes (KEGG) pathways.

2.4. Validation of Known DEMs by qPCR

Ten of the differentially expressed miRNAs (ame-miR-124-3p, ame-miR-184-3p, ame-miR-210-3p, ame-miR-3049-5p, ame-miR-31a-5p, ame-miR-932-5p, ame-miR-993-3p, ame-miR-11-3p, ame-miR-8-3p, and ame-miR-3477-5p) were randomly selected for qPCR validation. One microgram of total RNA was input to obtain the cDNA using the miRcute Plus miRNA First-Strand cDNA Kit (Tiangen, Beijing, China) on a PCR system (Bioer, Hangzhou, China), while qPCR was performed with miRcute Plus miRNA qPCR Kit (SYBR Green) (Tiangen) on a StepOnePlus Real-Time PCR System (Thermo Fisher Scientific). U6 was used as reference gene, and the detailed information of primers used in the present study are listed in Table 1. The relative expression levels of miRNAs were calculated by 2−ΔCT method [38]. The Student’s t-test was used to analyze the differences in miRNAs expression between each of the pairwise comparisons.

3. Results

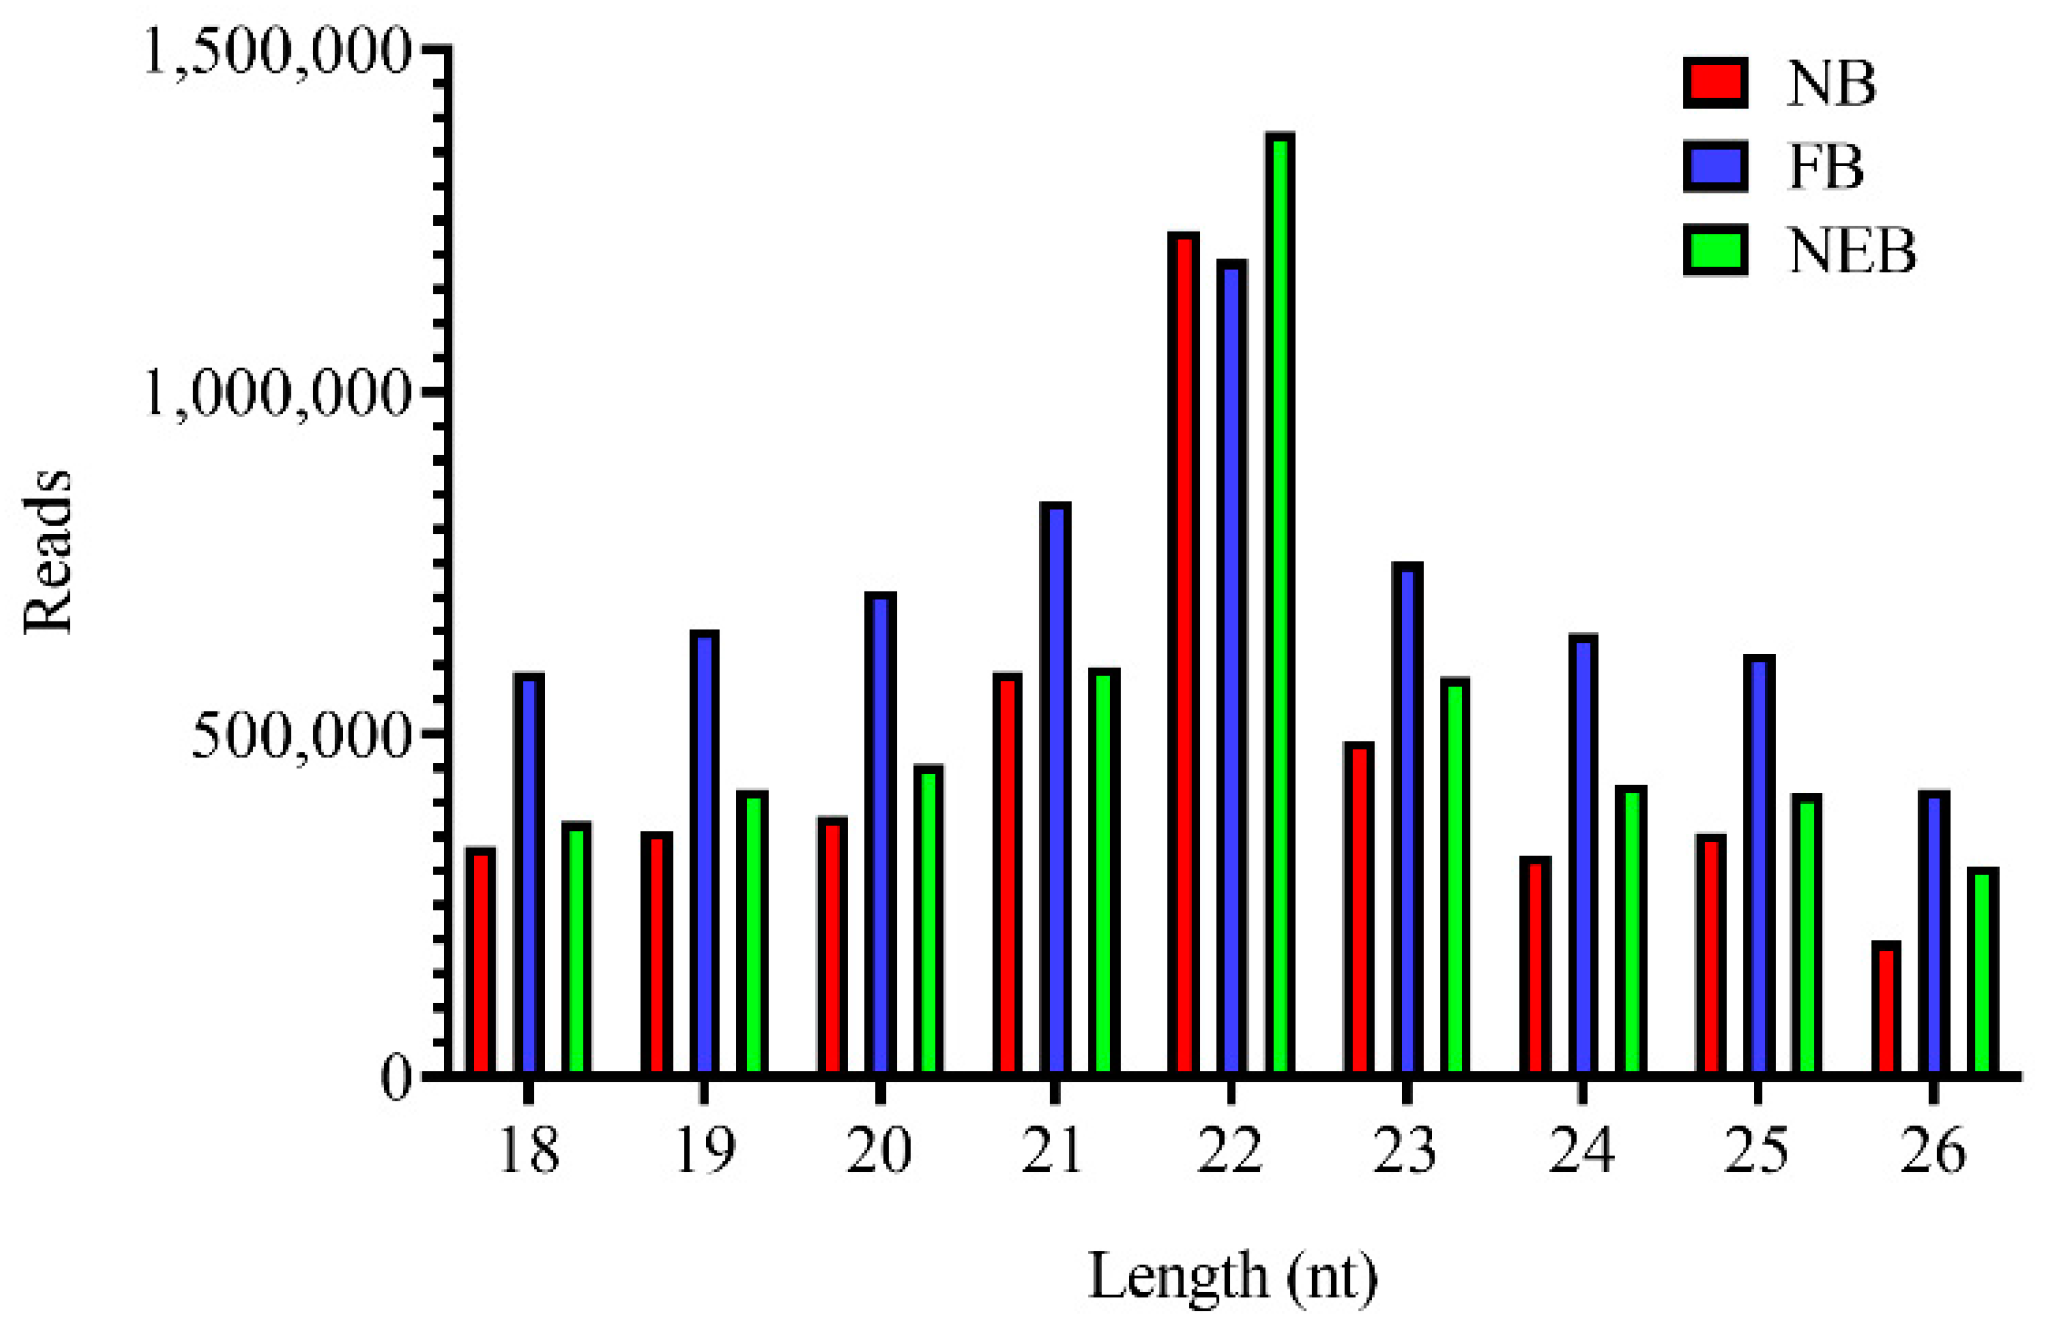
3.1. Small RNA Sequencing Analysis

Using the Illumina Hiseq 4000 platform, nine sRNA libraries were subjected to deep sRNA sequencing. After removing the useless sequences, 3.27 to 6.85 million clean reads were obtained (Table S1). The length distribution of the small RNAs for all three groups peaked at 22 nt, with 16.87% to 31.36% of total clean reads (Figure 1).
After mapping to Silva database, GtRNAdb database, Rfam database, and Repbase database, the clean reads were divided into different categories, and 60.71–72.30% belonged to unique rRNAs, 5.85–15.54% were unique tRNAs, 0.87–2.83% were unique snRNAs, and 0.50–1.47% were unique snoRNAs. On the other hand, the remaining 17.56–20.97% unannotated reads containing miRNAs were used to identify the known miRNAs and novel miRNAs.

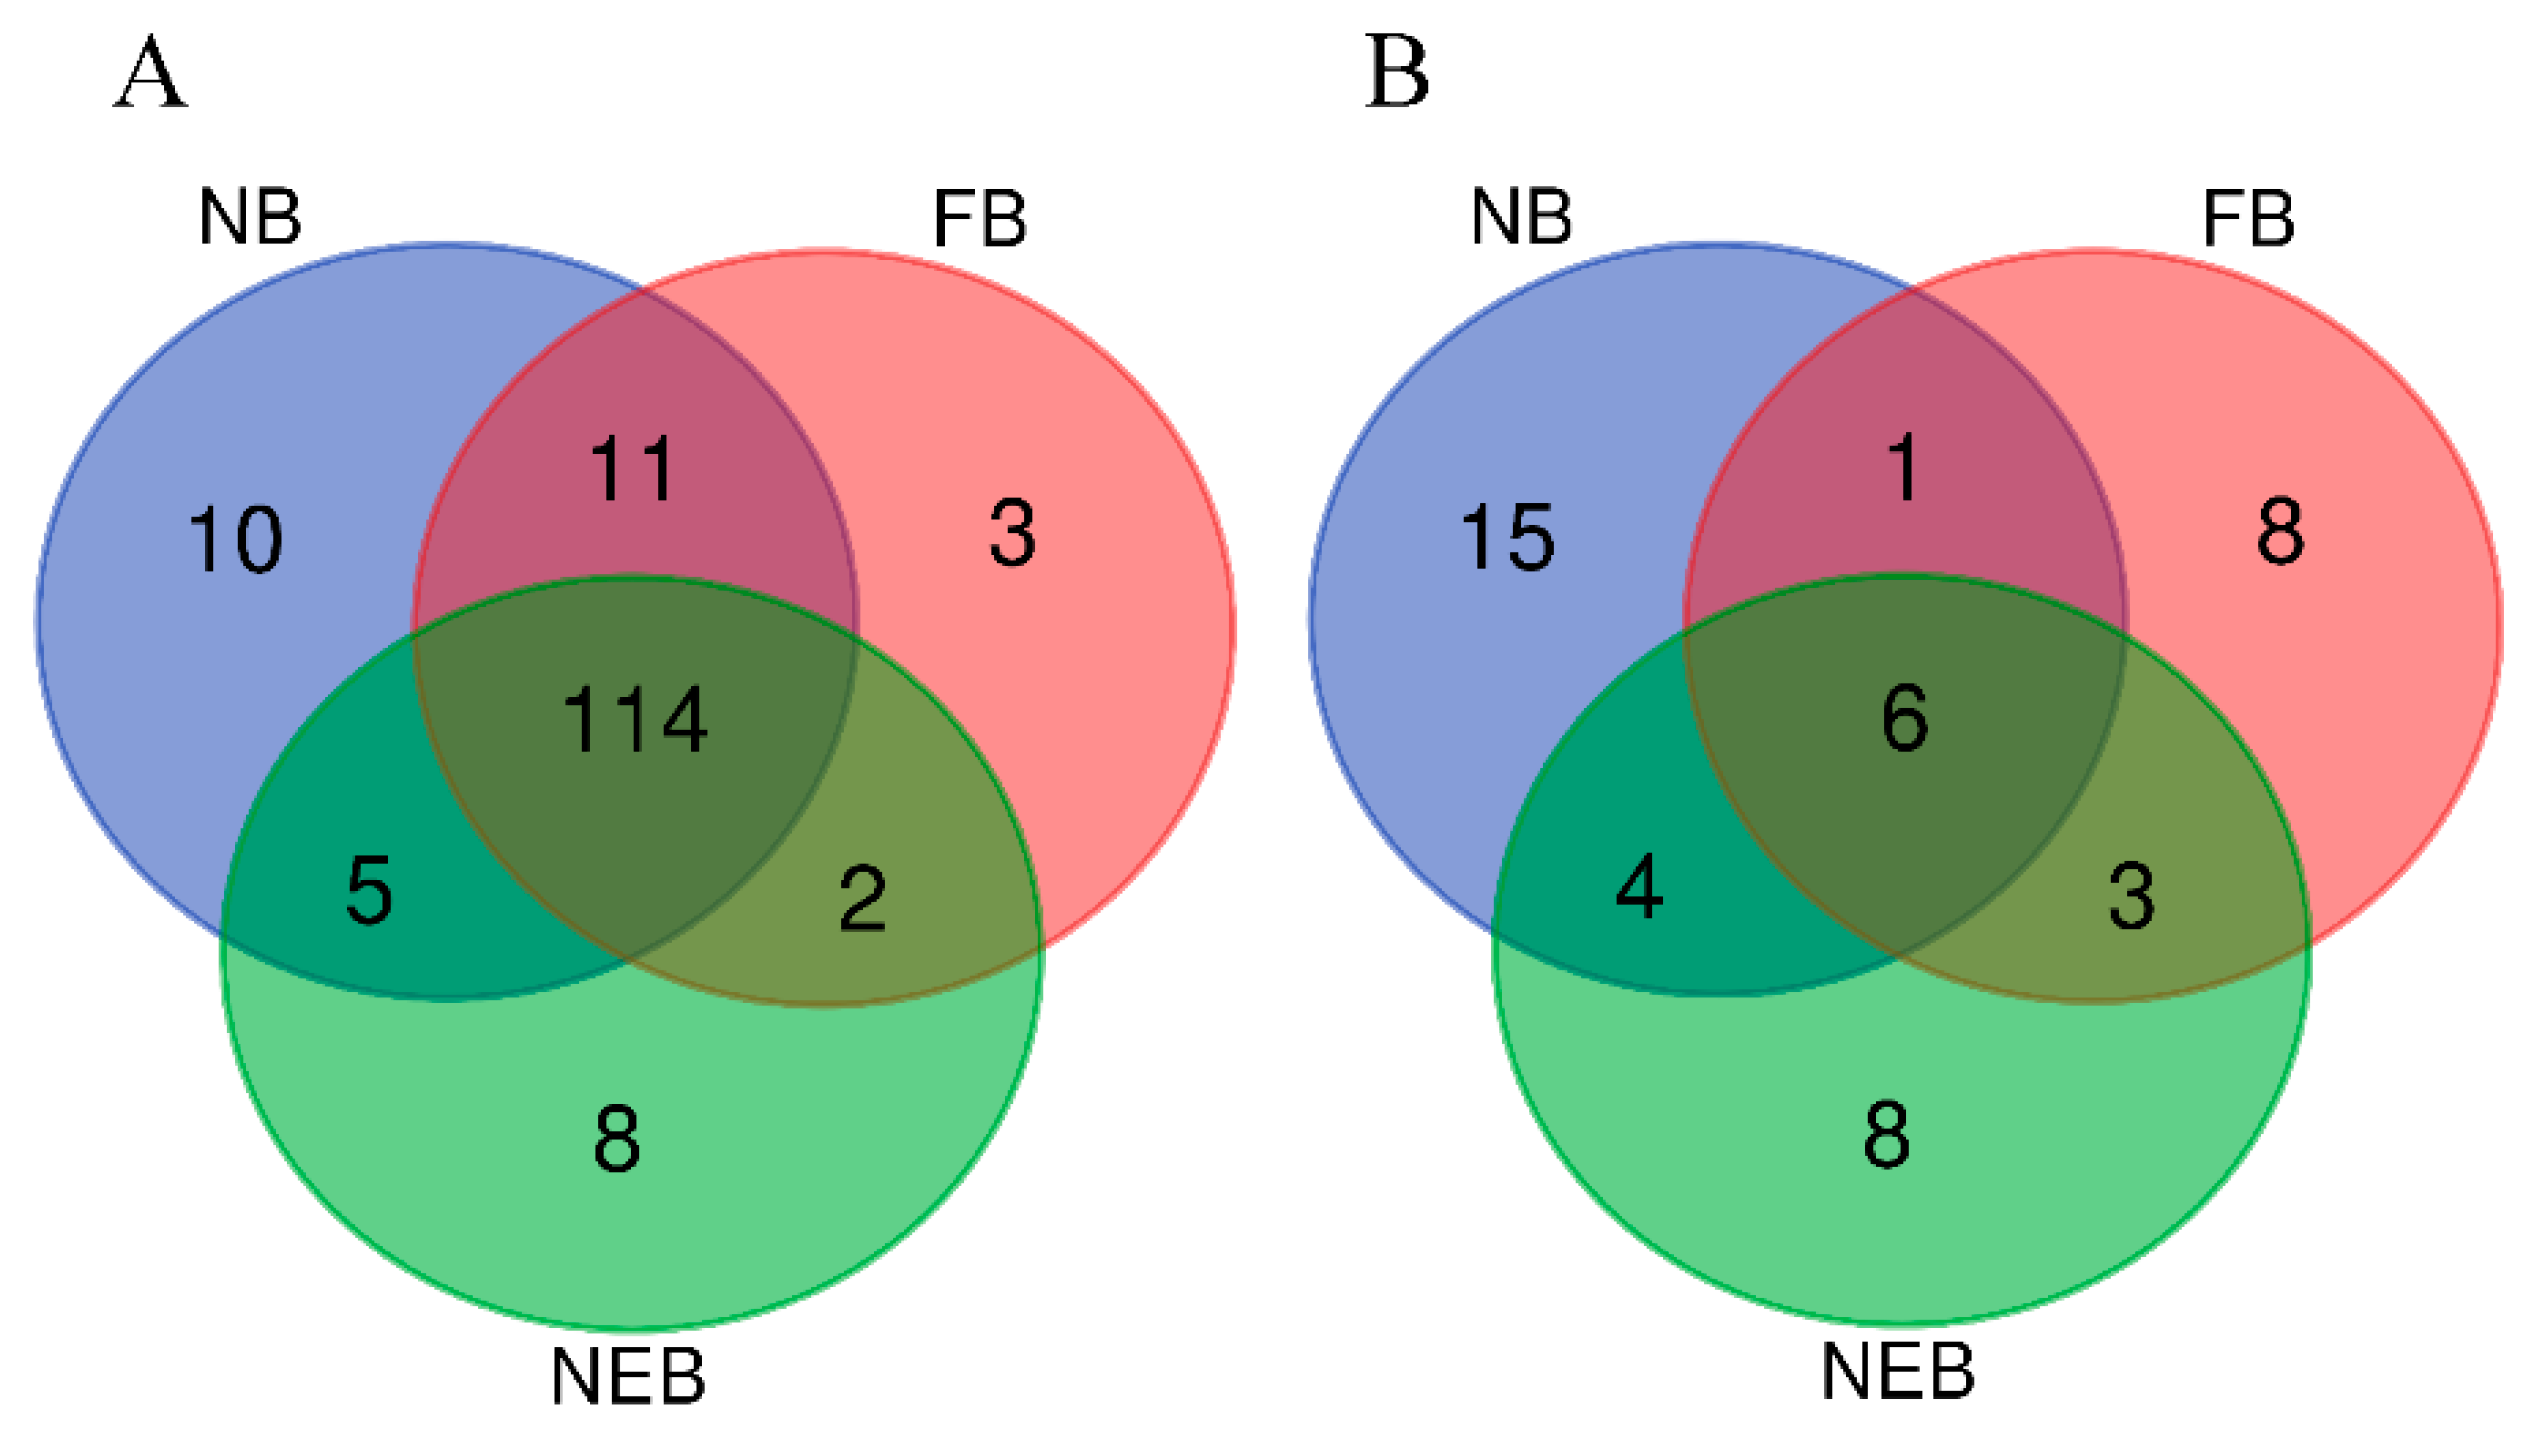
3.2. Identification of Known and Novel miRNAs

We compared the unannotated sequences with known mature miRNAs of A. mellifera in the miRBase database to identify the known miRNAs. In total, 140, 130, and 129 known miRNAs were found in NB HPGs, FB HPGs, and NEB HPGs, respectively. Among them, 114 were shared between three groups (Figure 2A, Table S2). Ten miRNAs with the highest expression were selected and listed in Table 2, and five of them (ame-miR-276-3p, ame-miR-375-3p, ame-miR-14-3p, ame-miR-275-3p, and ame-miR-3477-5p) were expressed in all groups. Remarkably, ame-miR-276-3p, ame-miR-275-3p, and ame-miR-14-3p were the top three most abundant miRNAs with 322589 reads, 122003 reads, and 72753 reads, respectively.
In total, 26, 18, and 21 novel miRNAs were predicted in NB HPGs, FB HPGs, and NEB HPGs, respectively. Among them, six novel miRNAs were shared in the three groups, while seven, nine, and ten novel miRNAs were common in NB vs. FB, FB vs. NEB, and NB vs. NEB comparisons, respectively. Otherwise, fifteen, eight, and eight novel miRNAs were only expressed in NB HPGs, FB HPGs, and NEB HPGs, respectively (Figure 2B, Table S3).

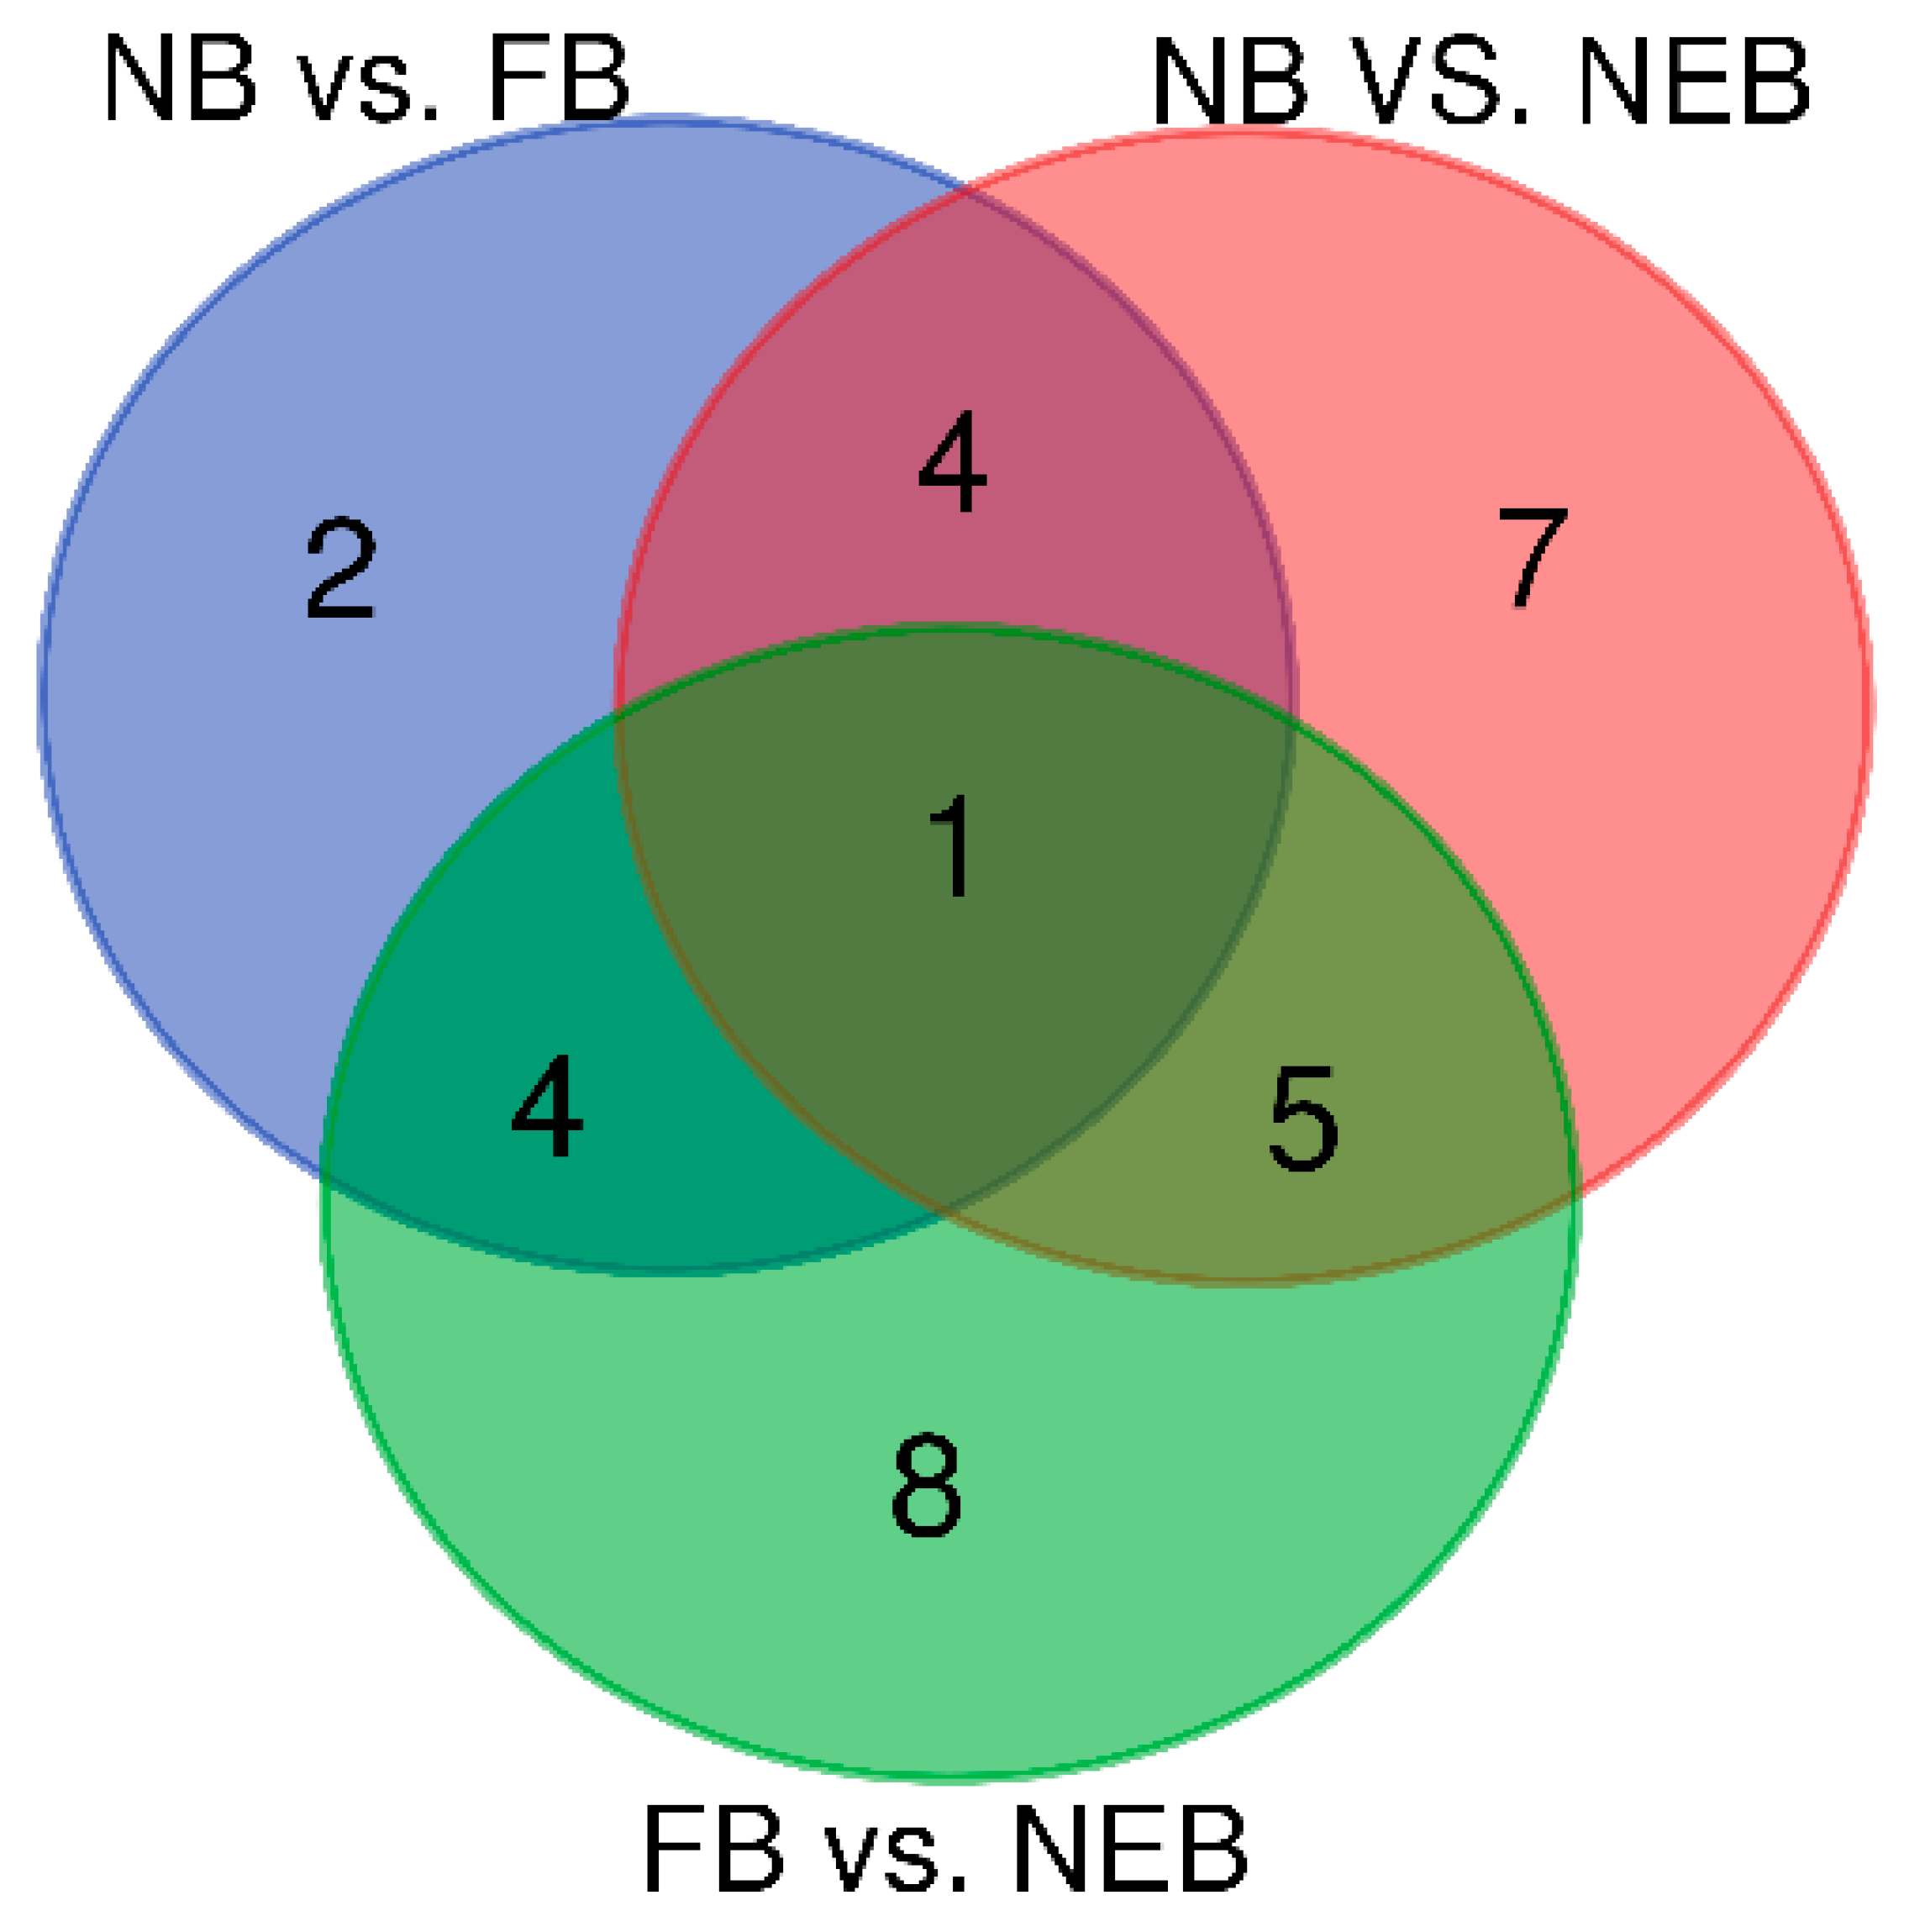
3.3. Differential Expression Analysis of miRNAs

As shown in Table 3, there were 31 miRNAs differentially expressed among the NEB, NB, and FB libraries (p < 0.01 and |log2-fold change| > 1). Among these, 11 miRNAs exhibited differential expression in the NB vs. FB comparison (five upregulated and six downregulated), 17 miRNAs in NB vs. NEB comparison (five upregulated and twelve downregulated), and 18 miRNAs in FB vs. NEB comparison (six upregulated and twelve downregulated). In addition, one miRNA, ame-miR-31a-5p, was common in the three comparisons; five miRNAs were common between NB vs. FB and NB vs. NEB comparisons, five miRNAs between NB vs. NEB and FB vs. NEB comparisons, and six miRNAs between FB vs. NEB and NB vs. NEB comparisons (Figure 3, Table 3). Some differentially expressed miRNAs (DEMs) called our attention: ame-miR-3477-5p and ame-miR-281-3p had higher expression in NB than in both FB and NEB, while ame-miR-184-3p and ame-miR-252a-5p showed the contrary expression tendency (Table 4); ame-miR-3791-3p and ame-miR-210-3p were upregulated in FB compared with that both in NB and NEB, while ame-miR-11-3p, ame-miR-283-5p, and ame-miR-31a-5p were downregulated (Table 4).

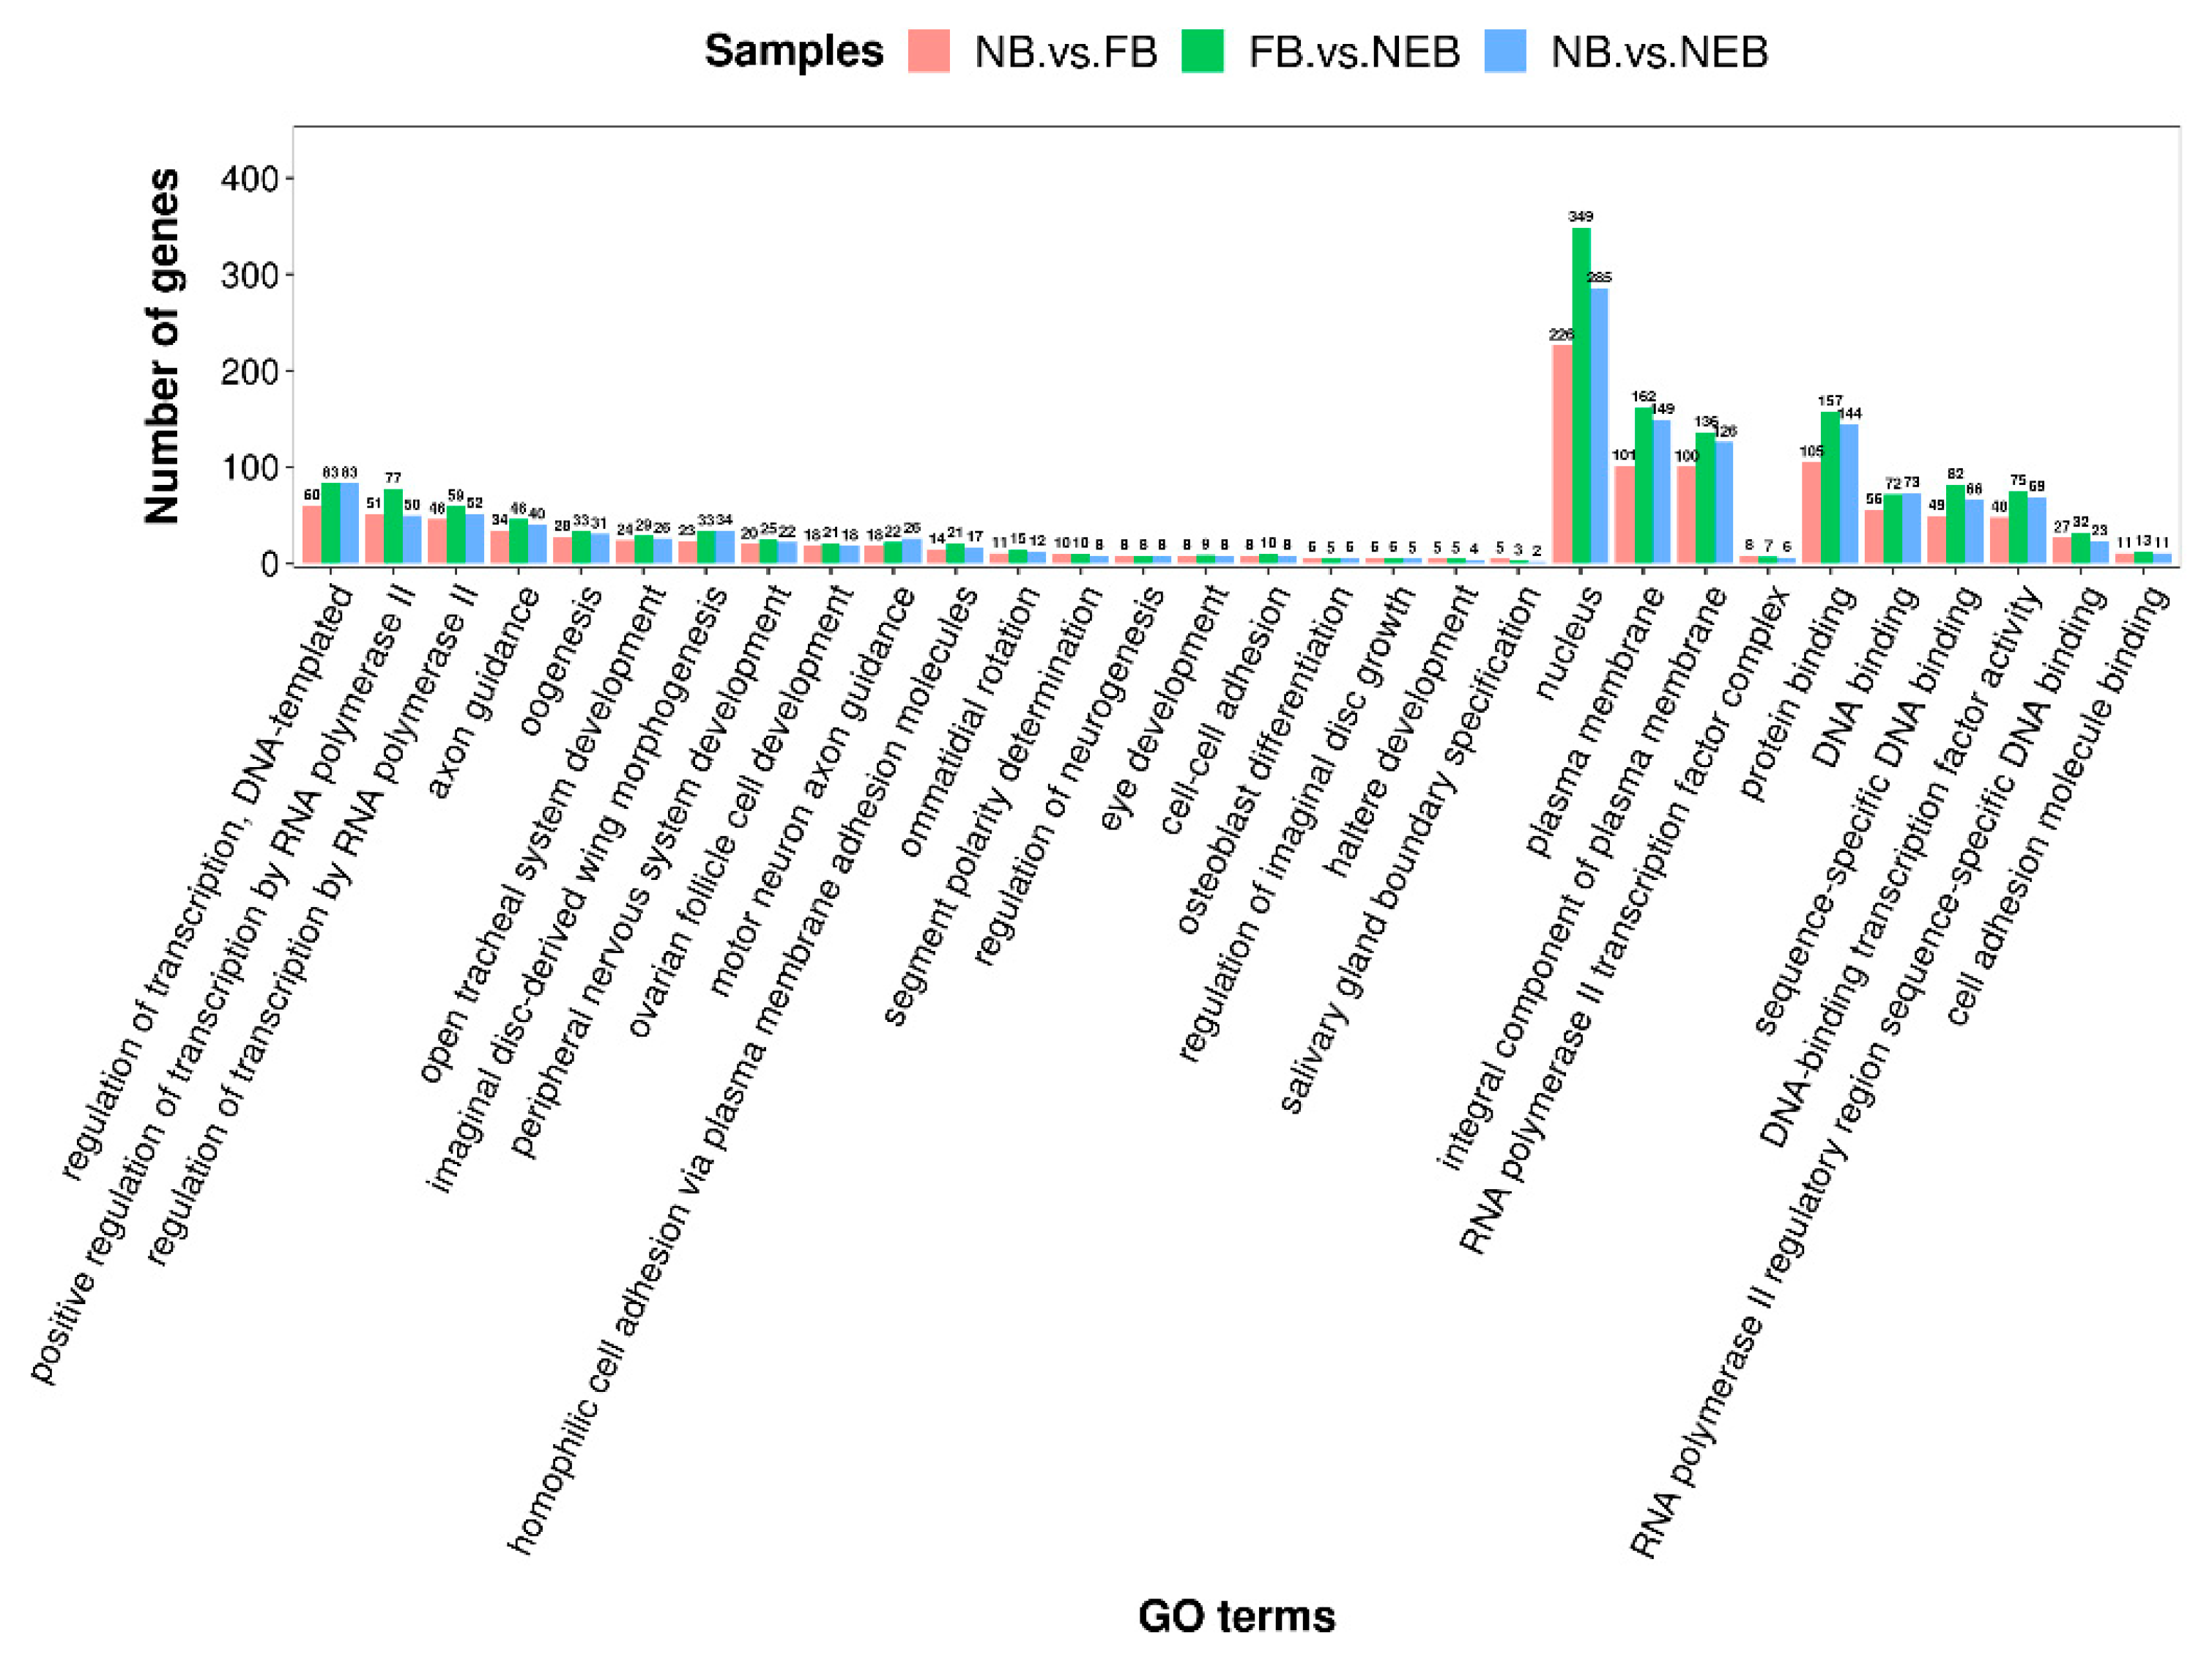
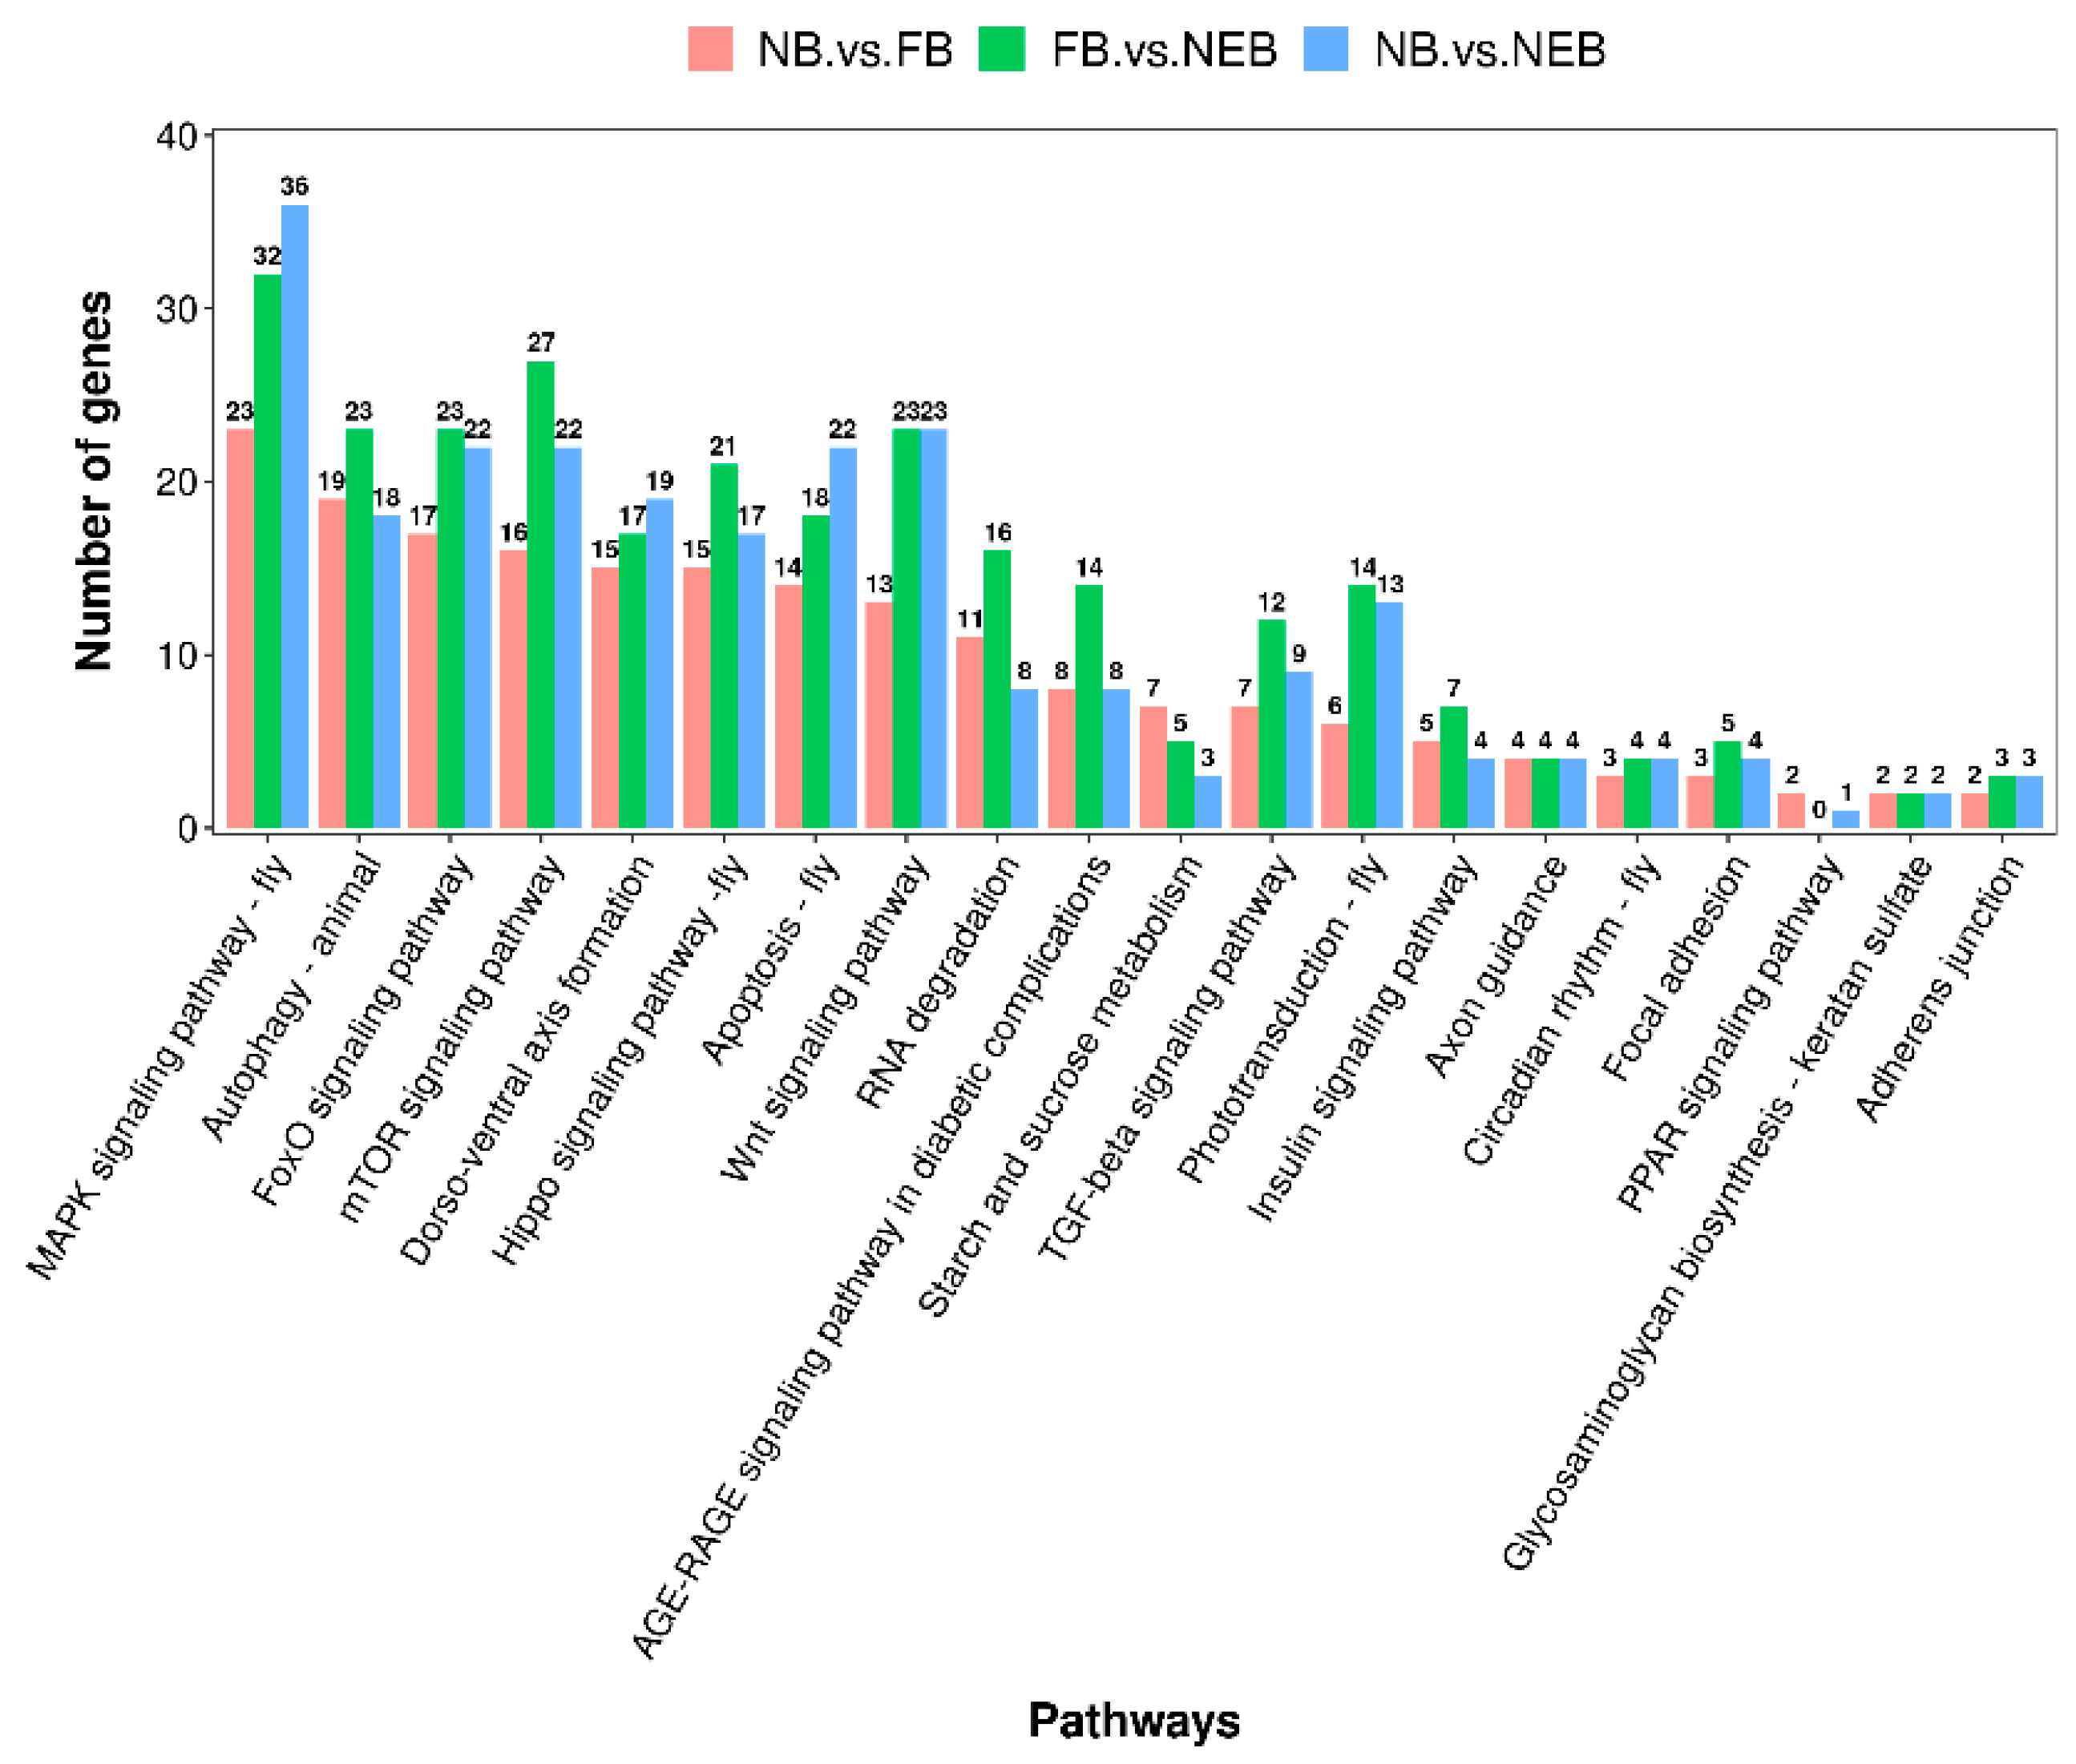
3.4. Prediction of the Target Genes of DEMs and Enrichment Analysis
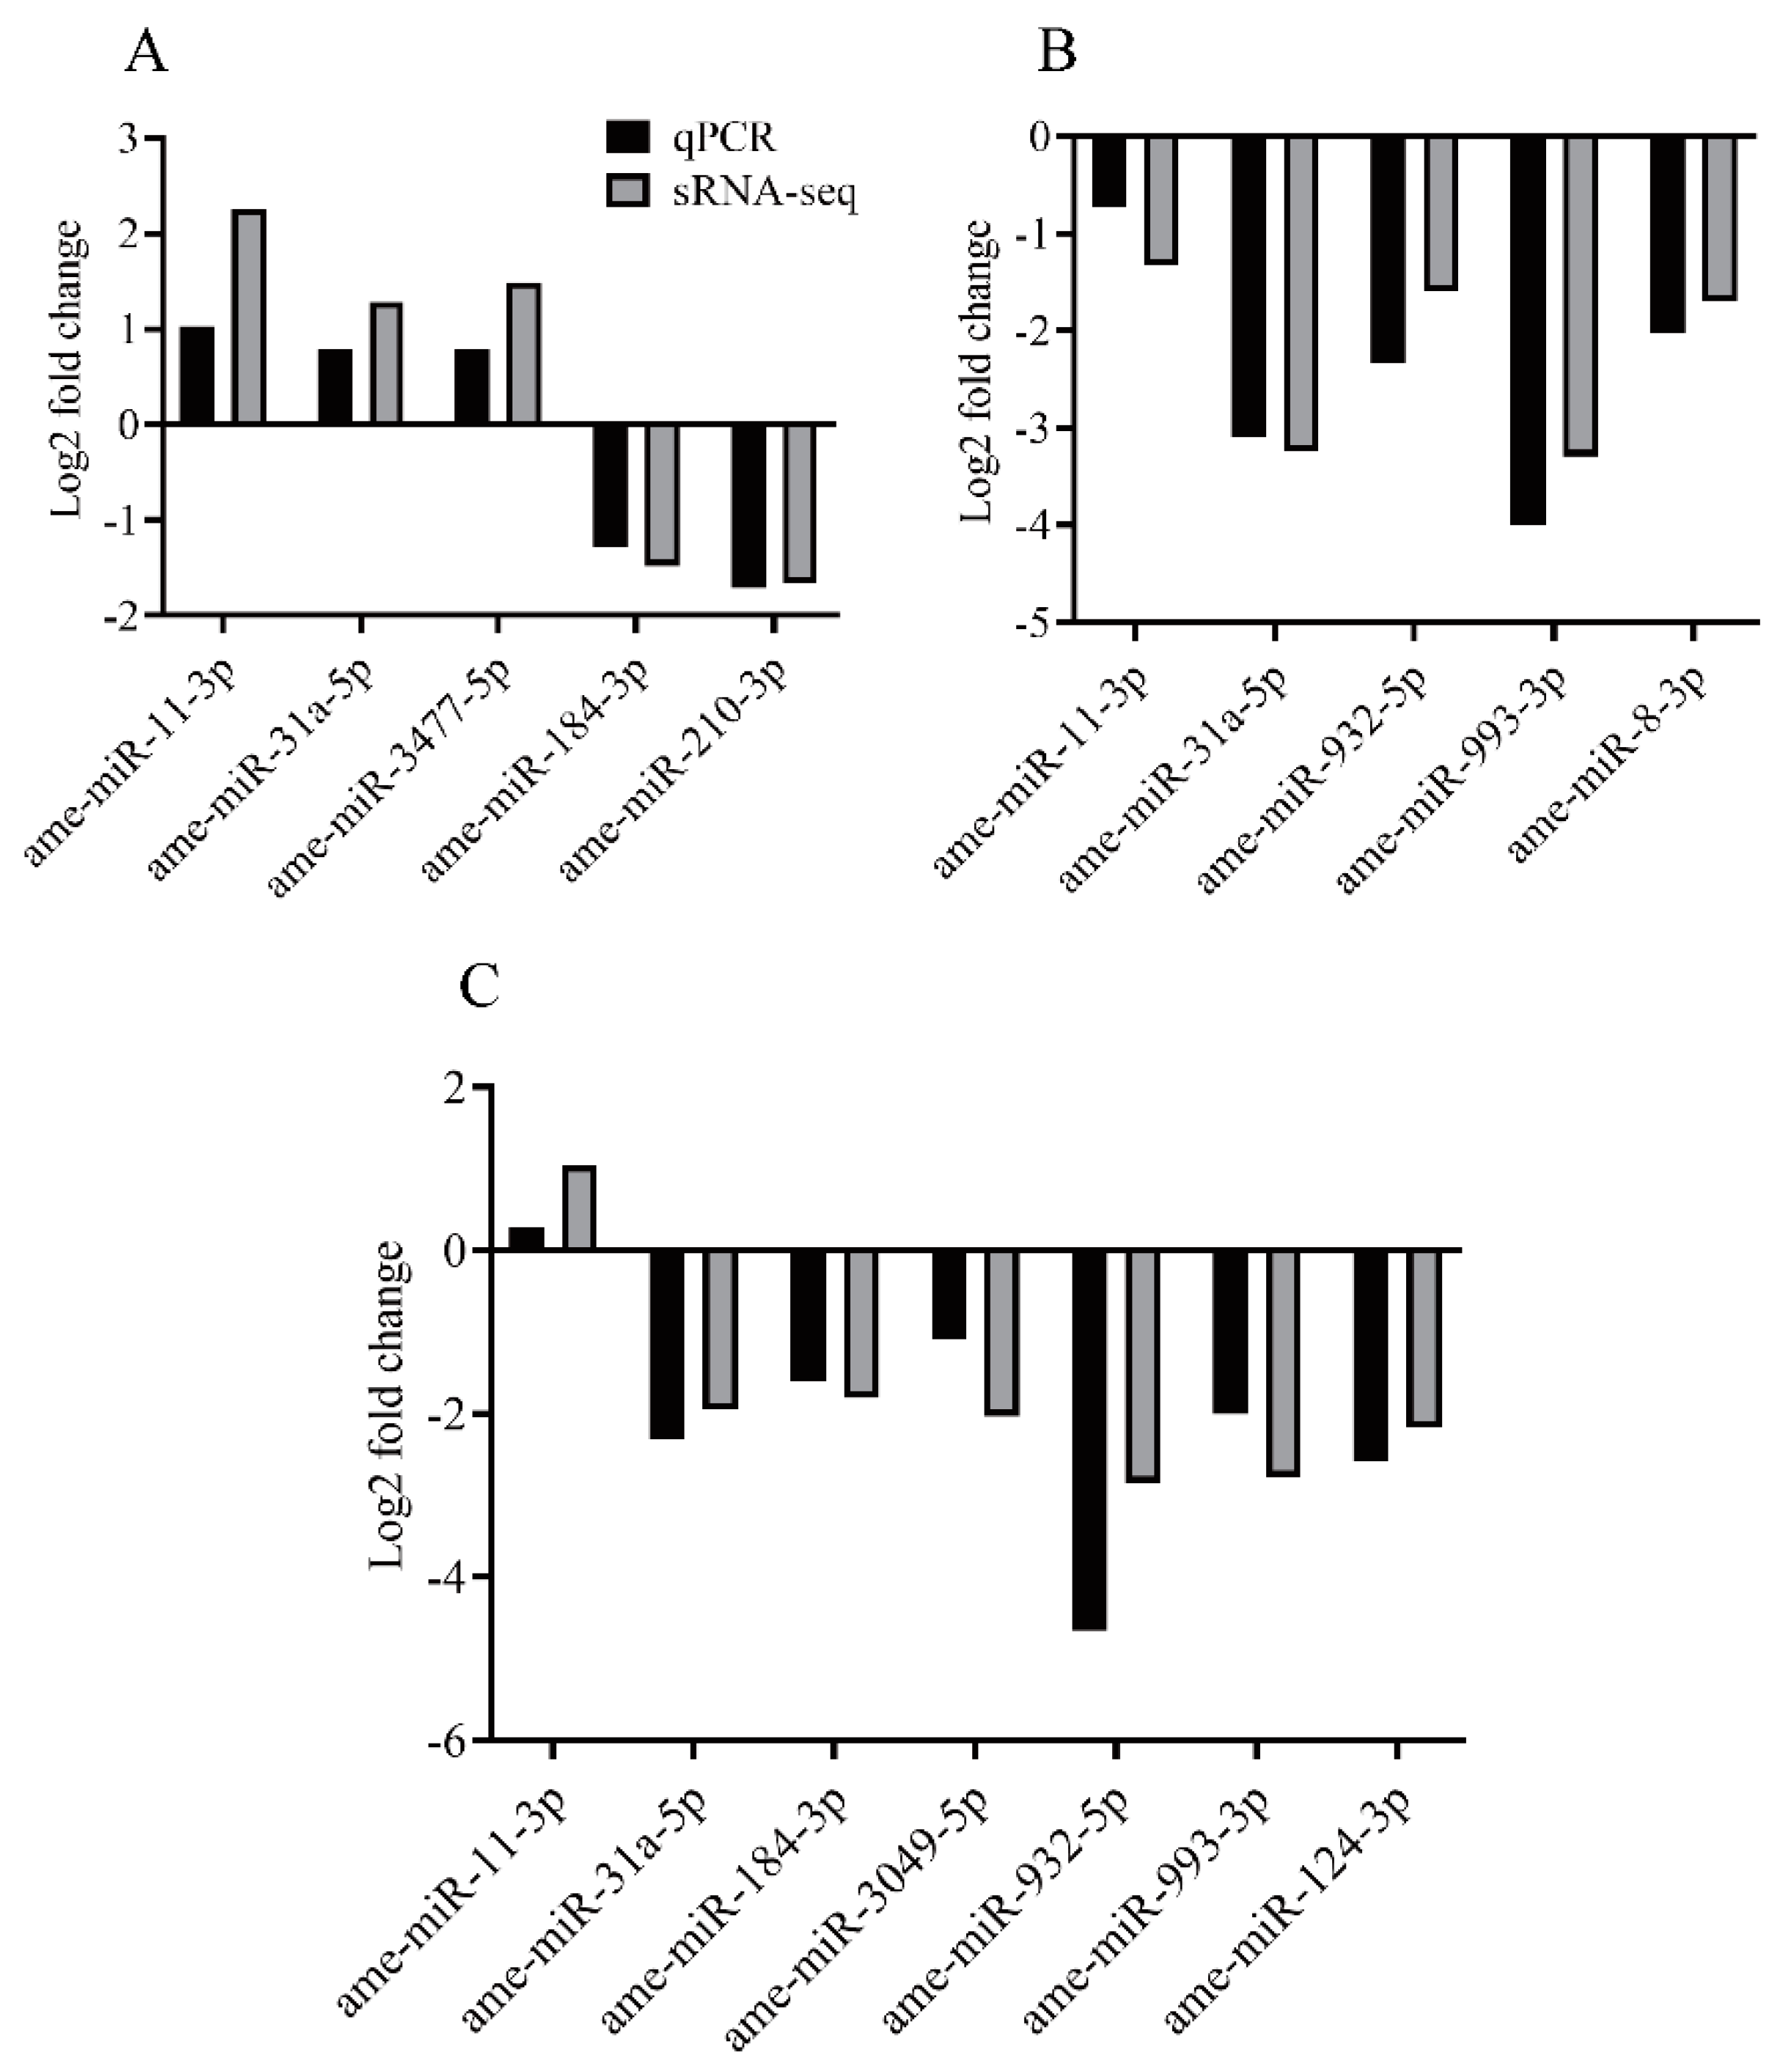
Using miRanda and TargetScan softwares, we predicted the target genes of the 31 DEMs among the NEB, NB, and FB libraries. In total, 1180, 1531, and 1868 candidate target genes were obtained for 11 DEMs confirmed in the NB vs. FB comparison (Table S4), 17 DEMs confirmed in the NB vs. NEB comparison (Table S5), and 18 DEMs confirmed in the FB vs. NEB comparison (Table S6), respectively. The predicted target genes of these DEMs obtained in the three comparisons were enriched in thousands of GO terms. Nucleus, plasma membrane, protein binding, integral component of plasma membrane, and regulation of transcription, DNA-templated were the top five most enriched ones (Figure 4, Tables S7–S9). The predicted target genes were mapped to 217 KEGG pathways, and the mTOR signaling pathway, MAPK signaling pathway-fly, FoxO signaling pathway, Hippo signaling pathway-fly, and Autophagy-animal were the top five most abundant ones (Figure 5, Tables S10–S12).

3.5. qPCR Analysis

Five DEMs confirmed in the NB vs. FB comparison, six DEMs identified in the NB vs. NEB comparison, and five DEMs obtained in the FB vs. NEB comparison were validated by qPCR assay. As shown in Figure 6, the miRNA expression patterns exhibited a similar trend between the qPCR results and the sRNA-seq data. In the NB vs. FB comparison, ame-miR-11-3p, ame-miR-31a-5p, and ame-miR-3477-5p were upregulated, while ame-miR-184-3p and ame-miR-210-3p were downregulated. In the NB vs. NEB comparison, ame-miR-11-3p was upregulated, and ame-miR-184-3p, ame-miR-124-3p, ame-miR-3049-5p, ame-miR-31a-5p, ame-miR-932-5p, and ame-miR-993-3p were downregulated. In the FB vs. NEB comparison, ame-miR-11-3p, ame-miR-31a-5p, ame-miR-8-3p, ame-miR-932-5p, and ame-miR-993-3p were all downregulated.

4. Discussion

In this study, sRNA-seq was employed to explore the miRNA profiles in the hypopharyngeal glands of honeybees at three developmental stages (newly-emerged bees, nurse bees, and forager bees). In total, 153 known miRNAs were obtained, and 114 of them were shared in the three stages. Differential expression analysis showed that 11, 17, and 18 miRNAs were significantly differentially expressed between NB vs. FB comparison, FB vs. NEB comparison, and NB vs. NEB comparison, respectively (Figure 3, Table 3). Validation of ten DEMs using qPCR indicated that the results of qPCR and sRNA-seq showed a similar trend, suggesting the reliability of sRNA-seq data [39]. The potential target genes of DEMs were also predicted, which mainly participated in diverse signaling pathways, including mTOR signaling pathway, MAPK signaling pathway-fly, FoxO signaling pathway, and Hippo signaling pathway-fly (Figure 5, Tables S10–S12), which might play important roles in regulating HPGs development in honeybees.
Among the 153 known miRNAs obtained in the present study, ame-miR-276-3p, ame-miR-375-3p, ame-miR-14-3p, ame-miR-275-3p, and ame-miR-3477-5p were the top five most abundant miRNAs that commonly existed in NB, FB, and NEB libraries (Table 2). A recent study demonstrated that ame-miR-14 was enriched in the queen ovary and played an important role in regulating egg-laying via modulating ecdysone receptor in honeybee queens [26]. The miRNA ame-mir-276 is highly expressed in the small-type Kenyon cells of the mushroom bodies and is involved with the development of related neural function in honeybees [40]. Therefore, the highly expressed miRNAs in our study might play indispensable roles in the HPGs development in honeybees. Furthermore, our study also found that the expression level of ame-miR-3477-5p exhibited significant differences in NB vs. FB comparison or in NB vs. NEB comparison, and ame-miR-276-3p had higher expression in NEB than that in NB. Previous studies reported that there were striking differences in the brain or head miRNAs expression between nurse and forager [21,22,41,42]. Hence, development stages have obvious impacts on the expression levels of miRNAs in honeybees [43,44].
There were a total of 31 differentially expressed miRNAs confirmed among the three different developmental stages, and several of them interested us enormously. For instance, ame-miR-184-3p and ame-miR-252a-5p had lower expression in NB than that in both the FB and NEB (Table 3). The miRNA ame-miR-184-3p is found to be involved in royal jelly secretion by enhancing the expression of the target genes, insulin-like receptor and cyclin dependent kinase 12, and inhibition of ame-miR-184-3p expression also can activate the mTOR signaling pathway [45]. Accordingly, many potential target genes of ame-miR-184-3p obtained in the present study were enriched for this key signaling pathway (Table 4). In addition, many predicted target genes of ame-miR-184-3p and ame-miR-252a-5p were also responsible for protein synthesis and energy metabolism (Table 4), which is similar to a previous study declaring that the upregulated genes in the HPGs of NB were notably enriched in ribosome and aminoacyl-tRNA biosynthesis [15]. It is well known that the HPGs of nurse bees have strong activity to secrete RJ protein [13,46], and HPGs of high-RJ-producing nurse bees exhibit stronger energy replenishment than those of Italian bees [47]. Hence, the lower expression of ame-miR-184-3p and ame-miR-252a-5p in nurse bees was closely associated with RJ secretion.
On the other hand, three miRNAs (ame-miR-11-3p, ame-miR-281-3p, and ame-miR-31a-5p) showed lower expression levels in FB compared with that in both the NB and NEB (Table 3). Similarly, a previous study found that ame-miR-31a had higher expression level in brains of NB than in brains of FB in both the typical colonies and single-cohort colonies, which was considered as an important regulator of the behavioral transition in worker bees [48]. The miRNAs can regulate various biological processes by suppressing their target gene expression [49]. Our present study found that several potential targets of ame-miR-11-3p (glucosidase 2 subunit beta and hexosaminidase D) and ame-miR-281-3p (myogenesis-regulating glycosidase) encoded the enzymes involved in carbohydrate digestion. Glucosidase can catalyze polysaccharides into glucose [50]. Hexosaminidase D participated in glycan degradation, and myogenesis-regulating glycosidase was responsible for starch and sucrose metabolism (Table 4). The downregulation of ame-miR-11-3p and ame-miR-281-3p in HPGs of FB are likely involved with the conversion of nectar into honey [10,51]. Otherwise, some candidate target genes of ame-miR-11-3p, ame-miR-31a-5p, and ame-miR-281-3p were enriched in apoptosis-fly pathway (Table 4). Previous studies demonstrated that the HPGs begin to degenerate in worker bees more than 15 days old (forager bees) [52,53].
Bioinformatic analysis showed that mTOR signaling pathway, MAPK signaling pathway-fly, FoxO signaling pathway, Hippo signaling pathway-fly, and Autophagy-animal were the top five most enriched pathways in the potential target genes of the DEMs in the three comparisons: in NB vs. FB comparison, in NB vs. NEB comparison, and in FB vs. NEB comparison, which suggested that these pathways might play critical roles in hypopharyngeal glands development in honeybees. Among these, mTOR signaling has been implicated in the modulation of ribosome oogenesis and protein synthesis in cells [54,55]. Hippo signaling pathway is involved with organ size control and tissue regeneration via cell proliferation and apoptosis [56,57]. FoxO signaling pathway is responsible for carbohydrate and energy metabolism [58,59]. MAPK signaling pathway plays a significant role in regulating division of labor, caste differentiation, and queen development in honeybees [60,61,62]. These findings indicate that the DEMs might have regulatory roles in the growth and development, protein synthesis, and carbohydrate and energy metabolism in the HPGs of honeybees.

5. Conclusions

We first compared the miRNA profiles of hypopharyngeal glands in honeybees at different developmental stages (newly-emerged bees, nurse bees, and forager bees). Bioinformatic analysis showed that the differentially expressed miRNAs were involved in important biological processes related to growth and development, protein synthesis, and carbohydrate and energy metabolism in the hypopharyngeal glands. Additionally, we found that the downregulation of ame-miR-184-3p and ame-miR-252a-5p in nurse bees may be involved in royal jelly secretion, while the lower expression of ame-miR-11-3p and ame-miR-281-3p in forager bees are responsible for honey processing. These findings should provide a basis for further study of the roles of miRNAs in hypopharyngeal glands development.

Supplementary Materials

The following are available online at https://www.mdpi.com/article/10.3390/insects12090764/s1, Table S1: Details of the sRNA-seq data; Table S2: The known miRNAs detected in NB, FB, and NEB libraries; Table S3: The novel miRNAs detected in NB, FB, and NEB libraries; Table S4: Predicted target genes of differentially expressed miRNAs confirmed in the NB vs. FB comparison; Table S5: Predicted target genes of differentially expressed miRNAs confirmed in the NB vs. NEB comparison; Table S6: Predicted target genes of differentially expressed miRNAs confirmed in the FB vs. NEB comparison; Table S7: GO enrichment analysis of predicted target genes of differentially expressed miRNAs confirmed in the NB vs. FB comparison; Table S8: GO enrichment analysis of predicted target genes of differentially expressed miRNAs confirmed in the NB vs. NEB comparison; Table S9: GO enrichment analysis of predicted target genes of differentially expressed miRNAs confirmed in the FB vs. NEB comparison; Table S10: KEGG pathways analysis of predicted target genes of differentially expressed miRNAs confirmed in the NB vs. FB comparison; Table S11: KEGG pathways analysis of predicted target genes of differentially expressed miRNAs confirmed in the NB vs. NEB comparison; Table S12: KEGG pathways analysis of predicted target genes of differentially expressed miRNAs confirmed in the FB vs. NEB comparison.

Author Contributions

Conceptualization, T.S., H.C. and L.Y. (Linsheng Yu); methodology, T.S., H.C. and L.Y. (Linsheng Yu); software, T.S.; validation, T.S. and P.L.; formal analysis, T.S., P.L. and X.J.; investigation, T.S., Y.Z., X.J. and L.Y. (Liang Ye); resources, Y.Z. and P.L.; data curation, T.S.; writing—original draft preparation, T.S.; writing—review and editing, T.S., L.Y. (Linsheng Yu), X.J. and H.C.; visualization, T.S.; supervision, T.S. and L.Y. (Linsheng Yu); project administration, T.S.; funding acquisition, T.S. and L.Y. (Linsheng Yu). All authors have read and agreed to the published version of the manuscript.

Funding

This research was supported by the earmarked fund for Modern Agro-Industry Technology Research System (No. CARS-45-KXJ10) and Institutions of Higher Learning Natural Science Foundation of Anhui Province (No. KJ2020A0122).

Institutional Review Board Statement

Not applicable.

Data Availability Statement

Upon acceptance, the data used in this study will be available in the Supplementary Data File. The sequencing data are available in the SRA database (PRJNA754270) of the NCBI system.

Conflicts of Interest

The authors declare no conflict of interest. The funders had no role in the design of the study, in the collection, analyses, or interpretation of data, or the writing of the manuscript.

References

  1. Winston, M.L. The Biology of the Honey Bee; Harvard University Press: Cambridge, CA, USA, 1987. [Google Scholar]
  2. Robinson, G.E. Regulation of division of labor in insect societies. Annu. Rev. Entomol. 1992, 37, 637–665. [Google Scholar] [CrossRef]
  3. Deseyn, J.; Billen, J. Age-dependent morphology and ultrastructure of the hypopharyngeal gland of Apis mellifera workers (Hymenoptera, Apidae). Apidologie 2005, 36, 49–57. [Google Scholar] [CrossRef] [Green Version]
  4. Elaidy, W.K.M. Ultrastructural changes in the hypopharyngeal gland of Apis mellifera workers with age. J. Apicult. Res. 2014, 53, 377–384. [Google Scholar] [CrossRef]
  5. Huang, Z.-Y.; Otis, G. Factors determining hypopharyngeal gland activity of worker honey bees (Apis mellifera L.). Insect Soc. 1989, 36, 264–276. [Google Scholar]
  6. Kubo, T.; Sasaki, M.; Nakamura, J.; Sasagawa, H.; Ohashi, K.; Takeuchi, H.; Natori, S. Change in the expression of hypopharyngeal-gland proteins of the worker honeybees (Apis mellifera L.) with age and/or role. J. Biochem. 1996, 119, 291–295. [Google Scholar] [CrossRef]
  7. Ohashi, K.; Natori, S.; Kubo, T. Change in the mode of gene expression of the hypopharyngeal gland cells with an age-dependent role change of the worker honeybee Apis mellifera L. Eur. J. Biochem. 1997, 249, 797–802. [Google Scholar] [CrossRef]
  8. Hrassnigg, N.; Crailsheim, K. Adaptation of hypopharyngeal gland development to the brood status of honeybee (Apis mellifera L.) colonies. J. Insect Physiol. 1998, 44, 929–939. [Google Scholar] [CrossRef]
  9. Ohashi, K.; Sawata, M.; Takeuchi, H.; Natori, S.; Kubo, T. Molecular Cloning of cDNA and Analysis of Expression of the Gene for α-Glucosidase from the Hypopharyngeal Gland of the Honeybee Apis mellifera L. Biochem. Biophys. Res. Commun. 1996, 221, 380–385. [Google Scholar] [CrossRef] [PubMed]
  10. Ohashi, K.; Natori, S.; Kubo, T. Expression of amylase and glucose oxidase in the hypopharyngeal gland with an age-dependent role change of the worker honeybee (Apis mellifera L.). Eur. J. Biochem. 1999, 265, 127–133. [Google Scholar] [CrossRef]
  11. Ueno, T.; Nakaoka, T.; Takeuchi, H.; Kubo, T. Differential gene expression in the hypopharyngeal glands of worker honeybees (Apis mellifera L.) associated with an age-dependent role change. Zoolog. Sci. 2009, 26, 557–563. [Google Scholar] [CrossRef] [Green Version]
  12. Ueno, T.; Takeuchi, H.; Kawasaki, K.; Kubo, T. Changes in the gene expression profiles of the hypopharyngeal gland of worker honeybees in association with worker behavior and hormonal factors. PLoS ONE 2015, 10, e0130206. [Google Scholar]
  13. Ahmad, S.; Khan, S.A.; Khan, K.A.; Li, J. Novel insight into the development and function of hypopharyngeal glands in honey bees. Front. Physiol. 2020, 11, 615830. [Google Scholar] [CrossRef]
  14. Liu, H.; Wang, Z.L.; Tian, L.Q.; Qin, Q.H.; Wu, X.B.; Yan, W.Y.; Zeng, Z.J. Transcriptome differences in the hypopharyngeal gland between Western Honeybees (Apis mellifera) and Eastern Honeybees (Apis cerana). BMC Genom. 2014, 15, 744. [Google Scholar] [CrossRef] [Green Version]
  15. Nie, H.; Gao, Y.; Zhu, Y.; Liang, L.; Lin, Y.; Li, Q.; Li, Z.; Yang, D.; Li, Z.; Su, S. Comparative transcriptome analysis of hypopharyngeal glands from nurse and forager bees of Apis mellifera with the same age. Apidologie 2021, 52, 141–154. [Google Scholar] [CrossRef]
  16. Bartel, D.P. MicroRNAs: Target recognition and regulatory functions. Cell 2009, 136, 215–233. [Google Scholar] [CrossRef] [PubMed] [Green Version]
  17. Pillai, R.S.; Bhattacharyya, S.N.; Artus, C.G.; Zoller, T.; Cougot, N.; Basyuk, E.; Bertrand, E.; Filipowicz, W. Inhibition of translational initiation by Let-7 MicroRNA in human cells. Science 2005, 309, 1573–1576. [Google Scholar] [CrossRef] [Green Version]
  18. Wang, W.; Wang, X.; Luo, C.; Pu, Q.; Yin, Q.; Xu, L.; Peng, X.; Ma, S.; Xia, Q.; Liu, S. Let-7 microRNA is a critical regulator in controlling the growth and function of silk gland in the silkworm. RNA Biol. 2020, 17, 703–717. [Google Scholar] [CrossRef]
  19. Shi, Y.Y.; Zheng, H.J.; Pan, Q.Z.; Wang, Z.L.; Zeng, Z.J. Differentially expressed microRNAs between queen and worker larvae of the honey bee (Apis mellifera). Apidologie 2015, 46, 35–45. [Google Scholar] [CrossRef] [Green Version]
  20. Guo, X.; Su, S.; Geir, S.; Li, W.; Li, Z.; Zhang, S.; Chen, S.; Chen, R. Differential expression of miRNAs related to caste differentiation in the honey bee, Apis mellifera. Apidologie 2016, 47, 495–508. [Google Scholar] [CrossRef] [Green Version]
  21. Greenberg, J.K.; Xia, J.; Zhou, X.; Thatcher, S.R.; Gu, X.; Ament, S.A.; Newman, T.C.; Green, P.J.; Zhang, W.; Robinson, G.E.; et al. Behavioral plasticity in honey bees is associated with differences in brain microRNA transcriptome. Genes Brain Behav. 2012, 11, 660–670. [Google Scholar] [CrossRef] [PubMed] [Green Version]
  22. Liu, F.; Shi, T.; Yin, W.; Su, X.; Qi, L.; Huang, Z.Y.; Zhang, S.; Yu, L. The microRNA ame-miR-279a regulates sucrose responsiveness of forager honey bees (Apis mellifera). Insect Biochem. Mol. Biol. 2017, 90, 34–42. [Google Scholar] [CrossRef] [PubMed] [Green Version]
  23. Cristino, A.S.; Barchuk, A.R.; Freitas, F.C.; Narayanan, R.K.; Biergans, S.D.; Zhao, Z.; Simoes, Z.L.; Reinhard, J.; Claudianos, C. Neuroligin-associated microRNA-932 targets actin and regulates memory in the honeybee. Nat. Commun. 2014, 5, 5529. [Google Scholar] [CrossRef] [Green Version]
  24. Michely, J.; Kraft, S.; Muller, U. miR-12 and miR-124 contribute to defined early phases of long-lasting and transient memory. Sci. Rep. (UK) 2017, 7, 7910. [Google Scholar] [CrossRef] [Green Version]
  25. Chen, X.; Ma, C.; Chen, C.; Lu, Q.; Shi, W.; Liu, Z.; Wang, H.; Guo, H. Integration of lncRNA–miRNA–mRNA reveals novel insights into oviposition regulation in honey bees. PeerJ 2017, 5, e3881. [Google Scholar] [CrossRef] [PubMed]
  26. Chen, X.; Fu, J. The microRNA miR-14 Regulates Egg-Laying by Targeting EcR in Honeybees (Apis mellifera). Insects 2021, 12, 351. [Google Scholar] [CrossRef]
  27. Chen, D.; Du, Y.; Chen, H.; Fan, Y.; Fan, X.; Zhu, Z.; Wang, J.; Xiong, C.; Zheng, Y.; Hou, C. Comparative Identification of MicroRNAs in Apis cerana cerana Workers’ Midguts in Response to Nosema ceranae Invasion. Insects 2019, 10, 258. [Google Scholar] [CrossRef] [PubMed] [Green Version]
  28. Deng, Y.; Deng, Y.; Zhao, H.; Shen, S.; Hou, C. Citation: Identification of Immune Response to Sacbrood Virus Infection in Apis cerana Under Natural Condition. Front. Genet. 2020, 11, 587509. [Google Scholar] [CrossRef] [PubMed]
  29. Freitas, F.C.; Pires, C.V.; Claudianos, C.; Cristino, A.S.; Simões, Z.L. MicroRNA-34 directly targets pair-rule genes and cytoskeleton component in the honey bee. Sci. Rep. (UK) 2017, 7, 40884. [Google Scholar] [CrossRef] [Green Version]
  30. Chen, D.; Chen, H.; Du, Y.; Zhu, Z.; Wang, J.; Geng, S.; Xiong, C.; Zheng, Y.; Hou, C.; Diao, Q. Systematic identification of circular RNAs and corresponding regulatory networks unveil their potential roles in the midguts of eastern honeybee workers. Appl. Microbiol. Biotechnol. 2020, 104, 257–276. [Google Scholar] [CrossRef] [PubMed]
  31. Langmead, B.; Trapnell, C.; Pop, M.; Salzberg, S.L. Ultrafast and memory-efficient alignment of short DNA sequences to the human genome. Genome Biol. 2009, 10, 1–10. [Google Scholar] [CrossRef] [Green Version]
  32. Lorenz, R.; Bernhart, S.H.; Zu Siederdissen, C.H.; Tafer, H.; Flamm, C.; Stadler, P.F.; Hofacker, I.L. ViennaRNA Package 2.0. Algorithms Mol. Biol. 2011, 6, 1–14. [Google Scholar] [CrossRef] [PubMed]
  33. Wang, L.; Feng, Z.; Wang, X.; Wang, X.; Zhang, X. DEGseq: An R package for identifying differentially expressed genes from RNA-seq data. Bioinformatics 2010, 26, 136–138. [Google Scholar] [CrossRef] [PubMed]
  34. Betel, D.; Wilson, M.; Gabow, A.; Marks, D.S.; Sander, C. The microRNA. org resource: Targets and expression. Nucleic Acids Res. 2008, 36, D149–D153. [Google Scholar] [CrossRef] [PubMed] [Green Version]
  35. Nam, J.-W.; Rissland, O.S.; Koppstein, D.; Abreu-Goodger, C.; Jan, C.H.; Agarwal, V.; Yildirim, M.A.; Rodriguez, A.; Bartel, D.P. Global analyses of the effect of different cellular contexts on microRNA targeting. Mol. Cell 2014, 53, 1031–1043. [Google Scholar] [CrossRef] [Green Version]
  36. Tran, V.D.T.; Moretti, S.; Coste, A.T.; Amorim-Vaz, S.; Sanglard, D.; Pagni, M. Condition-specific series of metabolic sub-networks and its application for gene set enrichment analysis. Bioinformatics 2019, 35, 2258–2266. [Google Scholar] [CrossRef] [Green Version]
  37. Kanehisa, M.; Araki, M.; Goto, S.; Hattori, M.; Hirakawa, M.; Itoh, M.; Katayama, T.; Kawashima, S.; Okuda, S.; Tokimatsu, T. KEGG for linking genomes to life and the environment. Nucleic Acids Res. 2007, 36, D480–D484. [Google Scholar] [CrossRef]
  38. Schmittgen, T.D.; Livak, K.J. Analyzing real-time PCR data by the comparative CT method. Nat. Protoc. 2008, 3, 1101. [Google Scholar] [CrossRef]
  39. Liu, M.; Huang, J.; Zhang, G.; Liu, X.; An, J. Analysis of miRNAs in the heads of different castes of the bumblebee Bombus lantschouensis (Hymenoptera: Apidae). Insects 2019, 10, 349. [Google Scholar] [CrossRef] [PubMed] [Green Version]
  40. Hori, S.; Kaneko, K.; Saito, T.H.; Takeuchi, H.; Kubo, T. Expression of two microRNAs, ame-mir-276 and-1000, in the adult honeybee (Apis mellifera) brain. Apidologie 2011, 42, 89–102. [Google Scholar] [CrossRef] [Green Version]
  41. Behura, S.; Whitfield, C.W. Correlated expression patterns of microRNA genes with age-dependent behavioural changes in honeybee. Insect Mol. Biol. 2010, 19, 431–439. [Google Scholar] [CrossRef]
  42. Liu, F.; Peng, W.; Li, Z.; Li, W.; Li, L.; Pan, J.; Zhang, S.; Miao, Y.; Chen, S.; Su, S. Next-generation small RNA sequencing for microRNAs profiling in Apis mellifera: Comparison between nurses and foragers. Insect Mol. Biol. 2012, 21, 297–303. [Google Scholar] [CrossRef]
  43. Zhang, Z.; Li, T.; Tang, G. Identification and characterization of conserved and novel miRNAs in different development stages of Atrijuglans hetaohei Yang (Lepidoptera: Gelechioidea). J. Asia-Pac. Entomol. 2018, 21, 9–18. [Google Scholar] [CrossRef]
  44. Zhang, Q.; Dou, W.; Song, Z.H.; Jin, T.J.; Yuan, G.R.; De Schutter, K.; Smagghe, G.; Wang, J.-J. Identification and profiling of Bactrocera dorsalis microRNAs and their potential roles in regulating the developmental transitions of egg hatching, molting, pupation and adult eclosion. Insect Biochem. Mol. Biol. 2020, 127, 103475. [Google Scholar] [CrossRef] [PubMed]
  45. Zhang, W.X. The Molecular Mechanisms of ame-miR-184 Regulating on Hypopharyngeal Gland Activity of Apis Mellifera Ligustica. Ph.D. Thesis, Shandong Agricultural University, Taian, China, 2020. [Google Scholar]
  46. Cruz-Landim, C.d.; Costa, R. Structure and function of the hypopharyngeal glands of Hymenoptera: A comparative approach. J. Comp. Biol. 1998, 3, 151–163. [Google Scholar]
  47. Hu, H.; Bezabih, G.; Feng, M.; Wei, Q.; Zhang, X.; Wu, F.; Meng, L.; Fang, Y.; Han, B.; Ma, C. In-depth Proteome of the Hypopharyngeal Glands of Honeybee Workers Reveals Highly Activated Protein and Energy Metabolism in Priming the Secretion of Royal Jelly. Mol. Cell. Proteom. 2019, 18, 606–621. [Google Scholar] [CrossRef] [Green Version]
  48. Liu, F.; Shi, T.F. Expression difference of microRNAs ame-miR-31a and ame-miR-13b in brains of nurses and foragers of Apis mellifera ligustica (Hymenoptera: Apidae). Acta Entomol. Sin. 2019, 62, 1003–1008. [Google Scholar]
  49. Krol, J.; Loedige, I.; Filipowicz, W. The widespread regulation of microRNA biogenesis, function and decay. Nat. Rev. Genet. 2010, 11, 597–610. [Google Scholar] [CrossRef]
  50. Chiba, S. Molecular mechanism in α-glucosidase and glucoamylase. Biosci. Biotechnol. Biochem. 1997, 61, 1233–1239. [Google Scholar] [CrossRef]
  51. Feng, M.; Fang, Y.; Li, J. Proteomic analysis of honeybee worker (Apis mellifera) hypopharyngeal gland development. BMC Genom. 2009, 10, 645. [Google Scholar] [CrossRef] [Green Version]
  52. Halberstadt, K. Elektrophoretische untersuchungen zur sekretionstätigkeit der hypopharynxdrüse der honigbiene (Apis mellifera L.). Insect Soc. 1980, 27, 61–77. [Google Scholar] [CrossRef]
  53. Silva de Moraes, R.; Bowen, I.D. Modes of cell death in the hypopharyngeal gland of the honey bee (Apis mellifera L.). Cell Biol. Int. 2000, 24, 737–743. [Google Scholar]
  54. Mayer, C.; Grummt, I. Ribosome biogenesis and cell growth: mTOR coordinates transcription by all three classes of nuclear RNA polymerases. Oncogene 2006, 25, 6384–6391. [Google Scholar] [CrossRef] [PubMed] [Green Version]
  55. Yin, S.; Liu, L.; Gan, W. The Roles of Post-Translational Modifications on mTOR Signaling. Int. J. Mol. Sci. 2021, 22, 1784. [Google Scholar] [CrossRef] [PubMed]
  56. Zhao, B.; Tumaneng, K.; Guan, K.-L. The Hippo pathway in organ size control, tissue regeneration and stem cell self-renewal. Nat. Cell Biol. 2011, 13, 877–883. [Google Scholar] [CrossRef] [PubMed]
  57. Halder, G.; Johnson, R.L. Hippo signaling: Growth control and beyond. Development 2011, 138, 9–22. [Google Scholar] [CrossRef] [PubMed] [Green Version]
  58. Accili, D.; Arden, K.C. FoxOs at the crossroads of cellular metabolism, differentiation, and transformation. Cell Biol. Int. 2004, 117, 421–426. [Google Scholar]
  59. Gao, J.; Jin, S.S.; He, Y.; Luo, J.H.; Xu, C.Q.; Wu, Y.Y.; Hou, C.S.; Wang, Q.; Diao, Q.-Y. Physiological analysis and transcriptome analysis of Asian honey bee (Apis cerana cerana) in response to sublethal neonicotinoid imidacloprid. Insects 2020, 11, 753. [Google Scholar] [CrossRef]
  60. Liu, F.; Li, W.; Li, Z.; Zhang, S.; Chen, S.; Su, S. High-abundance mRNAs in Apis mellifera: Comparison between nurses and foragers. J. Insect Physiol. 2011, 57, 274–279. [Google Scholar] [CrossRef] [PubMed]
  61. Chen, X.; Hu, Y.; Zheng, H.; Cao, L.; Niu, D.; Yu, D.; Sun, Y.; Hu, S.; Hu, F. Transcriptome comparison between honey bee queen-and worker-destined larvae. Insect Biochem. Mol. Biol. 2012, 42, 665–673. [Google Scholar] [CrossRef]
  62. He, X.J.; Wei, H.; Jiang, W.J.; Liu, Y.B.; Wu, X.B.; Zeng, Z. Honeybee (Apis mellifera) Maternal Effect Causes Alternation of DNA Methylation Regulating Queen Development. Sociobiology 2021, 68, 5935. [Google Scholar] [CrossRef]
Figure 1. Distribution of the lengths of the small RNA reads in the nurse bee (NB), forager bee (FB), and newly-emerged bee (NEB) libraries.
Insects 12 00764 g001
Figure 2. Distribution of known miRNAs (A) and novel miRNAs (B) in the nurse bee (NB), forager bee (FB), and newly-emerged bee (NEB) libraries.
Insects 12 00764 g002
Figure 3. Differentially expressed miRNAs among nurse bee (NB), forager bee (FB), and newly-emerged bee (NEB) libraries.
Insects 12 00764 g003
Figure 4. Gene ontology (GO) enrichment analysis of predicted target genes of the differentially expressed miRNAs identified in the NB vs. FB comparison, NB vs. NEB comparison, and FB vs. NEB comparison. NB: nurse bee, FB: forager bee, NEB: newly-emerged bee.
Insects 12 00764 g004
Figure 5. KEGG pathways analysis of predicted target genes of the differentially expressed miRNAs identified in the NB vs. FB comparison, NB vs. NEB comparison, and FB vs. NEB comparison. NB: nurse bee, FB: forager bee, NEB: newly-emerged bee.
Insects 12 00764 g005
Figure 6. Validation of differentially expressed miRNAs confirmed in the NB vs. FB comparison (A), the FB vs. NEB comparison (B), and the NB vs. NEB comparison (C) by qPCR analysis. NB: nurse bee, FB: forager bee, NEB: newly-emerged bee.
Insects 12 00764 g006
Table 1. Primers used in the present study.
miR-NamePrimer Sequences (5′ to 3′)Amplification Efficiencies
ame-miR-124-3pF: TAAGGCACGCGGTGAATGC0.98
ame-miR-184-3pF: CCTTATCATTCTCCTGTCCGGT0.97
ame-miR-210-3pF: GCGTTGTGCGTGTGACA0.97
ame-miR-3049-5pF: CGTCGGGAAGGTAGTTGC0.95
ame-miR-31a-5pF: GGCAAGATGTCGGCATA0.93
ame-miR-932-5pF: CCGTCAATTCCGTAGTGCATTGCAG0.93
ame-miR-993-3pF: GCGAAGCTCGTCTCTACAGGTATCT0.94
ame-miR-11-3pF: CGCATCACAGGCAGAGTTCTAGTT0.96
ame-miR-8-3pF: CGCGCGTAATACTGTCAGGTAAAGATG1.05
ame-miR-3477-5pF: CGCTAATCTCATGCGGTAACTGTGAG0.97
U6 (Reference)F: GTTAGGCTTTGACGATTTCG1.02
R: GGCATTTCTCCACCAGGTA
Table 2. Ten highest expressed miRNAs in the hypopharyngeal glands of nurse bee, forager bee, and newly-emerged bee.
RankNurse BeeForager BeeNewly-Emerged Bee
miR-NameReads CountmiR-NameReads CountmiR-NameReads Count
1ame-miR-276-3p242,234ame-miR-276-3p238,540ame-miR-276-3p486,993
2ame-miR-375-3p221,939ame-miR-375-3p68,526ame-miR-375-3p75,545
3ame-miR-14-3p104,814ame-miR-14-3p42,487ame-miR-14-3p70,958
4ame-miR-3477-5p86,004ame-miR-317-3p28,086ame-miR-3477-5p38,165
5ame-miR-317-3p62,651ame-miR-3477-5p22,349ame-miR-275-3p33,428
6ame-miR-8-3p52,599ame-miR-275-3p18,213ame-miR-8-3p17,168
7ame-miR-306-5p38,992ame-miR-2796-3p16,675ame-miR-2796-3p16,052
8ame-miR-275-3p38,214ame-miR-100-5p13,408ame-miR-263a-5p14,172
9ame-miR-12-5p27,484ame-miR-34-5p7870ame-miR-100-5p11,417
10ame-miR-11-3p14,083ame-miR-252a-5p7759ame-miR-252a-5p11,363
Table 3. Differentially expressed miRNAs among nurse bee, forager bee, and newly-emerged bee.
DEMsNB vs. FBNB vs. NEBFB vs. NEB
Log2 FCp-ValuesRegulatedLog2 FCp-ValuesRegulatedLog2 FCp-ValuesRegulated
ame-miR-11-3p2.257.18 × 10−6up---−1.337.62 × 10−4down
ame-miR-281-3p1.231.90 × 10−3up1.73.18 × 10−3up---
ame-miR-283-5p2.112.05 × 10−3up---−1.816.04 × 10−3down
ame-miR-31a-5p1.289.45 × 10−3up−1.952.10 × 10−3down−3.232.82 × 10−3down
ame-miR-3477-5p1.498.72 × 10−4up1.031.12 × 10−4up---
ame-miR-184-3p−1.482.45 × 10−3down−1.816.45 × 10−4down---
ame-miR-210-3p−1.678.23 × 10−3down---1.438.56 × 10−3up
ame-miR-252a-5p−2.248.64 × 10−3down−2.744.80 × 10−3down---
ame-miR-2788-3p−1.577.12 × 10−4down------
ame-miR-3791-3p−1.667.49 × 10−3down---4.918.03 × 10−4up
ame-miR-6047a-5p−1.155.72 × 10−3down---3.362.22 × 10−3up
ame-miR-279c-3p---1.381.26 × 10−3up---
ame-miR-6040-3p---3.639.35 × 10−3up---
ame-miR-6044-5p---1.72.27 × 10−4up---
ame-miR-124-3p---−2.173.82 × 10−4down---
ame-miR-125-5p---−1.333.02 × 10−3down---
ame-miR-276-3p---−1.167.17 × 10−3down---
ame-miR-3049-5p---−2.034.30 × 10−3down---
ame-miR-3785-3p---−2.131.14 × 10−5down−1.543.05 × 10−3down
ame-miR-92b-3p---−2.363.75 × 10−4down−1.562.18 × 10−3down
ame-miR-92c-3p---−1.418.15 × 10−3down--
ame-miR-932-5p---−2.851.80 × 10−3down−1.593.34 × 10−3down
ame-miR-993-3p---−2.776.31 × 10−3down−3.295.74 × 10−3down
ame-miR-263b-5p------2.323.44 × 10−3up
ame-miR-3770-5p-------3.46 × 10⁻³up
ame-miR-6052-5p------1.552.58 × 10−3up
ame-miR-12-5p------−1.123.28 × 10−3down
ame-miR-305-5p------−2.082.54 × 10−5down
ame-miR-3715-5p-------2.75 × 10⁻³down
ame-miR-79-3p------−1.232.34 × 10−3down
ame-miR-8-3p------−1.78.68 × 10−5down
Note: DEMs: differentially expressed miRNAs; NB: nurse bee; FB: forager bee; NEB: newly-emerged bee; Log2 FC: Log2-fold change.
Table 4. The notable potential target genes of five selected differentially expressed miRNAs.
miR-NamePotential Target Gene SymbolTarget Gene DescriptionKEGG PathwaysRegulation of miRNAs
ame-miR-252a-5pSTT3BSTT3, subunit of the oligosaccharyltransferase complex, homolog B [Apis mellifera]ko04141 (Protein processing in endoplasmic reticulum)Downregulated in hypopharyengeal glands of nurse
GstZ1glutathione S-transferase Z1 [Apis mellifera]ko00350 (Tyrosine metabolism)
LOC551016midasin [Apis mellifera]ko03008 (Ribosome biogenesis in eukaryotes)
LOC413650nuclear RNA export factor 1 [Apis mellifera]ko03008 (Ribosome biogenesis in eukaryotes)
SdhAsuccinate dehydrogenase A [Apis mellifera]ko00020 (Citrate cycle); ko00190 (Oxidative phosphorylation)
LOC113218834cytochrome b-c1 complex subunit 8-like [Apis mellifera]ko00190 (Oxidative phosphorylation)
LOC724652uncharacterized protein LOC724652 [Apis mellifera]ko00020 (Citrate cycle); ko00190 (Oxidative phosphorylation)
Ilp-2insulin-like peptide 2 [Apis mellifera]ko04150 (mTOR signaling pathway)
Ptenphosphatase and tensin-like [Apis mellifera]ko04150 (mTOR signaling pathway)
Daddaughters against dpp [Apis mellifera]ko04350 (TGF-beta signaling pathway)
ame-miR-184-3pLOC410870proton channel OtopLc [Apis mellifera]ko03010 (Ribosome)
InRSinsulin receptor substrate 1-B [Apis mellifera]ko04150 (mTOR signaling pathway)
LOC551830ral GTPase-activating protein subunit alpha-1 [Apis mellifera]ko04150 (mTOR signaling pathway); ko04115 (p53 signaling pathway); ko04910 (Insulin signaling pathway)
LOC100577028insulin-like growth factor I [Apis mellifera]ko04150 (mTOR signaling pathway)
ame-miR-11-3pLOC410744glucose dehydrogenase [FAD, quinone] [Apis mellifera]-Downregulated in hypopharyengeal glands of forager
LOC413098glucose dehydrogenase [FAD, quinone] [Apis mellifera]-
LOC552747glucosidase 2 subunit beta [Apis mellifera]-
LOC551303hexosaminidase D [Apis mellifera]ko00511 (Other glycan degradation)
LOC412161broad-complex core protein isoforms 1/2/3/4/5 isoform X1 [Apis mellifera] ko04214 (Apoptosis-fly)
Mblk-1transcription factor mblk-1-like [Apis mellifera]ko04214 (Apoptosis-fly)
E74ecdysteroid-regulated gene E74 [Apis mellifera]ko04214 (Apoptosis-fly)
LOC100577393epidermal growth factor receptor-like [Apis mellifera]ko04214 (Apoptosis-fly)
ame-miR-283-5pLOC726210myogenesis-regulating glycosidase [Apis mellifera]ko00052 (Galactose metabolism); ko00500 (Starch and sucrose metabolism)
LOC726547protein abrupt [Apis mellifera]ko04214 (Apoptosis-fly)
ame-miR-31a-5pLOC726547protein abrupt [Apis mellifera]ko04214 (Apoptosis-fly)
Publisher’s Note: MDPI stays neutral with regard to jurisdictional claims in published maps and institutional affiliations.

