Article

Testing Seven Hypotheses to Determine What Explains the Current Planthopper (Fulgoridae) Geographical and Species Richness Patterns in China

1
Institute of Entomology, Guizhou University, Guiyang 550025, China
2
Provincial Special Key Laboratory for Development and Utilization of Insect Resources of Guizhou, Guizhou University, Guiyang 550025, China
3
Guizhou Key Laboratory for Agricultural Pest Management of Mountainous Region, Guizhou University, Guiyang 550025, China
4
College of Animal Science, Guizhou University, Guiyang 550025, China
*
Author to whom correspondence should be addressed.
Insects 2020, 11(12), 892; https://doi.org/10.3390/insects11120892
Submission received: 18 November 2020 / Revised: 15 December 2020 / Accepted: 15 December 2020 / Published: 17 December 2020

Abstract

:

Simple Summary

Although there are many described species and ample geographical distribution data available on planthoppers (Fulgoridae) in China, the research on the underlying mechanisms of macro-scale richness patterns is still scant. To contribute to unraveling these mechanisms, we tested seven hypotheses related to contemporary environments and historical climate stability by relating the species richness to 15 environmental variables. The historical climate stability, ambient energy, and productivity hypotheses are superior to other hypotheses in explaining the current richness patterns of planthoppers. Based on these main hypotheses, we narrowed the mechanisms underlying contemporary planthopper distribution in China. Furthermore, other factors not included in this study (i.e., orogenic processes and geological isolation) may significantly contribute to richness patterns identified here.

Abstract

Although many hypotheses have been proposed to understand the mechanisms underlying large-scale richness patterns, the environmental determinants are still poorly understood, particularly in insects. Here, we tested the relative contributions of seven hypotheses previously proposed to explain planthopper richness patterns in China. The richness patterns were visualized at a 1° × 1° grid size, using 14,722 distribution records for 1335 planthoppers. We used ordinary least squares and spatial error simultaneous autoregressive models to examine the relationships between richness and single environmental variables and employed model averaging to assess the environmental variable relative roles. Species richness was unevenly distributed, with high species numbers occurring in the central and southern mountainous areas. The mean annual temperature change since the Last Glacial Maximum was the most important factor for richness patterns, followed by mean annual temperature and net primary productivity. Therefore, historical climate stability, ambient energy, and productivity hypotheses were supported strongly, but orogenic processes and geological isolation may also play a vital role.

Graphical Abstract

1. Introduction

Species richness, the simplest biodiversity index, is unevenly distributed on the Earth’s surface [1,2,3]. Identifying and understanding the factors and mechanisms responsible for the underlying spatial species richness variation have been major goals in biogeography and ecology since the 18th century [4,5,6,7]. This knowledge can provide valuable insights regarding biodiversity conservation in the context of global climate change [8,9,10]. To understand the mechanisms underlying species richness geographical patterns, numerous hypotheses have been proposed in the past few decades that are divided into modern environmental conditions (climate, habitat heterogeneity, and human activities) and evolutionary/historical processes (speciation, extinction, and dispersal).
Initial hypotheses were established based on the statistical relationships between modern environments and species richness patterns [1,11,12,13,14]. Among these, the energy hypothesis, including ambient energy, water–energy dynamics, and productivity versions received the most attention when originally proposed and are still the leading hypotheses [15,16,17,18]. Unfortunately, it is difficult to obtain robust mechanistic frameworks based only on modern explanations [19]. This is because species have evolved in the past in specific locations, and thus historical factors will inevitably affect the species richness distribution patterns [20]. In other words, the statistical relationships between modern environments and species richness relate poorly with the historical components underlying richness patterns. Indeed, early biogeographers observed the influence of historical climate factor on species richness, and the historical climate stability hypothesis was established on this basis. However, correlative studies claim that this hypothesis is of lower importance than the modern climate one [20,21,22]. It is noteworthy that the overwhelming role of the contemporary environment hypotheses in previous studies may not be correct, largely because the authors used coarse estimates of historical climates (e.g., time since the retreat of ice), resulting in a statistical bias in favor of modern explanations [8]. In recent years, with rapid climate model development for producing high-resolution palaeoclimatic data, a growing number of studies have shown that historical climate changes, particularly climate changes since the Last Glacial Maximum (LGM), are important in explaining current richness patterns [23,24,25]—sometimes exceeding modern environments [10,26,27]. Nevertheless, despite many efforts, there is still no consensus on the relative importance of various hypotheses representing contemporary environments and historical climate stability in shaping the diversity patterns, especially insects.
The planthopper superfamily Fulgoroidea (Insecta: Hemiptera) is one of the most numerous herbivorous insect species. The bizarre morphology is represented in many members of planthoppers, and a few species have been found with rows of cuticular gear (cog) teeth on the hind legs [28,29]. These characteristics has drawn great attention from biologists. Most planthoppers feed on the phloem tissue of woody or herbaceous plants, while a few feed on fungi, horseradish, mosses, or ferns [30,31]. Planthoppers are major agricultural pests, especially Sogatella furcifera, Nilaparvata lugens, and Laodelphax striatellus. They feed on a variety of crops, such as corn, wheat, barley, and rice [32]. Furthermore, some species can become vectors for plant pathogens, including bacteria, viruses, and phytoplasmas [33,34,35,36]. Planthoppers are distributed worldwide, and they occupy major biomes, such as tropical rainforests, deserts, and grasslands [32], and represent an excellent model for biogeography studies [37]. However, the statistical explanation for the geographic species richness distribution is poorly understood, especially in China.
China occupies a huge territory—broad latitudinal range, complex terrain, and a diverse climate from south to north (significant warm to cold gradient) and east to west (significant wet to dry gradient) [38,39]. The evolutionary history in China is significantly different from that in Europe and North America [40]. One obvious difference is that China was less affected by historical glaciation. This provides a good opportunity to understand what drove the factors and mechanisms of richness patterns in different biogeographic regions. Furthermore, biodiversity surveys have been conducted across the country in recent decades, providing basic research data for biogeographical comparisons. Cumulatively, China is an ideal region to investigate the richness–environment relationships. This study aimed to investigate the relationships between planthopper richness and environmental variables accounting for species richness geographical patterns testing seven hypotheses across China (Table 1) in an attempt to identify the most robust hypotheses explaining planthopper richness.

2. Materials and Methods

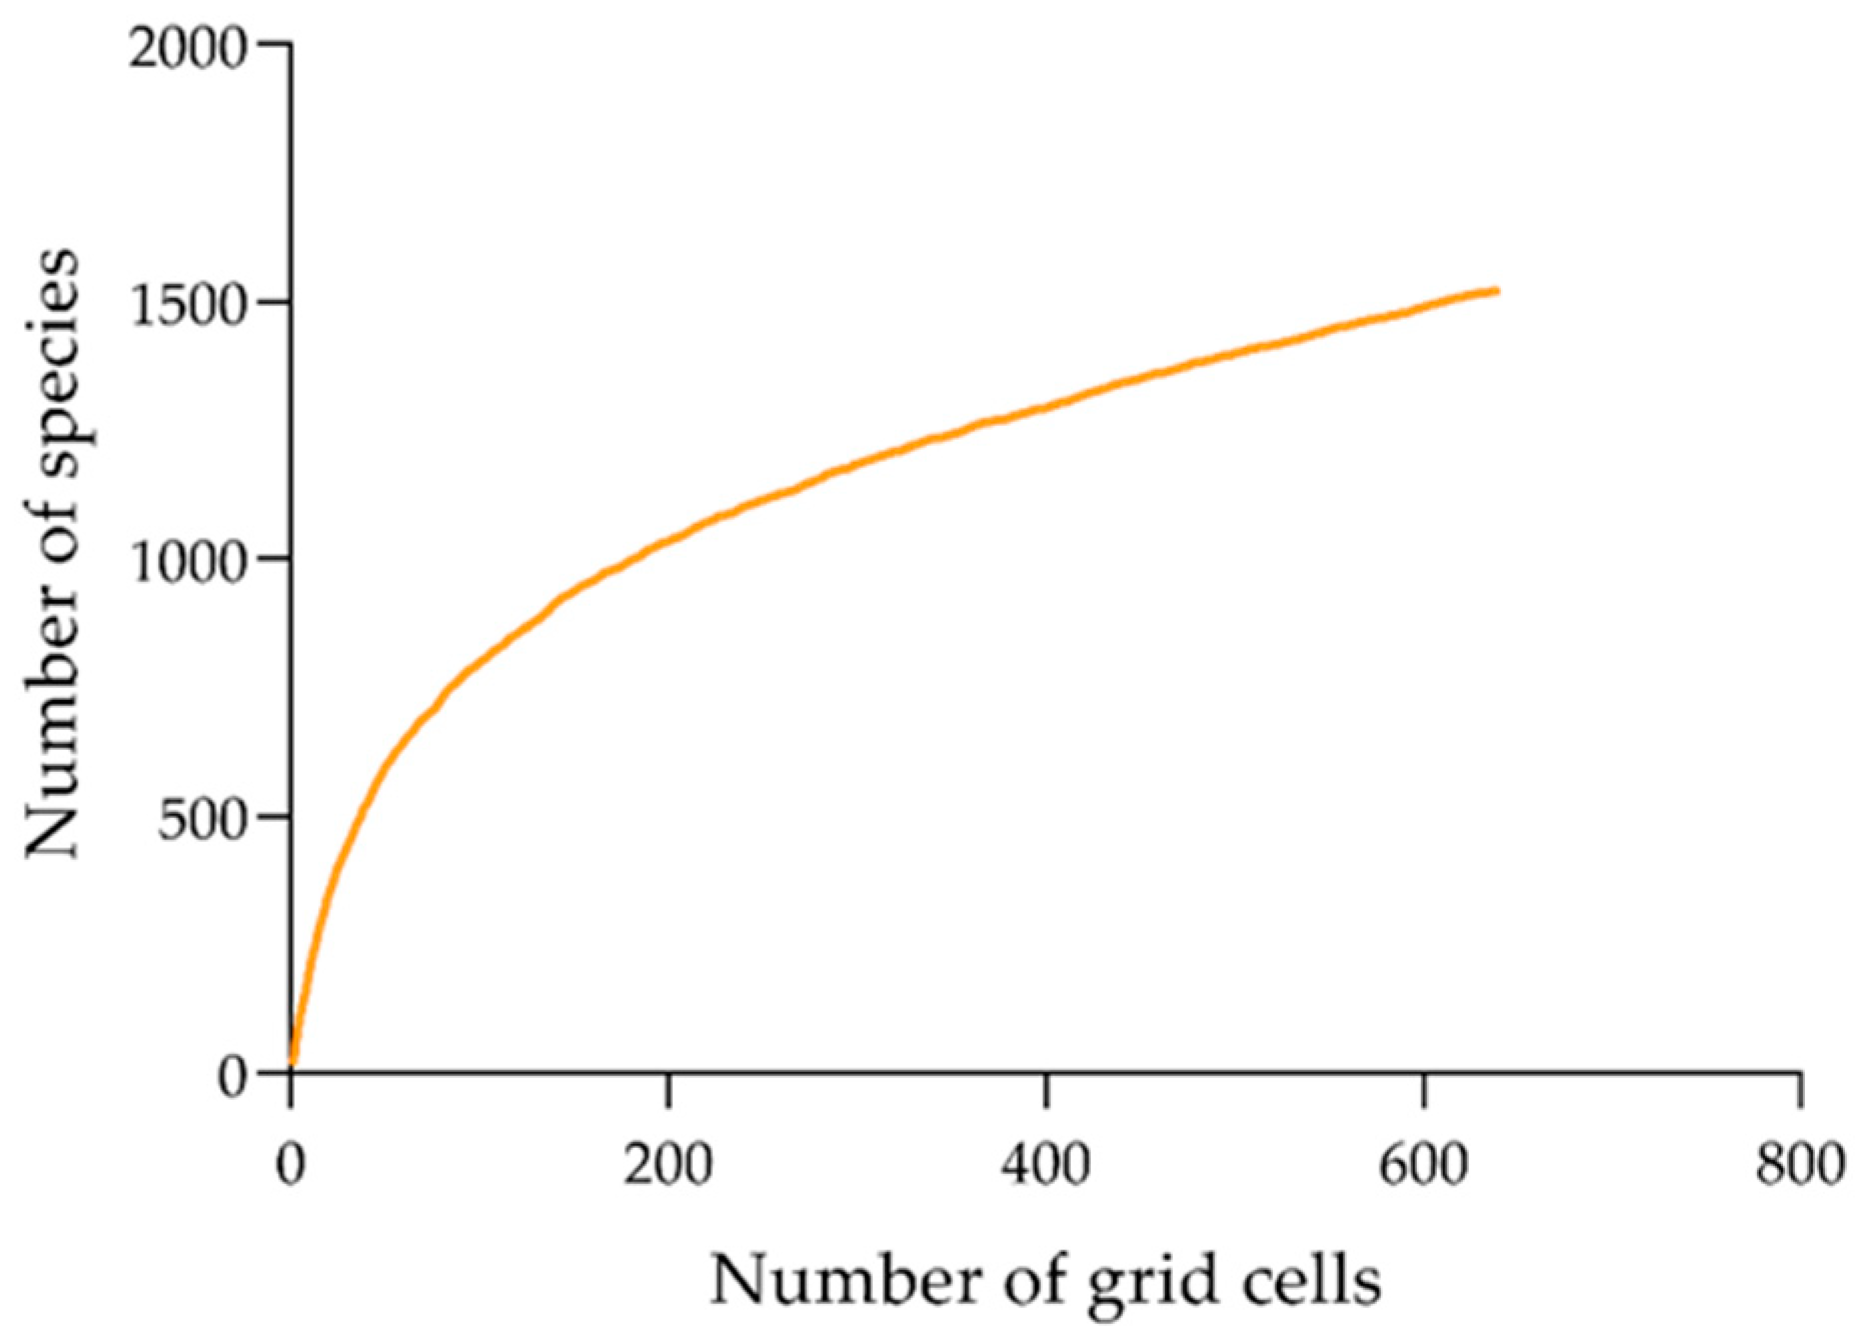
2.1. Species Distributional Data

We compiled a database of 14,722 distribution records for 1335 planthopper species, based on mainstream literature, books, MD/PhD theses, zoological records, China Knowledge Resource Integrated Database, GBIF website (https://www.gbif.org/), and specimens examined from the following museums: Zoological Museum, Institute of Zoology, Chinese Academy of Sciences; Institute of Entomology, Guizhou University; the insect collection of China Agricultural University, Hebei University, Nankai University, and Dali University; Entomological Museum, Northwestern A & F University; Shanghai Institute of Entomology, Chinese Academy of Sciences; Tianjin Museum of Natural History; and Taiwan Agricultural Research Institute. We obtained the locations at the city, county, or township levels from the original source. Locations included precise geographic coordinates at the original source, and the coordinates data was directly used in subsequent analysis; however, locations that had no geographic coordinates were georeferenced by identifying the corresponding administrative center in Google Earth. A 1° × 1° grid size (~100 km × 100 km) was employed to visualize the species richness patterns, considering the resolution of the distribution data and appropriateness for richness–environment relationship assessment.

2.2. Environmental Data

We related the planthopper species richness to the 15 environmental variables listed in Table 1 (what follows are expanded definitions): (i) ambient energy, mean annual temperature (MAT), and annual potential evapotranspiration (PET); (ii) water–energy dynamics, mean annual precipitation (MAP), and annual actual evapotranspiration (AET); (iii) environmental stability, temperature annual range (TAR), and precipitation seasonality (PS); (iv) productivity, normalized difference vegetation index (NDVI), and net primary productivity (NPP); (v) habitat heterogeneity, elevation range (ER; the difference between the maximum and minimum elevation in 1° grid), slope (SP), and topographical roughness (TR; see Equation (1)); (vi) human activities, human population (HPP), and gross domestic product (GDP); and (vii) historical climate stability, MAT and MAP change since the LGM (defined as MAT anomaly = |modernMAT − LGMMAT| and MAP anomaly = |modernMAP − LGMMAP|). The past climate model uncertainty was considered; MAT and MAP in LGM were represented by computing the mean of two available LGM simulations from the Model for Interdisciplinary Research on Climate Earth system (MIROC-ESM) and Community Climate System Model version 4 (CCSM4) models.
TR = 1 / Cos Slope     3.14159 / 180
where “Slope” is the slope of each 1° grid.
We obtained modern and LGM MAT/MAP, TAR, and TS from the WorldClim database (http://www.worldclim.org) using the data with a spatial resolution of 30 arc-seconds (~1 km2). PET and AET at 30 arc-seconds (~1 km2) spatial resolution were obtained from the CGIAR-CSI database (http://www.cgiar-csi.org). NDVI, NPP, HPP, and GDP were downloaded from the Resource and Environment Data Cloud Platform (http://www.resdc.cn/) with a spatial resolution of 1 km2. Elevation data were downloaded from CGIAR SRTM (http://srtm.csi.cgiar.org/) at 30 arc-seconds (~1 km2) spatial resolution, which was used to calculate ER, SP, and TR. To obtain the variable values in a 1° grid, we calculated the average of all 1 × 1 km2 grid cells using ArcGIS 10.5 (ESRI, Redlands, CA, USA).

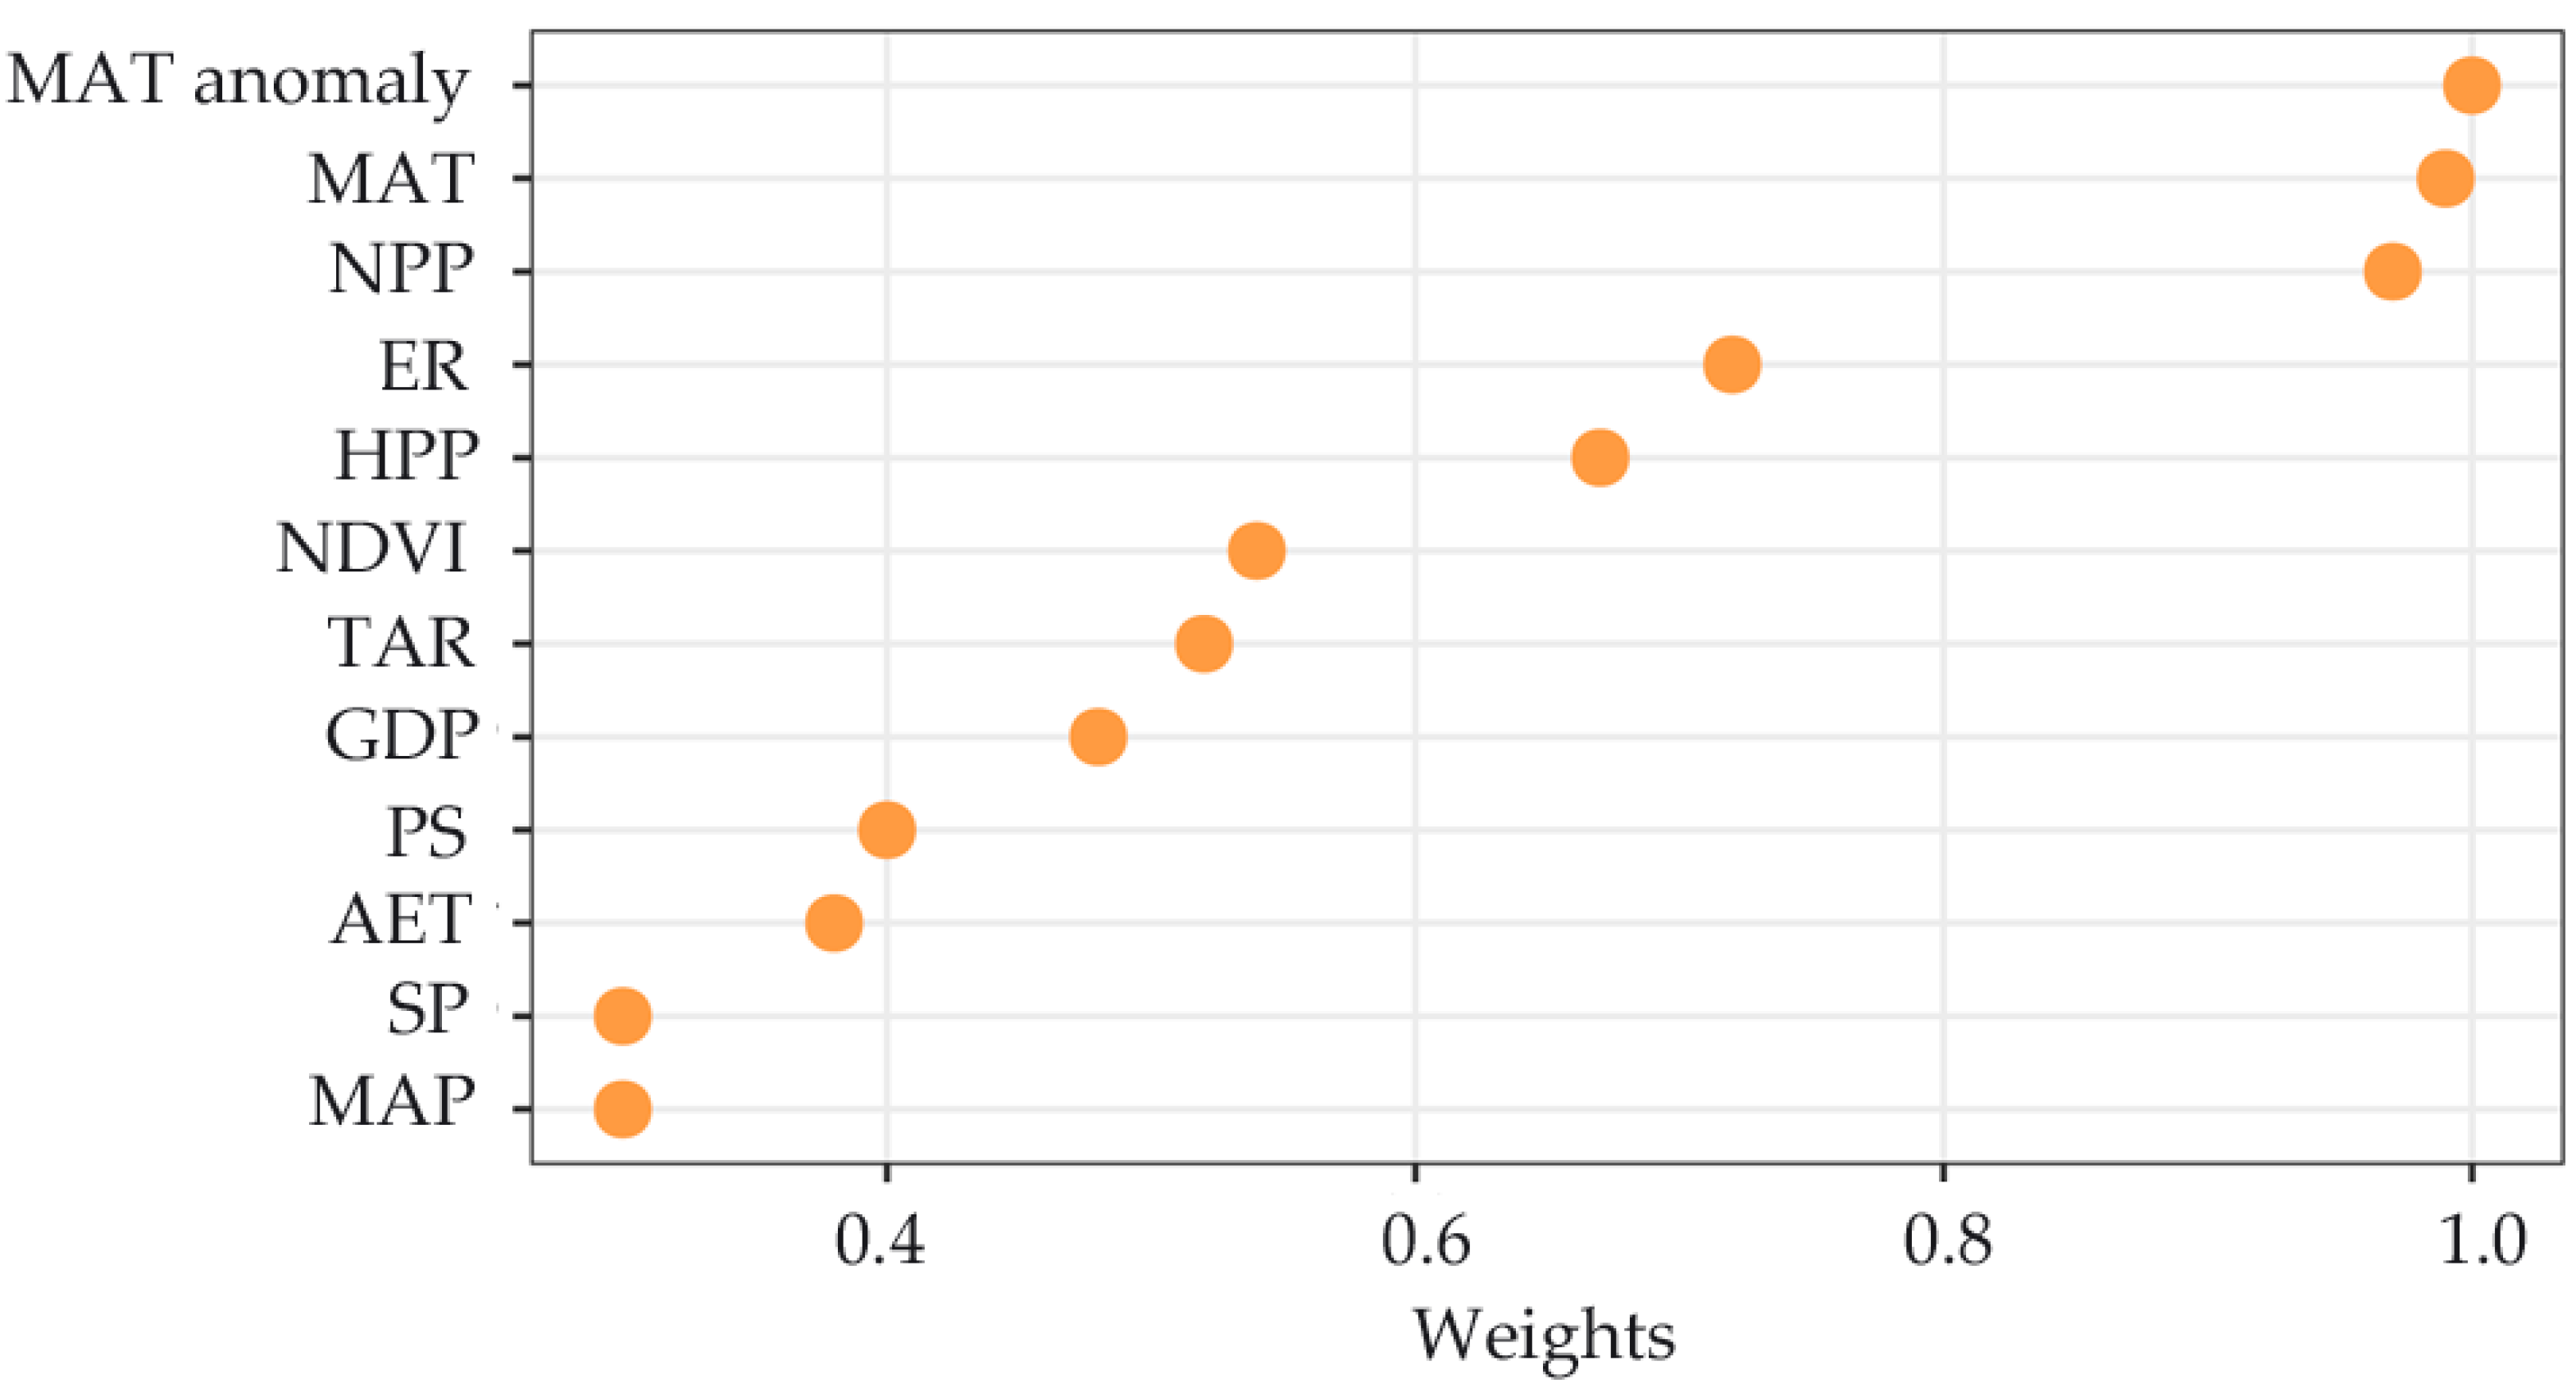
2.3. Statistical Analyses

As sampling bias may distort the geographic richness patterns [41] and further affect the reliable richness–environment relationship evaluation [42], assessing the quality of the collected distribution data is the first step in macroecological pattern analyses and inferences. Here, we employed a bootstrap species accumulation curve to assess data completeness across the study region. The presence (1) or absence (0) matrix for each species in each 1° grid was constructed and was analyzed using EstimateS 9.1 with 100 randomizations [43]. Furthermore, a linear regression was developed using the square-root transformed number of records as predictor variable and square-root transformed numbers of richness as response variable in each 1° grid cell, which aims to evaluate the species richness completeness in each grid. The p-value was reported using geographically effective degrees of freedom [44], evaluated using Spatial Analysis in Macroecology 4.0 [45].
We used ordinary least squares (OLS) models to examine the relationships between richness and each environmental variable. Also, spatial error simultaneous autoregressive (SARerr) models with spatial weights matrix row-standardization were fitted to account for the spatial autocorrelation in model residuals. The SARerr models were selected based on the lowest value of Akaike information criterion corrected for small sample sizes (AICc). Pseudo R2 in the SARerr models was defined as the squared Pearson correlation between predicted and observed (i.e., true) values [46]. The model averaging approach, a procedure to account for the model selection uncertainty, was used to evaluate the relative roles of environmental variables recognized as measures of the seven richness pattern hypotheses. We excluded PET, TR, and MAP anomaly in the model averaging because they did not significantly predict species richness in a univariate regression models (p > 0.05; see SARerr analysis in Table 2). To assess the significance of the 12 predictor variables’ multicollinearities, we computed variance inflation factors (VIFs). The VIFs for all remaining variables were <20 and were entered in the model averaging [18]. All possible variable combinations were built models, and these models were ranked based on the ascending AICc value. The importance of each variable was represented by the AIC weighted sums for the models in which they appear.
Before regression analyses, TAR, PS, ER, TR, GDP, HPP, and MAT anomaly were log10-transformed, and AET, SP, and MAP anomaly were square root-transformed. The remaining variables are not transformed. We additionally standardized (mean = 0 and standard deviation = 1) all variables. Statistical analyses were run in R 3.6.1 [47] using the MuMIn [48] and spdep [49] packages.

3. Results

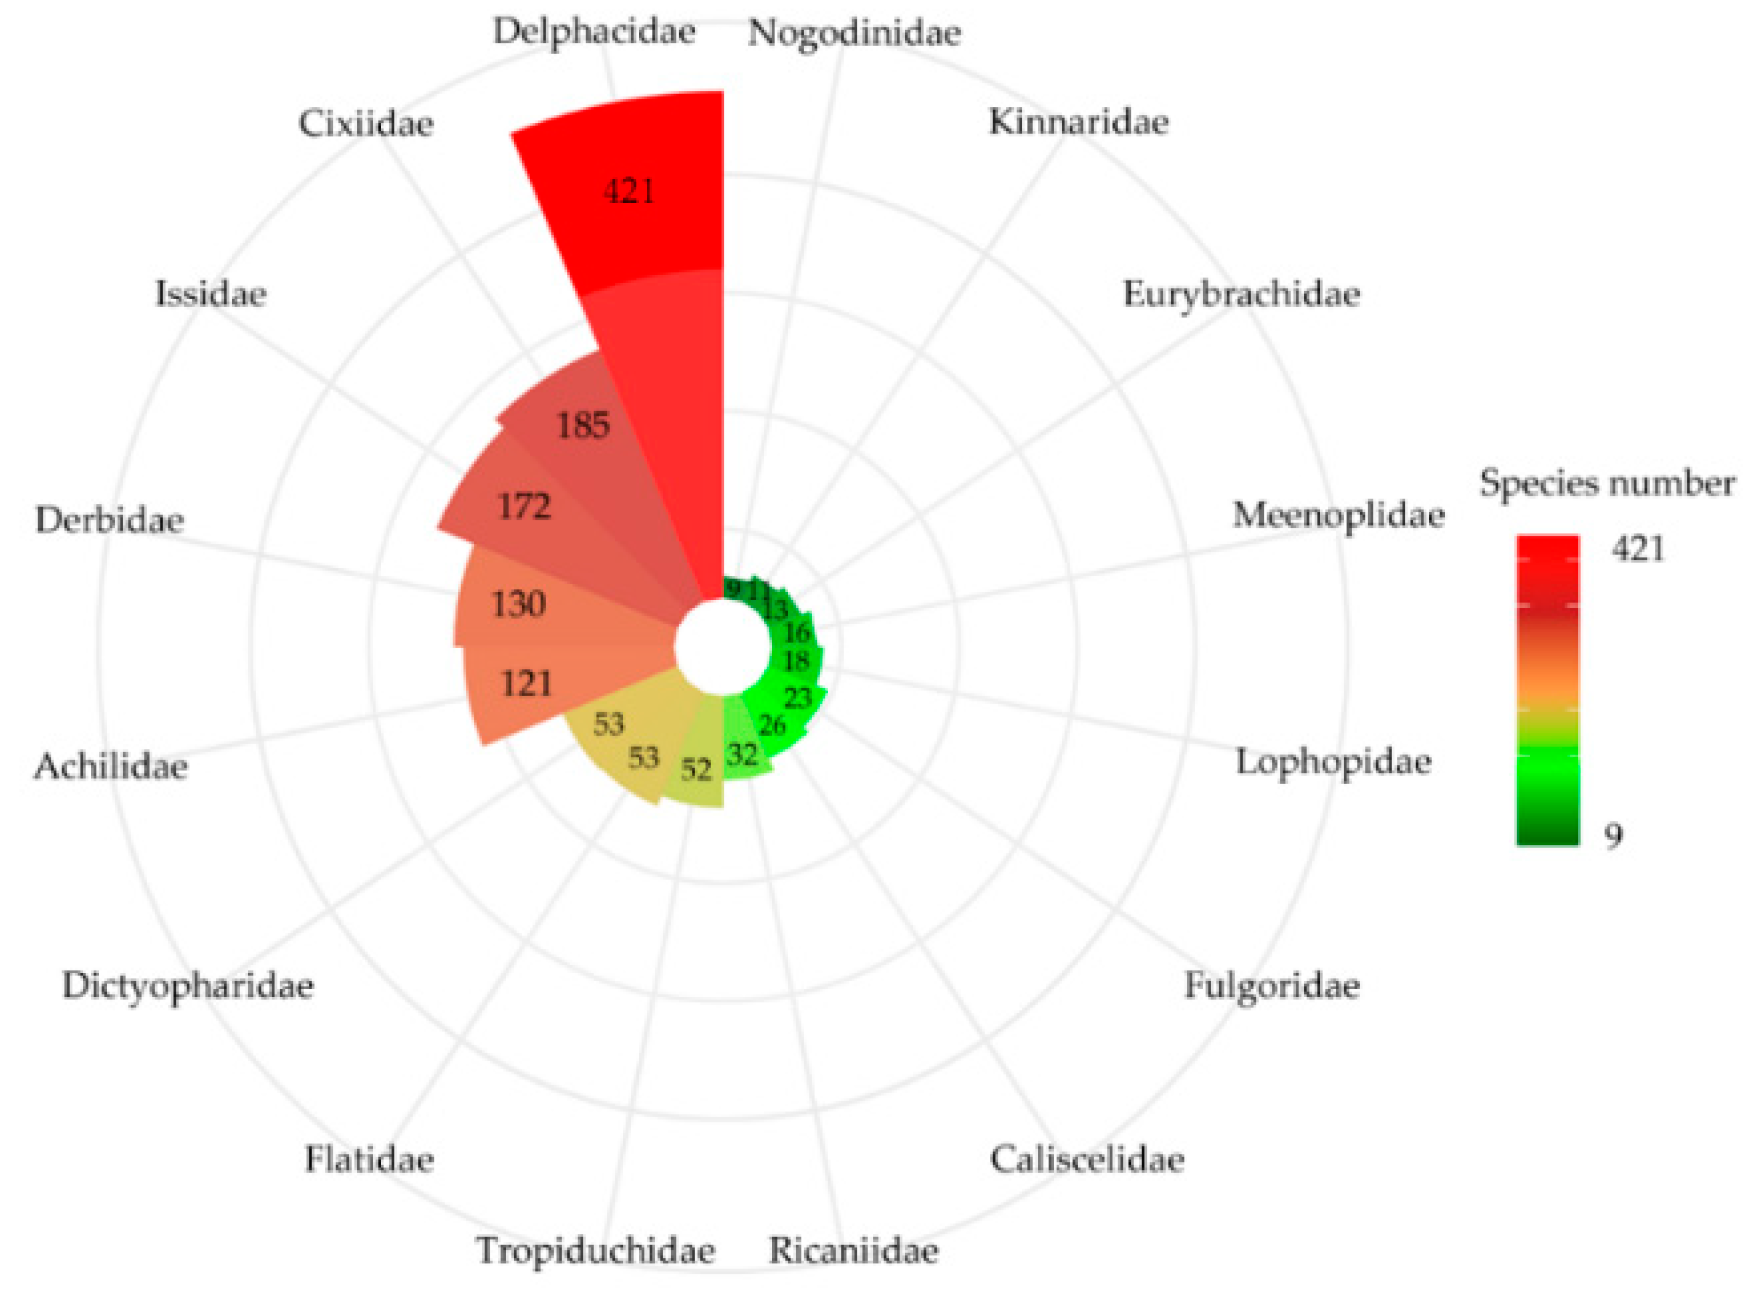
3.1. Planthopper Taxonomic Diversity

We worked with 1335 planthopper species (approximately 9.7% of the global species) with available distribution data belonging to 16 families. There were several different species number represented in each planthopper family, and several species-rich families were found (Figure 1). Delphacidae has the largest species number (421 species) accounting for 31.5% of the total number of species. This was followed by Cixiidae (185 species, 13.8% of all species), Issidae (172 species, 12.8% of all species), Derbidae (130 species, 9.7% of all species), and Achilidae (121 species, 9% of all species). The species number in the other families was ≤ 53.

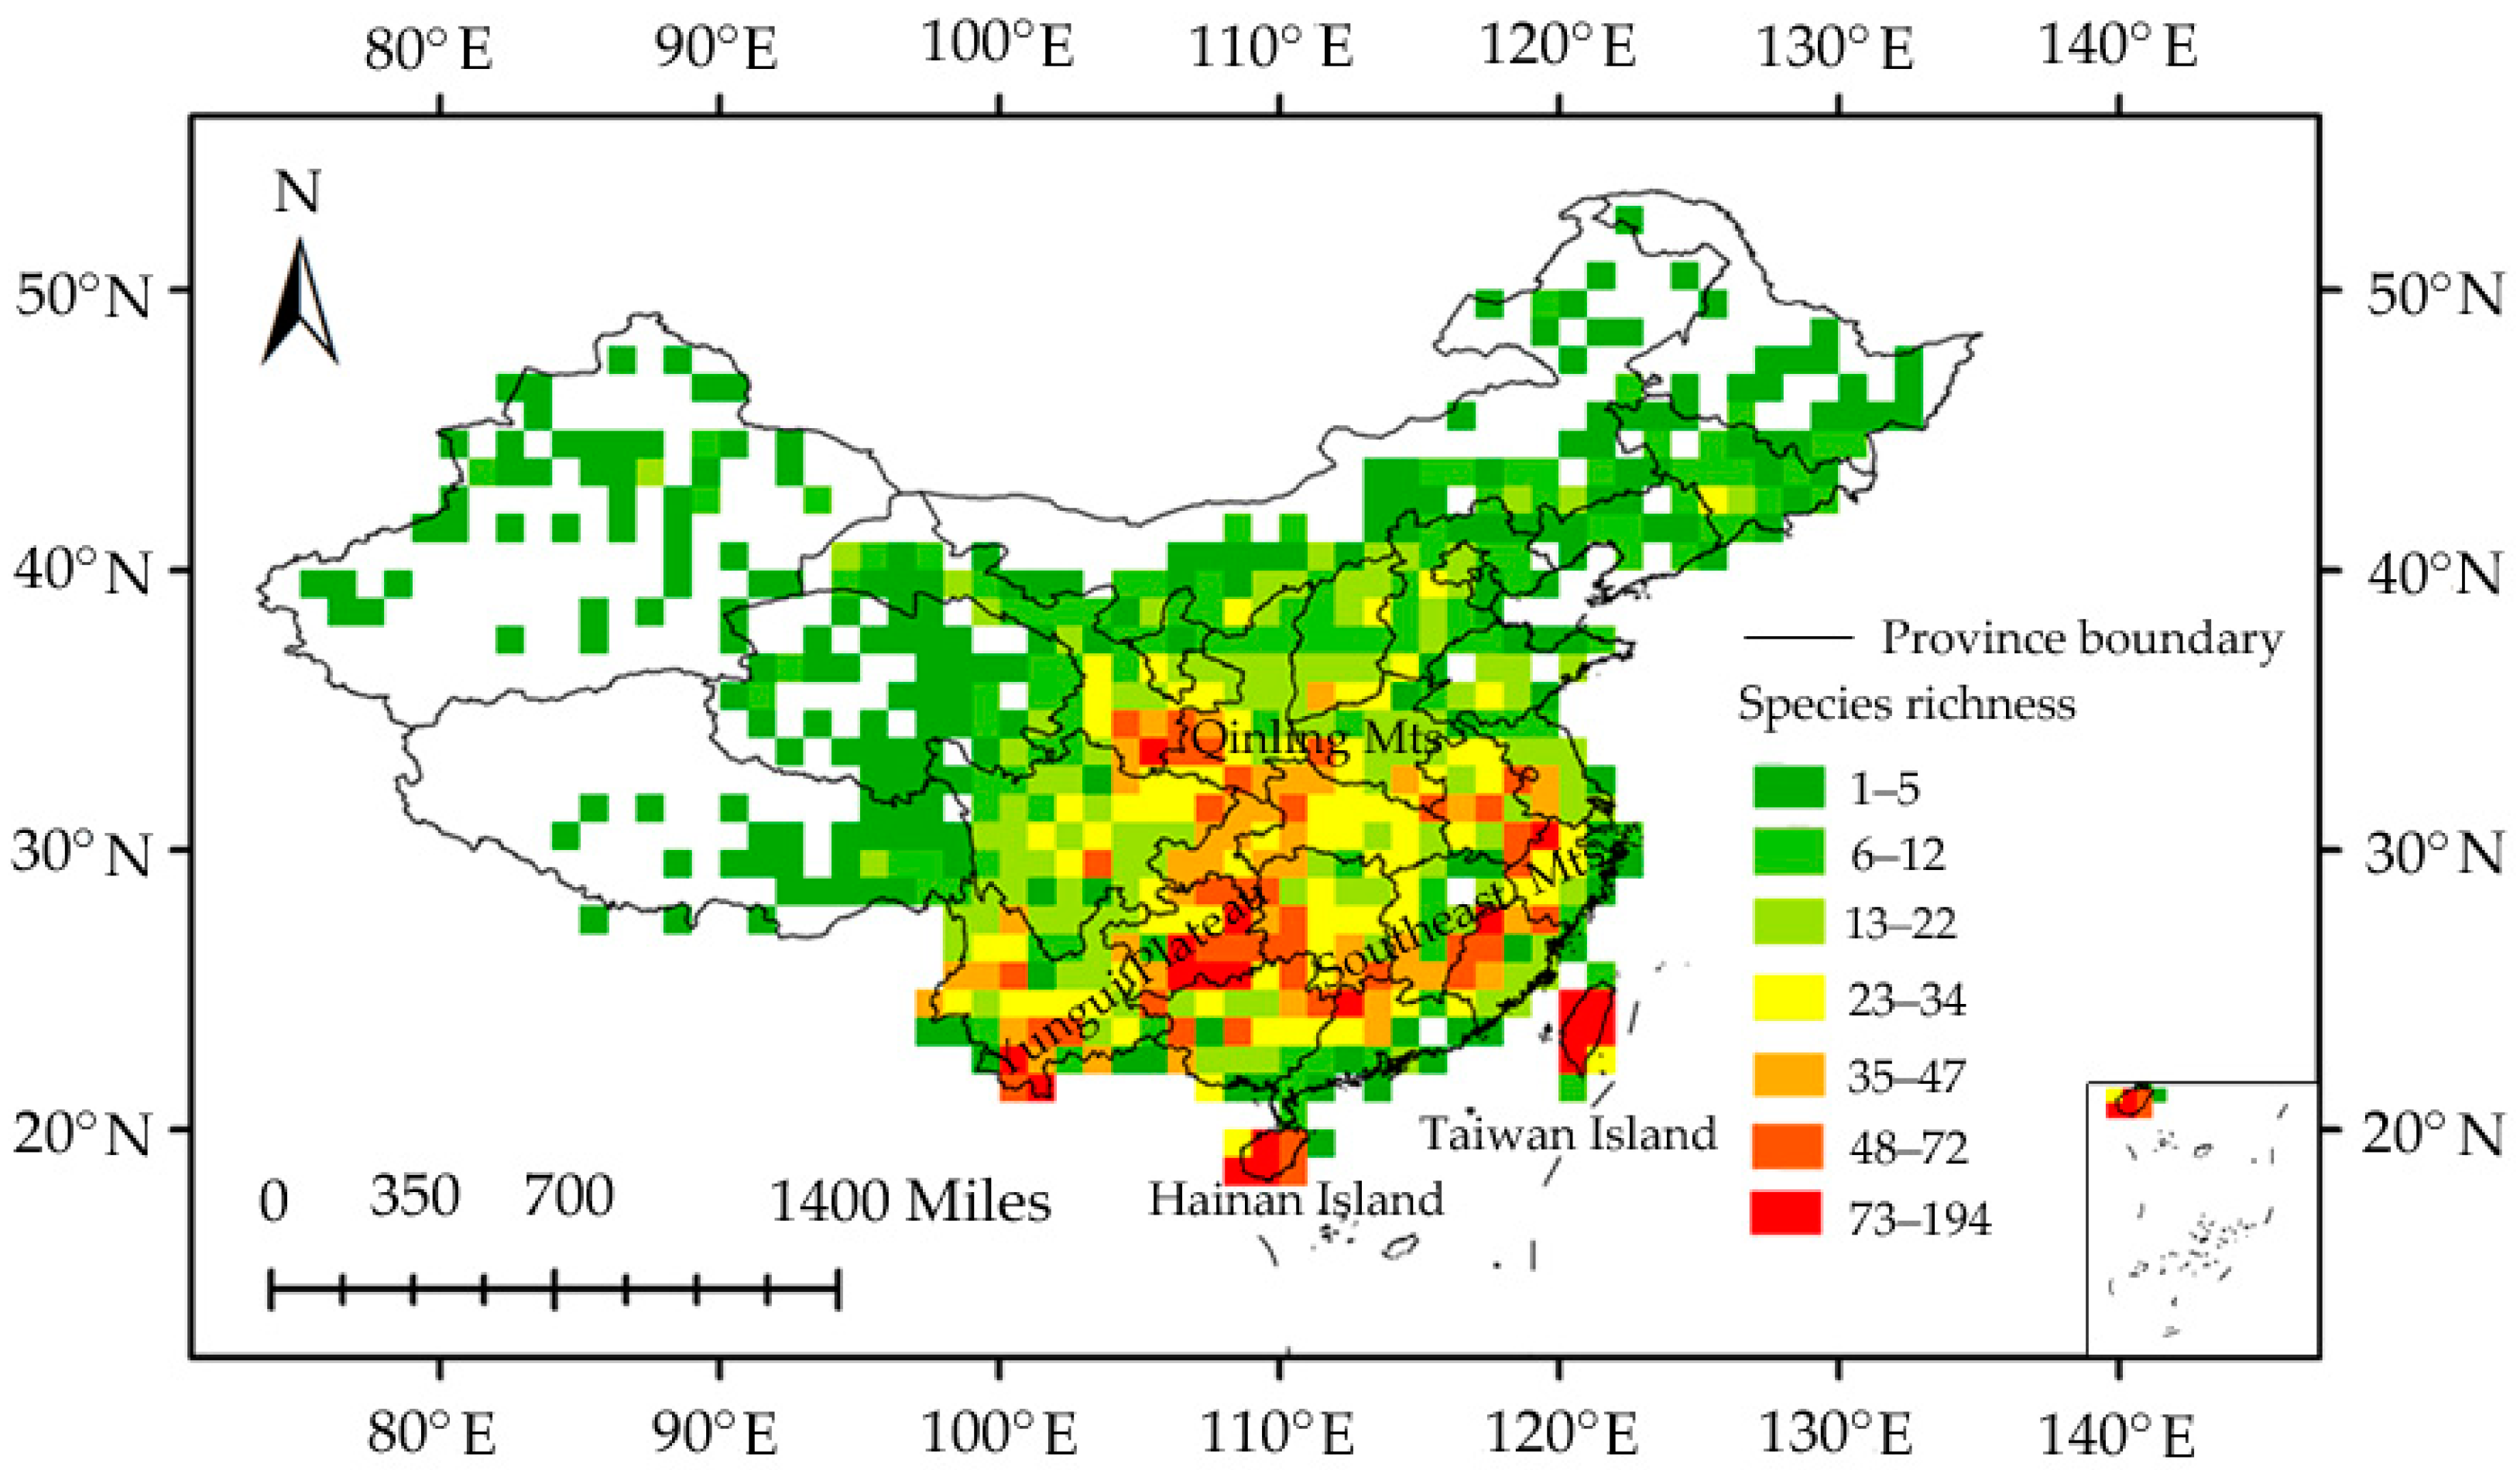
3.2. Species Richness–Environment Relationships

The “true” species number using species bootstrap accumulation curves was 1526 (Figure 2), and the data completeness degree across the region was 87.5%. Moreover, the observed species richness was >82.7% of the predicted species richness based on the linear regression (Figure 3). These results reflect a good sampling degree, allowing one to draw reliable conclusions between the richness patterns and relative environmental factor roles that regulate these patterns. Overall, spatial species richness patterns were unevenly distributed, with few species in northern China and a high number of species in central and southern China. Specifically, the Yungui Plateau, the Qinling Mountains, the Southeast Mountains, the Taiwan Island, and the Hainan Island showed the highest number of species (Figure 4).
The OLS models showed that species richness negatively correlated with TAR, PS, and MAT anomaly. However, species richness positively correlated with other variables (i.e., MAT, MAP, AET, NDVI, NPP, ER, SP, HPP, and GDP). PET, TR, and MAP anomaly have no significant correlation with species richness (Table 2). SARerr models revealed similar patterns that were identified in the OLS models (Table 2). Model averaging analyses showed that the MAT anomaly (historical climate stability) had the largest influence on species richness, followed by MAT (ambient energy) and NPP (productivity) (Figure 5). ER (habitat heterogeneity) and HPP (human activities) showed moderate contributions to species richness. All variables that are associated with water–energy dynamics and environmental stability had little effect on richness patterns (Figure 5).

4. Discussion

Paleoclimate changes caused by the Earth’s orbit have significantly altered the geographical distribution of species [50,51,52]. Consequently, the colder climate forced several species to survive in restricted glacial refuges. However, once the environmental conditions improved, many but not all species migrated from the refuges to the formerly glaciated lands [53,54]. In some respects, the modern species distribution is still controlled by post-glacial recolonization [55]. The historical climate change effect on contemporary species richness patterns depends on the ability to recolonize after the glacial period. Highly mobile species can track climate changes, whereas species with low dispersal ability have a harder time adapting [8,9,56] and leave a stronger historical signal in their contemporary distribution patterns.
The MAT anomaly has the strongest influence on richness patterns, with a negative correlation. Our results are consistent with the historical climate stability hypothesis, which claims that areas with long-term stable climates are conducive to persistence, speciation, and low extinction rates [50,52]; all these variables promote high species richness. Planthoppers are insects with reduced dispersal ability [37], which correlates with their inherently poor ability to track climate change. Previous studies have shown the low-temperature effect on planthopper mortality and survival. For example, the Nilaparvata lugens nymph mortality can reach 60% at 17.5 °C, 63.7% at 17 °C, and 100% at 13 °C [57,58]. The Sogatella furcifera nymph survival rate is only 10% at 17.5 °C [59]. These findings provide some evidence for planthopper cold tolerance and suggest that a large portion of planthopper species have gone extinct during the LGM, with only a few species surviving in northern China where most areas were below 0 °C (Figure 6). On the contrary, planthoppers living in the south were relatively less affected by the low LGM temperature and continued to survive. Furthermore, the long-term stable climate increased specialization, speciation rates, and novel clade evolution [50,52]. After the glacial period, the planthoppers in the south gradually migrated but did not completely occupy northern China owing to their low dispersal ability. These results show that historical climate changes can take precedence over modern environments in regard to planthopper distribution in China. Similarly, previous studies also observed that historical climate changes dominate low dispersal plant richness patterns in Europe and China [10,56]. Together, our results and other studies (e.g., [10,27,56]) suggest that dispersal ability is a critical factor for assessing the relative roles of contemporary versus historical factors in species distribution.
The idea of species richness spatial patterns determined by the available energy amount can be traced back to the early days of biogeography [60]. Higher energy availability promotes and maintains higher species richness in a given area [11,14,19,61]. The most common explanation for positive energy–richness is that a larger number of individuals in a population reduce the risk of stochastic extinction [62,63,64]. MAT and NPP have a strong and positive relationship with species richness (Table 2), supporting the ambient energy and productivity version of the energy hypotheses. The ambient energy hypothesis considers that species richness is directly regulated through an ambient or solar energy effect (often quantified in temperature) on the organism’s physiology [5,65,66,67]. For example, ectotherm (e.g., insects) reproduction is more efficient in environments with higher temperatures [67], and an increase in temperatures can promote certain behaviors, such as the number of ovipositions in Sogatella furcifera and Nilaparvata lugens [68,69,70]. Although the productivity hypothesis also claims that energy availability influences species richness, it focuses on the energy flowing in the food web (chemical energy) rather than the total energy going into a given region, which is more of an indirect effect on species richness. The high correlation between planthoppers and plant productivity is logical as these insects are herbivores. In our study, NDVI was a weaker predictor than NPP, which is consistent with results reported by Qian et al. [71] looking at amphibian and reptile species richness in China. This difference may be because NPP is a better representation of primary production. The water–energy hypothesis is less important than the ambient energy hypothesis. This is consistent with the relative role of the two hypotheses in regulating spatial invertebrate species richness patterns across latitudes [14], considering that China includes large regions of temperate and boreal climates [72].
Habitat heterogeneity has a significant impact on the geographical species richness patterns in different study areas and taxonomic taxa, sometimes becoming the most important driving factor [13,73,74]. Habitat heterogeneity promotes species richness by influencing ecological, historical, and evolutionary variables [75]. Although our results show that the habitat heterogeneity represented by ER and SP was positively associated with richness patterns, it was not an important factor as found in other studies related to insect richness–environment relationships across China [27,76,77,78]. Our results, together with previous findings, may imply that habitat heterogeneity does not dominate the insect richness patterns across China. The positive relationship between human activities and species richness is mediated by productivity [79,80,81]. The relatively low human activity role in this study may be related to the wide geographical study area, based on a previous study [82]. TAR and PS, two measures of short-term climate stability, also contributed weakly to regulating spatial species richness variation, indicating little support for the environmental stability hypothesis.
High richness of planthoppers was identified in mountainous areas (Figure 4). Nevertheless, the high species diversity in these areas cannot be simply explained by the ecological and historical processes found there. We suggest that orogenic processes and geological isolation also play an important role. In China, many studies have found that orogenic processes are an important driving force in promoting rapid insect speciation, such as aphids [83], moths [84], and Blattodea insects [85]. Additionally, the high species richness in the Taiwan and Hainan Islands (typical mountainous islands) is also attributed to the high speciation and diversification caused by their mainland isolation, as suggested in previous studies [54,86,87,88,89]. Therefore, it will be necessary to use a molecular phylogeny to test the importance of these factors in the modern patterns of planthopper richness in future works.

5. Conclusions

We investigated richness patterns of planthoppers in China and assessed the relative importance of seven proposed hypotheses related to ambient energy, water–energy dynamics, productivity, environmental stability, habitat heterogeneity, human activities, and historical climate stability in these patterns. High species richness was identified in the Yungui Plateau, the Qinling Mountains, the Southeast Mountains, the Taiwan Island, and the Hainan Island. The MAT change since the Last Glacial Maximum was the most influential variable in shaping planthopper richness patterns, which may be related to their poor post-glacial recolonization and low dispersal ability. We also observed that the MAT and NPP are two significant variables. By contrast, other environmental variables showed relatively weak influence. Our results support the historical climate stability, ambient energy, and productivity hypotheses. Orogenic processes and geological isolation may also influence current planthopper richness patterns.

Author Contributions

Conceptualization, Z.-X.Z. (Zheng-Xue Zhao) and X.-S.C.; methodology and software, Z.-X.Z. (Zheng-Xue Zhao); data collection and curation, L.Y., Z.-X.Z. (Zheng-Xiang Zhou), Y.Z., L.-J.Y., H.-X.L., Y.-J.S., N.G. and X.-Y.W.; writing—original draft preparation, Z.-X.Z. (Zheng-Xue Zhao); writing—review and editing, Z.-X.Z. (Zheng-Xue Zhao) and X.-S.C.; supervision, X.-S.C.; funding acquisition, J.-K.L., Z.-M.C. and X.-S.C. All authors have read and agreed to the published version of the manuscript.

Funding

This research was funded by the National Natural Science Foundation of China (grant nos. 32060343, 31472033, 31601886, 81460576); the Science and Technology Support Program of Guizhou Province (grant no. 20201Y129); the Program of Excellent Innovation Talents, Guizhou Province, China (grant no. 20154021); the Program of Scientific Research Foundation for Introduced Talent of Guizhou University (grant no. 201718); the Science and Technology Program of Guizhou Province (grant no. Qiankehejichu [2018]1031); Academic New Cultivation and Innovation Exploration Special Project of Guizhou University in 2018 (grant no. qiankehe and Platform for talents [2018]5781-29); and the Science and Technology Program of Guizhou Province (grant no. 20181031).

Conflicts of Interest

The authors declare no conflict of interest.

References

  1. Currie, D.J. Energy and large–scale patterns of animal–and plant–species richness. Am. Nat. 1991, 137, 27–49. [Google Scholar] [CrossRef]
  2. Gaston, K.J. Global patterns in biodiversity. Nature 2000, 405, 220–227. [Google Scholar] [CrossRef] [PubMed]
  3. Hillebrand, H. On the generality of the latitudinal gradient. Am. Nat. 2004, 163, 192–211. [Google Scholar] [CrossRef] [PubMed] [Green Version]
  4. Rosenzweig, M.L. Species Diversity in Space and Time; Cambridge University Press: Cambridge, UK, 1995. [Google Scholar]
  5. Willig, M.R.; Kaufman, D.M.; Stevens, R.D. Latitudinal gradients of biodiversity: Pattern, process, scale, and synthesis. Annu. Rev. Ecol. Evol. Syst. 2003, 34, 273–309. [Google Scholar] [CrossRef]
  6. Qian, H. Global tests of regional effect on species richness of vascular plants and terrestrial vertebrates. Ecography 2009, 32, 553–560. [Google Scholar] [CrossRef]
  7. Field, R.; Hawkins, B.A.; Cornell, H.V.; Currie, D.J.; Diniz–Filho, J.A.F.; Guégan, J.F.; Kaufman, D.M.; Kerr, J.T.; Mittelbach, G.G.; Oberdorff, T.; et al. Spatial species–richness gradients across scales: A meta–analysis. J. Biogeogr. 2009, 36, 132–147. [Google Scholar] [CrossRef]
  8. Araújo, M.B.; David, N.B.; Diniz–Filho, J.A.F.; Haywood, A.M.; Valdes, P.J.; Rahbek, C. Quaternary climate changes explain diversity among reptiles and amphibians. Ecography 2008, 31, 8–15. [Google Scholar] [CrossRef] [Green Version]
  9. Sandel, B.; Arge, L.; Dalsgaard, B.; Davies, R.G.; Gaston, K.J.; Sutherland, J.; Svenning, J.C. The influence of Late Quaternary climate–change velocity on species endemism. Science 2011, 334, 660–664. [Google Scholar] [CrossRef] [Green Version]
  10. Liu, Y.P.; Shen, Z.H.; Wang, Q.G.; Su, X.Y.; Zhang, W.J.; Shrestha, N.; Xu, X.Y.; Wang, Z.H. Determinants of richness patterns differ between rare and common species: Implications for Gesneriaceae conservation in China. Divers. Distrib. 2017, 23, 235–246. [Google Scholar] [CrossRef]
  11. Wright, D.H. Species–energy theory: An extension of species–area theory. Oikos 1983, 41, 496–506. [Google Scholar] [CrossRef] [Green Version]
  12. O’Brien, E.M. Climatic gradients in woody plant species richness: Towards an explanation based on an analysis of southern Africa’s woody flora. J. Biogeogr. 1993, 20, 181–198. [Google Scholar] [CrossRef]
  13. Kerr, J.T.; Packer, L. Habitat heterogeneity as a determinant of mammal species richness in high–energy regions. Nature 1997, 385, 252–254. [Google Scholar] [CrossRef]
  14. Hawkins, B.A.; Field, R.; Cornell, H.V.; Currie, D.J.; Guégan, J.F.; Kaufman, D.M.; Kerr, J.T.; Mittelbach, G.G.; Oberdorff, T.; O’Brien, E.M.; et al. Energy, water, and broad–scale geographic patterns of species richness. Ecology 2003, 84, 3105–3177. [Google Scholar] [CrossRef] [Green Version]
  15. Feng, G.; Yan, H.; Yang, X.T. Climate and food diversity as drivers of mammal diversity in Inner Mongolia. Ecol. Evol. 2019, 9, 2142–2148. [Google Scholar] [CrossRef]
  16. Xu, X.T.; Dimitrov, D.; Shrestha, N.; Rahbek, C.; Wang, Z.H. A consistent species richness–climate relationship for oaks across the northern Hemisphere. Glob. Ecol. Biogeogr. 2019, 28, 1051–1066. [Google Scholar] [CrossRef]
  17. Xu, Y.; Shen, Z.G.; Ying, L.X.; Zang, R.G.; Jiang, Y.X. Effects of current climate, paleo–climate, and habitat heterogeneity in determining biogeographical patterns of evergreen broad–leaved woody plants in China. J. Geogr. Sci. 2019, 29, 1142–1158. [Google Scholar] [CrossRef] [Green Version]
  18. Dong, Y.J.; Wu, N.Q.; Li, F.J.; Chen, X.Y.; Zhang, D.; Zhang, Y.T.; Huang, L.P.; Wu, B.; Lu, H.Y. Influence of monsoonal water–energy dynamics on terrestrial mollusk species–diversity gradients in northern China. Sci. Total Environ. 2019, 676, 206–214. [Google Scholar] [CrossRef]
  19. Currie, D.J.; Mittelbach, G.G.; Cornell, H.V.; Field, R.; Guégan, J.F.; Hawkins, B.A.; Kaufman, D.M.; Kerr, J.T.; Oberdorff, T.; O’Brien, M.; et al. Predictions and tests of climate–based hypotheses of broad–scale variation in taxonomic richness. Ecol. Lett. 2004, 7, 1121–1134. [Google Scholar] [CrossRef]
  20. Hawkins, B.A.; Porter, E.P.; Diniz–Filho, J.A.F. Productivity and history as predictors of the latitudinal diversity gradient of terrestrial birds. Ecology 2003, 84, 1608–1623. [Google Scholar] [CrossRef] [Green Version]
  21. Francis, A.P.; Currie, D.J. A globaly consistent richness–climate relationship for angiosperms. Am. Nat. 2003, 161, 523–536. [Google Scholar] [CrossRef]
  22. Hawkins, B.A.; Porter, E.E. Relative influences of current and historical factors on mammal and bird diversity patterns in deglaciated North America. Glob. Ecol. Biogeogr. 2003, 12, 475–481. [Google Scholar] [CrossRef] [Green Version]
  23. Feng, G.; Mao, L.F.; Sandel, B.; Swenson, N.G. High plant endemism in China is partially linked to reduced glacial-interglacial climate change. J. Biogeogr. 2016, 43, 145–154. [Google Scholar] [CrossRef]
  24. Feng, G.; Ma, Z.Y.; Sandel, B.; Mao, L.F.; Normand, N.; Ordonez, A.; Svenning, J.C. Species and phylogenetic endemism in angiosperm trees across the Northern Hemisphere are jointly shaped by modern climate and glacial–interglacial climate change. Glob. Ecol. Biogeogr. 2019, 28, 1393–1402. [Google Scholar] [CrossRef]
  25. Li, J.J.; Liu, H.H.; Wu, Y.X.; Zeng, L.D.; Huang, X.L. Spatial patterns and determinants of the diversity of Hemipteran insects in the Qinghai-Tibetan Plateau. Front. Ecol. Evol. 2019, 7, 165. [Google Scholar] [CrossRef] [Green Version]
  26. Sosa, V.; Loera, I. Influence of current climate, historical climate stability and topography on species richness and endemism in Mesoamerican geophyte plants. PeerJ 2017, 5, e3932. [Google Scholar] [CrossRef] [PubMed] [Green Version]
  27. Zhao, Z.X.; Jin, B.C.; Zhou, Z.X.; Yan, L.; Long, J.K.; Chen, X.S. Determinants of Delphacidae richness and endemism in China. Ecol. Entomol. 2020, 45, 1396–1407. [Google Scholar] [CrossRef]
  28. Burrows, M.; Sutton, G.P. Interacting gears synchronize propulsive leg movements in a jumping insect. Science 2013, 341, 1254–1256. [Google Scholar] [CrossRef] [Green Version]
  29. Burrows, M. Jumping mechanisms in Flatid planthoppers (Hemiptera, Flatidae). J. Exp. Biol. 2014, 217, 2590–2600. [Google Scholar] [CrossRef] [Green Version]
  30. Wilson, S.W.; Mitter, C.; Denno, R.F.; Wilson, M.R. Evolutionary patterns of host plant use by delphacid planthoppers and their relatives. In Planthoppers: Their Ecology and Management; Denno, R.F., Perfect, T.J., Eds.; Chapman and Hall: New York, NY, USA, 1994; pp. 7–45. [Google Scholar]
  31. Wheeler, A.G., Jr. Bryophagy in the Auchenorrhyncha: Seasonal history and habits of a moss specialist, Javesella Opaca (Beamer) (Fulgoroidea: Delphacidae). Proc. Entomol. Soc. Wash. 2003, 105, 599–610. [Google Scholar]
  32. O’Brien, L.B.; Wilson, S.W. Planthopper systematics and externalmorphology. In The Leafhoppers and Planthoppers; Nault, L.R., Rodriguez, J.G., Eds.; Wiley: New York, NY, USA, 1985; pp. 61–102. [Google Scholar]
  33. Nault, L.R.; Ammar, E.D. Leafhopper and planthopper transmission of plant viruses. Annu. Rev. Entomol. 1989, 34, 503–529. [Google Scholar] [CrossRef]
  34. Gatineau, F.; Larrue, J.; Clair, D.; Lorton, F.; Richardmolard, M.; Boudonpadieu, E. A new natural planthopper vector of stolbur phytoplasma in the genus pentastiridius (Hemiptera: Cixiidae). Eur. J. Plant Pathol. 2001, 107, 263–271. [Google Scholar] [CrossRef]
  35. Arocha, Y.; López, M.; Fernández, M.; Piñol, B.; Horta, D.; Peralta, E.L.; Almeida, R.; Carvajal, O.; Picornell, S.; Wilson, M.R.; et al. Transmission of a sugarcane yellow leaf phytoplasma by the delphacid planthopper Saccharosydne saccharivora, a new vector of sugarcane yellow leaf syndrome. Plant Pathol. 2005, 54, 634–642. [Google Scholar] [CrossRef] [Green Version]
  36. Wilson, S.W. Keys to the families of Fulgoromorpha with emphasis on planthoppers of potential economic importance in the southeastern United States (Hemiptera: Auchenorrhyncha). Fla. Entomol. 2005, 88, 464–481. [Google Scholar] [CrossRef]
  37. Liang, A.P. Cladistic biogeography of Cercopoidea and Fulgoroidea (Insecta: Homoptera) in China and adjacent regions. Acta Zootaxonomica Sin. 1998, 23, 132–167. [Google Scholar]
  38. Qian, H.; Wang, S.L.; Li, Y.L.; Wang, X.H. Breeding bird diversity in relation to environmental gradients in China. Acta Oecolo. 2009, 35, 819–823. [Google Scholar] [CrossRef]
  39. Luo, Z.H.; Tang, S.H.; Li, C.W.; Fang, H.X.; Hu, H.J.; Yang, J.; Ding, J.J.; Jiang, Z.G. Environmental effects on vertebrate species richness: Testing the energy, environmental stability and habitat heterogeneity hypotheses. PLoS ONE 2012, 7, e35514. [Google Scholar]
  40. Ricklefs, R.E. Community diversity: Relative roles of local and regional processes. Science 1987, 235, 167–171. [Google Scholar] [CrossRef]
  41. Hortal, J.; Lobo, J.M.; Jimenez–Valverde, A. Limitations of biodiversity databases: Case study on seed–plant diversity in Tenerife, Canary Islands. Conserv. Biol. 2007, 21, 853–863. [Google Scholar] [CrossRef]
  42. Yang, W.J.; Ma, K.P.; Kreft, H. Geographical sampling bias in a large distributional database and its effects on species richness–environment models. J. Biogeogr. 2013, 40, 1415–1426. [Google Scholar] [CrossRef]
  43. Colwell, R.K. EstimateS: Statistical Estimation of Species Richness and Shared Species from Samples. In User’s Guide and Application; EstimateS: Storrs, CT, USA, 2013. [Google Scholar]
  44. Dutilleul, P.; Clifford, P.; Richardson, S.; Hemon, D. Modifying the t test for assessing the correlation between two spatial processes. Biometrics 1993, 49, 305–314. [Google Scholar] [CrossRef]
  45. Rangel, T.F.; Diniz–Filho, J.A.F.; Bini, L.M. SAM: A comprehensive application for spatial analysis in macroecology. Ecography 2010, 33, 46–50. [Google Scholar] [CrossRef]
  46. Kissling, W.D.; Carl, G. Spatial autocorrelation and the selection of simultaneous autoregressive models. Glob. Ecol. Biogeogr. 2008, 17, 59–71. [Google Scholar] [CrossRef]
  47. R Core Team. R: A Language and Environment for Statistical Computing; R Foundation for Statistical Computing: Vienna, Austria, 2019. [Google Scholar]
  48. Bartoń, K. MuMIn: Multi–Model Inference, R package version 1.43.17; 2018. Available online: https://CRAN.R-project.org/package=MuMIn (accessed on 15 September 2020).
  49. Bivand, R.; Altman, M.; Anselin, L.; Assunção, R.; Berke, O.; Bernat, A.; Blanchet., G.; Blankmeyer, E.; Carvalho, M.; Christensen, B.; et al. spdep: Spatial Dependence: Weighting Schemes, Statistics and Models, R package version 1.1–2; 2019. Available online: https://CRAN.R-project.org/package=spdep (accessed on 20 May 2020).
  50. Dynesius, M.; Jansson, R. Evolutionary consequences of changes in species’ geographical distributions driven by Milankovitch climate oscillations. Proc. Natl. Acad. Sci. USA 2000, 97, 9115–9120. [Google Scholar] [CrossRef] [PubMed] [Green Version]
  51. Jansson, R.; Dynesius, M. The fate of clades in a world of re-current climatic change: Milankovitch oscillations and evolution. Annu. Rev. Ecol. Evol. Syst. 2002, 33, 741–777. [Google Scholar] [CrossRef]
  52. Jansson, R. Global patterns in endemism explained by past climatic change. Proc. R. Soc. B Biol. Sci. 2003, 270, 583–590. [Google Scholar] [CrossRef] [PubMed]
  53. Tribsch, A. Areas of endemism of vascular plants in the Eastern Alps in relation to Pleistocene glaciation. J. Biogeogr. 2004, 31, 747–760. [Google Scholar] [CrossRef]
  54. López–Pujol, J.; Zhang, F.M.; Sun, H.Q.; Ying, T.S.; Ge, S. Centres of plant endemism in China: Places for survival or for speciation? J. Biogeogr. 2011, 38, 1267–1280. [Google Scholar] [CrossRef]
  55. Svenning, J.C.; Skov, F. Limited filling of the potential range in European tree species. Ecol. Lett. 2004, 7, 565–573. [Google Scholar] [CrossRef]
  56. Svenning, J.C.; Skov, F. Ice age legacies in the geographical distribution of tree species richness in Europe. Glob. Ecol. Biogeogr. 2007, 16, 234–245. [Google Scholar] [CrossRef]
  57. Yi, H.J.; Sun, X.M.; Zhang, G.F. The effect of short-term temperature drop on the development of brown planthopper nymphs. China Plant Prot. 2008, 28, 15–16. [Google Scholar]
  58. Zhang, H.J.; Yang, H.Z.; Li, B.L. Effects of low temperature stress on occurrence of brown planthopper population. J. Anhui Agric. Sci. 2018, 46, 146–148. [Google Scholar]
  59. Feng, B.C.; Huang, C.W.; Wang, H.D.; Yao, J.; Song, L.J. Influence of temperature on the population dynamics of the whitebacked planthopper Sogatella furcifera (Horvath). Acta Entomol. Sin. 1985, 28, 390–397. [Google Scholar]
  60. von Humboldt, A. Ansichten der Natur: Mit Wissenschaftlichen Erläuterungen: Beide Teile in Enem Bande; JG Cotta’scher Verlag: Tübingen, Germany, 1808. [Google Scholar]
  61. Fine, P.V.A. Ecological and evolutionary drivers of geographic variation in species diversity. Annu. Rev. Ecol. Evol. Syst. 2015, 46, 369–392. [Google Scholar] [CrossRef] [Green Version]
  62. Srivastava, D.S.; Lawton, J.H. Why more productive sites have more species: An experimental test of theory using tree–hole communities. Am. Nat. 1998, 152, 510–529. [Google Scholar] [CrossRef] [PubMed]
  63. Hurlbert, A.H. Species–energy relationships and habitat complexity in bird communities. Ecol. Lett. 2004, 7, 714–720. [Google Scholar] [CrossRef]
  64. Evans, K.L.; James, N.A.; Gaston, K.J. Abundance, species richness and energy availability in the north American avifauna. Glob. Ecol. Biogeogr. 2006, 15, 372–385. [Google Scholar] [CrossRef]
  65. Turner, J.R.G.; Gatehouse, C.M.; Corey, C.A. Does solar energy control organic diversity? Butterflies, moths and the British climate. Oikos 1987, 48, 195–205. [Google Scholar] [CrossRef]
  66. Turner, J.R.G.; Lennon, J.J.; Lawrenson, J.A. British bird species distributions and the energy theory. Nature 1988, 335, 539–541. [Google Scholar] [CrossRef]
  67. Turner, J.R.G. Explaining the global biodiversity gradient: Energy, area, history and natural selection. Basic Appl. Ecol. 2004, 5, 435–448. [Google Scholar] [CrossRef]
  68. Li, R.D. Population growth of the brown planthopper, Nilaparvata lugens (Stål), as influenced by temperature. Acta Phytophylacica Sin. 1984, 11, 101–107. [Google Scholar]
  69. Ye, Z.X.; Qin, H.G.; Li, H. Effects of temperature and nutrition condition on the population in crease of white–backed planthopper. Acta Phytophylacica Sin. 1994, 21, 209–213. [Google Scholar]
  70. Shi, B.K.; Hu, C.X.; Huang, J.L.; Hou, M.L. Modeling the influence of temperature on development, survival and oviposition of the brown planthopper, Nilaparvata lugens. Acta Ecol. Sin. 2014, 34, 5868–5874. [Google Scholar]
  71. Qian, H.; Wang, X.H.; Wang, S.L.; Li, Y.L. Environmental determinants of amphibian and reptile species richness in China. Ecography 2007, 30, 471–482. [Google Scholar] [CrossRef]
  72. Fang, J.Y.; Wang, X.P.; Liu, Y.N.; Tang, Z.Y.; White, P.S.; Sanders, N.J. Multi–scale patterns of forest structure and species composition in relation to climate in northeast China. Ecography 2012, 35, 1072–1082. [Google Scholar] [CrossRef]
  73. Wang, Q.G.; Su, X.Y.; Shrestha, N.; Liu, Y.P.; Wang, S.Y.; Xu, X.Y.; Wang, Z.H. Historical factors shaped species diversity and composition of Salix in eastern Asia. Sci. Rep. 2017, 7, 42038. [Google Scholar] [CrossRef] [PubMed]
  74. Zhang, C.L.; Quan, Q.; Wu, Y.J.; Chen, Y.H.; He, P.; Qu, Y.H.; Lei, F.M. Topographic heterogeneity and temperature amplitude explain species richness patterns of birds in the Qinghai–Tibetan Plateau. Curr. Zool. 2017, 63, 131–137. [Google Scholar] [CrossRef] [PubMed] [Green Version]
  75. Stein, A.; Beck, J.; Meyer, C.; Waldmann, E.; Weigelt, P.; Kreft, H. Differential effects of environmental heterogeneity on global mammal species richness. Glob. Ecol. Biogeogr. 2015, 24, 1072–1083. [Google Scholar] [CrossRef]
  76. Shen, M.W.; Chen, S.B.; Bi, M.J.; Chen, W.D.; Zhou, K.X. Relationships between geographic patterns of ant species richness and environmental factors in China. Acta Ecol. Sin. 2016, 36, 7732–7739. [Google Scholar]
  77. Wei, J.F.; Niu, M.M.; Feng, J.N. Diversity and distribution patterns of scale insects in China. Ann. Entomol. Soc. Am. 2016, 109, 405–414. [Google Scholar] [CrossRef]
  78. Lyu, Y.M.; Wang, X.P.; Luo, J.C. Geographic patterns of insect diversity across China’s nature reserves: The roles of niche conservatism and range overlapping. Ecol. Evol. 2020, 10, 3305–3317. [Google Scholar] [CrossRef] [Green Version]
  79. Balmford, A.; Moore, J.L.; Brooks, T.; Burgess, N.D.; Hansen, L.A.; Williams, P.; Rahbek, C. Conservation conflicts across Africa. Science 2001, 291, 2616–2619. [Google Scholar] [CrossRef] [PubMed]
  80. Evans, K.L.; Gaston, K.J. People, energy and avian species richness. Glob. Ecol. Biogeogr. 2005, 14, 187–196. [Google Scholar] [CrossRef]
  81. Luck, G.W. The relationships between net primary productivity, human population density and species conservation. J. Biogeogr. 2007, 34, 201–212. [Google Scholar] [CrossRef]
  82. Wang, Z.H.; Rahbek, C.; Fang, J.Y. Effects of geographical extent on the determinants of woody plant diversity. Ecography 2013, 35, 1160–1167. [Google Scholar] [CrossRef]
  83. Chen, R.; Jiang, L.Y.; Chen, J.; Qiao, G.X. DNA barcoding reveals a mysterious high species diversity of conifer–feeding aphids in the mountains of southwest China. Sci. Rep. 2016, 6, 20123. [Google Scholar] [CrossRef] [Green Version]
  84. Cheng, R.; Jiang, N.; Xue, D.Y.; Li, X.X.; Ban, X.S.; Han, H.X. The evolutionary history of biston suppressaria (guenée) (Lepidoptera: Geometridae) related to complex topography and geological history. Syst. Entomol. 2016, 41, 732–743. [Google Scholar] [CrossRef]
  85. Che, Y.L.; Bai, Q.K.; Deng, W.B.; Liao, S.R.; He, J.J.; Simon, Y.W.H.; Wang, Z.Q. Uplift–driven diversification revealed by the historical biogeography of the cockroach Cryptocercus Scudder (Blattodea: Cryptocercidae) in eastern Asia. Syst. Entomol. 2020, 45, 60–72. [Google Scholar] [CrossRef] [Green Version]
  86. Yuan, S.; Huang, M.; Wang, X.S.; Ji, L.Q.; Zhang, Y.L. Centers of endemism and diversity patterns for Typhlocybine leafhoppers (Hemiptera: Cicadellidae: Typhlocybinae) in China. Insect Sci. 2013, 21, 523–526. [Google Scholar] [CrossRef]
  87. Wang, F.; Jiang, C.Z.; Liu, J.Z.; Wei, J.F. Areas of endemism for scale insects in China. J. Asia Pac. Entomol. 2017, 20, 1170–1174. [Google Scholar] [CrossRef]
  88. Gao, C.; Chen, J.; Li, Y.; Jiang, L.Y.; Qiao, G.X. Congruent patterns between species richness and areas of endemism of the Greenideinae aphids (Hemiptera: Aphididae) revealed by global–scale data. Zool. J. Linn. Soc. 2018, 83, 791–807. [Google Scholar] [CrossRef]
  89. Huang, X.L.; Qiao, G.X.; Lei, F.M. Use of parsimony analysis to identify areas of endemism of Chinese birds: Implications for conservation and biogeography. Int. J. Mol. Sci. 2010, 11, 2097–2108. [Google Scholar] [CrossRef] [PubMed] [Green Version]
Figure 1. Species number in each planthopper family.
Insects 11 00892 g001
Figure 2. Species bootstrapped accumulation curve.
Insects 11 00892 g002
Figure 3. Linear regression (y = 0.844x + 0.367) for the square-root number of records and square-root number of richness in a 1° grid.
Insects 11 00892 g003
Figure 4. Planthopper species richness patterns in a 1° grid size.
Insects 11 00892 g004
Figure 5. The Akaike information criterion (AIC) weighted sums for each environmental variable.
Insects 11 00892 g005
Figure 6. The LGM mean annual temperature (MAT) in China.
Insects 11 00892 g006
Table 1. The seven species richness hypotheses and their related environmental variables tested in this study.
HypothesesEnvironmental Variables
Ambient energyMean annual temperature (MAT)
Annual potential evapotranspiration (PET)
Water–energy dynamicsMean annual precipitation (MAP)
Annual actual evapotranspiration (AET)
ProductivityNormalized difference vegetation index (NDVI)
Net primary productivity (NPP)
Environmental stabilityTemperature annual range (TAR)
Precipitation seasonality (PS)
Habitat heterogeneityElevation range (ER)
Topographical roughness (TR)
Slope (SP)
Human activitiesHuman population (HPP)
Gross domestic product (GDP)
Historical climate stabilityMean annual temperature change since the LGM (MAT anomaly)
Mean annual precipitation change since the LGM (MAP anomaly)
Table 2. Univariate relationships between species richness and environmental variables using ordinary least squares (OLS) and spatial error simultaneous autoregressive (SARerr) models. Coefficients (coef), R2 (%), and Pseudo R2 (%) are shown. For the variable abbreviations, see Table 1.
Species Richness
CoefOLSR2OLSCoefSARPseudo R2SAR
MAT0.5631.9 ***0.4552.6 ***
PET−0.030.1 ns−0.0446 ns
MAP0.5733.4 ***0.5154 ***
AET0.5935.4 ***0.5554.9 ***
NDVI0.4621.3 ***0.3951.5 ***
NPP0.5530.3 ***0.4854.2 ***
TAR−0.5429.6 ***−0.4652.4 ***
PS−0.3713.8 ***−0.2848.8 ***
ER0.121.6 ***0.1747.6 ***
TR0.050.2 ns0.1546.1 ns
SP0.183.5 ***0.1847.5 ***
HPP0.4419.4 ***0.3650.7 ***
GDP0.3814.6 ***0.3149.5 ***
MAT anomaly−0.5530.5 ***−0.553.9 ***
MAP anomaly0.060.4 ns−0.0145.9 ns
***p < 0.001; ns, not significant (p > 0.05).
Publisher’s Note: MDPI stays neutral with regard to jurisdictional claims in published maps and institutional affiliations.

