New Mitochondrial Gene Rearrangement in Psyttalia concolor, P. humilis and P. lounsburyi (Hymenoptera: Braconidae), Three Parasitoid Species of Economic Interest


 ,
,
Abstract
Simple Summary
Abstract
1. Introduction
2. Materials and Methods
2.1. Sample Collection and Species Identification
2.2. DNA Extraction, Polymerase Chain Reaction (PCR) Amplification and Sequencing
2.2.1. Sanger Sequencing
2.2.2. Next Generation Sequencing
2.3. Mitogenome Assembly, Annotation and Analyses
2.4. Phylogenetic Analyses
3. Results and Discussion
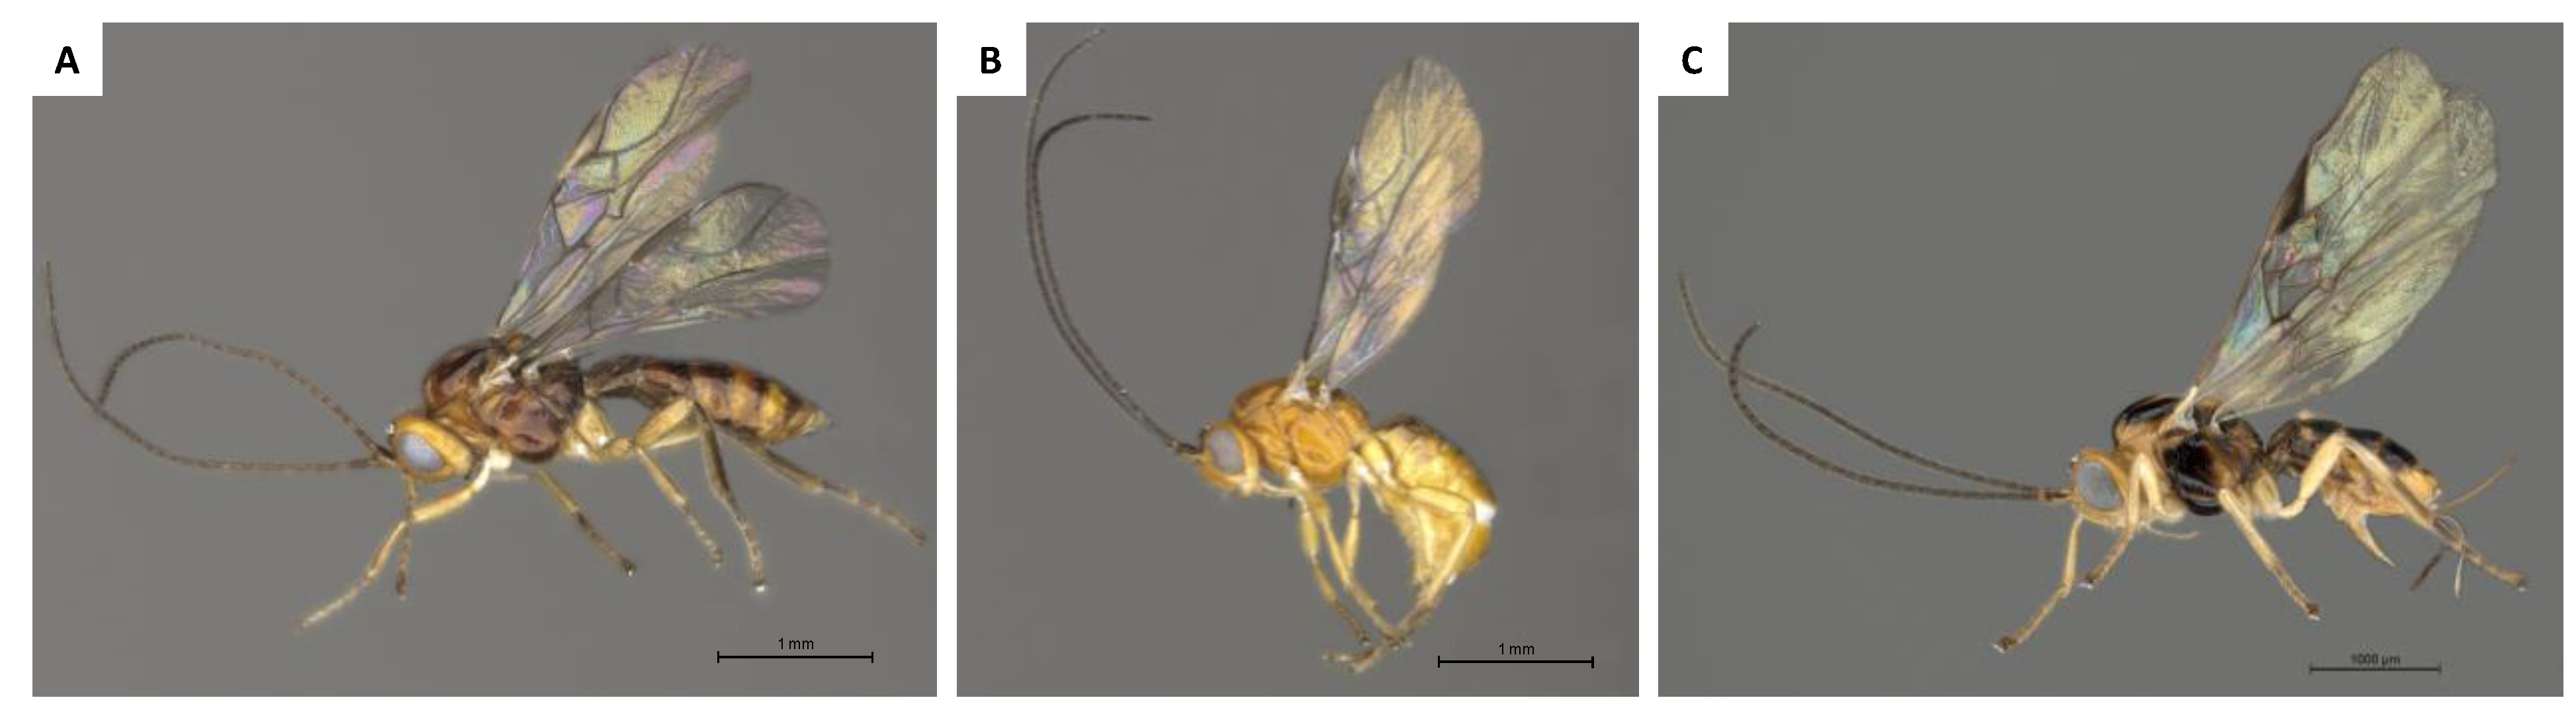
3.1. Morphological and Molecular Species Identification
3.2. Sequencing of the Psyttalia Mitogenomes
3.3. Organization and Composition of the Psyttalia Mitogenomes
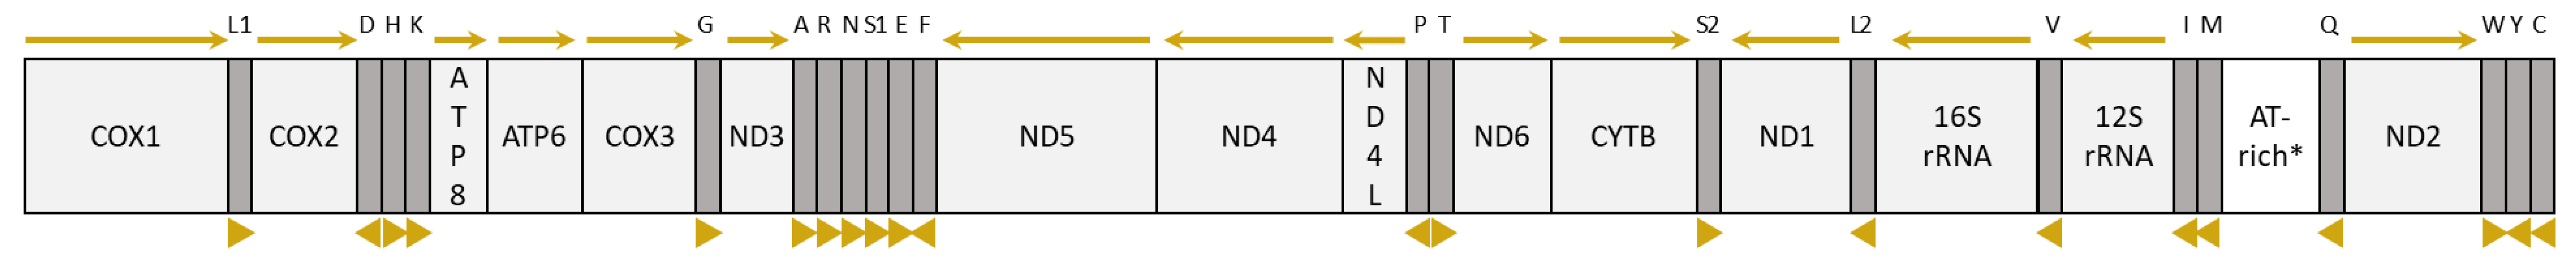
3.3.1. General Mitogenome Organization and Gene Content
3.3.2. Nucleotide Composition and Strand Asymmetry
3.4. tRNA Genes and Mitochondrial Gene Rearrangements in Braconidae
3.4.1. tRNA Structure and Anticodons
3.4.2. tRNA Rearrangements in Braconidae
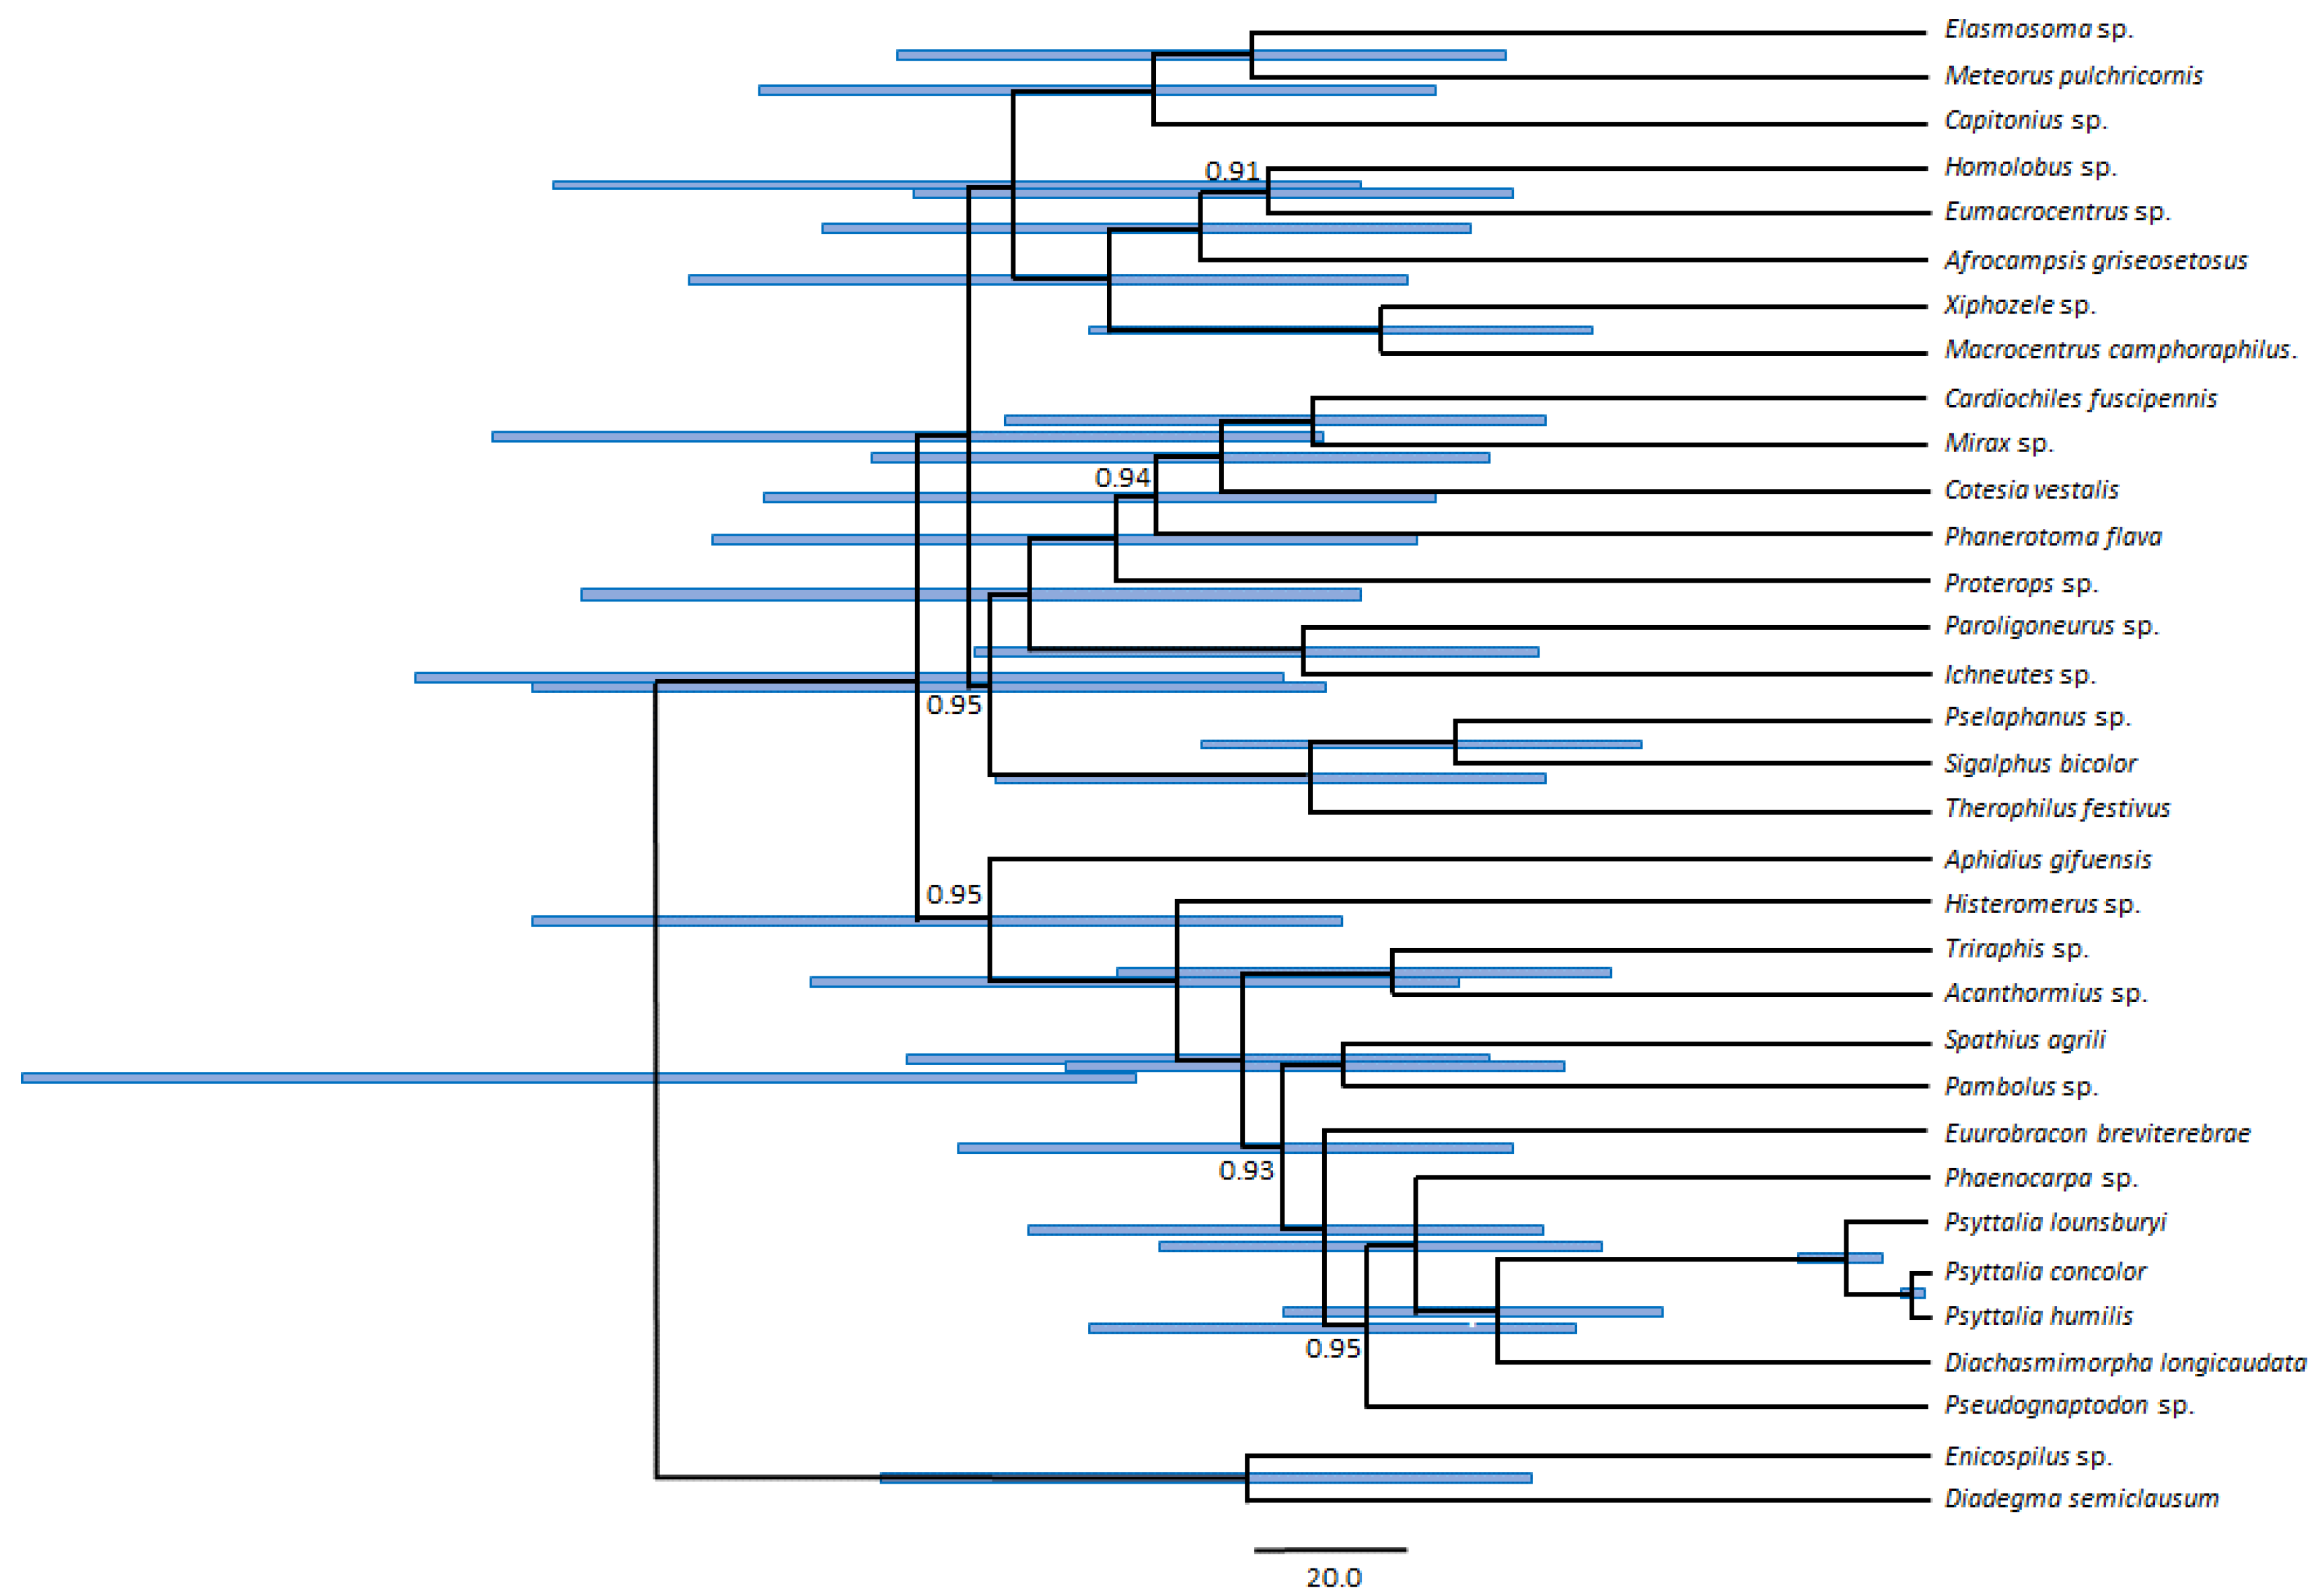
3.5. Phylogenetic Position of Psyttalia within Braconidae
Supplementary Materials
Author Contributions
Funding
Acknowledgments
Conflicts of Interest
References
- Shi, M.; Chen, X.X.; Van Achterberg, C. Phylogenetic relationships among the Braconidae (Hymenoptera: Ichneumonoidea) inferred from partial 16S rDNA, 28S rDNA D2, 18S rDNA gene sequences and morphological characters. Mol. Phylogenet. Evol. 2005, 37, 104–116. [Google Scholar] [CrossRef]
- Yu, D.S.; Van Achterberg, C.; Horstmann, K. World Ichneumonoidea 2011. In Taxonomy, Biology, Morphology and Distribution (Braconidae). Taxapad (Scientific Names for Information Management) Interactive Catalogue on DVD/CDROM; Vancouver, BC, Canada; 2012. [Google Scholar]
- Dowton, M. Relationships among the cyclostome braconid (Hymenoptera: Braconidae) subfamilies inferred from a mitochondrial tRNA gene rearrangement. Mol. Phylogenet. Evol. 1999. [Google Scholar] [CrossRef] [PubMed]
- Dowton, M.; Belshaw, R.; Austin, A.D.; Quicke, D.L.J. Simultaneous molecular and morphological analysis of braconid relationships (Insecta: Hymenoptera: Braconidae) indicates independent mt-tRNA gene inversions within a single wasp family. J. Mol. Evol. 2002, 54, 210–226. [Google Scholar] [CrossRef] [PubMed]
- Achterberg, C. van Apanteles (Choeras) gielisi spec. nov. (Hymenoptera: Braconidae: Microgastrinae) from The Netherlands and the first report of Trichoptera as host of Braconidae. Zool. Meded. 2002, 76, 53–60. [Google Scholar]
- Wharton, R.A.; Shaw, S.R.; Sharkey, M.J.; Wahl, D.B.; Woolley, J.B.; Whitfield, J.B.; Marsh, P.M.; Johnson, W. Phylogeny of the subfamilies of the family Braconidae (Hymenoptera: Ichneumonoidea): A reassessment. Cladistics 1992. [Google Scholar] [CrossRef]
- Gauld, I.D. Evolutionary patterns of host utilization by ichneumonoid parasitoids (Hymenoptera: Ichneumonidae and Braconidae). Biol. J. Linn. Soc. 1988, 35, 351–377. [Google Scholar] [CrossRef]
- Zaldivar-Riverón, A.; Mori, M.; Quicke, D.L.J. Systematics of the cyclostome subfamilies of braconid parasitic wasps (Hymenoptera: Ichneumonoidea): A simultaneous molecular and morphological Bayesian approach. Mol. Phylogenet. Evol. 2006, 38, 130–145. [Google Scholar] [CrossRef]
- Belshaw, R.; Fitton, M.; Herniou, E.; Gimeno, C.; Quicke, D.L.J. A phylogenetic reconstruction of the Ichneumonoidea (Hymenoptera) based on the D2 variable region of 28S ribosomal RNA. Syst. Entomol. 1998, 23, 109–123. [Google Scholar] [CrossRef]
- Belshaw, R.; Quicke, D.L.J. A Molecular Phylogeny of the Aphidiinae (Hymenoptera:Braconidae). Mol. Phylogenet. Evol. 1997, 7, 281–293. [Google Scholar] [CrossRef]
- Dowton, M.; Austin, A.D.; Antolin, M.F. Evolutionary relationships among the Braconidae (Hymenoptera: Ichneumonoidea) inferred from partial 16S rDNA gene sequences. Insect Mol. Biol. 1998, 7, 129–150. [Google Scholar] [CrossRef]
- Rice, R.E.; Phillips, P.A.; Stewart-leslie, J.; Sibbett, G.S. Olive fruit fly populations measured in Central and Southern California. Calif. Agric. 2003, 57, 122–127. [Google Scholar] [CrossRef]
- Hladnik, M. A review of plant protection against the olive fly (Bactrocera oleae (Rossi, 1790) Gmelin) and molecular methods to monitor the insecticide resistance alleles. Acta Agric. Slov. 2017, 109, 135–146. [Google Scholar] [CrossRef]
- Vontas, J.G.; Hejazi, M.J.; Hawkes, N.J.; Cosmidis, N.; Loukas, M.; Hemingway, J. Resistance-associated point mutations of organophosphate insensitive acetylcholinesterase, in the olive fruit fly Bactrocera oleae. Insect Mol. Biol. 2002. [Google Scholar] [CrossRef] [PubMed]
- Kakani, E.G.; Ioannides, I.M.; Margaritopoulos, J.T.; Seraphides, N.A.; Skouras, P.J.; Tsitsipis, J.A.; Mathiopoulos, K.D. A small deletion in the olive fly acetylcholinesterase gene associated with high levels of organophosphate resistance. Insect Biochem. Mol. Biol. 2008. [Google Scholar] [CrossRef] [PubMed]
- Vontas, J.G.; Cosmidis, N.; Loukas, M.; Tsakas, S.; Hejazi, M.J.; Ayoutanti, A.; Hemingway, J. Altered acetylcholinesterase confers organophosphate resistance in the olive fruit fly Bactrocera oleae. Pestic. Biochem. Physiol. 2001. [Google Scholar] [CrossRef]
- Pereira-Castro, I.; Van Asch, B.; Trinidade Rei, F.; Texeira Da Costa, L. Bactrocera oleae (Diptera: Tephritidae) organophosphate resistance alleles in Iberia: Recent expansion and variable frequencies. Eur. J. Entomol. 2014, 112, 20–26. [Google Scholar] [CrossRef]
- Daane, K.M.; Johnson, M.W. Olive Fruit Fly: Managing an Ancient Pest in Modern Times Olive Fruit Fly: Managing an Ancient Pest in Modern Times. Annu. Rev. Entomol. 2010, 55, 157–169. [Google Scholar] [CrossRef]
- Silvestri, F. Report of an Expedition to Africa in Search of the Natural Enemies of Fruit Flies (Trypaneidae) with Descriptions, Observations and Biological Notes. Hawaii Board Agric. For. Div. Entomol. Bull. 1914, 3, 1–146. [Google Scholar]
- Powell, C.; Caleca, V.; Sinno, M.; van Staden, M.; van Noort, S.; Rhode, C.; Allsopp, E.; van Asch, B. Barcoding of parasitoid wasps (Braconidae and Chalcidoidea) associated with wild and cultivated olives in the Western Cape of South Africa. Genome 2019. [Google Scholar] [CrossRef]
- Rugman-Jones, P.F.; Wharton, R.; van Noort, T.; Stouthamer, R. Molecular differentiation of the Psyttalia concolor (Szépligeti) species complex (Hymenoptera: Braconidae) associated with olive fly, Bactrocera oleae (Rossi) (Diptera: Tephritidae), in Africa. Biol. Control 2009, 49, 17–26. [Google Scholar] [CrossRef]
- Copeland, R.S. A new species of Munromyia Bezzi (Diptera: Tephritidae) reared from Chionanthus battiscombei (Oleaceae) in Northern Kenya. J. Nat. Hist. 2009. [Google Scholar] [CrossRef]
- Teixeira da Costa, L.; Powell, C.; van Noort, S.; Costa, C.; Sinno, M.; Caleca, V.; Rhode, C.; Kennedy, R.J.; van Staden, M.; van Asch, B. The complete mitochondrial genome of Bactrocera biguttula (Bezzi) (Diptera: Tephritidae) and phylogenetic relationships with other Dacini. Int. J. Biol. Macromol. 2019. [Google Scholar] [CrossRef] [PubMed]
- Mkize, N.; Hoelmer, K.A.; Villet, M.H. A survey of fruit-feeding insects and their parasitoids occurring on wild olives, Olea europaea ssp. cuspidata, in the Eastern Cape of South Africa. Biocontrol Sci. Technol. 2008, 18, 991–1004. [Google Scholar] [CrossRef]
- Copeland, R.; White, I.; Okumu, M.; Machera, P.; Wharton, R. Insects Associated with Fruits of the Oleaceae (Asteridae, Lamiales) in Kenya, with Special Reference to the Tephritidae (Diptera). Bish. Museum Bull. Entomol. 2004, 12, 135–164. [Google Scholar]
- Wharton, R.; Gilstrap, F. Key to and Status of Opiine Braconid (Hymenoptera) Parasitoids Used in Biological Control of Ceratitis and Dacus s. l. (Diptera: Tephritidae). Ann. Entomol. Soc. Am. 1983, 76, 721–742. [Google Scholar] [CrossRef]
- Silvestri, F. La lotta biologica contro le mosche dei frutti della famiglia Trypetidae. In Proceedings of the VII International Congress of Entomology, Berlin, Germany, 17–23 August 1939; pp. 2396–2418. [Google Scholar]
- Caleca, V.; Giacalone, C.; Maltese, M.; Tortorici, F. Contenimento naturale di Bactrocera oleae (Rossi): Clima o parassitoidi? Confronto tra Western Cape (Sud Africa) e Sicilia. Atti Acc. Naz. Ital. Entomol. 2017, 64, 99–105. [Google Scholar]
- Raspi, A.; Loni, A.; Canovai, R. Entomophages of olive pests in corsica, coastal tuscany and islands of Tuscan Archipelago. Frustula Entomol. 2007, 30, 187–194. [Google Scholar]
- Debouzie, D.; Mazih, A. Argan (Sapotaceae) trees as reservoirs for Mediterranean fruit fly (Diptera: Tephritidae) in Morocco. Environ. Entomol. 1999. [Google Scholar] [CrossRef]
- Monastero, S.; Delanoue, P. Lute biologique expérimentale contre la Mouche de l’olive (Dacus OleaeGmel.) au moyen D’Opius concolorSzepl.SiculusMon. dans les iles éoliennes (sicile) en 1965. Entomophaga 1966. [Google Scholar] [CrossRef]
- Liaropoulus, C.; Mavraganis, V.G.; Broumas, T.; Ragoussis, N. Field tests on the combination of mass trapping with the release parasite Opius concolor (Hymenoptera: Braconidae), for the control of the olive fruit fly Bactrocera oleae (Diptera: Tephritidae). IOBC/WPRS Bull. 2005, 28, 77–81. [Google Scholar]
- Daane, K.M.; Sime, K.R.; Wang, X.; Nadel, H.; Johnson, M.W.; Walton, V.M.; Kirk, A.; Pickett, C.H. Psyttalia lounsburyi (Hymenoptera: Braconidae), potential biological control agent for the olive fruit fly in California. Biol. Control 2008, 44, 79–89. [Google Scholar] [CrossRef]
- Daane, K.M.; Johnson, M.W.; Pickett, C.H.; Sime, K.R.; Wang, X.G.; Nadel, H.; Andrews, J.W.; Hoelmer, K.A. Biological controls investigated to aid management of olive fruit fly in California. Calif. Agric. 2011, 65, 21–28. [Google Scholar] [CrossRef]
- Cameron, S.L. Insect mitochondrial genomics: Implications for evolution and phylogeny. Annu. Rev. Entomol. 2014, 59, 95–117. [Google Scholar] [CrossRef] [PubMed]
- Wei, S.-j.; Shi, M.; Sharkey, M.J.; van Achterberg, C.; Chen, X.-x. Comparative mitogenomics of Braconidae (Insecta: Hymenoptera) and the phylogenetic utility of mitochondrial genomes with special reference to Holometabolous insects. BMC Genom. 2010, 11, 371. [Google Scholar] [CrossRef]
- Li, Q.; Wei, S.J.; Tang, P.; Wu, Q.; Shi, M.; Sharkey, M.J.; Chen, X.X. Multiple lines of evidence Frommitochondrial genomes resolve phylogenetic relationships of parasitic wasps in braconidae. Genome Biol. Evol. 2016, 8, 2651–2662. [Google Scholar] [CrossRef]
- Wei, S.J.; Shi, M.; Chen, X.X.; Sharkey, M.J.; van Achterberg, C.; Ye, G.Y.; He, J.H. New views on strand asymmetry in insect mitochondrial genomes. PLoS ONE 2010, 5, e12708. [Google Scholar] [CrossRef]
- Dowton, M.; Cameron, S.L.; Dowavic, J.I.; Austin, A.D.; Whiting, M.F. Characterization of 67 mitochondrial tRNA gene rearrangements in the hymenoptera suggests that mitochondrial tRNA gene position is selectively neutral. Mol. Biol. Evol. 2009. [Google Scholar] [CrossRef]
- Xiao, J.H.; Jia, J.G.; Murphy, R.W.; Huang, D.W. Rapid evolution of the mitochondrial genome in chalcidoid wasps (hymenoptera: Chalcidoidea) driven by parasitic lifestyles. PLoS ONE 2011, 6, e26645. [Google Scholar] [CrossRef]
- Silvestri, F. Viaggio in Eritrea per Cercare Parassiti della Mosca delle Olive. Boll. Lab. Zool. Gen. Agrar. 1913, 9, 186–226. [Google Scholar]
- Kimura, M. A simple method for estimating evolutionary rates of base substitutions through comparative studies of nucleotide sequences. J. Mol. Evol. 1980, 16, 111–120. [Google Scholar] [CrossRef]
- Kumar, S.; Stecher, G.; Li, M.; Knyaz, C.; Tamura, K. MEGA X: Molecular evolutionary genetics analysis across computing platforms. Mol. Biol. Evol. 2018, 35, 1547–1549. [Google Scholar] [CrossRef] [PubMed]
- Folmer, O.; BLACK, M.; HOEH, W.; Lutz, R.; Vrijenhoek, R. DNA primers for amplification of mitochondrial cytochrome c oxidase subunit I from diverse metazoan invertebrates. Mol. Mar. Biol. Biotechnol. 1994, 3, 294–299. [Google Scholar] [CrossRef] [PubMed]
- Smith, D.R. The past, present and future of mitochondrial genomics: Have we sequenced enough mtDNAs? Brief. Funct. Genom. 2016, 15, 47–54. [Google Scholar] [CrossRef] [PubMed]
- Laslett, D.; Canbäck, B. ARWEN: A program to detect tRNA genes in metazoan mitochondrial nucleotide sequences. Bioinformatics 2008, 24, 172–175. [Google Scholar] [CrossRef] [PubMed]
- Abascal, F.; Zardoya, R.; Telford, M.J. TranslatorX: Multiple alignment of nucleotide sequences guided by amino acid translations. Nucleic Acids Res. 2010, 38. [Google Scholar] [CrossRef] [PubMed]
- Kumar, S.; Stecher, G.; Tamura, K. MEGA7: Molecular Evolutionary Genetics Analysis Version 7.0 for Bigger Datasets. Mol. Biol. Evol. 2016, 33, 1870–1874. [Google Scholar] [CrossRef]
- Lanfear, R.; Frandsen, P.B.; Wright, A.M.; Senfeld, T.; Calcott, B. Partitionfinder 2: New methods for selecting partitioned models of evolution for molecular and morphological phylogenetic analyses. Mol. Biol. Evol. 2017, 34, 772–773. [Google Scholar] [CrossRef]
- Miller, M.A.; Pfeiffer, W.; Schwartz, T. Creating the CIPRES Science Gateway for inference of large phylogenetic trees. In Proceedings of the 2010 Gateway Computing Environments Workshop (GCE), New Orleans, LA, USA, 14 November 2010; pp. 1–8. [Google Scholar]
- Drummond, A.J.; Rambaut, A. BEAST: Bayesian evolutionary analysis by sampling trees. BMC Evol. Biol. 2007, 7. [Google Scholar] [CrossRef]
- Branstetter, M.G.; Danforth, B.N.; Pitts, J.P.; Faircloth, B.C.; Ward, P.S.; Buffington, M.L.; Gates, M.W.; Kula, R.R.; Brady, S.G. Phylogenomic Insights into the Evolution of Stinging Wasps and the Origins of Ants and Bees. Curr. Biol. 2017. [Google Scholar] [CrossRef]
- Nardi, F.; Carapelli, A.; Boore, J.L.; Roderick, G.K.; Dallai, R.; Frati, F. Domestication of olive fly through a multi-regional host shift to cultivated olives: Comparative dating using complete mitochondrial genomes. Mol. Phylogenet. Evol. 2010, 57, 678–686. [Google Scholar] [CrossRef]
- Darriba, D.; Taboada, G.L.; Doallo, R.; Posada, D. jModelTest 2: More models, new heuristics and parallel computing. Nat. Methods 2012, 9, 772. [Google Scholar] [CrossRef] [PubMed]
- Coates, B.S. Assembly and annotation of full mitochondrial genomes for the corn rootworm species, Diabrotica virgifera virgifera and Diabrotica barberi (Insecta: Coleoptera: Chrysomelidae), using Next Generation Sequence data. Gene 2014, 542, 190–197. [Google Scholar] [CrossRef] [PubMed]
- Castro, L.R.; Ruberu, K.; Dowton, M. Mitochondrial genomes of Vanhornia eucnemidarum (Apocrita: Vanhorniidae) and Primeuchroeus spp. (Aculeata: Chrysididae): Evidence of rearranged mitochondrial genomes within the Apocrita (Insecta: Hymenoptera). Genome 2006, 49, 752–766. [Google Scholar] [CrossRef] [PubMed]
- Castro, L.R.; Dowton, M. The position of the Hymenoptera within the Holometabola as inferred from the mitochondrial genome of Perga condei (Hymenoptera: Symphyta: Pergidae). Mol. Phylogenet. Evol. 2005, 34, 469–479. [Google Scholar] [CrossRef] [PubMed]
- Cameron, S.L.; Dowton, M.; Castro, L.R.; Ruberu, K.; Whiting, M.F.; Austin, A.D.; Diement, K.; Stevens, J. Mitochondrial genome organization and phylogeny of two vespid wasps. Genome 2008, 51, 800–808. [Google Scholar] [CrossRef]
- Hassanin, A.; Léger, N.; Deutsch, J. Evidence for multiple reversals of asymmetric mutational constraints during the evolution of the mitochondrial genome of metazoa, and consequences for phylogenetic inferences. Syst. Biol. 2005, 54, 277–298. [Google Scholar] [CrossRef]
- Kilpert, F.; Podsiadlowski, L. The complete mitochondrial genome of the common sea slater, Ligia oceanica (Crustacea, Isopoda) bears a novel gene order and unusual control region features. BMC Genom. 2006, 7, 241. [Google Scholar] [CrossRef]
- Masta, S.E.; Longhorn, S.J.; Boore, J.L. Arachnid relationships based on mitochondrial genomes: Asymmetric nucleotide and amino acid bias affects phylogenetic analyses. Mol. Phylogenet. Evol. 2009, 50, 117–128. [Google Scholar] [CrossRef]
- Hassanin, A. Phylogeny of Arthropoda inferred from mitochondrial sequences: Strategies for limiting the misleading effects of multiple changes in pattern and rates of substitution. Mol. Phylogenet. Evol. 2006, 38, 100–116. [Google Scholar] [CrossRef]
- Jühling, F.; Pütz, J.; Bernt, M.; Donath, A.; Middendorf, M.; Florentz, C.; Stadler, P.F. Improved systematic tRNA gene annotation allows new insights into the evolution of mitochondrial tRNA structures and into the mechanisms of mitochondrial genome rearrangements. Nucleic Acids Res. 2012, 40, 2833–2845. [Google Scholar] [CrossRef]
- Wei, S.J.; Shi, M.; He, J.H.; Sharkey, M.; Chen, X.X. The complete mitochondrial genome of Diadegma semiclausum (Hymenoptera: Ichneumonidae) indicates extensive independent evolutionary events. Genome 2009, 52, 308–319. [Google Scholar] [CrossRef] [PubMed]
- Boore, J.; Collins, T.; Stanton, D.; Daehler, L.; Brown, W. Deducing the pattern of arthropod phylogeny from mitochondrial DNA rearrangements. Nature 1995, 376, 163. [Google Scholar] [CrossRef] [PubMed]
- Moritz, C.; Dowling, T.E.; Brown, W.M. Evolution of animal mitochondrial DNA: Relevance for population biology and systematics. Annu. Rev. Ecol. Syst. 1987, 18, 269–292. [Google Scholar] [CrossRef]
- Rokas, A.; Holland, P.W.H. Rare genomic changes as a tool for phylogenetics. Trends Ecol. Evol. 2000, 15, 454–459. [Google Scholar] [CrossRef]
- Boore, J.L. Animal mitochondrial genomes. Nucleic Acids Res. 1999, 27, 1767–1780. [Google Scholar] [CrossRef] [PubMed]


| Species | Family | Subfamily | Lineage | GenBank | Reference | Size (bp) | Status |
|---|---|---|---|---|---|---|---|
| Acanthormius sp. | Braconidae | Lysiterminae | Cyclostome | KF385867.1 | Li et al., 2016 | 13,051 | Partial |
| Afrocampsis griseosetosus van Achterberg et Quicke, 1990 | Braconidae | Acampsohelconinae | Non-cyclostome | KJ412474.1 | Li et al., 2016 | 10,104 | Partial |
| Aphidius gifuensis Ashmead, 1906 | Braconidae | Aphidiinae | Cyclostome | GU097658.2 | Wei et al., 2010 | 11,970 | Partial |
| Capitonius sp. | Braconidae | Cenocoeliinae | Non-cyclostome | KF385869.1 | Li et al., 2016 | 13,077 | Partial |
| Cardiochiles fuscipennis Szépligeti, 1900 | Braconidae | Cardiochilinae | Non-cyclostome | KF385870.1 | Li et al., 2016 | 14,390 | Partial |
| Cotesia vestalis (Haliday, 1834) | Braconidae | Microgastinae | Non-cyclostome | NC_014272.1 | Wei et al., 2010 | 15,543 | Complete |
| Diachasmimorpha longicaudata (Ashmead, 1905) | Braconidae | Opiinae | Cyclostome | GU097655.1 | Wei et al., 2010 | 13,850 | Partial |
| Diadegma semiclausum (Hellén, 1949) | Ichneumonidae | Campopleginae | - | NC_012708.1 | Wei et al., 2009 | 18,728 | Complete |
| Elasmosoma sp. | Braconidae | Euphorinae | Non-cyclostome | KJ412470.1 | Li et al., 2016 | 12,326 | Partial |
| Enicospilus sp. | Ichneumonidae | Ophioninae | - | FJ478177.1 | Dowton et al., 2009 | 15,300 | Partial |
| Eumacrocentrus sp. | Braconidae | Helconinae | Non-cyclostome | KF385872.1 | Li et al., 2016 | 14,080 | Partial |
| Euurobracon breviterebrae Watanabe, 1934 | Braconidae | Braconinae | Cyclostome | KF385871.1 | Li et al., 2016 | 12,957 | Partial |
| Histeromerus sp. | Braconidae | Histerominae | Cyclostome | KF418765.1 | Li et al., 2016 | 13,168 | Partial |
| Homolobus sp. | Braconidae | Homolobinae | Non-cyclostome | KF385873.1 | Li et al., 2016 | 13,927 | Partial |
| Ichneutes sp. | Braconidae | Ichneutinae | Non-cyclostome | KF385874.1 | Li et al., 2016 | 13,092 | Partial |
| Macrocentrus camphoraphilus He et Chen, 2008 | Braconidae | Macrocentrinae | Non-cyclostome | GU097656.1 | Wei et al., 2010 | 15,801 | Partial |
| Meteorus pulchricornis (Wesmael, 1835) | Braconidae | Euphorinae | Non-cyclostome | GU097657.1 | Wei et al., 2010 | 10,186 | Partial |
| Mirax sp. | Braconidae | Miracinae | Non-cyclostome | KJ412471.1 | Li et al., 2016 | 13,664 | Partial |
| Pambolus sp. | Braconidae | Pambolinae | Cyclostome | KF385875.1 | Li et al., 2016 | 13,175 | Partial |
| Paroligoneurus sp. | Braconidae | Ichneutinae | Non-cyclostome | KJ412472.1 | Li et al., 2016 | 13,413 | Partial |
| Phaenocarpa sp. | Braconidae | Alysiinae | Cyclostome | KJ412475.1 | Li et al., 2016 | 9981 | Partial |
| Phanerotoma flava Ashmead, 1906 | Braconidae | Cheloninae | Non-cyclostome | GU097654.1 | Wei et al., 2010 | 10,171 | Partial |
| Proterops sp. | Braconidae | Ichneutinae | Non-cyclostome | KJ412477.1 | Li et al., 2016 | 12,883 | Partial |
| Pselaphanus sp. | Braconidae | Pselaphaninae | Non-cyclostome | KF385876.1 | Li et al., 2016 | 13,204 | Partial |
| Pseudognaptodon sp. | Braconidae | Gnamptodontinae | Cyclostome | KJ412473.1 | Li et al., 2016 | 13,190 | Partial |
| Psyttalia concolor (Szépligeti, 1910) | Braconidae | Opiinae | Cyclostome | MW279212 | This study | 15,308 | Partial |
| Psyttalia humilis (Silvestri, 1913) | Braconidae | Opiinae | Cyclostome | MW279213 | This study | 15,311 | Partial |
| Psyttalia lounsburyi (Silvestri, 1913) | Braconidae | Opiinae | Cyclostome | MW279214 | This study | 14,982 | Partial |
| Sigalphus bicolor (Cresson, 1880) | Braconidae | Sigalphinae | Non-cyclostome | KF385878.1 | Li et al., 2016 | 12,744 | Partial |
| Spathius agrili Yang, 2005 | Braconidae | Doryctinae | Cyclostome | NC_014278.1 | Wei et al., 2010 | 15,425 | Complete |
| Therophilus festivus Muesebeck, 1953 | Braconidae | Agathidinae | Non-cyclostome | KF385868.1 | Li et al., 2016 | 14,216 | Partial |
| Triraphis sp. | Braconidae | Rogadinae | Cyclostome | KF385877.1 | Li et al., 2016 | 13,162 | Partial |
| Xiphozele sp. | Braconidae | Xiphozelinae | Non-cyclostome | KJ412476.1 | Li et al., 2016 | 9160 | Partial |
| Psyttalia concolor | Psyttalia humilis | Psyttalia lounsburyi | |||||||||||||||||
|---|---|---|---|---|---|---|---|---|---|---|---|---|---|---|---|---|---|---|---|
| Gene/Region | Strand | Coordinates | Size | AC | Start | Stop | IGN | Coordinates | Size | AC | Start | Stop | IGN | Coordinates | Size | AC | Start | Stop | IGN |
| tRNAGln | N | 1–74 | 74 | TTG | - | - | 0 | n.a. | n.a | n.a | - | - | n.a. | n.a. | n.a | n.a | - | - | n.a |
| ND2 | J | 78–1098 | 1021 | - | ATA | T-- | 3 | 77–1097 | 1021 | - | ATA | T-- | n.a. | 19–1039 | 1021 | - | ATA | T-- | n.a. |
| tRNATrp | J | 1099–1166 | 68 | TCA | - | - | 0 | 1097–1165 | 69 | TCA | - | - | −1 | 1039–1107 | 69 | TCA | - | - | −1 |
| tRNATyr | N | 1163–1228 | 66 | GTA | - | - | −4 | 1162–1227 | 66 | GTA | - | - | −4 | 1105–1168 | 64 | GTA | - | - | −3 |
| tRNACys | N | 1228–1291 | 64 | GCA | - | - | −1 | 1227–1290 | 64 | GCA | - | - | −1 | 1170–1233 | 64 | GCA | - | - | 1 |
| COX1 | J | 1292–2825 | 1534 | - | ATG | T-- | 0 | 1291–2829 | 1539 | - | ATG | TAA | 0 | 1234–2772 | 1539 | - | ATG | TAA | 0 |
| tRNALeu1 | J | 2826–2893 | 68 | TAA | - | - | 0 | 2824–2891 | 68 | TAA | - | - | −6 | 2767–2835 | 69 | TAA | - | - | −6 |
| COX2 | J | 2902–3558 | 657 | - | ATA | TAA | 8 | 2900–3558 | 657 | - | ATA | TAA | 8 | 2844–3500 | 657 | - | ATA | TAA | 8 |
| tRNAAsp | N | 3722–3791 | 70 | GTC | - | - | 163 | 3726–3795 | 70 | GTA | - | - | 168 | 3663–3736 | 74 | GTC | - | - | 162 |
| tRNAHis | J | 3791–3858 | 68 | GTG | - | - | −1 | 3795–3862 | 68 | GTG | - | - | −1 | 3736–3804 | 69 | CAC | - | - | −1 |
| tRNALys | J | 3858–3928 | 71 | TTT | - | - | −1 | 3862–3932 | 71 | TTT | - | - | −1 | 3804–3874 | 71 | TTT | - | - | −1 |
| ATP8 | J | 3929–4084 | 156 | - | ATA | TAA | 0 | 3933–4088 | 156 | - | ATA | TAA | 0 | 3875–4030 | 156 | - | ATT | TAA | 0 |
| ATP6 | J | 4063–4752 | 690 | - | ATT | TAA | −22 | 4067–4756 | 690 | - | ATT | TAA | −22 | 4009–4698 | 690 | - | ATT | TAA | −22 |
| COX3 | J | 4762–5550 | 789 | - | ATG | TAA | 9 | 4766–5554 | 789 | - | ATG | TAA | 9 | 4702–5490 | 789 | - | ATG | TAA | 3 |
| tRNAGly | J | 5551–5615 | 65 | GGA | - | - | 0 | 5555–5618 | 64 | TCC | - | - | 0 | 5491–5556 | 66 | TCC | - | - | 0 |
| ND3 | J | 5630–6016 | 387 | - | ATT | TAG | 14 | 5633–6019 | 387 | - | ATT | TAG | 14 | 5571–5957 | 387 | - | ATT | TAG | 14 |
| tRNAAla | J | 6015–6076 | 62 | TGC | - | - | −2 | 6017–6079 | 63 | TGC | - | - | −3 | 5955–6017 | 63 | TGC | - | - | −3 |
| tRNAArg | J | 6076–6142 | 67 | TCG | - | - | -1 | 6079–6145 | 67 | ACG | - | - | −1 | 6017–6083 | 67 | ACG | - | - | −1 |
| tRNAAsn | J | 6136–6202 | 67 | GTT | - | - | −7 | 6139–6205 | 67 | AAC | - | - | −7 | 6077–6143 | 67 | GTT | - | - | −7 |
| tRNASer1 | J | 6200–6266 | 67 | AGA | - | - | −3 | 6203–6269 | 67 | AGA | - | - | −3 | 6141–6207 | 67 | AGA | - | - | −3 |
| tRNAGlu | J | 6266–6330 | 65 | TTC | - | - | −1 | 6269–6333 | 65 | TTC | - | - | −1 | 6207–6271 | 65 | GAA | - | - | −1 |
| tRNAPhe | N | 6329–6392 | 64 | GAA | - | - | −2 | 6332–6396 | 65 | GAA | - | - | −2 | 6720–6334 | 65 | GAA | - | - | −2 |
| ND5 | N | 6393–8052 | 1660 | - | ATA | T-- | 0 | 6396–8055 | 1660 | - | ATA | T-- | −1 | 6334–7993 | 1660 | - | ATA | T-- | −1 |
| ND4 | N | 8079–9401 | 1323 | - | ATG | TAA | 26 | 8082–9404 | 1323 | - | ATG | TAA | 26 | 8017–9342 | 1326 | - | ATG | TAA | 23 |
| ND4L | N | 9395–9691 | 297 | - | ATT | TAA | −7 | 9398–9694 | 297 | - | ATT | TAA | 7 | 9336–9632 | 297 | - | ATT | TAA | −7 |
| tRNAPro | N | 9699–9765 | 67 | TGG | - | - | 7 | 9702–9768 | 67 | TGG | - | - | 7 | 9641–9708 | 68 | TGG | - | - | 8 |
| tRNAThr | J | 9766–9829 | 64 | TGT | - | - | 0 | 9769–9832 | 64 | TGT | - | - | 0 | 9709–9772 | 64 | TGT | - | - | 0 |
| ND6 | J | 9841–10,406 | 565 | - | ATG | T-- | 11 | 9844–10408 | 565 | - | ATG | T-- | 11 | 9784–10,350 | 567 | - | ATG | TAA | 11 |
| CYTB | J | 10,407–11,537 | 1131 | - | ATG | TAA | 1 | 10,410–11,540 | 1131 | - | ATG | TAA | 1 | 10,353–11,483 | 1131 | - | ATG | TAA | 2 |
| tRNASer2 | J | 11,536–11,602 | 67 | TGA | - | - | −2 | 11,539–11,605 | 67 | TGA | - | - | −2 | 11,482–11,549 | 68 | TGA | - | - | −2 |
| ND1 | N | 11,601–12,560 | 960 | - | ATT | TAA | −2 | 11,604–12,563 | 960 | - | ATT | TAA | −2 | 11,548–12,507 | 960 | - | ATT | TAA | −2 |
| tRNALeu2 | N | 12,561–12,626 | 66 | TAG | - | - | 0 | 12,568–12,629 | 62 | TAG | - | - | 4 | 12,508–12,574 | 67 | TAG | - | - | 0 |
| 16s RNA | N | 12,627–13,914 | 1288 | - | - | - | 0 | 12,630–13,918 | 1289 | - | - | - | 0 | 12575–13,852 | 1278 | - | - | - | 0 |
| tRNAVal | N | 13,915–13,980 | 66 | GTA | - | - | 0 | 13,919–13,984 | 66 | GTA | - | - | 0 | 13,852–13,916 | 65 | TAC | - | - | −1 |
| 12s RNA | N | 13,981–14,727 | 747 | - | - | - | 0 | 13,985–14,729 | 745 | - | - | - | 0 | 13,918–14,671 | 754 | - | - | - | 1 |
| tRNAIle | N | 14,728–14,791 | 64 | GAT | - | - | 0 | 14,730–14,793 | 64 | GAT | - | - | 0 | 14,672–14,735 | 64 | ATC | - | - | 0 |
| tRNAMet | N | 14,794–14,859 | 66 | CAT | - | - | 2 | 14,797–14,862 | 66 | CAT | - | - | 3 | 14,740–14,806 | 67 | CAT | - | - | 4 |
| AT-rich region | - | 148,69–15,308 | 449 | - | - | - | 0 | n.a. | n.a. | - | - | - | 0 | n.a. | n.a. | - | - | - | - |
| Psyttalia concolor | Psyttalia humilis | Psyttalia lounsburyi | |||||||||||||||||||||||
|---|---|---|---|---|---|---|---|---|---|---|---|---|---|---|---|---|---|---|---|---|---|---|---|---|---|
| Region | Strand | A% | C% | G% | T% | A+T% | G+C% | AT-Skew | GC-Skew | A% | C% | G% | T% | A+T% | G+C% | AT-Skew | GC-Skew | A% | C% | G% | T% | A+T% | G+C% | AT-Skew | GC-Skew |
| COX1 | J | 30.2 | 9.8 | 15.8 | 44.0 | 74.4 | 25.6 | −0.2 | 0.2 | 30.6 | 9.4 | 15.9 | 44.1 | 74.7 | 25.3 | −0.2 | 0.3 | 30.7 | 10.2 | 15.1 | 43.9 | 74.7 | 25.3 | −0.2 | 0.2 |
| COX2 | J | 36.1 | 7.3 | 12.0 | 44.4 | 80.6 | 19.4 | −0.1 | 0.2 | 35.3 | 7.0 | 12.6 | 45.1 | 80.4 | 19.6 | −0.1 | 0.3 | 35.6 | 7.6 | 11.3 | 45.5 | 81.1 | 18.9 | −0.1 | 0.2 |
| ATP8 | J | 39.1 | 5.1 | 5.8 | 50.0 | 89.1 | 10.9 | −0.1 | 0.1 | 37.8 | 4.5 | 5.1 | 52.6 | 90.4 | 9.6 | −0.2 | 0.1 | 36.5 | 5.1 | 4.5 | 53.8 | 90.4 | 9.6 | −0.2 | −0.1 |
| ATP6 | J | 33.5 | 7.8 | 8.3 | 50.4 | 83.9 | 16.1 | −0.2 | 0.0 | 34.1 | 8.0 | 7.8 | 50.1 | 84.2 | 15.8 | −0.2 | 0.0 | 32.2 | 8.6 | 8.7 | 50.6 | 82.8 | 17.2 | −0.2 | 0.0 |
| COX3 | J | 31.3 | 8.6 | 14.7 | 45.4 | 76.7 | 23.3 | −0.2 | 0.3 | 30.7 | 8.7 | 15.6 | 45.0 | 75.7 | 24.3 | −0.2 | 0.3 | 30.4 | 8.6 | 15.7 | 45.2 | 75.7 | 24.3 | −0.2 | 0.3 |
| ND2 | J | 36.2 | 3.2 | 7.6 | 52.9 | 89.1 | 10.9 | −0.2 | 0.4 | 37.0 | 3.4 | 7.5 | 52.0 | 89.0 | 11.0 | −0.2 | 0.4 | 37.1 | 3.4 | 7.4 | 52.0 | 89.1 | 10.9 | −0.2 | 0.4 |
| ND3 | J | 32.7 | 3.9 | 10.1 | 53.2 | 86.0 | 14.0 | −0.2 | 0.4 | 33.1 | 3.9 | 10.1 | 53.0 | 86.0 | 14.0 | −0.2 | 0.4 | 33.1 | 4.8 | 10.6 | 51.6 | 84.7 | 15.3 | −0.2 | 0.4 |
| ND5 | N | 45.4 | 6.2 | 9.5 | 38.9 | 84.3 | 15.7 | 0.1 | 0.2 | 44.8 | 6.5 | 9.7 | 39.1 | 83.9 | 16.1 | 0.1 | 0.2 | 44.7 | 6.3 | 10.0 | 39.0 | 83.7 | 16.3 | 0.1 | 0.2 |
| ND4 | N | 44.8 | 7.0 | 10.1 | 38.1 | 82.9 | 17.1 | 0.1 | 0.2 | 44.9 | 6.9 | 9.8 | 38.4 | 83.3 | 16.7 | 0.1 | 0.2 | 44.4 | 7.3 | 9.9 | 38.4 | 82.8 | 17.2 | 0.1 | 0.2 |
| ND4L | N | 49.5 | 6.4 | 6.1 | 38.0 | 87.5 | 12.5 | 0.1 | 0.0 | 50.2 | 6.4 | 5.7 | 37.7 | 87.9 | 12.1 | 0.1 | −0.1 | 49.2 | 6.7 | 6.4 | 37.7 | 86.9 | 13.1 | 0.1 | 0.0 |
| ND6 | J | 38.7 | 3.7 | 6.4 | 51.2 | 89.9 | 10.1 | −0.1 | 0.3 | 38.3 | 4.2 | 6.9 | 50.6 | 88.9 | 11.1 | −0.1 | 0.2 | 39.0 | 4.2 | 6.9 | 49.9 | 88.9 | 11.1 | −0.1 | 0.2 |
| CytB | J | 33.2 | 8.7 | 11.6 | 46.5 | 79.7 | 20.3 | −0.2 | 0.1 | 33.2 | 8.8 | 12.2 | 45.8 | 79.0 | 21.0 | −0.2 | 0.2 | 33.5 | 9.4 | 11.9 | 45.2 | 78.7 | 21.3 | −0.1 | 0.1 |
| ND1 | N | 45.0 | 9.1 | 9.9 | 36.0 | 81.0 | 19.0 | 0.1 | 0.0 | 44.3 | 9.1 | 10.4 | 36.3 | 80.5 | 19.5 | 0.1 | 0.1 | 44.3 | 9.3 | 10.2 | 36.3 | 80.5 | 19.5 | 0.1 | 0.0 |
| 12s rRNA | N | 39.9 | 4.3 | 5.2 | 50.6 | 90.5 | 9.5 | −0.1 | 0.1 | 39.5 | 4.3 | 5.6 | 50.3 | 90.1 | 9.9 | −0.1 | 0.1 | 39.5 | 4.6 | 4.9 | 50.8 | 90.4 | 9.6 | −0.1 | 0.0 |
| 16s rRNA | N | 41.4 | 5.4 | 6.2 | 47.0 | 88.4 | 11.6 | −0.1 | 0.1 | 41.2 | 5.4 | 6.1 | 47.2 | 88.4 | 11.6 | −0.1 | 0.1 | 42.3 | 5.2 | 6.9 | 43.1 | 87.6 | 12.4 | 0.0 | 0.1 |
| All PCGs | N+J | 38.1 | 7.1 | 10.7 | 44.1 | 82.2 | 17.8 | −0.1 | 0.2 | 38.0 | 7.1 | 10.8 | 44.0 | 82.0 | 18.0 | −0.1 | 0.2 | 37.9 | 7.5 | 10.8 | 43.9 | 81.8 | 18.2 | −0.1 | 0.2 |
| All tRNAs | 42.9 | 5.9 | 7.2 | 44.0 | 87.0 | 13.0 | 0.0 | 0.1 | 42.6 | 5.8 | 7.1 | 43.6 | 87.2 | 12.8 | 0.0 | 0.1 | 42.8 | 5.4 | 7.9 | 43.8 | 86.7 | 13.3 | 0.0 | 0.2 | |
| All rRNAs | 40.8 | 5.0 | 5.8 | 48.3 | 89.1 | 10.9 | −0.1 | 0.1 | 40.6 | 5.0 | 5.9 | 48.4 | 89.0 | 11.0 | −0.1 | 0.1 | 41.3 | 5.0 | 6.2 | 46.0 | 88.7 | 11.3 | −0.1 | 0.1 | |
| Complete mtDNA | 39.4 | 6.5 | 9.5 | 44.6 | 84.0 | 16.0 | −0.1 | 0.2 | 39.3 | 6.5 | 9.6 | 44.5 | 83.9 | 16.1 | −0.1 | 0.2 | 39.0 | 6.8 | 9.8 | 44.4 | 83.4 | 16.6 | −0.1 | 0.2 | |
| Total Sequence | PCGs | J-Strand PCGs | tRNAs | rRNAs | ||||||
|---|---|---|---|---|---|---|---|---|---|---|
| Species | AT-Skew | GC-Skew | AT-Skew | GC-Skew | AT-Skew | GC-Skew | AT-Skew | GC-Skew | AT-Skew | GC-Skew |
| Acanthormius sp. | −0.11 | 0.19 | −0.11 | 0.20 | −0.23 | 0.25 | −0.02 | 0.13 | −0.14 | 0.04 |
| Afrocampsis griseosetosus | 0.44 | 0.31 | −0.11 | 0.34 | −0.18 | 0.34 | −0.04 | 0.35 | 0.05 | 0.05 |
| Aphidius gifuensis | −0.06 | 0.05 | −0.06 | 0.07 | −0.19 | 0.12 | −0.02 | 0.00 | −0.07 | −0.10 |
| Capitonius sp. | −0.07 | 0.19 | −0.07 | 0.22 | −0.20 | 0.25 | −0.01 | 0.14 | −0.09 | −0.09 |
| Cardiochiles fuscipennis | −0.07 | 0.18 | −0.08 | 0.22 | −0.20 | 0.25 | −0.05 | 0.10 | −0.06 | 0.01 |
| Cotesia vestalis | −0.09 | 0.10 | −0.11 | 0.12 | −0.18 | 0.09 | −0.03 | 0.11 | −0.03 | −0.11 |
| Diachasmimorpha longicaudata | 0.09 | 0.19 | −0.10 | 0.21 | −0.22 | 0.22 | −0.03 | 0.17 | −0.02 | 0.05 |
| Elasmosoma sp. | −0.12 | 0.38 | −0.14 | 0.40 | −0.28 | 0.42 | 0.05 | 0.24 | −0.07 | 0.16 |
| Eumacrocentrus sp. | −0.01 | 0.05 | −0.02 | 0.07 | −0.13 | 0.10 | 0.01 | 0.07 | 0.03 | −0.17 |
| Euurobracon breviterebrae | −0.11 | 0.37 | −0.13 | 0.39 | −0.28 | 0.37 | −0.03 | 0.32 | −0.09 | 0.17 |
| Histeromerus sp. | −0.06 | 0.16 | −0.06 | 0.19 | −0.18 | 0.19 | −0.01 | 0.04 | −0.09 | −0.02 |
| Homolobus sp. | −0.06 | 0.10 | −0.06 | 0.10 | −0.18 | 0.16 | 0.00 | 0.09 | −0.06 | −0.06 |
| Ichneutes sp. | −0.06 | 0.21 | −0.06 | 0.24 | −0.08 | 0.25 | −0.03 | 0.10 | −0.09 | −0.01 |
| Macrocentrus camphoraphilus | −0.05 | 0.10 | −0.06 | 0.13 | −0.17 | 0.17 | −0.01 | 0.02 | −0.04 | −0.11 |
| Meteorus pulchricornis | −0.06 | 0.14 | −0.06 | 0.16 | −0.20 | 0.20 | −0.02 | 0.15 | - | - |
| Mirax sp. | −0.07 | 0.19 | −0.07 | 0.02 | −0.19 | 0.26 | −0.04 | 0.22 | −0.09 | −0.06 |
| Pambolus sp. | −0.09 | 0.16 | −0.10 | 0.17 | −0.22 | 0.20 | −0.05 | 0.09 | −0.08 | 0.00 |
| Paroligoneurus sp. | −0.12 | 0.22 | −0.12 | 0.25 | −0.24 | 0.25 | −0.04 | 0.08 | −0.15 | 0.00 |
| Phaenocarpa sp. | −0.09 | 0.11 | −0.10 | 0.14 | −0.19 | 0.17 | 0.00 | 0.17 | −0.08 | −0.08 |
| Phanerotoma flava | −0.07 | 0.28 | −0.07 | 0.29 | −0.18 | 0.30 | −0.01 | 0.15 | - | - |
| Proterops sp. | 0.06 | −0.15 | 0.07 | −0.14 | −0.04 | −0.10 | 0.03 | 0.00 | 0.06 | −0.15 |
| Pselaphanus sp. | −0.03 | 0.04 | −0.03 | 0.08 | −0.15 | 0.12 | 0.02 | 0.01 | −0.05 | −0.17 |
| Pseudognaptodon sp. | −0.02 | 0.03 | −0.02 | 0.04 | −0.16 | 0.12 | −0.03 | 0.11 | −0.03 | −0.18 |
| Psyttalia concolor | −0.06 | 0.19 | −0.07 | 0.20 | −0.17 | 0.23 | −0.01 | 0.10 | −0.08 | 0.07 |
| Psyttalia humilis | −0.06 | 0.19 | −0.07 | 0.21 | −0.17 | 0.24 | −0.01 | 0.10 | −0.09 | 0.08 |
| Psyttalia lounsburyi | −0.06 | 0.18 | −0.07 | 0.18 | −0.17 | 0.20 | −0.01 | 0.19 | −0.05 | 0.11 |
| Therophilus festivus | −0.03 | 0.02 | −0.02 | 0.05 | −0.15 | 0.09 | 0.01 | 0.01 | −0.06 | −0.13 |
| Triraphis sp. | −0.12 | 0.19 | −0.12 | 0.21 | −0.25 | 0.19 | −0.06 | 0.18 | −0.17 | −0.11 |
| Sigalphus bicolor | −0.03 | 0.00 | −0.02 | 0.02 | −0.15 | 0.08 | −0.02 | 0.07 | −0.04 | −0.18 |
| Spathius agrili | −0.07 | 0.19 | −0.07 | 0.20 | −0.18 | 0.23 | −0.04 | 0.13 | −0.12 | 0.01 |
| Xiphozele sp. | −0.01 | −0.05 | −0.02 | −0.02 | −0.09 | 0.01 | 0.02 | −0.02 | 0.03 | −0.27 |
Publisher’s Note: MDPI stays neutral with regard to jurisdictional claims in published maps and institutional affiliations. |
© 2020 by the authors. Licensee MDPI, Basel, Switzerland. This article is an open access article distributed under the terms and conditions of the Creative Commons Attribution (CC BY) license (http://creativecommons.org/licenses/by/4.0/).
Share and Cite
Powell, C.; Caleca, V.; Rhode, C.; Teixeira da Costa, L.; van Asch, B. New Mitochondrial Gene Rearrangement in Psyttalia concolor, P. humilis and P. lounsburyi (Hymenoptera: Braconidae), Three Parasitoid Species of Economic Interest. Insects 2020, 11, 854. https://doi.org/10.3390/insects11120854
Powell C, Caleca V, Rhode C, Teixeira da Costa L, van Asch B. New Mitochondrial Gene Rearrangement in Psyttalia concolor, P. humilis and P. lounsburyi (Hymenoptera: Braconidae), Three Parasitoid Species of Economic Interest. Insects. 2020; 11(12):854. https://doi.org/10.3390/insects11120854
Chicago/Turabian StylePowell, Chanté, Virgilio Caleca, Clint Rhode, Luis Teixeira da Costa, and Barbara van Asch. 2020. "New Mitochondrial Gene Rearrangement in Psyttalia concolor, P. humilis and P. lounsburyi (Hymenoptera: Braconidae), Three Parasitoid Species of Economic Interest" Insects 11, no. 12: 854. https://doi.org/10.3390/insects11120854
APA StylePowell, C., Caleca, V., Rhode, C., Teixeira da Costa, L., & van Asch, B. (2020). New Mitochondrial Gene Rearrangement in Psyttalia concolor, P. humilis and P. lounsburyi (Hymenoptera: Braconidae), Three Parasitoid Species of Economic Interest. Insects, 11(12), 854. https://doi.org/10.3390/insects11120854