Article

Life on the Edge: Ecological Genetics of a High Arctic Insect Species and Its Circumpolar Counterpart

1
INRA, IGEPP UMR 1349 INRA/Agrocampus Ouest/Université Rennes 1, Domaine de la Motte 35650 Le Rheu and 65, rue de Saint Brieuc, 35000 Rennes, France
2
INRA, UMR EEF INRA/Université de Nancy, 54282 Champenoux, France
*
Author to whom correspondence should be addressed.
Insects 2019, 10(12), 427; https://doi.org/10.3390/insects10120427
Submission received: 24 October 2019 / Revised: 21 November 2019 / Accepted: 22 November 2019 / Published: 26 November 2019

Abstract

:
Arctic ecosystems are subjected to strong environmental constraints that prevent both the colonization and development of many organisms. In Svalbard, few aphid species have established permanent populations. These high arctic aphid species have developed peculiar life-history traits such as shortened life cycles and reduced dispersal capacities. Here, we present data on the distribution and population genetics of Acyrthosiphon svalbardicum in Spitsbergen, the main island of the Svalbard archipelago, and compared its genetic structure with that of its close relative Acyrthosiphon brevicorne, sampled in the top of Scandinavian mainland. We found that A. svalbardicum is common but heterogeneously distributed along the west coast of Spitsbergen. We recorded this species up to 79°12’, which constitutes the northernmost location for any aphid. Genetic structure examined using microsatellite markers showed more pronounced spatial differentiation in A. svalbardicum than in A. brevicorne populations, presumably due to reduced dispersal capacities in the former species. Although populations of A. brevicorne and A. svalbardicum were well-delineated at nuclear loci, they shared similar cytoplasmic DNA haplotypes as revealed by sequence analysis of two DNA barcodes. These results raise questions about whether these two taxa are different species, and the colonization sources and history of the Svalbard archipelago by A. svalbardicum.

1. Introduction

Species are all limited in their geographical distribution. In some cases, geographic ranges are restricted to small areas and are stable over long periods of time, while in others, they include large territories and shift very frequently [1]. Many hypotheses have been proposed for explaining geographic range limits of species and their variation, with special attention to dispersal capacities, species interactions, and physiological constraints. However, such factors usually act in combination to a situation that adds difficulties to understanding why species fail to continue to spread at some points [2]. Furthermore, the population genetics at the edge of a species’ range and its consequences for evolutionary dynamics remain poorly known, although important advances have been made recently on invasive organisms [3]. In this context, the Arctic environment constitutes an interesting place to study range limits of species because of marked ecological conditions and reduced species richness compared with more temperate latitudes [4]. This is the case for the Arctic insect fauna, which is considerably diminished, especially on Arctic islands because of exacerbated dispersal limitation.
Spitsbergen (70° to 80° North) is the main island of the Svalbard archipelago and is about 700 km from the top of the Scandinavian mainland. The climate of this archipelago is characterised by sub-zero temperatures for most of the year, and only a short summer season allows the growth and reproduction of arthropods [5]. The harsh conditions associated with insularity constitute big challenges for the establishment of new species on Svalbard. Unlike gradual adaptations across environmental gradients, successful colonization of arctic islands requires abrupt and rapid physiological and ecological adjustments to cope with the reduced energy budget and novel biotic interactions [4,5]. Consequently, only a few long-distance colonization events may lead to population establishment [6]. The Svalbard archipelago is therefore a good ecosystem in which to study how geographic and environmental barriers in colonization and establishment shape species diversity, spatial distribution and population structure. To date, few studies have been conducted on the population genetics of arctic organisms such as plants and vertebrates, and none of them concern insects.
Among the 230 insect species reported on Svalbard [7], only three aphid species are resident on Spitsbergen: Acyrthosiphon svalbardicum, which feeds exclusively on Dryas octapetala (Rosaceae), Sitobion calvulum, which feeds primarily on Salix polaris (Salicaceae), and a Pemphigus sp., which reportedly feeds on roots of Poa spp. (Poaceae) [5]. Of these three species, A. svalbardicum is the most common and has received the most attention. Compared to aphids in temperate zones, this species has a simplified life cycle and a short activity period [8,9]. Typically, parthenogenetic (clonal) females hatch from overwintering eggs by mid-June and give birth directly to sexual females and males. Eggs are laid following mating during mid-July to the beginning of August and overwinter until the following summer. In some instances, A. svalbardicum can produce an extra generation, although there are uncertainties whether this three-generation life-cycle is achieved in the field [8,9]. Populations of A. svalbardicum are patchily distributed [10] and winged individuals were unknown until the discovery of one alate female in 2001 [11] and several specimens in 2006 in restricted areas of Spitsbergen [12].
Acyrthosiphon svalbardicum has a close related species, A. brevicorne, recorded at the top of Scandinavia, Greenland and arctic Canada [13], and differing by the presence of abdominal pigmentation [13,14,15]. Although this circumpolar aphid species shares the same host plant (D. octopetala) with A. svalbardicum, it displays several important biological differences with the latter [16]. Firstly, the number of generations over its annual life-cycle is controlled by photoperiod (while pre-determined in A. svalbardicum). Secondly, sexual morph production increases gradually across generations, with several generations in a year (as opposed to A. svalbardicum, which typically produces sexual forms only, in the second generation). Thirdly, winged forms are regularly produced and induced by crowding (while occurrence of winged forms is very rare in A. svalbardicum and seemingly not related to aphid density).
The main aim of the present study was to examine how the specific life-style of these two species influences their respective population genetic structure. For that, A. brevicorne populations were sampled in the top of Scandinavia during the summers of 2006, 2010, and 2012, while A. svalbardicum populations were intensively surveyed along the west coast of Spitsbergen during the summers of 2004, 2005, 2006, and 2009. The genetic structure of these various population samples was analysed with microsatellite markers as described here. Considering the biological differences between these two aphid species, we expected higher rates of inbreeding and stronger spatial differentiation in A. svalbardicum populations compared with A. brevicorne. Due to the small morphological differences between the two aphids, we also measured the molecular divergence between A. brevicorne and A. svalbardicum by analysing two DNA barcodes in an attempt to clarify their taxonomic status. From this combined approach, we could refine the geographic distribution of A. svalbardicum on Spitsbergen, highlight the impact of environmental constraints on the population genetics of two polar aphids with contrasting life-styles and distributions, and thereby propose a scenario with regard to the colonization history of the Svalbard archipelago by A. svalbardicum.

2. Materials and Methods

2.1. Aphid Sampling

Individuals of A. svalbardicum were sampled along the west coast of Spitsbergen on mountain avens Dryas octopetala, their only host-plant. Aphids were searched by shaking Dryas plants under a white tray. Surveys were conducted in July 2004, 2005, 2006, and 2009 in the vicinity of two main zones: Longyearbyen (78°13’N, 15°37′ E, mean annual temperature −5.6 °C) in Isfjorden, and Ny Ålesund (78°55’N, 11°56′ E, mean annual temperature −5.2 °C) in Kongsfjorden (Figure 1). Aphids were also searched with no success in the areas of Barentsburg (78°04′ N, 14°13′ E), Prins Karls Forland (78.55′ N 11.017′ E) and Magdalenefjorden 79°34′ N, 10°58′ E). At each site, where aphids occurred, the geographic position was recorded and about 30 individuals were sampled. Some populations were sampled at different years to assess temporal variation in the genetic structure. In total, 29 samples of A. svalbardicum were analysed for genetic structure. At the top of the Scandinavian mainland, we also collected nine populations of the close related species A. brevicorne on D. octopetala as with A. svalbardicum. Two were collected in June 2006 and 2010 at the Abisko Scientific Research Station, Sweden (68°21′ N, 18°49′ E, mean annual temperature 0.2 °C), and seven were collected at various sites in Northern Norway, between Storslett (mean annual temperature 0.1 °C) and Lakselv (mean annual temperature −1.4 °C), in 2012 (Figure 1, Table 1). These samples are referred hereafter to as “Lapland populations”.

2.2. Microsatellite Isolation and Aphid Genotyping

Microsatellite markers were isolated from A. svalbardicum (and subsequently used for examining population structure on both A. brevicorne and A. svalbardicum) using a high-throughput method based on coupling multiplex microsatellite enrichment and next-generation sequencing on 454 GS-FLX Titanium platforms [17]. The open access bioinformatics tool QDD [18] was used to analyse the 454 sequences and design primers for amplification of the detected microsatellite motifs. A set of 48 microsatellite loci was first selected from 521 validated by QDD based on the following criteria: perfect motifs, high number of repeats, dinucleotide motifs, Tm comprised between 59 °C and 61 °C, GC percentage between 45 and 55, length of PCR products. This set was thereafter used on a subsample of the A. svalbardicum population collected to retain at the end 8 loci showing high polymorphism and alleles easy to score (Table 2).
We used the M13-tailed primer method [19] to label amplicons for visualization on the capillary sequencer. Forward primers were 5′-tailed with a 23-basepair M13 sequence. Loci were amplified in a final volume of 10 µL for polymerase chain reaction (PCR) amplification. The reaction mixture contained 2 µL of template DNA, 0.25 µM of each primer, 0.2 mM of a four nucleotide mixture, 1.25 mM of MgCl2, 0.25 µM of 1 µL of PCR Buffer (Promega, Madison, WI, USA) and 0.25 U of Taq DNA Polymerase (Promega, Madison, USA). The M13 primers were5′-fluorescently tagged with HEX, 6-FAM, NED or VIC at 0.25 µM for assessment of allele sizes on a capillary sequencer (describe below). PCR were conducted on S1000 thermal cycler (2008, Bio-Rad Laboratories, Hercules, CA, USA) using the following cycling conditions: initial denaturation at 94 °C for 5 minutes, first cycle of DNA amplification (repeated 20 times) with a denaturation step at 94 °C for 20 seconds, hybridization at 55 °C for 20 s, elongation at 72 °C for 30 s; second cycle of M13 amplification with 20 repetitions of the following steps: 94 °C for 20 s, 53 °C for 20 s and 72 °C for 30 s, and with a final elongation at 72 °C for 5 min.
Diluted PCR products (1.2 μL on 10 μL water) were added to 10 μL of Hi-Di formamide containing 0.7% of 500 LIZ DNA ladder (Applied Biosystems, Foster City, CA, USA) and electrophoresis was performed in the capillary sequencer ABI 3730 (Applied Biosystems, Foster City, CA, USA). Allele sizes were automatically assigned by GeneMapper (version 3.7, Applera Corp., Norwalk, CT, USA) and visually checked.

2.3. Genetic Analysis

Within-population genetic diversity: Genotypic diversity within each population sample was assessed using the G/N ratio (where G corresponds to the number of multilocus genotypes and N to the sample size). Mean number of alleles and both observed and expected heterozygosities were calculated using GENEPOP [20]. FIS values were calculated globally and for each locus within each cluster using the software GENETIX v.4.05.2 [21]. Ninety-five per cent confidence intervals of FIS were obtained by bootstrapping individuals 1000 times. Departures from Hardy-Weinberg equilibrium and linkage disequilibrium (LD) computed using the Markov Chain probability test were also assessed using GENEPOP. These within-population genetic estimates were compared between the two aphid species using Linear Mixed Models (i.e., LMMs) assuming a Gaussian error. As some populations were sampled at the same sites but at different time intervals, the site was considered as a random factor in models in order to include temporal dependence. In each LMM, the significance of the species effect was determined using a likelihood ratio test. Model assumptions were verified by plotting residuals versus fitted values for all models and by checking residuals normality. All statistics were performed by using the package lme4 [22] in the software R [23].
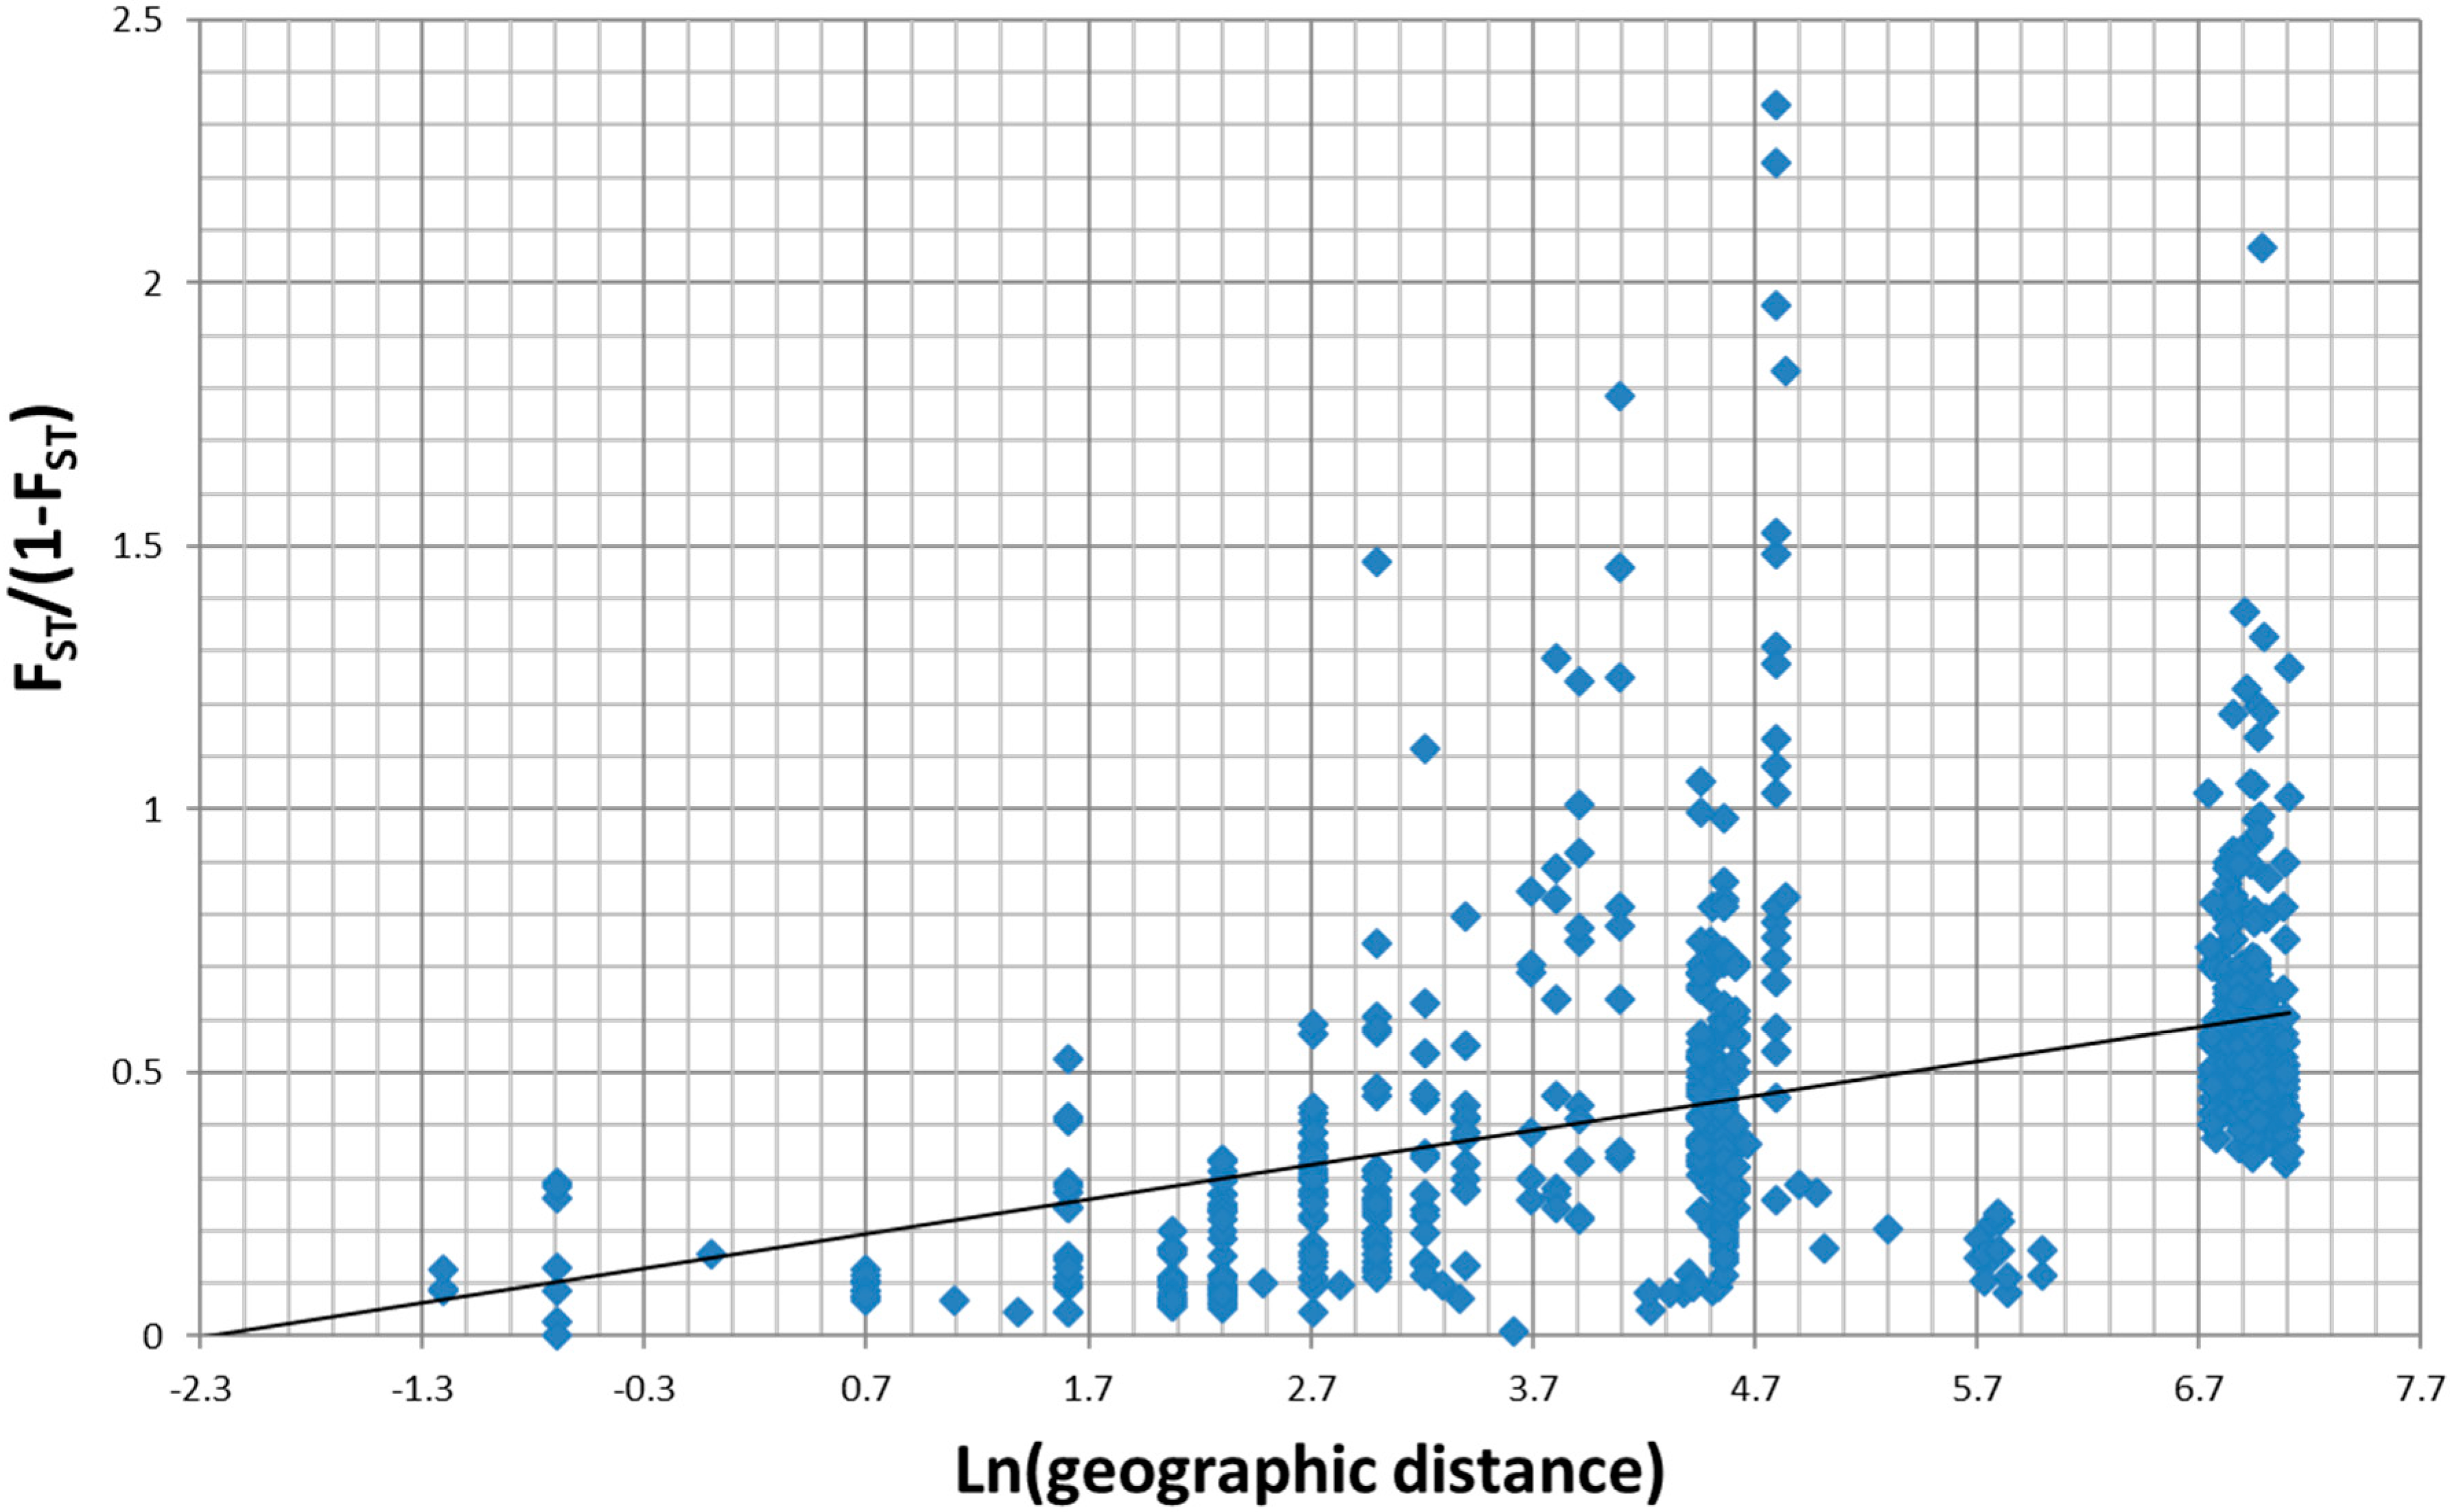
Genetic differentiation between populations: Overall and pairwise FST values were computed with FSTAT 2.9.3.2 [24] and used to quantify differentiation among populations in allele frequencies. Genetic distance between populations was calculated using the Allele Shared Distance [25]. The possibility for an isolation-by-distance pattern was tested by using the Isolde option of GENEPOP, which computes a regression of FST/(1- FST) estimates to geographic distances and performs a Mantel test using a permutation procedure [26].
We also used the Bayesian statistical approach implemented in the program STRUCTURE 2.3.3. [27] to estimate the number of clusters represented by the entire data set, without a priori. Ten iterations were performed using a ‘burning period’ of 50,000 iterations with a 50,000 Markov Chain Monte Carlo (MCMC) step, in admixture models with correlated allele frequencies. The analyses were made for a number of cluster K varying from 2 to 30. The most probable number of clusters was defined using both log probabilities [Pr(X ǀ K)] and ΔK, as described in [28].

2.4. Molecular Divergence between A. brevicorne and A. svalbardicum

Since the taxonomic description of A. brevicorne and A. svalbardicum species has been made on a few samples and the distinction of these two taxa relies mainly on one criterion based on pigmentation [13,14,15], we used a barcoding approach to assess the molecular divergence between several aphid specimens collected from Svalbard (10 individuals from 4 sites), putatively belonging to A. svalbardicum, and from Northern Norway (10 individuals from 4 sites), putatively belonging to A. brevicorne. As recommended by Chen et al. [29], we used the combination of gnd + COI as the aphid barcode, which has been proven to be a good tool for resolving aphid taxonomy ambiguities. We amplified a 900bp fragment of the gnd gene, which encodes the third enzyme of the pentose phosphate pathway, 6-phosphogluconate dehydrogenase (6PGD) and situated on the genome of Buchnera, the aphid primary symbiont. In parallel, we amplified a 660bp fragment of the cytochrome oxidase subunit 1 gene (COI) located on the aphid mitochondrial genome. Primer sequences and PCR amplification conditions were as described in [29]. Both strands for each overlapping fragment were assembled using the sequence-editing software Bioedit 5.0.9 [30]. DNA Sequences were aligned using ClustalW 1.81 default settings [31]. Alignments were translated to amino acids using MEGA version 4 [32] to detect frameshift mutations and premature stop codons, which may indicate the presence of pseudogenes. We calculated sequence divergences using a K2P distance model in MEGA version 4. A phylogenetic tree was built for each gene separately, as well as on concatenated sequences of both loci. Sequences were deposited in Genbank under the accession numbers MN718201-MN718214.

3. Results

3.1. Overall Patterns of Geographic Distribution and Population Differentiation

Populations of A. svalbardicum were common but heterogeneously distributed along the west coast of Spitsbergen. This species was recorded up to 79°12’N in Krossfjorden. No population was found beyond this latitude, which may well represent the northernmost location for any aphid. Surveys resulted in the collection of 920 A. svalbardicum individuals from 29 sites from Spitsbergen and 180 A. brevicorne individuals from 9 sites from Lapland. Genotyping failures were very low (less than 2%), so that 1083 individuals with missing data at no more than one locus were retained for genetic analyses.
By considering both aphid species, overall FST coefficient was 0.280 and only 6 out the 570 (1%) pairwise comparison tests for genetic differentiation were not significant at α = 0.1, indicating a strong genetic structure among populations (see Figure S1). These non-significant pairwise FST values included either some populations separated by less than 100 metres or by different time intervals. Temporal changes in genetic structure were limited compared to spatial variation: considering aphid populations sampled for different time intervals, FST coefficients generally did not exceed 10%. The notable exception was for A. svalbardicum Camp Zoé population where 42% differentiation was found between 2004 and 2009 samples. Genetic differentiation was marked between populations from A. brevicorne and A. svalbardicum (FST = 0.219), with FST values ranging from 0.26 to 0.58, but also for A. svalbardicum Krossfjorden populations vs. other A. svalbardicum populations, with FST values ranging from 0.18 to 0.68. Interestingly, populations of A. svalbardicum from Spitsbergen showed significantly higher genetic differentiation (mean pairwise comparison of FST = 0.256) than populations of A. brevicorne from Lapland (mean pairwise comparison of FST = 0.115) (ANOVA, F = 123.3, df = 2, p < 0.001).
Isolation-by-distance analyses revealed a significant and positive correlation between genetic and geographic distance (one-sided p < 0.0001 from 10,000 randomizations, R² = 0.45) when all samples were considered (Figure 2). Correlation coefficients were even more pronounced when considering separately either all samples of A. brevicorne from Lapland (R² = 0.72), samples of A. svalbardicum from the Isfjorden zone (R² = 0.61) or from the Ny Ålesund zone (R² = 0.63).

3.2. Bayesian Analysis of Population Structure

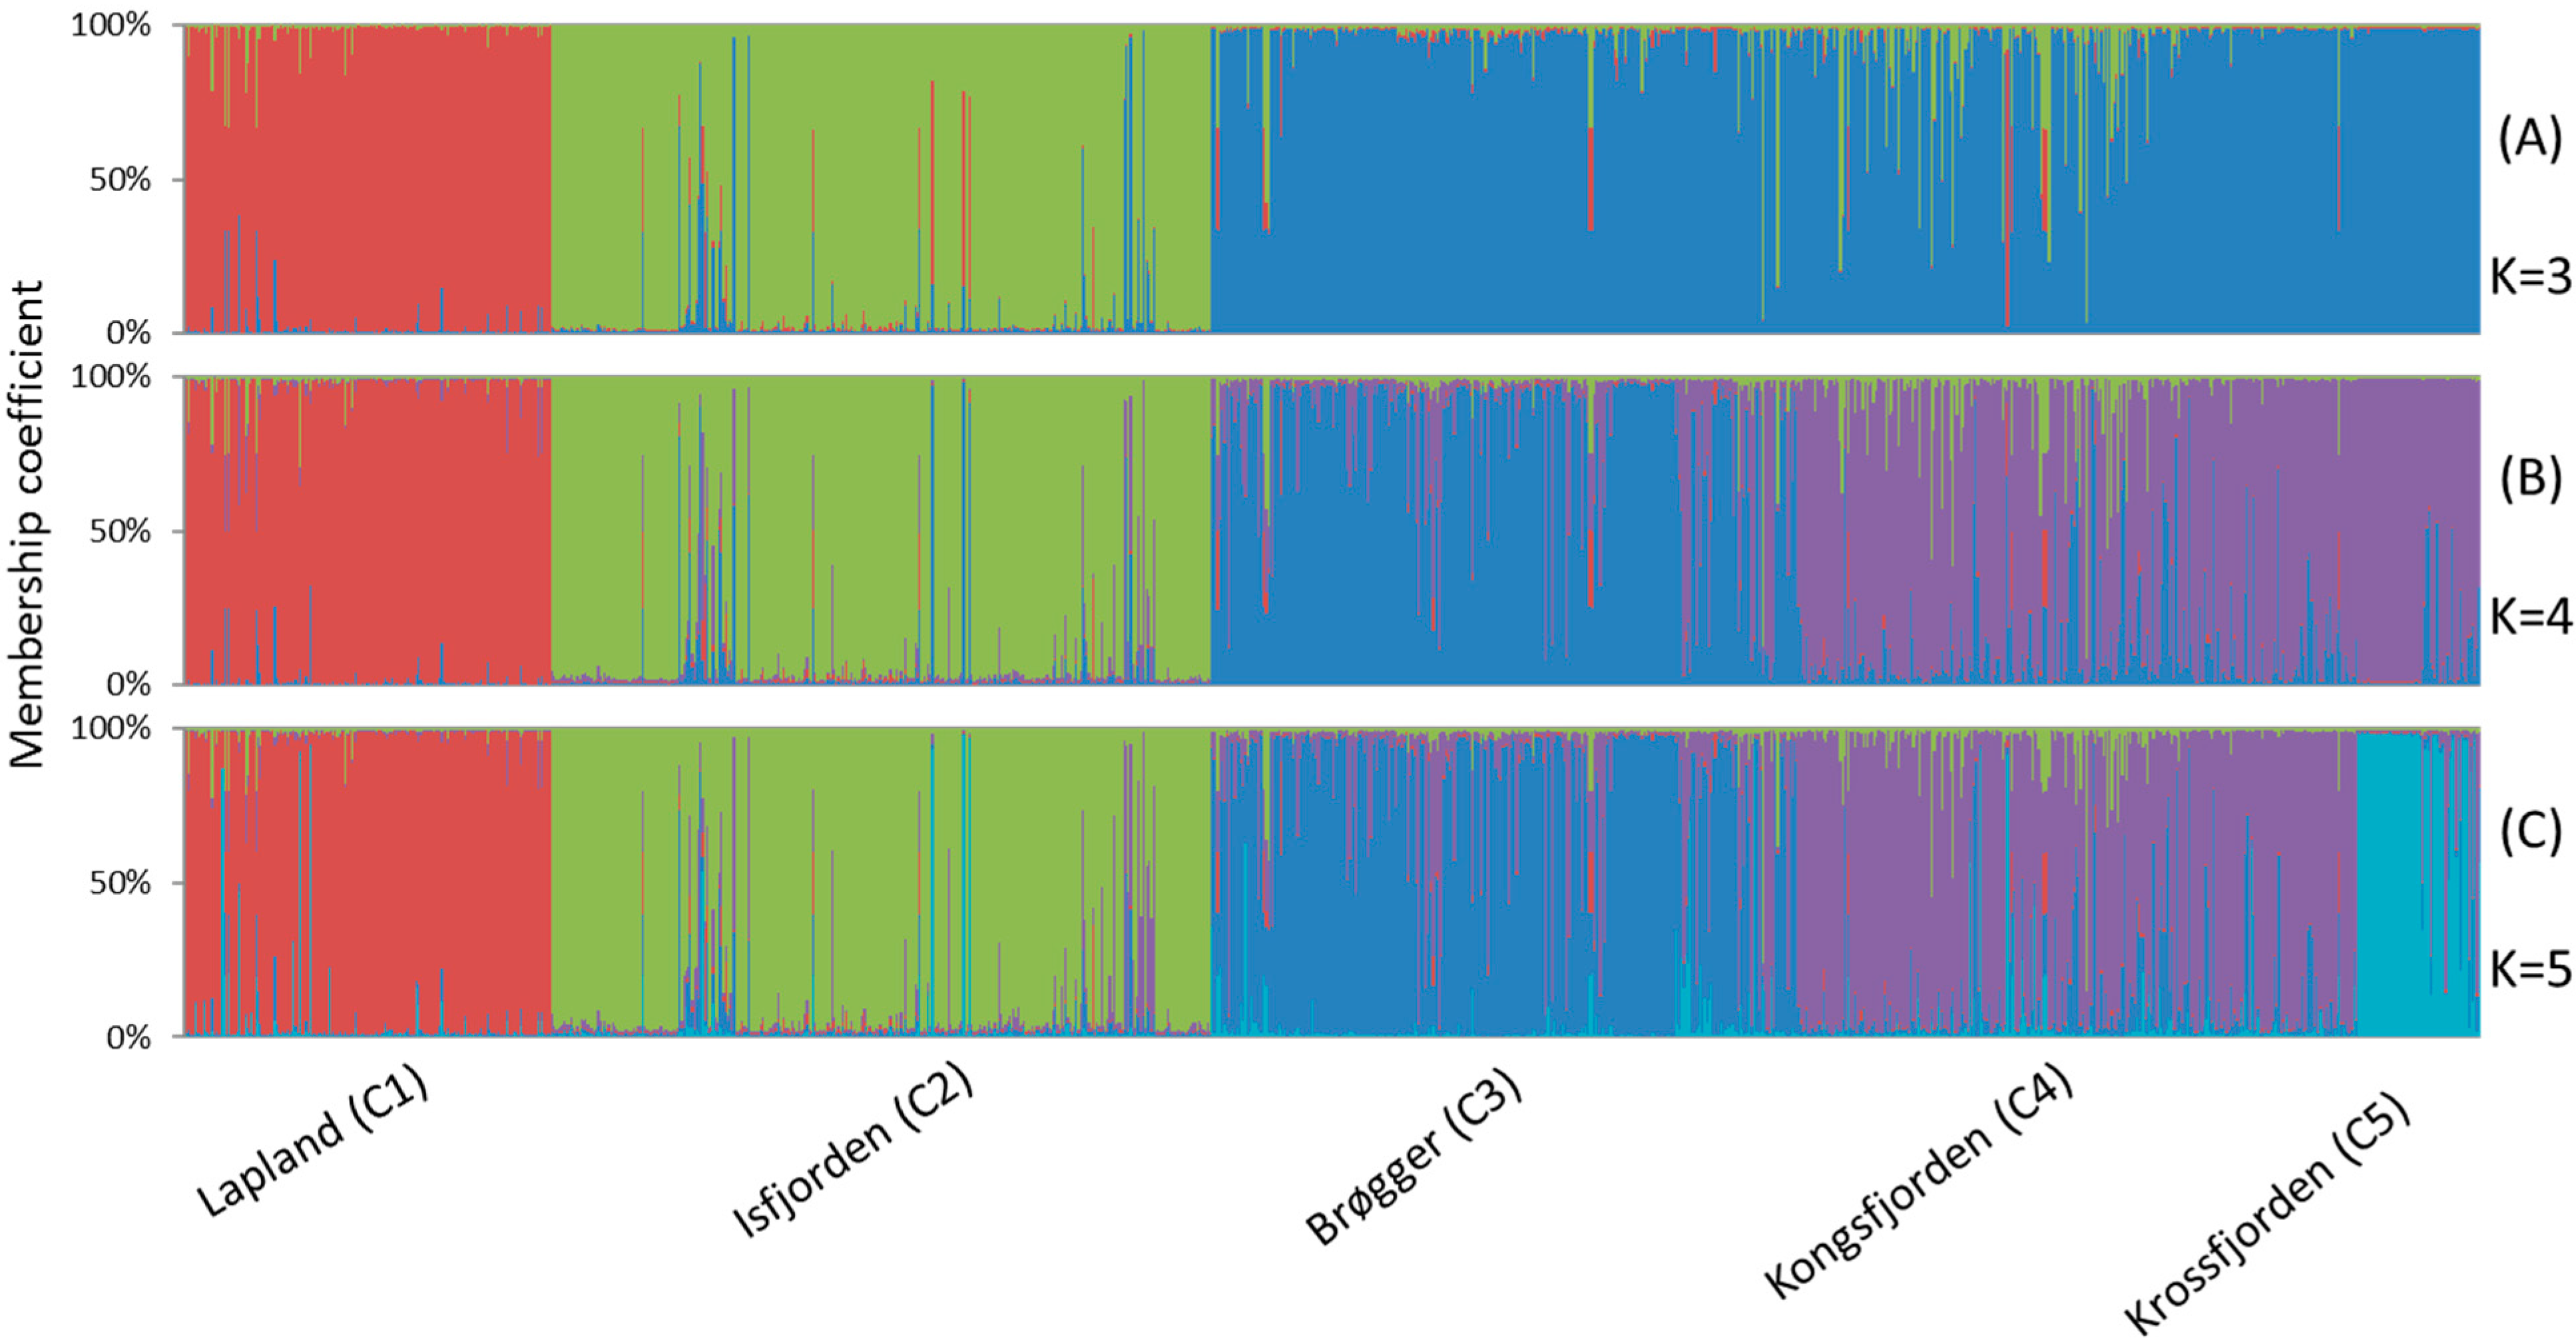
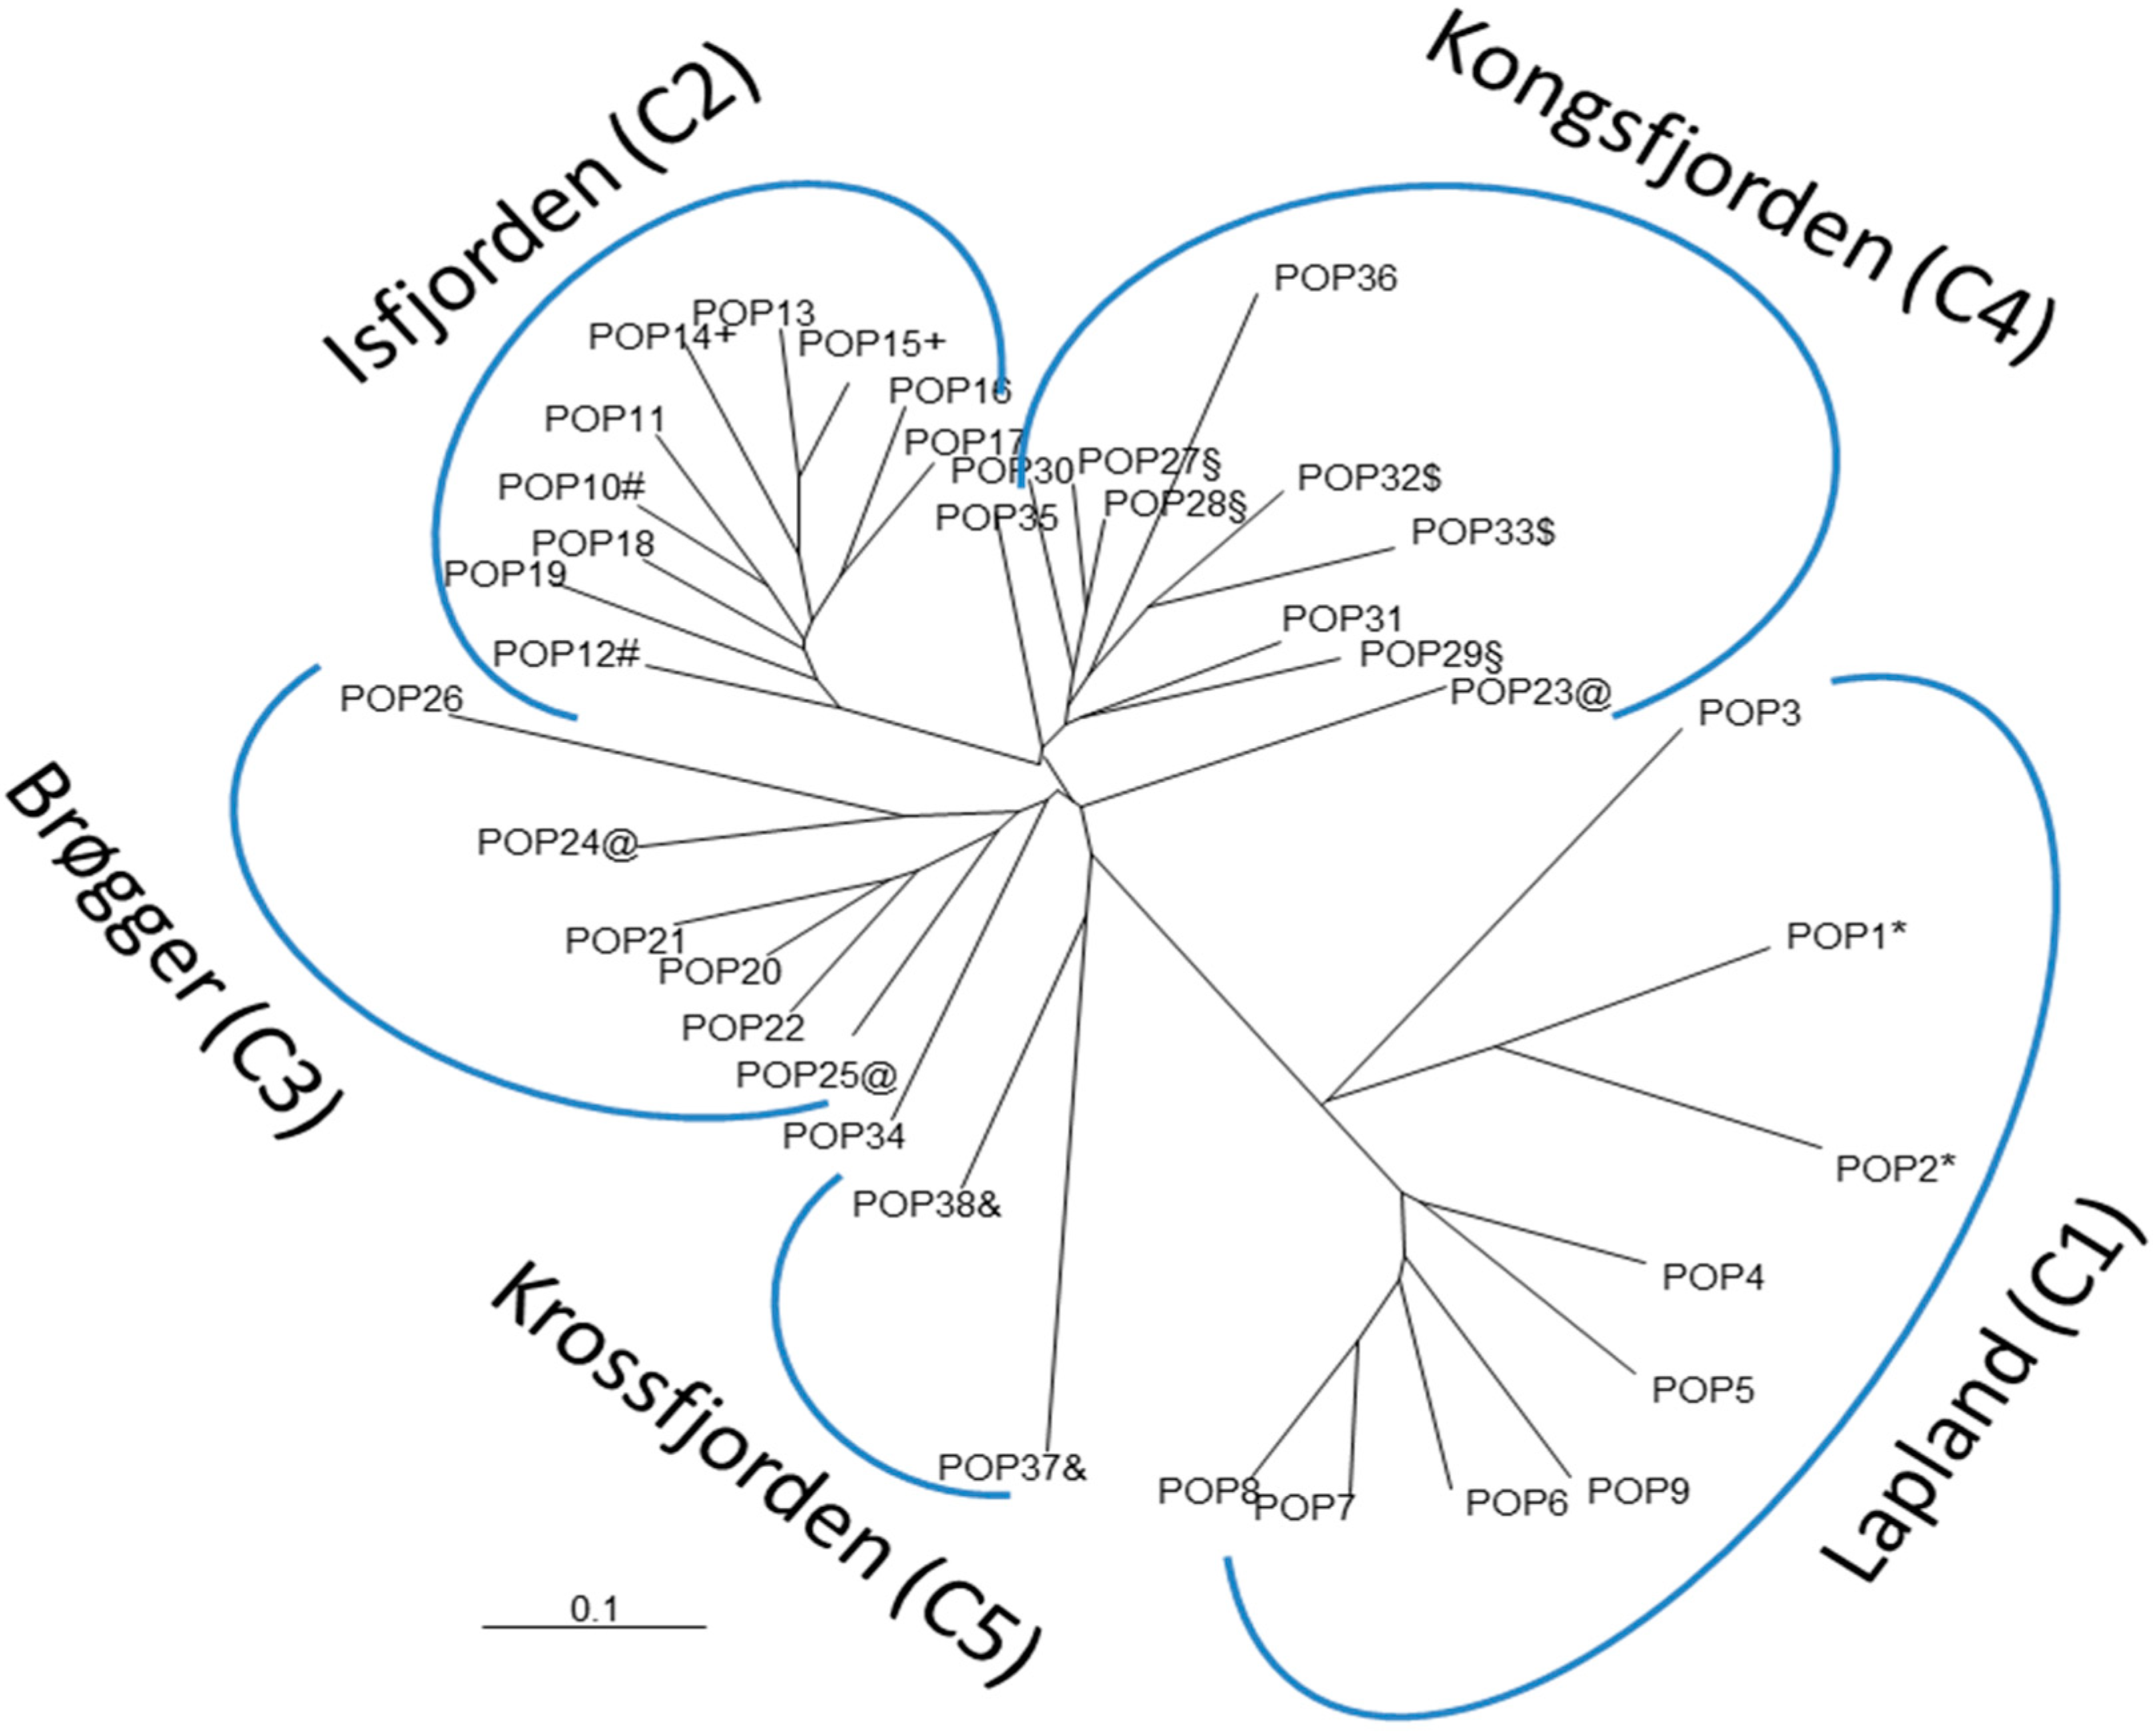
STRUCTURE analyses were performed on all 1083 aphid individuals from the 38 samples (A. svalbardicum and A. brevicorne populations). Both log probabilities [Pr(X ǀ K)] and ΔK calculated on 10 iterations for K = 2 to K = 30 indicated an optimal clustering into three distinct groups which correspond to well-defined geographic zones. At K = 3 (Figure 3A), the first cluster (C1) included all A. brevicorne individuals from Lapland, the second cluster (C2) comprised most A. svalbardicum individuals from the Isfjorden zone, and the third cluster included most A. svalbardicum individuals from the Ny Ålesund zone. At K = 4 (Figure 3B), the two first clusters remained differentiated, while the third cluster was split into two genetic groups, one (C3) formed with A. svalbardicum individuals from the south side of Kongsfjorden (Brøgger peninsula), another (C4) formed with A. svalbardicum individuals from the north side of Kongsfjorden (including islands scattered in the fjord). At K = 5 (Figure 3C), most individuals from the two northernmost sites located in the Krossfjorden area differentiated from cluster C4 and formed a new cluster (C5). Pairwise comparisons of FST values among the five clusters showed that C2 and C5 were the most differentiated, while C3 and C4 were the closest genetically (Table 3). The analysis of genetic distances computed between the 38 aphid samples confirmed this differentiation pattern in five main groups, with A. brevicorne populations from Lapland clearly separated from A. svalbardicum populations from Spitsbergen (Figure 4).

3.3. Within-Population Structure

Populations of A. svalbardicum from Spitsbergen generally showed lower gene diversities compared with A. brevicorne populations from Lapland (Table 4). Mean expected heterozygosity and allele richness differed significantly between both aphid species (Hexp: LMM, F = 6.13, df = 1, p = 0.028; Allelic richness: LMM, F = 12.14, df = 1, p = 0.004): mean expected heterozygosity and allele richness were 0.515 and 3.87, respectively for A. brevicorne populations from Lapland vs. 0.430 and 3.04 for A. svalbardicum populations from Spitsbergen. The combination of the eight microsatellite loci allowed the discrimination of a large number of multilocus genotypes (MLGs). Most populations had G/N ratios near or equal to 1, meaning that each individual bore a unique MLG (Table 3). The A. svalbardicum population from Camp Zoé 2004 (northernmost site sampled in 2004) was the only exception with a G/N of 0.30. This population also had the lowest expected heterozygosity and allele richness (0.164 and 1.75, respectively). Populations showed no heterozygote excess, while about a third of them showed a heterozygote deficit. As expected, populations in heterozygote deficit also had positive FIS values, with the two A. brevicorne populations from Abisko (Sweden) showing the highest values (above 0.3). Again, A. svalbardicum population from Camp Zoé 2004 was special in that it displayed a very high negative FIS value (−0.281). Overall, FIS values did not vary between the two aphid species (LMM, F = 1.67, df = 1, p = 0.217). Linkage disequilibria were frequent among pairs of loci, ranging from 5% to 43% of the tests, and the extent of linkage disequilibrium did not differ according to aphid species (LMM, F = 0.33, df = 1, p = 0.572).

3.4. Within-Population Structure

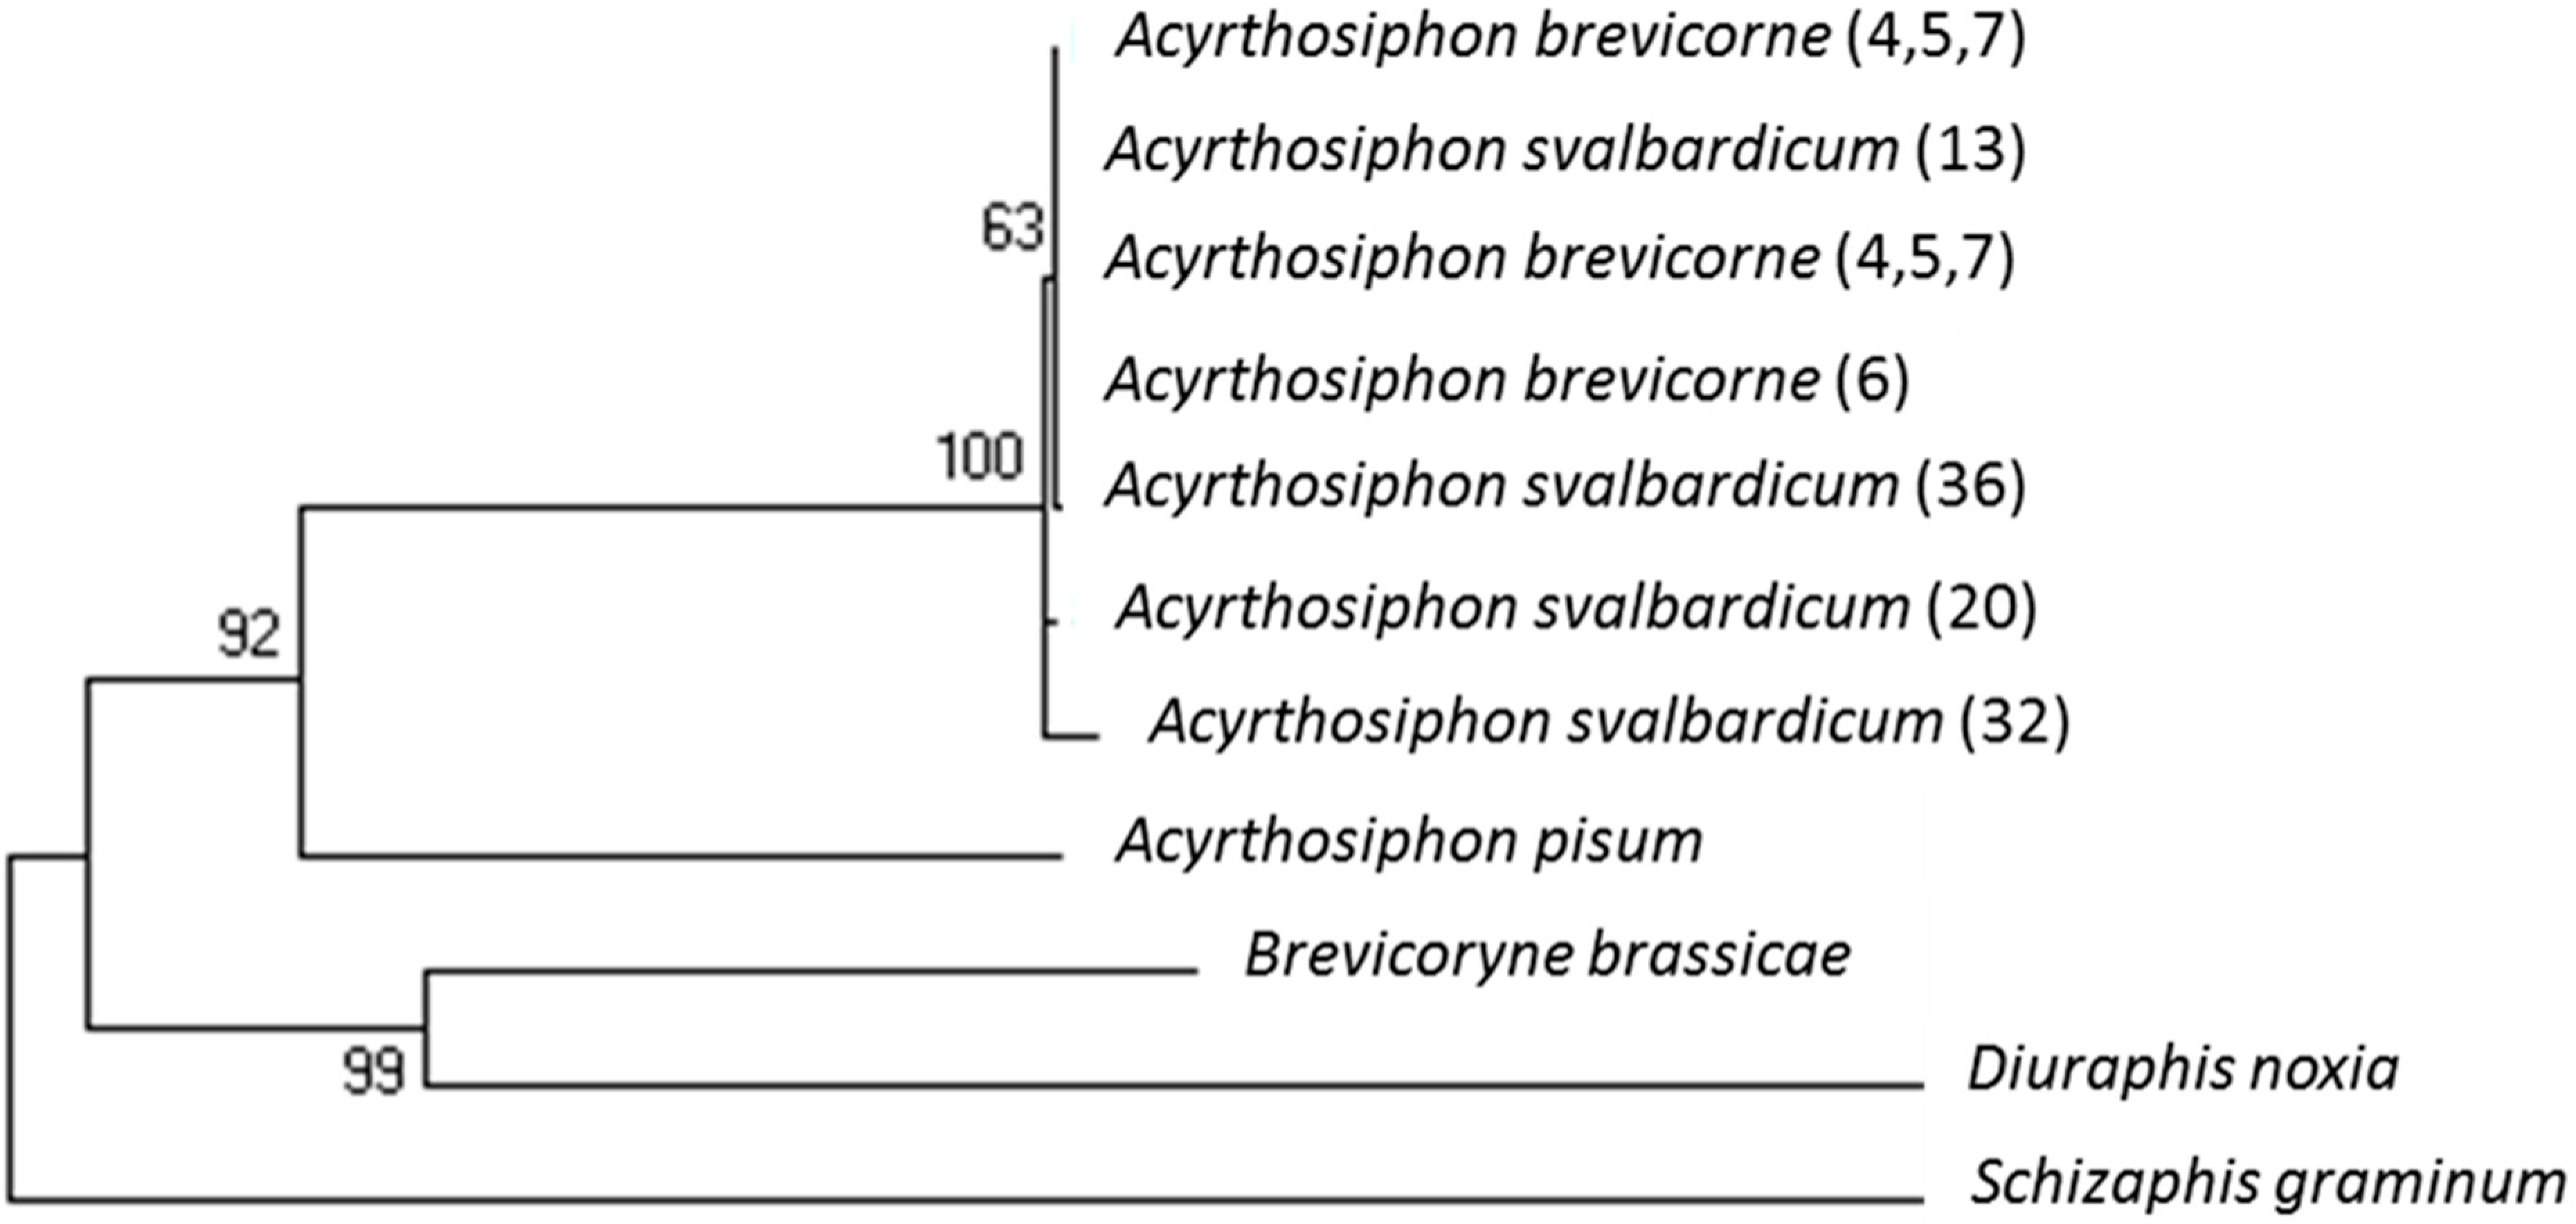
The sequence analysis of COI fragment revealed 11 haplotypes among the samples from A. brevicorne and A. svalbardicum. However, the divergence between these haplotypes was very small and not associated with geographic origin. As a result, samples from A. brevicorne and A. svalbardicum grouped in the same clade, very distinct from the outgroups such as A. pisum. For gnd sequences, all samples from A. brevicorne and A. svalbardicum shared the same haplotype. Again, this haplotype was very divergent from closely related outgroups. Not surprisingly, when sequences from both COI and gdn were concatenated, samples from A. brevicorne and A. svalbardicum grouped into the same clade and were well differentiated from the related species A. pisum, as seen in Figure 5.

4. Discussion

4.1. Distribution and Range Limit of A. svalbardicum in Spitsbergen

From our field surveys in Svalbard, during which time we extensively sampled A. svalbardicum in the summer, we were able to show that this aphid was rather common but heterogeneously distributed along the west coast of Spitsbergen. At a large scale, some zones were free of aphids such as beyond certain latitudes, in isolated places such as some islands or for other reasons we could not test here, e.g., snow cover depth [33]. At a small scale, patches of Dryas unoccupied by aphids usually coexisted with occupied patches without obvious reasons. This heterogeneous distribution of the A. svalbardicum populations confirmed previous studies but does not allow us to substantiate the hypothesis that site occupancy increased with geographical distance from the fjord mouth [10]. From our study, we also showed that A. svalbardicum could not establish populations beyond 79°12′, which constitutes its northernmost limit and the most north location for any aphid. It is likely that beyond this latitude, prevailing climatic conditions prevent aphid populations from persisting and growing due to physiological constraints.

4.2. Divergence between A. svalbardicum and A. brevicorne

The Svalbard archipelago was completely covered by ice during the last glacial maximum, which occurred 15,000 years ago, except for some small mountain areas in the northwest [34]. Although some plants seem to have survived in situ in ice-free areas such as nunataks, uplands and dry coastal shelves [35,36], it has been shown that Dryas octopetala, the exclusive host plant for A. svalbardicum and A. brevicorne, colonised Svalbard from Russian after the last glaciation [37]. We may thus reasonably conclude that A. svalbardicum originated from postglacial dispersal either from North American or European refugia. The genetic analysis as here assessed using microsatellite markers, showed no marked increase in divergence between populations from A. brevicorne and from A. svalbardicum: the populations from Lapland were differentiated from those from Svalbard but differentiation coefficients (FST) were not higher than between some distant Spitsbergen populations. In addition, analysis using two barcodes, which generally differentiate aphid taxa with good confidence [29,38], did not allow the separation of A. brevicorne and A. svalbardicum. Given the fact that the two species share Dryas as their exclusive host plant and differ only slightly in terms of their morphology [13,16], it is probable the two sister species split recently and certainly after the last glacial episode, 10,000–15,000 years ago. The relatively higher allelic richness in Lapland samples could reflect colonization events of Svalbard by A. svalbardicum from mainland Scandinavian populations, although this hypothesis needs further supports.

4.3. Signatures of Inbreeding in Populations of A. brevicorne and A. svalbardicum?

Populations of A. brevicorne and A. svalbardicum generally showed as many multilocus genotypes as sampled individuals (i.e., G/N generally equals 1). This means that the set of markers used had sufficient power to resolve most of the genotypic diversity present locally. In the rare cases where several individuals shared the same multilocus genotype, we may have sampled individuals belonging to the same genetic clone. This is possible for A. brevicorne populations because this species produces several clonal generations during its annual life-cycle [16]. Even for A. svalbardicum, which generally produces only two clonal generations a year, the probability of sampling two individuals from the same clone in the same patch is not zero. However, this could hardly explain the situation of Camp Zoé in 2004, where many individuals with the same MLGs have been found (Table 4). In this case, inbreeding between a few genetically individuals sound like a more likely explanation in such populations, which are at the northern limit of the species range.
Heterozygote deficit and linkage disequilibrium were frequent in populations of both A. brevicorne and A. svalbardicum, with no significant difference between the two species. This is highly suggestive of inbreeding, although other factors such as null alleles, selection and population subdivision might account for those patterns. Inbreeding is expected in small populations with limited dispersal between each other, which is obviously the case for A. svalbardicum (production of winged forms is exceptional in this species) and may also prevail in A. brevicorne (despite the possibility of this species producing winged forms in response to crowding). Whether A. brevicorne and A. svalbardicum populations suffer from inbreeding depression has yet to be investigated.

4.4. Strong Spatial Differences in Population Structure of A. svalbardicum

In comparison with A. brevicorne, A. svalbardicum populations showed much stronger spatial differentiation (more than twice as great), while temporal variation, when assessed, was generally modest in both aphid species. We found that populations of A. svalbardicum were highly differentiated even at distances around 100 metres. This marked spatial genetic structure is not surprising in such a species with limited dispersal capabilities and high extinction probabilities. From our genetic structure analysis, it appears that geographic distances as well as physical barriers such as fjords and glaciers contribute to the observed spatial pattern of genetic variation in A. svalbardicum populations. Isfjorden populations formed a single genetic cluster, suggesting they derived from the same colonization event and still maintain some connectivity. By way of contrast, populations from the Ny Ålesund zone split into three distinct genetic clusters, which seem primarily isolated by physical barriers rather than by geographic distances. Populations from the small islands of Kongsfjorden were genetically related to each other and with other samples from the north part of the fjord. It is therefore, possible that island colonization may have been achieved by the rare winged forms of A. svalbardicum that have been only found so far in the north side of Kongsfjorden [11,12]. Biological evidence to date suggests that the production of winged forms is a sporadic event, which is insufficient to provide effective widespread dispersal under appropriate spatial and temporal scales [11]. The genetic data presented here support this hypothesis. The two populations of A. svalbardicum from Krossfjorden, sampled at the northern limit of the species range, were strongly differentiated from the remaining A. svalbardicum populations, including the geographically closest ones (i.e., north of Kongsfjorden). This differentiation likely results from a founder effect (i.e., colonization of this area by a few migrants) followed by substantial inbreeding, as suggested above from within-population structure analysis.

5. Conclusions

Very few genetic studies have so far been performed on terrestrial animals inhabiting the arctic environment. In the present work, we were able to assess the influence of the high arctic conditions on the population’s genetic structure of A. svalbardicum, in comparison with its close related species A. brevicorne living in a relatively less harsh environment. Physiological constraints prevent aphid colonization beyond the range limit we detected for A. svalbardicum, although the temperature increase recorded in Svalbard in the last few decades might well favour population establishment further north [39]. At this range limit, populations showed low gene and genotypic diversities and high genetic divergence, which seemingly limits the adaptation of A. svalbardicum to extreme environment. Low dispersal apparently accounts for the overall strong genetic differentiation among populations, but again this could change if warming induces a sudden increase of wing morph production recently reported in Svalbard [11,12]. The colonization history of Svalbard by A. svalbardicum requires further in-depth studies involving phylogeographic analyses of arctic and alpine populations of Acyrthosiphon sp. feeding on D. octopetala. This would allow for better inference of the source origins of A. svalbardicum populations that have colonised Svalbard. Finally, more work is needed to elucidate the mechanisms underlying the adaptation to the artic environment in both A. svalbardicum and A. brevicorne, which has led to such peculiar life cycles and traits.

Supplementary Materials

Figure S1: Pairwise comparisons of FST values between the 38 samples of A. brevicorne (samples 1 to 9) and A. svalbardicum (10 to 38).

Author Contributions

Conceptualization, M.H., Y.O., J.-C.S.; sampling, J.B., D.M., M.H., Y.O., J.-C.S.; genotyping and barcoding, F.M., C.B.; data analysis, J.-P.G., L.M., J.-C.S., Y.O.; writing—first draft, J.-C.S.; writing—review and editing, M.H., Y.O., J.-C.S.

Funding

This research was funded by French Polar Institute Paul Emile Victor (IPEV), under agreement n° 426, program Arctaphid.

Acknowledgments

We thank the French Polar Institute Paul Emile Victor (IPEV) for financial support and the staff of the German-French research base at Ny Ålesund (AWIPEV) for logistics during the summer campaigns. We also wish to thank Ian Hodkinson for helping with collection of the Abisko populations and Steve Coulson for fruitful discussion and advice. The isolation of microsatellites in Acyrthosiphon svalbardicum was achieved under the Ecomicro project funded by INRA and coordinated by Thibault Malausa.

Conflicts of Interest

The authors declare no conflict of interest.

References

  1. Gaston, K.J. Geographic range limits of species. Proc. Roy. Soc. B-Biol. Sci. 2009, 276, 1391–1393. [Google Scholar] [CrossRef]
  2. Hoffmann, A.A.; Blows, M.W. Species borders—ecological and evolutionary perspectives. Trends Ecol. Evol. 1994, 9, 223–227. [Google Scholar] [CrossRef]
  3. Facon, B.; Genton, B.J.; Shykoff, J.; Jarne, P.; Estoup, A.; David, P. A general eco-evolutionary framework for understanding bioinvasions. Trends Ecol. Evol. 2006, 21, 130–135. [Google Scholar] [CrossRef]
  4. Strathdee, A.T.; Bale, J.S. Life on the edge: Insect ecology in arctic environments. Annu. Rev. Entomol. 1998, 43, 85–106. [Google Scholar] [CrossRef]
  5. Coulson, S.J.; Convey, P.; Aakra, K.; Aarvik, L.; Avila-Jimenez, M.L.; Babenko, A.; Biersma, E.M.; Bostrom, S.; Brittain, J.E.; Carlsson, A.M.; et al. The terrestrial and freshwater invertebrate biodiversity of the archipelagoes of the Barents sea, Svalbard, Franz Josef Land and Novaya Zemlya. Soil Biol. Bioch. 2014, 68, 440–470. [Google Scholar] [CrossRef]
  6. Alsos, I.G.; Eidesen, P.B.; Ehrich, D.; Skrede, I.; Westergaard, K.; Jacobsen, G.H.; Landvik, J.Y.; Taberlet, P.; Brochmann, C. Frequent long-distance plant colonization in the changing arctic. Science 2007, 316, 1606–1609. [Google Scholar] [CrossRef]
  7. Coulson, S.; Refseth, D. The terrestrial and freshwater invertebrate fauna of Svalbard (and Jan Mayen). A Cat. Terr. Mar. Anim. Svalbard 2004, 57–122. [Google Scholar]
  8. Strathdee, A.T.; Bale, J.S.; Block, W.C.; Webb, N.R.; Hodkinson, I.D.; Coulson, S.J. Extreme adaptive life-cycle in a high arctic aphid, Acyrthosiphon svalbardicum. Ecol. Entomol. 1993, 18, 254–258. [Google Scholar] [CrossRef]
  9. Hullé, M.; Bonhomme, J.; Maurice, D.; Simon, J.-C. Is the life cycle of high arctic aphids adapted to climate change? Polar Biol. 2008, 31, 1037–1042. [Google Scholar] [CrossRef]
  10. Strathdee, A.T.; Bale, J.S. Factors limiting the distribution of Acyrthosiphon svalbardicum (Hemiptera, Aphididae) on Spitsbergen. Polar Biol. 1995, 15, 375–380. [Google Scholar] [CrossRef]
  11. Hodkinson, I.; Coulson, S.; Bird, J.; Webb, N.R. Discovery of the rare alate morph of Acyrthosiphon svalbardicum Heikinheimo (Homoptera; Aphididae): Description and implications for species ecology. Norwegian J. Entomol. 2002, 49, 77–88. [Google Scholar]
  12. Simon, J.C.; Bonhomme, J.; Blackman, R.L.; Hullé, M. Winged morph of the high arctic aphid Acyrthosiphon svalbardicum (Hemiptera: Aphididae): Abundance, reproductive status, and ecological significance. Can. Entomol. 2008, 140, 385–387. [Google Scholar] [CrossRef]
  13. Eastop, V.F. Key for the identification of Acyrthosiphon (hemiptera: Aphididae). Bull. Brit. Mus. (Nat. Hist.) Entomol 1971, 26. [Google Scholar]
  14. Hille Ris Lambers, D. Additions to the aphid fauna of Greenland. Meddelelser om Grønland 1960, 159, 1–18. [Google Scholar]
  15. Heikinheimo, O. Notes on the arthropod fauna of Spitsbergen. II: 10. The aphid fauna of Spitsbergen. Ann. Entomol. Fenn. 1968, 34, 82–93. [Google Scholar]
  16. Strathdee, A.T.; Bale, J.S. Life cycle and morph production in the arctic aphid Acyrthosiphon brevicorne. Polar Biol. 1996, 16, 293–300. [Google Scholar] [CrossRef]
  17. Malausa, T.; Gilles, A.; Meglecz, E.; Blanquart, H.; Duthoy, S.; Costedoat, C.; Dubut, V.; Pech, N.; Castagnone-sereno, P.; Delye, C.; et al. High-throughput microsatellite isolation through 454 GS-FLX titanium pyrosequencing of enriched DNA libraries. Mol. Ecol. Res. 2011, 11, 638–644. [Google Scholar] [CrossRef]
  18. Meglécz, E.; Costedoat, C.; Dubut, V.; Gilles, A.; Malausa, T.; Pech, N.; Martin, J.-F. Qdd: A user-friendly program to select microsatellite markers and design primers from large sequencing projects. Bioinformatics 2009, 26, 403–404. [Google Scholar] [CrossRef]
  19. Boutin-Ganache, I.; Raposo, M.; Raymond, M.; Deschepper, C.F. M13-tailed primers improve the readability and usability of microsatellite analyses performed with two different allele-sizing methods. BioTechniques 2001, 31, 24–26. [Google Scholar] [CrossRef]
  20. Raymond, M.; Rousset, F. Genepop (version 1.2): Population genetics software for exact tests and ecumenicism. J. Hered. 1995, 86, 248–249. [Google Scholar] [CrossRef]
  21. Belkhir, K.; Borsa, P.; Chikhi, L.; Raufaste, N.; Bonhomme, F. Genetix 4.05, Logiciel Sous Windows TM Pour la Génétique des Populations. Available online: http://kimura.univ-montp2.fr/genetix/ (accessed on 14 June 2014).
  22. Bates, D.; Mächler, M.; Bolker, B.; Walker, S. Fitting linear mixed-effects models using lme4. J. Stat. Soft. 2015, 67, 48. [Google Scholar] [CrossRef]
  23. R Core Team. R: A Language and Environment for Statistical Computing; R Foundation for Statistical Computing: Vienna, Austria, 2018. [Google Scholar]
  24. Goudet, J. Fstat, A Program to Estimate and Test Gene Diversities and Fixation Indices. Available online: http://www2.unil.ch/popgen/softwares/fstat.htm (accessed on 14 June 2014).
  25. Jin, L.; Chakraborty, R. Estimation of genetic distance and coefficient of gene diversity from single-probe multilocus DNA fingerprinting data. Mol. Biol. Evol. 1994, 11, 120–127. [Google Scholar]
  26. Rousset, F. Genetic differentiation and estimation of gene flow from F-statistics under isolation by distance. Genetics 1997, 145, 1219–1228. [Google Scholar]
  27. Pritchard, J.K.; Stephens, M.; Donnelly, P. Inference of population structure using multilocus genotype data. Genetics 2000, 155, 945–959. [Google Scholar]
  28. Evanno, G.; Regnaut, S.; Goudet, J. Detecting the number of clusters of individuals using the software structure: A simulation study. Mol. Ecol. 2005, 14, 2611–2620. [Google Scholar] [CrossRef]
  29. Chen, R.; Jiang, L.-Y.; Liu, L.; Liu, Q.-H.; Wen, J.; Zhang, R.-L.; Li, X.-Y.; Wang, Y.; Lei, F.-M.; Qiao, G.-X. The gnd gene of Buchnera as a new, effective DNA barcode for aphid identification. Syst. Entomol. 2013, 38, 615–625. [Google Scholar] [CrossRef]
  30. Hall, T.A. Bioedit: A user-friendly biological sequence alignment editor and analysis program for windows 95⁄98⁄NT. Nucleic Acids Symp. Ser. 1999, 41, 95–98. [Google Scholar]
  31. Thompson, J.D.; Higgins, D.G.; Gibson, T.J. Clustal w: Improving the sensitivity of progressive multiple sequence alignment through sequence weighting, position-specific gap penalties and weight matrix choice. Nucleic Acids Res. 1994, 22, 4673–4680. [Google Scholar] [CrossRef]
  32. Tamura, K.; Dudley, J.; Nei, M.; Kumar, S. Mega4: Molecular evolutionary genetics analysis (Mega) software version 4.0. Mol. Biol. Evol. 2007, 24, 1596–1599. [Google Scholar] [CrossRef]
  33. Ávila-Jiménez, M.L.; Coulson, S.J. Can snow depth be used to predict the distribution of the high arctic aphid Acyrthosiphon svalbardicum (Hemiptera: Aphididae) on Spitsbergen? BMC Ecol. 2011, 11, 25. [Google Scholar] [CrossRef]
  34. Landvik, J.Y.; Brook, E.J.; Gualtieri, L.; Raisbeck, G.; Salvigsen, O.; Yiou, F. Northwest Svalbard during the last glaciation: Ice-free areas existed. Geology 2003, 31, 905–908. [Google Scholar] [CrossRef]
  35. Brochmann, C.; Gabrielsen, T.M.; Nordal, I.; Landvik, J.Y.; Elven, R. Glacial survival or tabula rasa? The history of north Atlantic biota revisited. Taxon 2003, 52, 417–450. [Google Scholar]
  36. Westergaard, K.B.; Alsos, I.G.; Popp, M.; Engelskjon, T.; Flatberg, K.I.; Brochmann, C. Glacial survival may matter after all: Nunatak signatures in the rare european populations of two west-arctic species. Mol. Ecol. 2011, 20, 376–393. [Google Scholar] [CrossRef]
  37. Skrede, I.; Eidesen, P.B.; Portela, R.P.; Brochmann, C. Refugia, differentiation and postglacial migration in arctic-alpine Eurasia, exemplified by the mountain avens (Dryas octopetala L.). Mol. Ecol. 2006, 15, 1827–1840. [Google Scholar] [CrossRef]
  38. Coeur d’acier, A.; Cruaud, A.; Artige, E.; Genson, G.; Clamens, A.-L.; Pierre, E.; Hudaverdian, S.; Simon, J.-C.; Jousselin, E.; Rasplus, J.-Y. DNA barcoding and the associated phylaphidb@se website for the identification of European aphids (Insecta: Hemiptera: Aphididae). PLoS ONE 2014, 9, e97620. [Google Scholar]
  39. Ding, M.H.; Wang, S.J.; Sun, W.J. Decadal climate change in Ny-Alesund, Svalbard, a representative area of the arctic. Condens. Matter 2018, 3. [Google Scholar] [CrossRef] [Green Version]
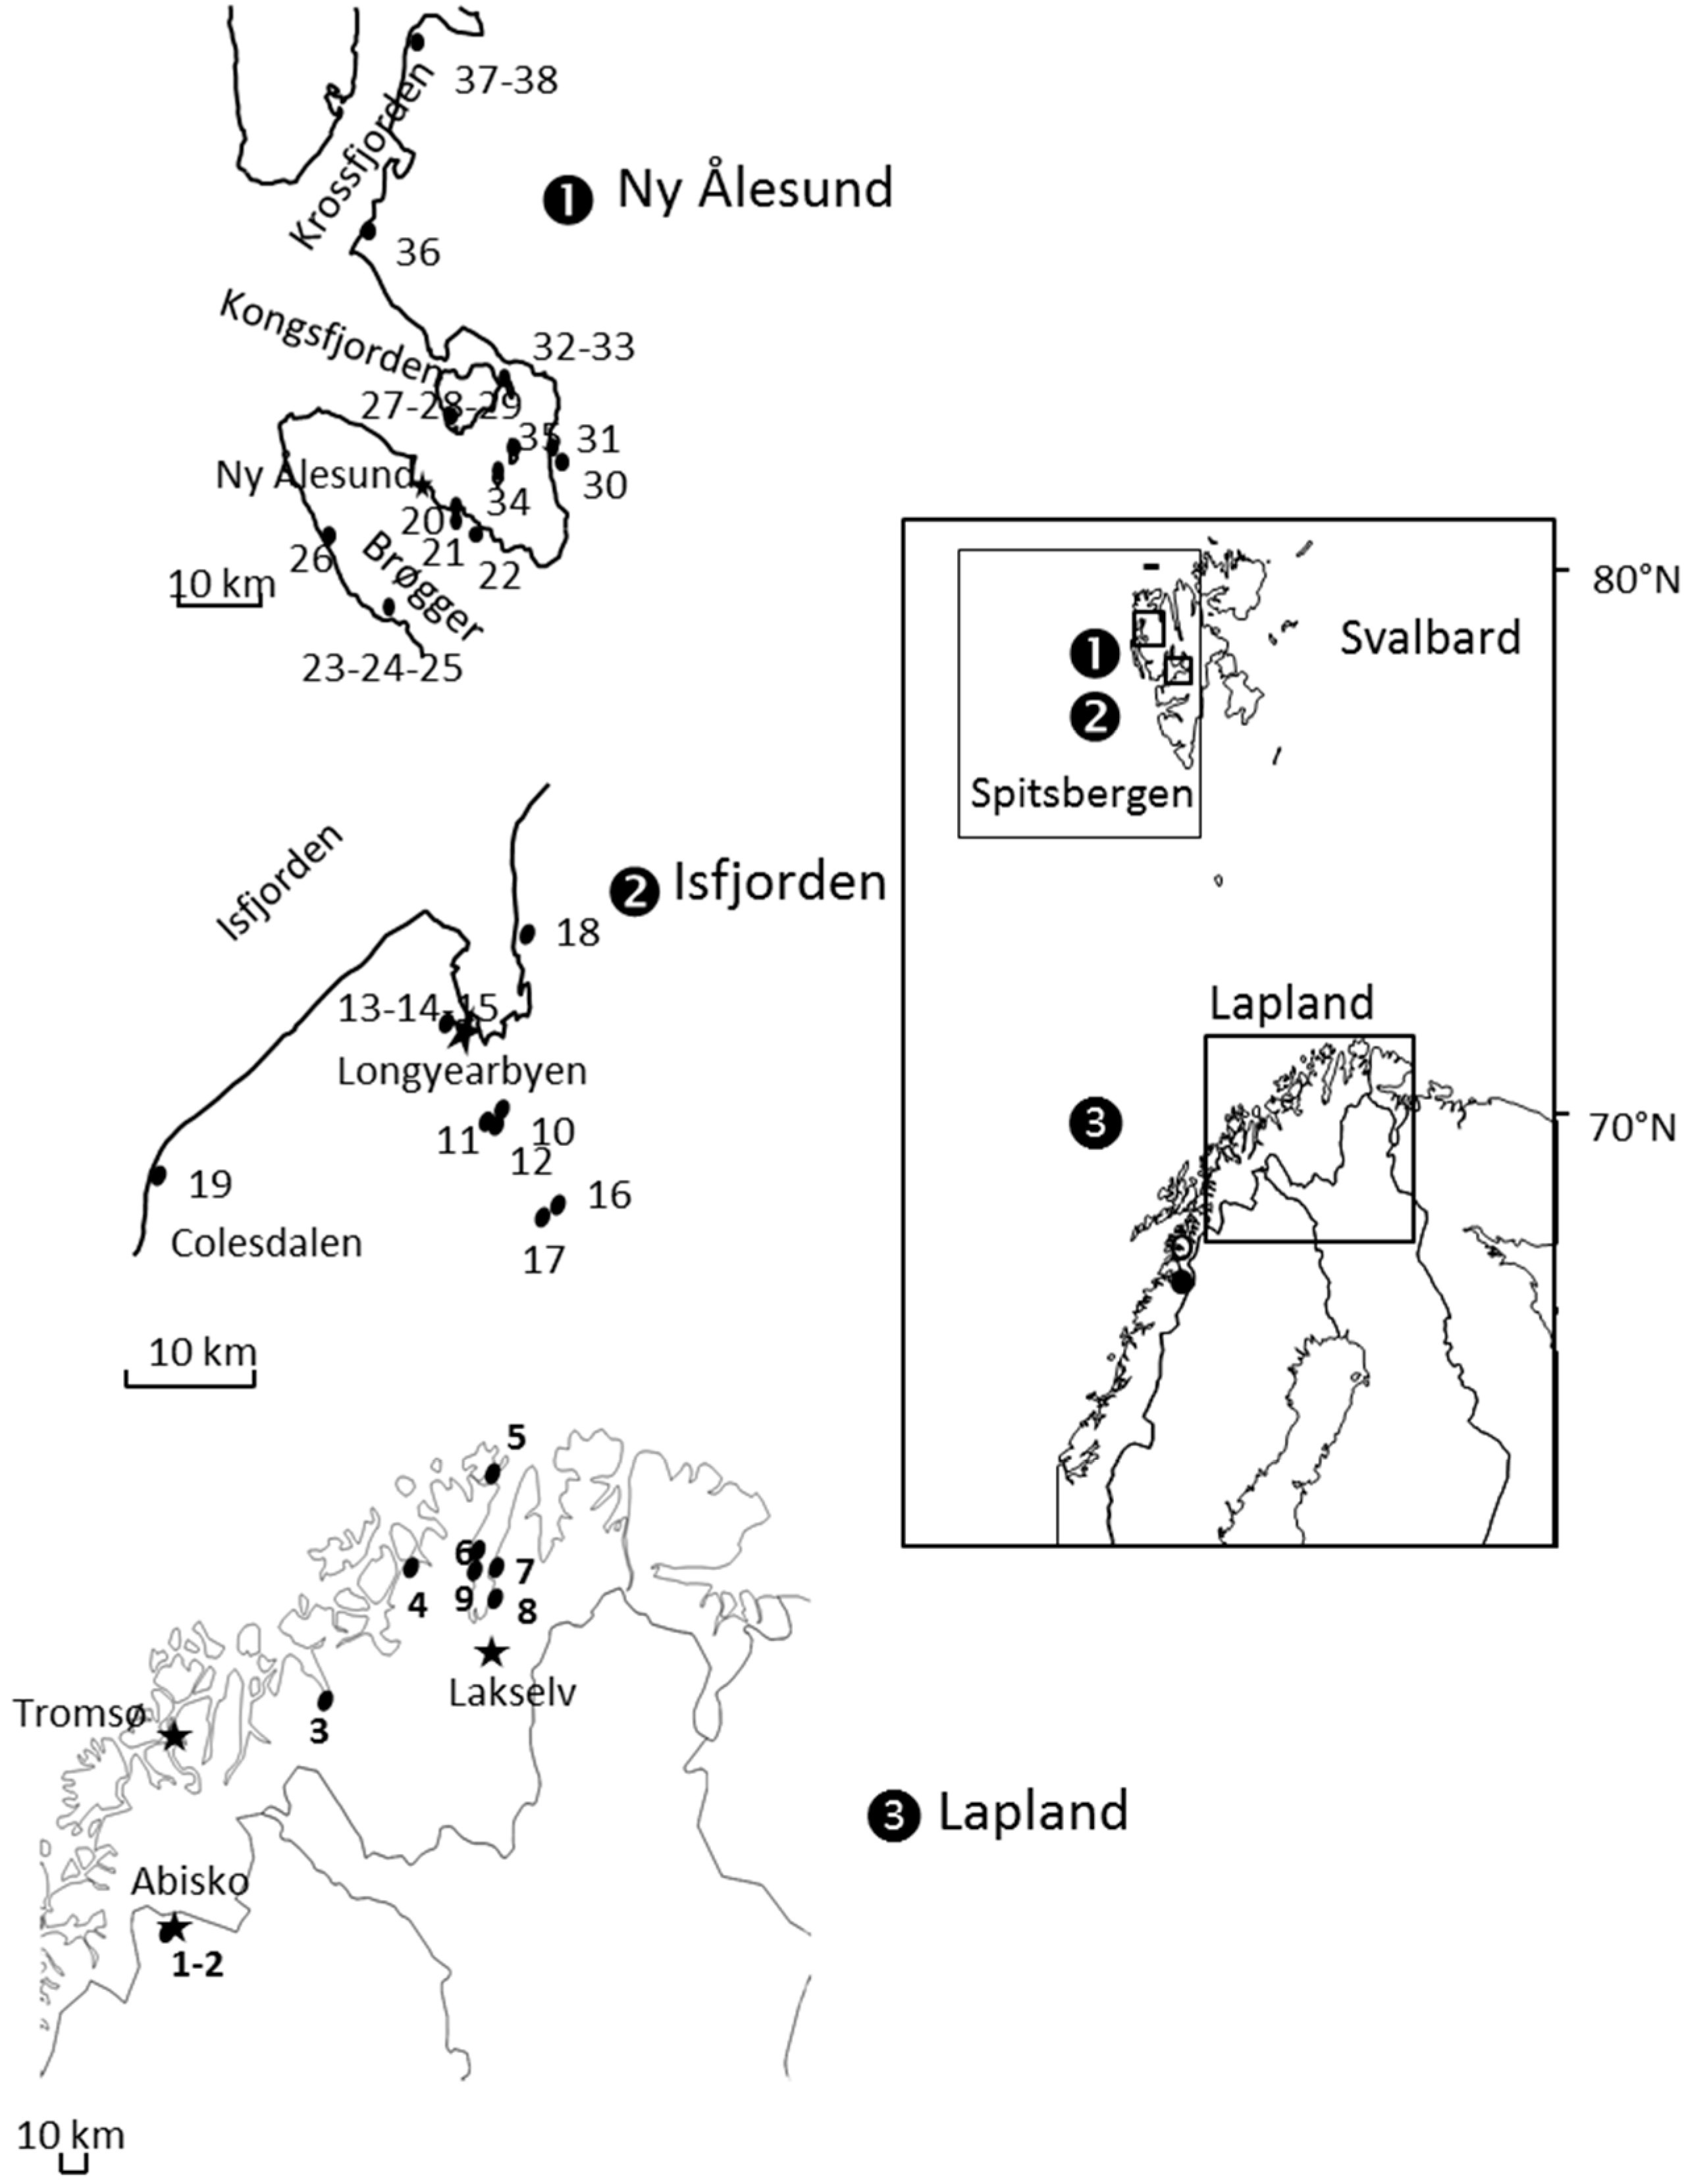
Figure 1. Maps showing the locations of A. svalbardicum (zones 1 and 2) and A. brevicorne (zone 3) populations sampled for genetic analyses. Only sites where aphids were found are indicated. Stars represent towns or settlements.
Insects 10 00427 g001
Figure 2. Correlation between genetic (FST/(1- FST) and geographic (kilometres in Ln scale) distances for samples of A. svalbardicum and A. brevicorne.
Insects 10 00427 g002
Figure 3. Results on the genetic assignment of individuals of A. svalbardicum and A. brevicorne based on the Bayesian method using the program STRUCTURE for K = 3 (A), K = 4 (B) and K = 5 (C). Each individual is represented by a column with its membership coefficient in each of the five clusters. Geographic origins of each genetic cluster are indicated on the bottom of the figure.
Insects 10 00427 g003
Figure 4. Neighbor-Joining tree constructed using allele shared distances between samples of A. svalbardicum and A. brevicorne. Populations with similar symbols were sampled at the approximately same site but at different time intervals.
Insects 10 00427 g004
Figure 5. Phylogenetic tree built on concatenated sequences of COI and gnd genes amplified from A. svalbardicum and A. brevicorne samples. Numbers in bracket refer to sample origins, as coded in Table 1. Sequences of outgroups have been retrieved from Genbank.
Insects 10 00427 g005
Table 1. Locations of the populations of A. svalbardicum from Spitsbergen (Svalbard) and A. brevicorne from Lapland (Northern Norway and Sweden). All aphid populations were collected on D. octopetala plants.
Species (Zone)Sample IDPopulationAreaDateLatitudeLongitude
A. brevicorne (Lapland)POP1Abisko1Abisko29/06/200668°21′12718°49′324
POP2Abisko2Abisko18/06/201068°21′12818°49′325
POP3Gild_01Gildetun29/06/201269°54′17421°35′969
POP4Ham_Kva_01Kvalsund01/07/201270°29′81123°58′695
POP5Honn_01Honninsvag02/07/201270°59′79325°58′246
POP6Lak_01Trollholmsund01/07/201270°16′91425°06′776
POP7Lak_Bor_01Borselv03/07/201270°19′48225°24′383
POP8Lak_NE_01Lakselv-NE03/07/201270°14′81525°25′197
POP9Lak_Sarv_01Sarvvesvuotna01/07/201270°17′25125°06′411
A. svalbardicum (Isfjorden)POP10Endalen1-04Isfjorden30/06/200478°11′26915°45′938
POP11Endalen2-04Isfjorden30/06/200478°11′06915°44′288
POP12Endalen09Isfjorden14/07/200978°11′13115°45′939
POP13LYB1-04Isfjorden01/07/200478°12′99515°36′631
POP14LYB2-04Isfjorden01/07/200478°12′99515°36′631
POP15LYB09Isfjorden22/06/200978°12′99515°36′631
POP16AdventS1Isfjorden03/07/200478°10′14616°06′522
POP17AdventS2Isfjorden03/07/200478°10′02616°06′412
POP18AdventNIsfjorden20/07/200578°15′70215°40′153
POP19ColesdalenIsfjorden19/07/200578°04′60215°15′092
A. svalbardicum (Ny Ålesund)POP20GasebuBrøgger06/07/200978°54′59012°04′338
POP21MidreBrøgger07/07/200478°54′57312°04′339
POP22CorbelBrøgger18/07/200478°53′69812°10′215
POP23Daerten04Brøgger13/07/200478°51′17911°49′826
POP24Daerten06Brøgger09/07/200678°51′17911°49′826
POP25Daerten09Brøgger03/07/200978°51′17911°49′826
POP26TraudalenBrøgger15/07/200478°53′23411°33′579
POP27Blomstrand04Kongsfjorden08/07/200478°57′80112°02′768
POP28Blomstrand06Kongsfjorden11/07/200678°57′80112°02′768
POP29Blomstrand09Kongsfjorden08/07/200978°57′80112°02′768
POP30OssianEKongsfjorden09/07/200478°55′59912°20′623
POP31OssianWKongsfjorden20/07/200478°55′59912°27′413
POP32Gerdoya04Kongsfjorden24/07/200478°59′23312°16′438
POP33Gerdoya09Kongsfjorden07/07/200978°59′23312°16′438
POP34StorholmenKongsfjorden06/07/200978°55′42412°12′324
POP35ObservatoireKongsfjorden07/07/200978°55′52612°16′387
POP36Kapp GuissezKongsfjorden 25/07/200479°05′37411°47′319
POP37CampZoe04Krossfjorden21/07/200479°11′84111°56′485
POP38CampZoe09Krossfjorden29/06/200979°11′84111°56′485
Table 2. Features of the eight microsatellite loci isolated from A. svalbardicum and used for genetic structure assessment of populations of A. svalbardicum from Spitsbergen and A. brevicorne from Lapland, i.e., names of loci, forward and reverse sequences of primers for locus amplification, size range of alleles in base pairs, Nei’s estimations of heterozygosity (Hobs = observed heterozygosity, Hexp = expected heterozygosity).
LocusSequence ForwardSequence ReverseSize Range (bp)HobsHexp
AS23GGCACTGCTCTCATTACGGTTTTTTCTTCGTCATCCCTCG125–1900.6480.715
AS24GTCTGATGATGCGCTTGAAAGAACCCAAACGAGGTGAAAA155–1900.5930.571
AS26AGTCCGGAGGATAACAACGATCACGACCGAACACCATAAA155–2050.4150.458
AS29CACCAAAAAGTCGGGGTAGAGCCGTTGTTGAAGACTATTTCC160–1800.5290.528
AS37CGACGGGCGAGTACCTATTATTTCAAGTAAACCGCTTCGG160–1950.3340.363
AS41ATCTACCGCCACCACTTACGTCGTCGAGATGCTATTGCTG225–1450.3070.324
AS43GAAAAACGAGAAAACGCGACAGTCCCTGATGCAAACAACC250–3050.1620.244
AS45TGAACCTGCTCAACAGCAACCCATGTCCTGACTCATCACG255–3000.4300.443
Table 3. Pairwise comparisons of FST values between the five genetic clusters (C1 to C5) calculated using the program STRUCTURE. See text for the description of the five clusters.
ClusterC1
C10C2
C20.3110C3
C30.2260.1960C4
C40.2810.1850.0970C5
C50.2770.3980.2160.2320
Table 4. Genetic structure of the 38 samples of A. svalbardicum and A. brevicorne from Svalbard (Spitsbergen) and Lapland (Northern Norway and Sweden), respectively: G/N, genotypic diversity measured by the ratio of multilocus genotypes found in the sample over the sample size; Hobs, observed heterozygosity; Hexp, expected heterozygosity; HetDef, test for heterozygote deficit under Hardy Weinberg equilibrium; HetXs, test for heterozygote excess under Hardy Weinberg equilibrium; FIS, inbreeding coefficient (asterisks indicate values significantly different from zero at 95% threshold); % LD, percentage of locus pairs in linkage disequilibrium.
Species/ZoneSample IDSizeG/NHobsHexpAllele RichnessHetdef (p-val)HetXs (p-val)FIS% LD
A. brevicorne (Lapland)POP1200.940.4020.6505.3750.00001.00000.405 *25
POP2151.000.4230.5763.750.00001.00000.302 *7
POP391.000.4530.4092.750.36260.6374−0.0480
POP4191.000.4490.4864.1250.01500.98500.108 *7
POP5201.000.5580.5174.0000.58750.4125−0.05010
POP6230.950.5180.4974.1250.32100.6790−0.0187
POP7251.000.5690.6124.1250.01520.98480.09614
POP8231.000.5810.5544.3750.68600.3140−0.02611
POP9220.740.4380.4863.6250.00060.99940.122 *57
A. svalbardicum (Isfjorden)POP10300.920.3970.3682.50.89580.1042−0.0630
POP11291.000.3000.2862.3750.75180.2482−0.0270
POP12350.850.4330.4583.1250.07830.92170.06843
POP13280.820.4320.3942.750.57510.4249−0.05020
POP14301.000.4270.4073.0000.42060.5794−0.0070
POP15230.960.3990.4073.3750.00880.99120.02829
POP16301.000.3720.4823.3750.00001.00000.246 *21
POP17301.000.4320.4453.1250.04090.95910.0485
POP18361.000.3920.4123.250.00230.99770.06511
POP19420.800.3410.3362.8750.61120.3888−0.00340
A. svalbardicum (Ny Ålesund)POP20301.000.4300.4703.0000.00540.99460.102 *18
POP21301.000.5310.4753.1250.97960.0204−0.10214
POP22240.960.4900.4472.8750.67630.3237−0.0734
POP23300.900.4090.4292.250.22370.77630.06214
POP24330.970.4400.4353.1250.66110.33890.00411
POP25381.000.5050.5133.6250.44220.55780.02936
POP26300.920.3950.3422.0000.57780.4222−0.13730
POP27471.000.5120.4873.50.15140.8486−0.04018
POP28481.000.4940.5073.8750.01640.98360.03511
POP29270.960.5860.5303.1250.94120.0588−0.08719
POP30301.000.5320.5163.6250.82270.1773−0.01511
POP31301.000.5570.5113.750.92570.0743−0.0737
POP32301.000.5030.4903.3750.67730.3227−0.0097
POP33201.000.3560.3432.6250.60570.3943−0.01210
POP34301.000.4480.4413.6250.73760.26240.0005
POP35291.000.4780.5593.50.00080.99920.162 *11
POP36290.960.3630.3322.250.88560.1144−0.07820
POP37300.300.2130.1641.750.55540.4446−0.281 *20
POP38291.000.4380.4292.8750.54610.4539−0.00429