Abstract
In the sheet metal stamping process, during sliding contact between the tool and sheet, it is expected that severe events such as tool wear or fracture on the sheet generate acoustic emission (AE) burst waveforms. Attempts have been made in the literature to correlate the AE burst waveform with the wear mechanisms. However, there is a need for additional studies to understand the frequency characteristics of the AE burst waveform due to the severity and progression of the galling wear. This paper will determine the AE frequency characteristics that can be used to monitor galling wear, independent of the experimental process examined. The AE burst waveforms generated during the stamping and scratch tests are analysed in this paper to understand the change in the AE frequency characteristics with the galling severity. These AE burst waveforms were investigated using the Hilbert Huang Transform (HHT) time-frequency technique, band power, and mean-frequency. Subsequently, these AE frequency features are correlated with the wear behaviour observed via high-resolution profilometer images of the stamped parts and scratch surfaces. Initially, the HHT technique is applied to the AE burst waveform to understand the influence of wear severity in the power distribution over the wide AE frequency range. Later, the AE bandpower feature is used to quantitatively analyse the power in each frequency interval during the unworn and worn tool conditions. Finally, the mean-frequency of AE signal is identified to be able to determine the onset of galling wear. The new knowledge defined in this paper is the AE frequency features and wear measurement feature that can be used to indicate the onset of galling wear, irrespective of the processes examined.
Highlights
- AE burst waveform can be used to investigate galling.
- AE mean-frequency can indicate galling wear initiation at industrial and tribological condition.
- Profile depth wear feature can be used quantitatively to correlate with AE frequency features.
- Frequency-magnitude and bandpower increased with increase in galling severity.
1. Introduction
The increased use of advanced and ultra-high strength steels in car body panels has led to an increase in stamping force and stress on the stamping tools used in vehicle body manufacturing, leading to untimely failure of stamping tools [1]. Failure of stamping tools is primarily attributed to an adhesive wear mechanism called galling. According to ASTM G40-17, galling wear is a macroscopic surface damage arising between sliding bodies that results in protrusions above the original surface. The protrusion on the tool surface results in material flow or plastic flow or both [2]. Surface defects, insufficient lubricants, and temperature at the tool-workpiece interface contribute to the galling wear in the sheet metal stamping process. Galling wear on the stamping tool results in severe scratching of the sheet surface during the stamping process. The creation of these scratches on the stamped part surface can be considered as the action of abrasive wear modes such as ploughing and cutting [3,4,5]. Galling on the tool and the subsequent formation of abrasive wear modes on the sheet surface can arise quickly, due to the rapid development of the galling stages [6]. This necessitates the requirement for condition monitoring techniques that can be used to predict the need for timely maintenance of the stamping tools, prior to the detrimental effects of galling on production output and quality. Even a minor improvement in the condition monitoring technique of stamping tools, can reduce machine downtime and wastage of materials. Therefore, condition monitoring techniques that can provide timely information about wear initiation and wear progression on the stamping tools is of high importance for the stamping industries. By contrast, conventional wear measurement techniques—such as visual and optical based inspection, weight measurements, and surface profilometry—cannot provide timely and/or quantitative information.
Galling wear in sheet metal forming processes has been extensively studied in the literature under controlled conditions. A large number of studies have used slider on flat surface (SOFS) tribometers for galling analysis. For example, Gåård et al. [7] performed tribological evaluation using SOFS tribometer to investigate galling resistance of different tool materials and the best galling resistance was observed for nitrogen alloyed powder metallurgy tool steel. Karlsson et al. [8] investigated different wear mechanisms in a sheet metal forming process using SOFS tribometer and observed abrasive and adhesive wear to be the dominant wear mechanisms. In both these studies [7,8], galling wear was investigated qualitatively and force signatures were unstable when galling was observed on the tool. Sindi et al. [9] performed tribological studies using acoustic emission (AE) on a SOFS tribometer and observed severe scratches and adhesive wear in the AE frequency range of 0.19–0.375 MHz. Hase et al. [10] investigated adhesive and abrasive wear mechanisms using AE on pin on block setup and observed adhesive wear in the AE frequency range of 1–1.5 MHz and abrasive wear in the AE frequency range of 0.1–0.3 MHz. In these studies [9,10], the AE burst waveform was mainly observed when galling was observed on the tool. Shanbhag et al. [5,11], investigated ploughing, cutting, and galling wear mechanisms under controlled conditions using force and AE sensors during scratch tests. Cutting wear modes were observed on the sheet surface mainly when galling wear was observed on the tool. There has also been a considerable number of studies that been conducted on a semi-industrial stamping setup. For example, Ge et al. [12] and Bassiuny et al. [13] performed fault diagnosis of stamping using a strain sensor on a stamping setup. Ge et al. [12] performed fault diagnosis using support vector machine on a strain signal to identify different faults such as misfeed, normal, and slug based stamping operations. Bassiuny et al. [13] performed fault diagnosis using empirical mode decomposition and learning vector quantization on a strain signal to identify faults such as normal, misfeed, and thick material. The energy index of the strain signal was found to be higher for the normal stamping operation, compared to the other two fault conditions. In both these studies [12,13], fault diagnosis was performed only on a particular fault condition. Further condition monitoring studies are required to identify the progressive behaviour of tool wear. Ubhayaratne et al. [1] performed condition monitoring on a semi-industrial stamping setup using audio sensors. The relative cumulative spectral power index feature of the audio signal was proposed to monitor progressive wear behaviour of stamping tool. Skåre et al. [14] and Shanbhag et al. [15] studied progressive behaviour of stamping tool using AE features. Skåre et al. [14] used AE RMS to monitor progressive behaviour of the stamping tool and Shanbhag et al. [15] used AE mean-frequency to investigate wear initiation on the stamping tool at the microscopic level. Filippov et al. [16,17,18] studied the correlation between the AE frequency characteristics and the wear in the metal cutting process. The AE median frequency feature was observed to be sensitive to the chatter mode vibrations and discontinuous chip formation in the metal cutting process as well as the wear rate during tribological sliding tests. In the tribology study on the equal channel angular pressing process, a direct correlation was observed between the wear and AE signal median frequency feature as the number of forming operations increased [18]. Most of these studies are focussed on defining frequency features of the AE signal obtained from either machining processes, a tribology setup, or from the semi-industrial stamping setup. Therefore, there has been limited application of the findings to other processes, because the AE features or behaviour identified may be specific to the particular experimental method examined. To the best of author’s knowledge, there has been little or no studies that have defined AE frequency characteristics of galling wear independent of the experimental processes examined.
From the literature, AE has been successfully used to investigate galling wear on industrial stamping setups or on laboratory-based tribology setups that replicate stamping conditions. Therefore, in this study, galling wear will be investigated on a semi-industrial stamping setup as well as on a tribology setup using AE, to define the AE frequency characteristics that can be used to monitor galling wear irrespective of the process. Accelerated tests were performed under two conditions (i.e., semi-industrial and tribology) to meet the objective. In the first condition, stamping tests were performed on a semi-industrial setup to study progressive behaviour of the stamping tools. In the second condition, scratch tests were performed under controlled conditions to investigate different wear mechanisms that were commonly observed on a stamping tool. Sheet and tool materials for stamping (Sheet: XF300, Tool: D2 steel) and scratch tests (Sheet: DP 780, Tool: Tungsten carbide) were used to ensure different wear conditions were observed on the sheet and tool in short duration (few minutes) rather than longer duration (many hours) that is typically observed in industrial applications. It was identified that the AE burst signals, which arise due to the galling mechanisms, may have common characteristics in the different processes. Therefore, the AE burst signals were segregated at different intervals from the continuous AE signal obtained from both the tests. These segregated signals were further analysed using different frequency-based features to define frequency characteristics that can be used to monitor galling wear, irrespective of the processes that cause the galling wear.
2. Experimental Details
2.1. Experimental Test Setup
2.1.1. Semi-Industrial Stamping Test
Stamping tests were performed using semi-industrial test setup that closely replicates the stamping conditions in the automotive industry. A mechanical press with a progressive die set was used in this study to produce U-shaped channel parts, as shown in Figure 1. This setup is capable of performing multiple operations such as clamping, piercing, stamping, and trimming in a single stroke. For visual inspection of wear on the die radii, removable die inserts were used. To study the progressive wear behaviour, accelerated stamping tests were performed to permit failure of the die inserts within a few hundred stamped parts, rather than longer tool life that is normally expected during the mass production. The material and process parameters used in this study are summarized in Table 1 and these were kept constant throughout the study.
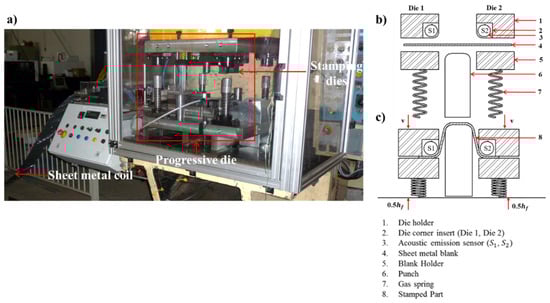
Figure 1.
(a) Stamping setup. Schematic view of stamping setup (b) before stamping and (c) after stamping.

Table 1.
Material and process parameters for the stamping and scratch tests.
2.1.2. Scratch Test
Ploughing, cutting, and galling are commonly observed wear mechanisms in the sheet metal stamping process. Therefore, to study the wear mechanisms observed in sheet metal stamping process, experiments were conducted under controlled conditions using a displacement-controlled scratch tester. The scratch tester was chosen mainly because it allows the investigation of adhesive and abrasive wear mechanisms under short sliding distances and the continuous acquisition of AE data at high frequency. As shown in Figure 2, the scratch tests were performed based on a custom setup developed using a semi-automatic turret milling machine. The sliding direction for the scratch tests were in the y-direction using a constant feed rate and with the rotation of the spindle locked (Figure 2c). To measure the load at the start of the test, a Kistler dynamometer (model: 9257B) was clamped to the bed of the milling machine using clamps and flange nuts. The sheet was fixed to the dynamometer using screws. Before the start of each test, the sheet and indenter surface were cleaned using ethanol to remove any traces of oil or dust. Lubrication was not used during the tests mainly to allow the adhesive and abrasive wear mechanisms to develop on the sheet and tool surface within a short sliding distance. The material and process parameters used in this study are summarized in Table 1. The tests were performed at varying depth of penetration, Dp (Equation (1)). Dp was calculated according to methodology adopted by Hokkirigawa et al. [19].
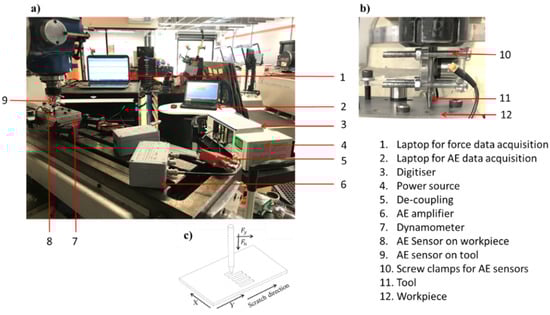
Figure 2.
(a) Scratch test setup. (b) Close-up image of indenter and workpiece. (c) Schematic view of scratch orientation.
2.2. Profilometry Study
2.2.1. Stamping Test
To examine the wear behaviour of the die inserts, the sidewall surface of the stamped parts was analysed using a non-contact, optical profilometer (Alicona-InfiniteFocus). As shown in Figure 3, the samples were held at a fixed orientation to the optical profilometer using a custom fixture. The stamped parts that were selected for wear measurements were based on the visual observation of the wear severity on the sidewalls of the stamped parts. All parts were scanned using an objective magnification of 5× and scan area of 28 × 10 mm (see Figure 4for the location of the scanned area). To obtain a flat surface for wear measurement, tilt and curvature removal was applied to the scanned surface using a plane feature available in the profilometer software (IF-MeasurementSuite v.5.1) [20]. As shown in Figure 4, a single 2D surface profile was obtained using the mean of five adjacent profiles along the centreline of the 3D profilometry data. The maximum depth of the 2D surface profile was measured.
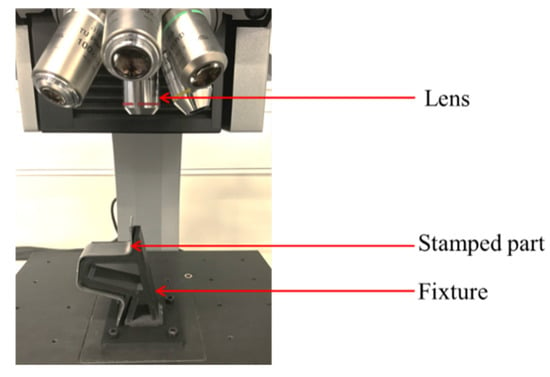
Figure 3.
Fixture used to scan the stamped parts with the optical profilometer.
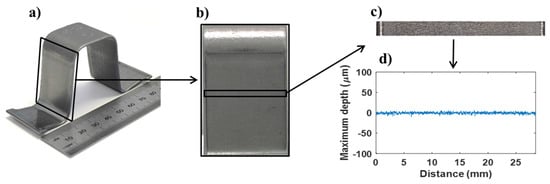
Figure 4.
(a) An example of a stamped part and (b) a photograph of the stamped part sidewall (in contact with Die 1), showing the approximate area measured using optical profilometry. (c) Optical profilometer image of the scanned area and (d) the corresponding 2D surface profile.
2.2.2. Scratch Test
The scratch test scans were performed using the “X-large ImageField” option that is available in profilometer software [20]. This option allows the user to display the image of the 3D surface dataset at different levels, depending on the resolution desired. For example, level 1 contains a small view with higher resolution. Whereas, level 2 contains a larger view with reduced resolution. To quantitatively correlate the AE signal with the wear measurements of the complete part, a larger view with reduced resolution was selected (i.e., level 1). For example, Figure 5 represents the complete view of the scratch image for the test performed at Dp of 0.22. To quantify the wear on the scratch surface, the profile depth was measured along the scratch direction at the centre, as shown in Figure 5. The width of the profile depth measurement at the centre of scratch is 0.2 mm. To avoid the influence on the indenter loading and unloading during the scratch test, the start and end of the scratch (1 mm length) were discarded for the profile depth measurements. To qualitatively study the wear on the scratch surface and correlate this with AE burst data, a smaller view with higher resolution was selected (i.e., level 2). The level 2 images are represented later in Figure 17.
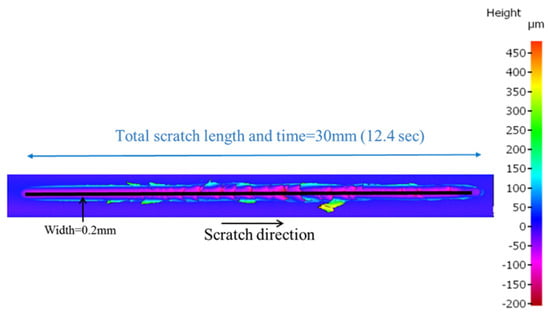
Figure 5.
Example 3D surface contour of the sheet material after the scratch test (Dp = 0.22), showing where the profile depth measurement along the scratch is measured.
2.3. AE Data Acquisition
Figure 6 represents schematic view of the equipment and connections made for the AE measurement and data acquisition for stamping and scratch tests. In this study, wideband AE sensors with a frequency range of 0.02–2.5 MHz and flat frequency response of 0.2–2.5 MHz were used (Figure 6b). The AE sensors (as shown in Figure 1 and Figure 2) were mounted on the tool in the stamping tests using magnetic clamps, and on both the tool and sheet in the scratch tests using screw clamps. To enhance the AE transmission, a small amount of ultrasonic couplant was applied to AE sensor face before clamping it to the tool and sheet surface. The AE sensors were connected to the data acquisition system via a pre-amplifier with a gain of 40 dB and high-speed digitiser. The AE sampling frequency for both the tests conditions was maintained at 2 MHz per channel. To verify the contact between the AE sensors and the samples, the Hsu–Nielsen pencil lead break test was performed at the start of each test, as described in our previous studies [11,15].
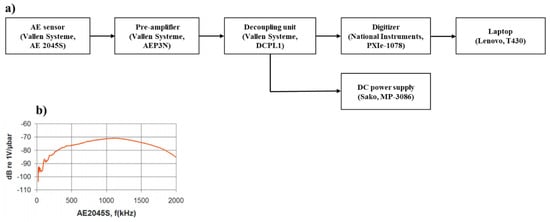
Figure 6.
(a) Schematic view of the equipment connections made for acoustic emission (AE) data acquisition. (b) Frequency response of AE sensor used in this study (Reproduced from reference [21] with permission from Vallen Systeme, AE 2045S).
2.4. Extraction of the AE Burst Waveform
The procedure of acquiring the AE signal during stamping and scratch tests has been explained in detail in our previous study [5,11]. To correlate the AE burst waveform from the stamping and scratch tests, the length of the extracted AE burst waveform for the study was maintained at 1000 µs. Additionally, the peak of maximum AE amplitude was maintained approximately at the same time for each window (i.e., at 100 µs). In this section, only the extraction of the AE burst waveform, from the continuous AE signal obtained from stamping and scratch tests is discussed.
2.4.1. Stamping Test
To study the AE frequency characteristics associated with the galling wear, the AE burst waveform was segregated at a varying intensity (amplitude) from the stamping and scratch test data. The AE burst waveform of the maximum amplitude from the stamping test was analysed for every 45th part for both Die 1 and Die 2. To explain the methodology, only the AE signal related to six parts (Die 1) is represented in Figure 7. The highlighted area in these figures indicates the area segregated to analyse the frequency and power component associated with the wear. Figure 8 shows an example of the AE waveform signal from the highlighted area in Figure 7f.
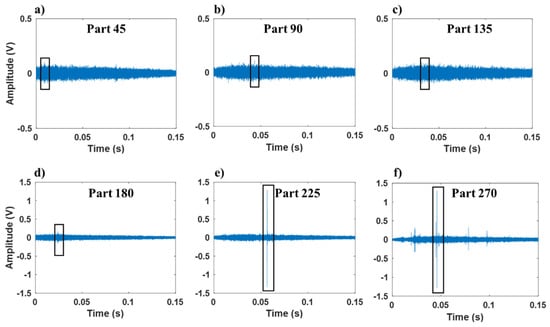
Figure 7.
AE signal for Die 1 of parts (a) 45, (b) 90, (c) 135, (d) 180, (e) 225, and (f) 270 (highlighted area indicates the AE signal separated to analyse AE burst waveform).
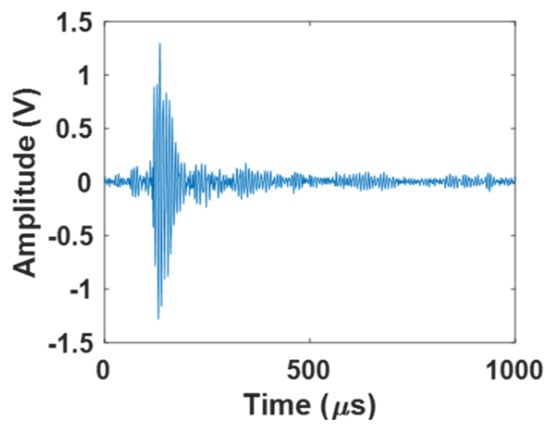
Figure 8.
AE burst waveform for Die 1 for part 270.
2.4.2. Scratch Test
Figure 9a shows an example of the complete AE signal used to segregate the AE burst waveform at various instances. The maximum AE burst waveform from every 2 s of AE data was segregated and used for further analysis. However, the length of AE burst waveform extracted from the AE data of 2 s was maintained at 1000 µs (Figure 9b) to allow comparison with the AE burst waveform extracted from the stamping test. This meant that six sets of signals (of two seconds length) were examined for each scratch test. Figure 9b represents the AE burst waveform segregated from the AE signal of indenter (Figure 9a) for the scratch test between the 9–10 s interval.
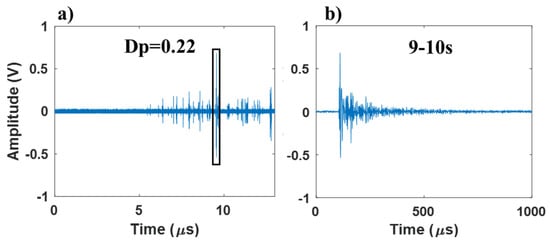
Figure 9.
(a) AE signal from the sensor mounted on the indenter for the scratch test (Dp = 0.22), (b) AE burst waveform extracted from the 9–10 s interval.
2.5. Analysis of the AE Burst Waveform
The AE burst waveform obtained from stamping and scratch tests was analysed using the empirical mode decomposition (EMD) technique to filter the low frequency noise from the AE signal. EMD technique has been extensively discussed in the literature [22,23]. Therefore, only the application of EMD technique to the AE burst waveform is discussed in this section. A total of 10 intrinsic mode functions (IMFs) were obtained for each AE burst waveform. To filter the low frequency noise, only the dominant IMFs were used to reconstruct the AE signal. The dominant IMF was calculated using the correlation coefficient between the actual AE signal and the IMF. Figure 10a–c, represents three dominant IMFs obtained through EMD of AE signal from Part 270-Die 1 (Figure 7f). Figure 10d represents the AE signal reconstructed using the dominant IMFs. The reconstructed AE signal was further analysed using Hilbert Huang Transform (HHT). To understand the magnitude of the frequency peak with increase in wear severity, frequency-magnitude plots were obtained using the reconstructed IMFs from the HHT analysis [15]. In addition, the AE bandpower and AE mean-frequency was calculated for the reconstructed AE burst waveform using an inbuilt function available in the MATLAB software [24,25].
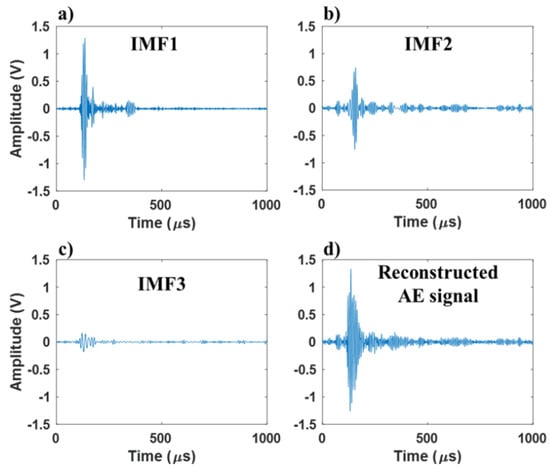
Figure 10.
Decomposed AE signal of part 270 for Die 1 (shown in Figure 8)into intrinsic mode functions (IMFs) and the corresponding correlation coefficient in parenthesis: (a) IMF 1 (0.8165), (b) IMF 2 (0.5765), (c) IMF 3 (0.0298). (d) Reconstructed AE signal using the top three dominant IMFs.
3. Results
3.1. Stamping Test Analysis
In this section, the AE burst waveform obtained from the stamping test of Die 1 is used for the AE frequency analysis. Similarly, the sidewall of the stamped parts that are in contact with Die 1, is used to correlate with the frequency characteristics of the AE burst waveform. To show the repeatability of this study, the AE burst waveform from the stamping test of Die 2 is used.
3.1.1. Profilometry Study of Stamped Parts
To correlate the source of the AE burst waveform with a specific wear mechanism in the stamping test, microscopic observation of the workpiece (stamped part sidewalls) was considered. Wear in the sheet metal stamping process that precedes galling on the tool progresses through a number of stages. For the initial stamped parts, no wear was observed at the edges of the stamped parts (Figure 11a). However, after stamping a few parts (135 parts), minor scratches were observed at the edges of the parts (Figure 11b). These minor scratches were mainly in the form of ploughing wear as no major fracture was observed at the edges. These minor scratches observed at the edges indicate the initiation of galling wear on the tool and lump growth on the tool [26]. With the increase in number of stamped parts, the severity of the ploughing wear mode on the stamped parts increases (Figure 11c). From Figure 11d,e, along with ploughing wear, fracture is also observed. The presence of fracture on the sheet surface is likely due to the growth and work hardening of the lump on the tool (Figure 11f) that results in fracture/cutting wear mode on the sheet surface [9,27,28].
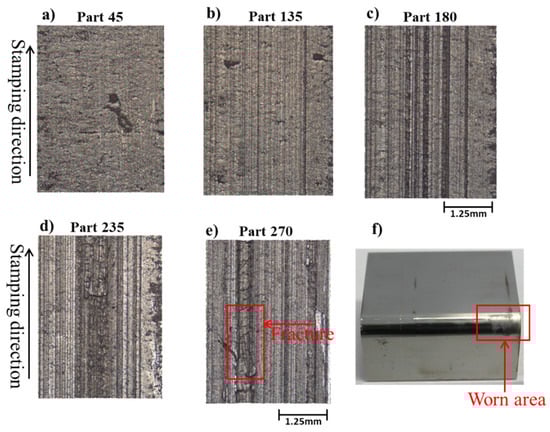
Figure 11.
Profilometer images at the edges of parts (a) 45, (b) 135, (c) 180, (d) 235, and (e) 270 (all stamped using Die 1). (f) Worn area on the stamping Die 1.
3.1.2. AE Burst Waveform From The Stamping Test
Figure 12 represents the selected AE burst waveforms from the stamping test. In Figure 12a–d, it is evident that the maximum amplitude AE signal is not significantly larger than the AE signal from the stamping process. For these parts, the maximum amplitude is less than 0.15 V—i.e., no major burst waveform is observed. The absence of the AE burst waveform is because the tool is not worn, while the continuous AE data observed here is due to the friction between the sheet and tools and the plastic deformation of the sheet during the stamping process [5,29]. In Figure 12e,f, along with the continuous AE signal, high amplitude AE burst waveforms are also observed. The high amplitude burst waveform is an indication of the tool wear [29]. The maximum amplitude of the AE burst waveform for the parts stamped with the worn die (>1V, Figure 12e,f) is greater than the amplitude of the AE signal for the parts where wear is not evident on the die (<0.15V, Figure 12a–d).
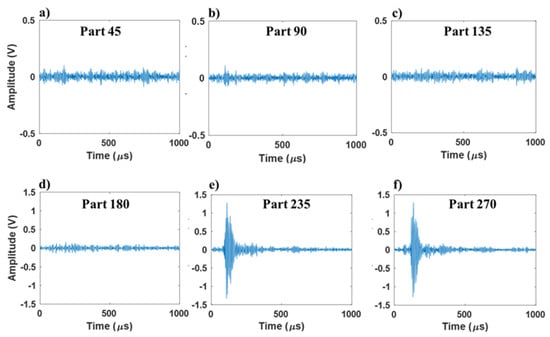
Figure 12.
Selected AE burst waveform of the stamping test segregated from parts (a) 45, (b) 90, (c) 135, (d) 180, (e) 235, and (f) 270 (Die 1). Note that the y-axis in (a–c) shows a smaller amplitude (V) range to allow the signal to be more easily seen due to the smaller amplitude signal.
3.1.3. Frequency Characteristics of the AE Burst Waveform during Wear Progression (Stamping Test)
To analyse the maximum power concentration of the AE burst waveform in the AE frequency range, the AE burst waveform (represented in Figure 12) was analysed using the Hilbert Huang Transform (HHT) [22], with the results shown in Figure 13. For the unworn tool, as shown in Figure 13a, the power of the AE burst waveform is distributed throughout the time span in the frequency range of 0.04–0.3 MHz. This AE frequency range is attributed to the plastic deformation of the sheet in the stamping process [15]. In Figure 13b, the maximum intensity of power distribution increases in the AE frequency range of 0.04–0.3 MHz (yellow colour in spectrogram). For parts 135 and 180, the power distribution occurs over a wide AE frequency range of 0–1 MHz and similar power distribution in the AE frequency range of 0–1 MHz is also observed for parts 235 and 280 (Figure 13c–f). From Figure 13c–f, the maximum power is dominant in the AE frequency range of 0.1–0.2 MHz.
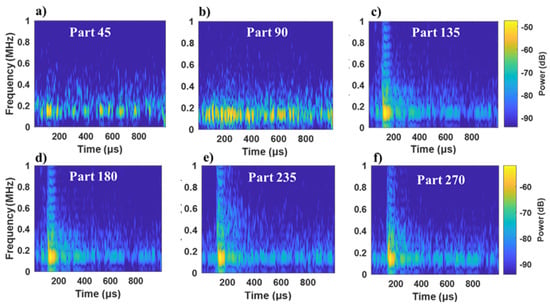
Figure 13.
Time-frequency representation (Hilbert Huang Transform—HHT) of the reconstructed AE burst waveform from the stamping tests for parts (a) 45, (b) 90, (c) 135, (d) 180, (e) 225, and (f) 270 (Die 1). Note that the legend in (a–c) shows a smaller power (dB) range to allow the signal to be more easily seen due to the smaller amplitude signal.
To quantitatively study the dominant AE frequency range, the AE bandpower was determined for each frequency range. Figure 14 represents the AE bandpower in the frequency intervals of 0–0.6 MHz for Die 1 and Die 2. The maximum AE band power is concentrated in the AE frequency interval of 0.1–0.2 MHz for all stamped parts. With an increase in the number of stamped parts (and hence increased die wear), the AE band power increases in the AE frequency range of 0–0.1, 0.1–0.2, and 0.2–0.3 MHz. From Figure 14, it can be seen that the bandpower range where the maximum AE signal occurs (0.1–0.2 MHz) is similar for the unworn die and the completely worn die. This indicates for the worn tool, the bandpower increases in the same AE frequency interval as that of the unworn tool. For the worn tool, the increase in the bandpower in the AE frequency range of 0.1–0.3 MHz is due to presence of resonant/burst components [13,15].
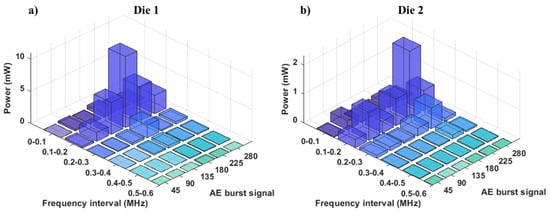
Figure 14.
Bandpower of the reconstructed AE burst waveform for the stamping tests for (a) Die 1 and (b) Die 2.
In addition to the bandpower, the characteristics of the AE burst waveform related to the galling wear was investigated by examining the frequency-magnitude distribution of the AE burst signals obtained at regular intervals from parts 1 to 600 (see Figure 15). For all the stamped parts (worn and unworn tools), the signal is dominant in the AE frequency range of 0.1–0.2 MHz (Figure 15). However, as the number of stamped parts increases, the magnitude of the frequency peak increases (Figure 15). The onset of stamping tool wear can be identified from the high magnitude observed for the frequency peak for part 225 for Die 1 and part 180 for Die 2. From Figure 15, the magnitude of the frequency peak for the worn parts is higher compared to the magnitude of the frequency peak for the unworn parts. From Figure 15, it is also evident that the magnitude of the frequency peak shifts towards the lower frequency range of 0.1 MHz from 0.2 MHz. Therefore, it is possible to identify the unworn and worn state of the tool using the frequency characteristics.
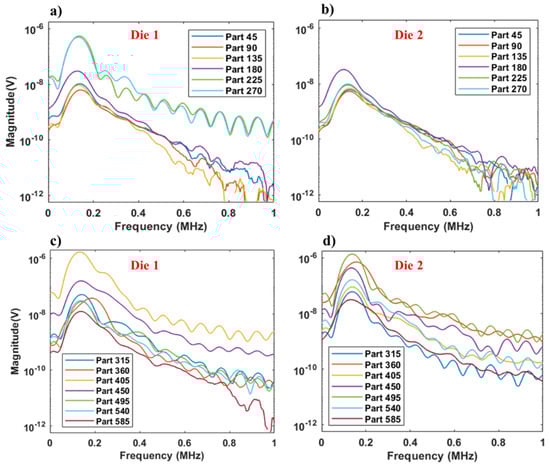
Figure 15.
Frequency-magnitude distribution of the AE burst signals for the stamped parts of 45–270 for (a) Die 1 and (b) Die 2; and for the stamped parts of 315–585 for (c) Die 1 and (d) Die 2. Note that, due to small decimal values in the y-axis, a log scale was used in the plots for better clarity.
To determine the mean-frequency of the unworn and worn tool, the mean-frequency of the AE burst waveform was calculated for a large number of stamped parts. Figure 16 represents the AE mean-frequency of the reconstructed continuous AE signal and the AE burst waveform of the stamping test. The AE mean-frequency trends for the AE burst waveforms are in general agreement with AE mean-frequency investigated for the continuous AE signal investigated in our previous work [15]. For the mean-frequency for both of the continuous and burst AE signals, it is evident that when an increase in the profile depth wear feature was observed, the mean frequency is significantly reduced. However, from part 180 for Die 1 and Die 2, the AE burst waveform shows a change in the AE mean-frequency prior to the change in the AE mean-frequency of the entire continuous AE signal. This is likely due to the resonant frequency components associated with the continuous AE data causing higher AE mean-frequency for the continuous AE signal [22]. The AE mean-frequency for all the stamped parts is observed to be in the frequency range of 0.13–0.23 MHz. From the mean-frequency of the AE burst waveform, it is possible to identify unworn and worn parts. For example, for Die 1 and Die 2, the AE mean frequency for the unworn parts is in the frequency range of 0.19–0.23 MHz and the AE mean-frequency for the worn parts is in the frequency range of 0.13–0.18 MHz.
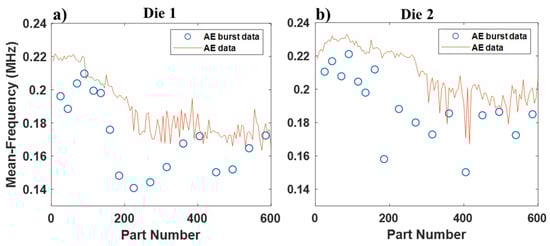
Figure 16.
AE mean-frequency of the reconstructed continuous AE and AE burst waveform for (a) Die 1 and (b) Die 2.
3.2. Scratch Test Analysis
The AE burst waveform from the scratch test of Dp 0.22 is used for the AE frequency analysis in this section. Similarly, the high resolution profilometer images of the scratch of Dp 0.22 is used to correlate with the frequency characteristics of the AE burst waveform. To show the repeatability of this study, the AE burst waveform from the scratch test of Dp 0.26 is used.
3.2.1. Profilometry Study of Scratch Test Workpiece and Tool
To correlate the source of the AE burst waveform with a specific wear mechanism in the scratch test, surface examination of the workpiece was conducted. In this study, initially only ploughing wear was observed on the scratch (Figure 17a). This was followed by cutting, where fracture was visible at the edges/ridges of the scratch (Figure 17a–c). Finally, as the sliding distance was increased, then fracture was observed at the centre of scratch surface at the bottom of the groove (Figure 17c–f). The transition of wear mechanism observed in this study (i.e., from ploughing to cutting at the edges to fracture at the centre), follows the general framework of abrasive wear given by Hokkirigawa et al. [19] and Rooij et al. [30]. From Figure 17c, it is evident that the fracture initiates at the centre of the scratch. This initiation of fracture indicates the transition of the cutting at the edges wear mode to the fracture at the centre mode. In work done by Shanbhag et al. [15], fracture at the centre scratch is observed only when galling is observed on the tool (Figure 17g). In sheet metal forming, the final wear stage of galling leads to severe scratching of the sheet material [6,30].
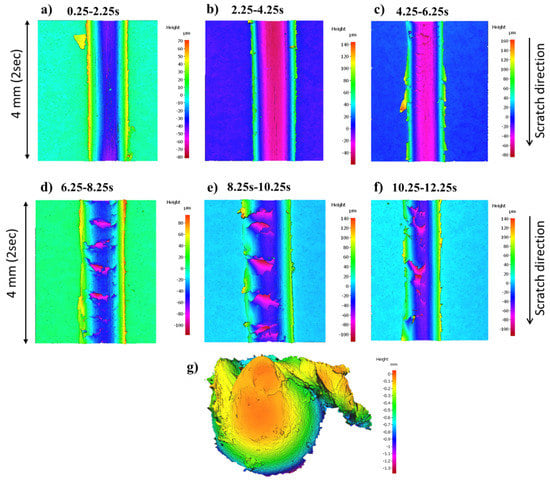
Figure 17.
Profilometer images of the scratch test performed at Dp 0.22, (a–f) represent profilometer images taken along the direction of scratch. (g) The profilometer image of the worn tool obtained at the end of the test.
3.2.2. AE Burst Waveform from Scratch Test
The AE burst waveform in the scratch test was not observed within the first 4 s of the scratch test (Figure 18a,b). The AE waveform represented in Figure 18a,b, corresponds to the area represented in Figure 17a,b. The AE burst waveform was only observed from 6 s onwards. The AE burst waveform in Figure 18c–f corresponds to the area where fracture was observed at the centre of the scratch (see Figure 17c–f). In Figure 18f, the maximum amplitude of the AE burst signal reduces when compared to that of Figure 18d,e. This is mainly attributed to the dependency of the AE amplitude with the intensity of galling severity on the tool or intensity of fracture observed in the centre of the scratch [9]. From these observations, it can be confirmed that the AE burst waveform is only observed when fracture is observed at the centre of scratch [9,10].
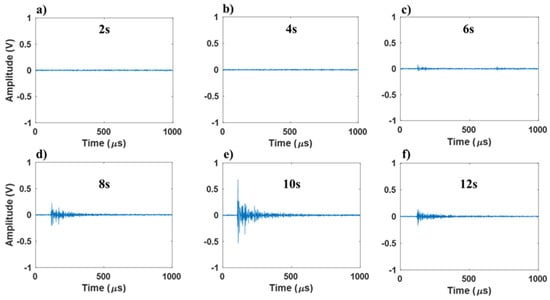
Figure 18.
AE burst waveform segregated from the scratch test at various instances: (a) 2s, (b) 4s, (c) 6s, (d) 8s, (e) 10s, and (f) 12s (Dp = 0.22).
3.2.3. Frequency Characteristics of the AE Burst Waveform During Wear Progression (Scratch Test)
The AE burst waveform represented in Figure 18 is analysed using the HHT technique in this section to analyse where the maximum power concentration occurs in the frequency range. As continuous AE signals were not observed for the scratch test until 4 s (Figure 9a), therefore the AE power distribution is not observed in the time frequency representation (Figure 19a,b). This highlights that, for this sensor setup, the AE signal is only observed when the tool is worn or when cutting/fracture wear modes are present. In Figure 19c–f, the AE power at various intensities is observed to be in the AE frequency range of 0.05–0.1 MHz. From Figure 19e, the maximum power intensity is observed to be in the AE frequency range of 0.02–0.5 MHz. The difference in the AE power concentration in Figure 19f, compared to that of the Figure 19c–e is due to the difference in the intensity of abrasive wear events due to galling wear [9,27].
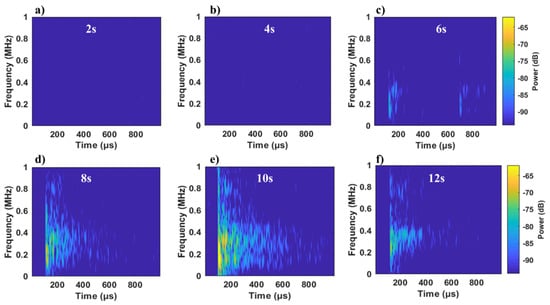
Figure 19.
Time-frequency representation (HHT) of the reconstructed AE burst waveform from the scratch test at (a) 2s, (b) 4s, (c) 6s, (d) 8s, (e) 10s, and (f) 12s. (Dp = 0.22).
To quantitatively study the dominant AE frequency range, the AE bandpower and frequency-magnitude study was performed. The AE bandpower from 0 to 4 s is negligible throughout the AE frequency range for Dp of 0.22 and 0.26 (Figure 20a,b). From 6 s for Dp 0.22 and 0.26, the AE bandpower increases in the AE frequency range of 0.1–0.5 MHz. The bandpower is high in the AE frequency range of 0.1–0.5 MHz at 10 s for Dp 0.22 and at 12 s for Dp 0.26. As mentioned above, this is mainly due to the intensity of abrasive wear events due to the galling wear [9,27].
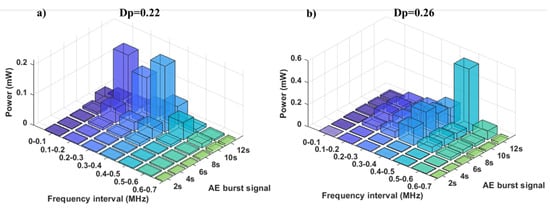
Figure 20.
Band power of the reconstructed AE burst waveform for the scratch tests with Dp of (a) 0.22 and (b) 0.26.
Figure 21 represents the frequency-magnitude graph of the AE burst waveforms from the scratch test. For the entire scratch duration, the information related to the non-galling and galling wear is dominant in the AE frequency range of 0.1–0.5 MHz (Figure 21a,b). The high magnitude of the frequency peak observed at 10 and 9 s for Dp 0.22 and 0.26 (Figure 21c,d), is due to the high intensity abrasive wear events on the workpiece due to the galling wear [9,27]. In Figure 21a,b, the increase in the magnitude of the frequency peak from 6 s for Dp 0.22 and from 5 s for Dp 0.26, indicate the onset of galling wear initiation. From Figure 21, the magnitude of the frequency peak for the galling is higher compared to the magnitude of the frequency peak for the non-galling wear. From Figure 21c,d), it is also evident that the magnitude of the frequency peak shifts towards the lower frequency range of 0.1–0.2 MHz. Therefore, it is possible to identify non-galling and galling conditions of the tool using the frequency characteristics.
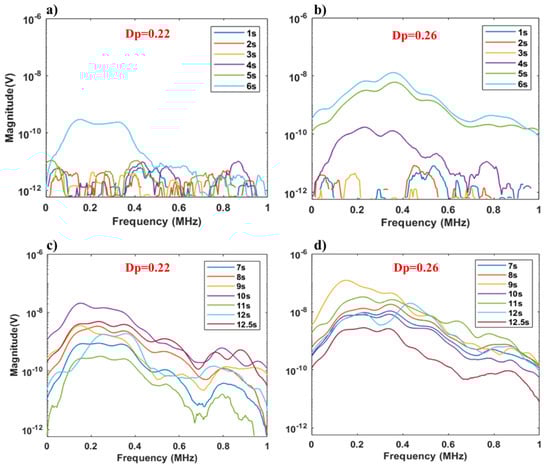
Figure 21.
Frequency-magnitude distribution of the AE burst signals from 1 to 6 s for Dp (a) 0.22 and (b) 0.26; and for 7–12.5 s for Dp (c) 0.22 and (d) 0.26. Note that, due to small decimal values in the y-axis, a log scale was used in the plots for better clarity.
The AE mean-frequency was analysed for the AE burst waveform from the scratch test to study non-galling and galling conditions of the tool. Similar to the stamping tests, with the increase in galling wear severity, the AE mean-frequency substantially reduces here (for both Dp of 0.22 and 0.26). The AE mean-frequency of the galling wear initiation (0.4 MHz) for Dp 0.22 and 0.26 is lower than that of AE mean-frequency due to no wear (0.5 MHz). With the increase in galling wear severity, the AE mean-frequency reduces to 0.2 MHz. In the previous studies by Shanbhag et al. [5,11], the change in AE mean-frequency trend was only observed when galling wear was observed on the tool. The ability of the AE mean-frequency to identify the non-galling and galling conditions (Figure 22) indicates that the AE mean-frequency can be used for the AE burst waveform analysis.
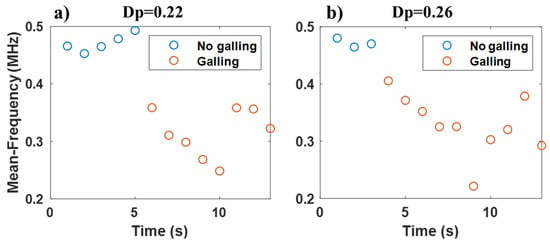
Figure 22.
Mean-frequency of the reconstructed AE burst waveform for the scratch tests for Dp of (a) 0.22 and (b) 0.26.
3.3. Discussion
3.3.1. Performance of the AE mean-frequency feature with the profile depth wear feature for stamping tests
Figure 23 represents the comparison of performance of the AE mean-frequency with the profile depth wear feature. The profile depth wear feature is consistent until 220 stamped parts for Die 1 and 280 stamped parts for Die 2. Qualitatively correlating the profile depth with the microscopic images of stamped parts (Figure 11), the profile depth feature increases more than 15 µm when the fracture is observed on the stamped parts (as highlighted in Figure 11e). When the minor scratches are observed on the stamped parts, these are not clearly indicated from the visual observation through our eyes and through profile depth feature. In addition, no clear change was observed from the AE burst waveform as shown in Figure 12. This may be due to the continuous AE signal of the stamping process which consisted of high power events of low amplitude related to the minor scratches (Figure 12b,c) [22]. However, these high power events of low amplitude can be clearly identified from the AE mean-frequency feature of the burst waveform that indicates prior wear initiation compared to that of profile depth (Figure 23a,b).
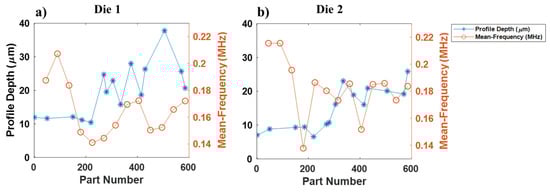
Figure 23.
Performance of the AE mean-frequency feature with the profile depth wear feature for the stamping tests with (a) Die 1 and (b) Die 2.
3.3.2. Performance of the AE Mean-Frequency Feature with the Profile Depth Wear Feature for Stamping Tests
Figure 24 represents the comparison of performance of the AE mean-frequency with the profile depth wear feature. The profile depth wear feature is consistent until 5 s for Dp 0.22 and 4 s for Dp 26. Qualitatively correlating the profile depth with the microscopic images of scratch parts (Figure 17), the profile depth feature only increases when the fracture is observed in the centre of scratch. Therefore, the profile depth greater than 15 µm that was observed in the stamping process is due to the fracture wear. In addition, no clear change was observed from the AE burst waveform until 5 s for Dp 0.22 as shown in Figure 18. In the work done by Shanbhag et al. [5], the AE burst waveform was only observed when the fracture was observed on the centre of scratch and galling wear was observed on the indenter. From Figure 5 and Figure 24, the AE mean-frequency feature in the scratch test only reduces when the profile depth variation starts at the centre of scratch due to galling wear. Therefore, it can be concluded that the mean-frequency feature can be used to indicate onset of galling wear.
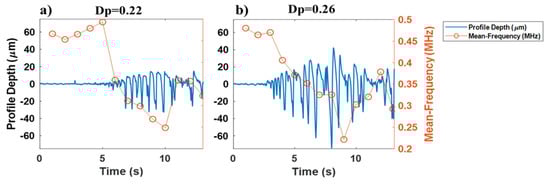
Figure 24.
Performance of the AE mean-frequency feature with the profile depth wear feature for the scratch tests for Dp (a) 0.22 and (b) 0.26.
3.3.3. AE Frequency Characteristics of the Stamping Tests
In Figure 13, Figure 14, Figure 15 and Figure 16, an attempt was made to understand the frequency characteristics of the stamping tool wear. In Figure 13b, a clear change in power intensity was observed compared to that of Figure 13a. This difference between parts 45 and 90 was clearly not visible from the AE burst waveform (represented in Figure 12a,b). This indicates that the AE frequency characteristics can clearly indicate the initial minor scratches taking place on the workpiece (Figure 11b) compared to the AE time domain signal. This behaviour of the AE frequency characteristics can also be further confirmed from the AE amplitude for parts 135 and 180 (Figure 12c,d) where a clear change was not visible; but in comparison, the time-frequency representation indicated a clear change in the frequency characteristics of these two parts (Figure 13c,d). This is mainly because the high intensity events associated with the wear progression that occur at the low AE frequency range, coincide with the AE frequency range of the sheet deformation and friction in the stamping process [5,1330]. This can be validated from the AE bandpower analysis of the AE burst waveform (Figure 14), where the maximum bandpower is consistently in the lower AE frequency range of 0.1–0.2 MHz when the die are not worn and even as the wear increases (Figure 14a,b). Similar behaviour of the frequency characteristics was also observed in the magnitude-frequency and mean-frequency plots, where the peak values of the magnitude-frequency plot and mean-frequency was in the AE frequency range of 0.1–0.2 MHz (Figure 15a,b and Figure 16a,b). Therefore, we can conclude that the important galling wear information of the stamping tool occurs in the AE frequency range of 0.1–0.2 MHz.
3.3.4. AE Frequency Characteristics of the Scratch Tests
In Figure 19, Figure 20, Figure 21 and Figure 22 an attempt was made to understand the frequency characteristics of the AE burst waveform related to the galling wear. From Figure 18, Figure 19, Figure 20 the power concentration is only observed when the AE burst waveform is observed. The presence of AE burst waveforms corresponds to the presence of fracture events on the workpiece (Figure 17 and Figure 18). In the work done by Shanbhag et al. [5], we have noted that the fracture events on the workpiece are only observed when the galling is observed on the tool. Therefore, the bandpower observed in the AE frequency range of 0.1–0.5 MHz (Figure 20) is attributed to the fracture on the workpiece and galling on the tool. The difference in the bandpower for the stamping test and scratch test is due to the different contact conditions and due to absence of the continuous AE signal in the scratch test [10]. The galling wear information in the bandpower AE frequency range of 0.1–0.2 MHz is observed to be similar for the scratch and stamping tests (Figure 14 and Figure 20). This can also be confirmed from the magnitude-frequency plot for 10 s for Dp 0.22 and 9 s for Dp 0.26 (Figure 21c,d), where the magnitude of the frequency plot is in the AE frequency range of 0.1–0.2 MHz, and from the mean-frequency plot, where the mean-frequency reduces towards 0.2 MHz for the worn tool (Figure 22).
3.3.5. Correlation of the AE and Galling Wear Characteristics (for Both Tests Types)
In the literature, Hase et al. [10] observed adhesive wear in the AE frequency region of 1–1.5 MHz. Sindi et al. [9] identified galling wear in the AE frequency region of 0.1975–0.375 MHz. The difference in the AE frequency interval between the work performed by Hase et al. [10] and Sindi et al. [9] may be due to a number of factors that influence the AE frequency intervals as explained by Hase et al. [10]. However, in this paper, an attempt was made to determine the frequency characteristics from the AE burst waveform that can indicate the onset of galling wear, irrespective of the experimental processes examined.
Table 2 represents the summary of the AE and galling wear features from the stamping and scratch tests. The first correlation observed between the galling wear measurements from the stamping and scratch tests is the profile depth wear feature. The AE burst waveform is only observed when the profile depth increased to more than 15 µm (Figure 23 and Figure 24). The increase in profile depth greater than 15 µm indicates the fracture on the workpiece (Figure 11 and Figure 17). The generation of the AE burst waveform is due to fracture on the workpiece as a result of the lump hardening on the indenter [5]. The second correlation observed between the behaviour of the galling wear during the stamping and scratch tests is the AE bandpower. The bandpower of the AE burst signals in the AE frequency range of 0.1–0.2 MHz is observed to be similar for the stamping and scratch tests. The bandpower in this range increases with the increase in galling wear severity (Figure 14 and Figure 20). This can also be confirmed from the frequency-magnitude plot for the worn parts, where the frequency peak is in the AE frequency range of 0.1–0.2 MHz (Figure 15 and Figure 21). This frequency-magnitude distribution is the third correlation observed between the stamping and scratch tests when studying the galling wear. Finally, the similarity in the trend observed for the AE mean-frequency burst waveform during the galling wear progression in the stamping and scratch tests indicates that it is possible to study the onset of galling wear by analysing the AE mean-frequency information. The proposed AE features in Table 2 that occur across the two processes (stamping and scratch tests) shows the consistency of this behaviour and demonstrates that it can be used to build a condition monitoring system to diagnose the galling wear in the stamping process (and possibly in similar processes).
Table 2.
Summary of AE frequency and wear characteristics.
4. Conclusions
This paper aimed to understand the frequency characteristics of the AE signals and how these changed due to the severity of the galling wear. In particular, the study was focussed on understanding this behaviour that is independent of the particular process being examined. For this reason, the data from both the stamping wear tests and scratch tests were analysed and compared, so that a general conclusion could be drawn. Based on the results and discussion in this paper, the following conclusions are made:
- The AE burst waveform related to galling wear occurs only when the profile depth feature increases more than 15 µm. The increase in the profile depth feature greater than 15 µm indicated fracture on the workpiece due to the galling wear.
- With increase in galling wear severity, the amplitude of the AE burst waveform increased. The AE frequency information related to the fracture on the workpiece due to the galling wear was observed to be in the AE frequency range of 0.1–0.2 MHz for the stamping and scratch tests.
- The AE mean-frequency of the AE burst waveform indicated a prior change in the AE mean-frequency trend compared to the AE mean-frequency of the continuous AE waveform in the stamping test.
- The AE mean-frequency of the AE burst waveform for the worn tool is reduced compared to that of the unworn tool for both processes. This similarity in the trend observed in the AE mean-frequency feature for both processes indicates that it can be used for condition monitoring, to identify the non-galling and galling conditions.
Author Contributions
V.V.S., B.F.R., M.P.P. contributed in developing experimental methodology, data analysis and writing this manuscript. All authors have read and agreed to the published version of the manuscript.
Funding
This research project received no external funding
Conflicts of Interest
The authors declare no conflict of interest
References
- Ubhayaratne, I.; Pereira, M.P.; Xiang, Y.; Rolfe, B.F. Audio signal analysis for tool wear monitoring in sheet metal stamping. Mech. Syst. Signal Process. 2017, 85, 809–826. [Google Scholar] [CrossRef]
- ASTM. Standard Terminology Relating to Wear and Erosion; ASTM G40-13; ASTM: West Conshohocken, PA, USA, 2013. [Google Scholar]
- Challen, J.M.; Oxley, P.L.B. An explanation of the different regimes of friction and wear using asperity deformation models. Wear 1979, 53, 229–243. [Google Scholar] [CrossRef]
- Pereira, M.P.; Yan, W.; Rolfe, B.F. Wear at the die radius in sheet metal stamping. Wear 2012, 274, 355–367. [Google Scholar] [CrossRef]
- Shanbhag, V.V.; Rolfe, B.F.; Arunachalam, N.; Pereira, M.P. Understanding the source of acoustic emission signals during the wear of stamping tools. IOP Conf. Ser. Mater. Sci. Eng. 2018. [CrossRef]
- Schedin, E. Galling mechanisms in sheet forming operations. Wear 1994, 179, 123–128. [Google Scholar] [CrossRef]
- Gåård, A.; Krakhmalev, P.V.; Bergström, J.; Hallbäck, N. Galling resistance and wear mechanisms-cold work tool materials sliding against carbon steel sheets. Tribol. Lett. 2007, 26, 67–72. [Google Scholar] [CrossRef]
- Karlsson, P.; Gåård, A.; Krakhmalev, P.; Bergström, J. Galling resistance and wear mechanisms for cold-work tool steels in lubricated sliding against high strength stainless steel sheets. Wear 2012, 286, 92–97. [Google Scholar] [CrossRef]
- Sindi, C.T.; Najafabadi, M.A.; Salehi, M. Tribological behavior of sheet metal forming process using acoustic emission characteristics. Tribol. Lett. 2013, 52, 67–79. [Google Scholar] [CrossRef]
- Hase, A.; Mishina, H.; Wada, M. Correlation between features of acoustic emission signals and mechanical wear mechanisms. Wear 2012, 292, 144–150. [Google Scholar] [CrossRef]
- Shanbhag, V.V.; Rolfe, B.F.; Griffin, J.M.; Arunachalam, N.; Pereira, M.P. Understanding galling wear initiation and progression using force and acoustic emissions sensors. Wear 2019, 436, 202991. [Google Scholar] [CrossRef]
- Ge, M.; Du, R.; Zhang, G.; Xu, Y. Fault diagnosis using support vector machine with an application in sheet metal stamping operations. Mech. Syst. Signal Process. 2004, 18, 143–159. [Google Scholar] [CrossRef]
- Bassiuny, A.M.; Li, X.; Du, R. Fault diagnosis of stamping process based on empirical mode decomposition and learning vector quantization. Int. J. Mach. Tools Manuf. 2007, 47, 2298–2306. [Google Scholar] [CrossRef]
- Skåre, T.; Krantz, F. Wear and frictional behaviour of high strength steel in stamping monitored by acoustic emission technique. Wear 2003, 255, 1471–1479. [Google Scholar] [CrossRef]
- Shanbhag, V.V.; Rolfe, B.F.; Arunachalam, N.; Pereira, M.P. Investigating galling wear behaviour in sheet metal stamping using acoustic emissions. Wear 2018, 414, 31–42. [Google Scholar] [CrossRef]
- Filippov, A.V.; Rubtsov, V.E.; Tarasov, S.Y. Acoustic emission study of surface deterioration in tribocontacting. Appl. Acoust. 2017, 117, 106–112. [Google Scholar] [CrossRef]
- Filippov, A.V.; Nikonov, A.Y.; Rubtsov, V.E.; Dmitriev, A.I.; Tarasov, S.Y. Vibration and acoustic emission monitoring the stability of peakless tool turning: Experiment and modeling. J. Mater. Process. Technol. 2017, 246, 224–234. [Google Scholar] [CrossRef]
- Filippov, A.V.; Tarasov, S.Y.; Fortuna, S.V.; Podgornykh, O.A.; Shamarin, N.N.; Rubtsov, V.E. Microstructural, mechanical and acoustic emission-assisted wear characterization of equal channel angular pressed (ECAP) low stacking fault energy brass. Tribol. Int. 2018, 123, 273–285. [Google Scholar] [CrossRef]
- Hokkirigawa, K.; Kato, K.; Li, Z.Z. The effect of hardness on the transition of the abrasive wear mechanism of steels. Wear 1988, 123, 241–251. [Google Scholar] [CrossRef]
- IF-MeasurementSuite 5.1. Available online: https://www.ita-polska.com.pl/upload/documents/IF-MeasureSuite_5.1_ProductInfo_EN1.pdf (accessed on 21 January 2017).
- Acoustic Emission Sensor Specifications. Available online: http://www.atgndt.com/wp-content/uploads/2016/01/vallen-ae-sensors.pdf (accessed on 10 February 2020).
- Peng, Z.K.; Peter, W.T.; Chu, F.L. A comparison study of improved Hilbert-Huang transform and wavelet transform: Application to fault diagnosis for rolling bearing. Mech. Syst. Signal Process. 2005, 19, 974–988. [Google Scholar] [CrossRef]
- Peng, Z.K.; Peter, W.T.; Chu, F.L. An improved Hilbert-Huang transform and its application in vibration signal analysis. J. Sound Vib. 2005, 286, 187–205. [Google Scholar] [CrossRef]
- Bandpower. Available online: https://au.mathworks.com/help/signal/ref/bandpower.html (accessed on 7 September 2019).
- Meanfreq. Available online: https://au.mathworks.com/help/signal/ref/meanfreq.html (accessed on 7 September 2019).
- Schedin, E.; Lehtinen, B. Galling mechanisms in lubricated systems: A study of sheet metal forming. Wear 1993, 170, 119–130. [Google Scholar] [CrossRef]
- Voss, B.M.; Pereira, M.P.; Rolfe, B.F.; Doolan, M.C. A new methodology for measuring galling wear severity in high strength steels. Wear 2017, 390, 334–345. [Google Scholar] [CrossRef]
- Gåård, A.; Krakhmalev, P.; Bergström, J. Wear mechanisms in deep drawing of carbon steel-correlation to laboratory testing. Tribotest 2008, 14, 1–9. [Google Scholar] [CrossRef]
- Li, X. A brief review: Acoustic emission method for tool wear monitoring during turning. Int. J. Mach. Tools Manuf. 2002, 42, 157–165. [Google Scholar] [CrossRef]
- de Rooij, M.B.; Schipper, D.J. Analysis of material transfer from a soft workpiece to a hard tool: Part I—Lump growth model. J. Tribol. 2001, 123, 469–473. [Google Scholar] [CrossRef]
© 2020 by the authors. Licensee MDPI, Basel, Switzerland. This article is an open access article distributed under the terms and conditions of the Creative Commons Attribution (CC BY) license (http://creativecommons.org/licenses/by/4.0/).