Abstract
Fourier Transform-Infrared (FT-IR) spectroscopy was used to analyze gasoline engine oil (SAE 5W20) samples that were exposed to seven different oxidation times (0 h, 24 h, 48 h, 72 h, 96 h, 120 h, and 144 h) to determine the best wavenumbers and wavenumber ranges for the discrimination of the oxidation times. The thermal oxidation process generated oil samples with varying total base number (TBN) levels. Each wavenumber (400–3900 cm−1) and wavenumber ranges identified from the literature and this study were statistically analyzed to determine which wavenumbers and wavenumber ranges could discriminate among all oxidation times. Linear regression was used with the best wavenumbers and wavenumber ranges to predict oxidation time.
1. Introduction
Oxidation is the primary driver of normal engine oil degradation [1] and a decreased lifespan [2]. Oxygen and heat accelerate oxidation [3]. Oxygen free radicals interact with hydrocarbons breaking down hydrocarbon molecules and forming acidic compounds [1,4,5,6] that cause corrosion and deposits on metal surfaces.
Additives added to base oil stock may constitute up to 30% (v/v) of engine oil [7]. Additives such as antioxidants and detergents retard the oxidation effect of engine oil becoming acidic. Antioxidants react with free radicals to form stable molecules instead of hydrocarbon breakdown [8]. Detergents provide a secondary defense against oxidation by neutralizing acidic compounds [9]. Once antioxidants and detergent additives are consumed, sludge forms [4] and oil viscosity increases [6].
The total base number (TBN) is one indicator of the useful life of engine oil. TBN is a measure of the reserve alkalinity of engine oil in units of mgKOH/g [10] and indicates the detergent content and ability to neutralize acidic compounds [5]. Engine oil would be rejected when TBN reaches 50% of fresh engine oil [11].
Methods for potential real-time measurement of antioxidants, alkalinity or acidity have included various sensors [2,12,13,14,15,16,17,18,19,20], terahertz time-domain spectroscopy [21], and Fourier-transform infrared spectroscopy (FT-IR) [1,22,23,24,25].
Several FT-IR wavenumbers and regions have been identified as related to engine oil oxidation (see Table 1) including 850 cm−1 [26], 900–1000 cm−1 [27], 930–1020 cm−1 [28], 950–1040 cm−1 [29], 960–1025 cm−1 [28], 990–1025 cm−1 [26] 1000 cm−1 [26], 1054 cm−1 [29], 1100–1200 cm−1 [30], 1116 cm−1 [29], 1120–1180 cm−1 [28], 1180 cm−1 [29], 1600–1650 cm−1 [28], 1600 cm−1 [29], 1630 cm−1 [28,30], 1650–1820 cm−1 [31], 1660–1710 cm−1 [28], 1660–1800 cm−1 [28], 1700–1750 cm−1 [30], 1700–1800 cm−1 [27,29], 1700 cm−1 [26,29], 1710 cm−1 [29], and 3400 cm−1 [26,27,29].

Table 1.
Summary of wavenumber ranges used in this study.
The purpose of this study was to take a fresh look at FT-IR for the discrimination and prediction of oxidation time using stastical criteria based on oil samples that were thermally oxidized for 0 h, 24 h, 48 h, 72 h, 96 h, 120 h, and 144 h.
2. Materials and Methods
2.1. Thermal Oxidation
A 4.73-L container of engine oil (Pennzoil, API SN, SAE 5W20) was obtained from the local market in Carbondale, IL, USA and was the source for all oil samples in this study. Gasoline automotive engines commonly use SAE 5W-20.
The engine oil was thermally oxidized using a reactor (model 4838, Parr Instrument Company, Moline, IL, USA; Figure 1) with a removable 1200 mL stainless steel cylinder, temperature controller, bolt-on cylinder head, thermocouple well, input port with dip tube, and exhaust port [21]. The oil temperature and airflow for thermal oxidation were set at 180 °C and 1 L/min, respectively, for the desired oxidation time [26,27,29]. The thermal oxidation began by pouring 500 mL of fresh oil from the 4.73 L container into the cylinder. The head was secured and heating was initiated. When the oil temperature reached about 150 °C, an electromagnetic air pump (AC0-002, Yuting, Zhoushan, Zhejiang, China) was started to provide 1 L/min of regulated (FL-2013 acrylic flow meter, Omega Engineering) airflow through the input port dip tube at the bottom of the oil cylinder with the corresponding airflow exhausted at the top of the cylinder. The oil temperature was increased to 180 °C over 1–1.5 h and then maintained at that level ±1 °C. Six fresh oil samples were each thermally oxidized for a different time period of 24 h, 48 h, 72 h, 96 h, 120 h, and 144 h. The 0 h sample was fresh engine oil. Eight ml of each sample were used for FT-IR analysis. A 100 ml portion of each of the thermally oxidized samples plus a fresh oil sample was sent to the Blackstone Laboratories (Fort Wayne, IN, USA) for analysis of TBN and viscosity at 40 °C, using ASTM standards that were modified for production.
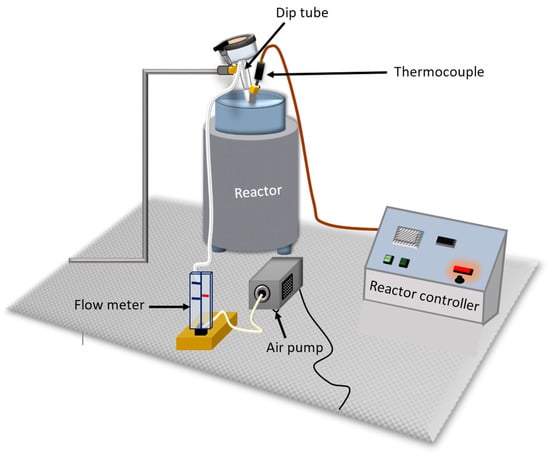
Figure 1.
Depiction of equipment used to oxidize fresh engine oil thermally.
2.2. FT-IR Analysis
The infrared spectra were recorded with an FT-IR spectrometer (Thermo-Nicolet Nexus 670/870, Nicolet Instrument Corporation, Madison, WI, USA) with a wavenumber range of 400 to 4000 cm−1. The purging of the system with dry air took place prior to each measurement of the background or sample to minimize the interference from atmospheric humidity. Before each sample measurement, a background measurement of KBr windows alone was performed. Based on the Beer-Lambert Law, a linear relationship exists between path length and absorbance and increasing path length improves absorption sensitivity. Prior to sampling for this study, spacers of varied thicknesses (0.02, 0.03, 0.05, 0.10, 0.20, 0.50, 0.88, and 1.80 mm) were used to increase the optical path length of the sample. Ultimately, the 0.88 mm spacer was selected for sampling to better differentiate the oxidation times by increasing the absorption sensitivity and minimizing the oversaturation of the signal across most of the spectrum.
KBr windows were cleaned using methylene chloride before collecting background spectra. Then 320 µL of each oil sample was pipetted from the horizontal and vertical center of the sample vessel and trapped between two KBr windows of 25 mm diameter housed within a polytetrafluoroethylene ring. The oil sample needed to fill the space within the windows without trapping an air bubble that would be in the path of the transmitted light. The first window with a polytetrafluoroethylene spacer would already be in place when the oil was pipetted onto the window’s surface; then the covering window was placed on top. The housing ring had a small region between part of the window edge and the ring itself to allow air to escape as the second window was placed on the first. The oil was successfully trapped without air bubbles and oriented upright within the sample holder with a locking ring in the FT-IR spectrometer.
Spectra were recorded four consecutive times for each 320 µL oil sample. The process was repeated for three replications of each sample of oxidized oil.
2.3. Data Preprocessing and Analysis
Prior to statistical analysis, the baseline of each whole spectrum was adjusted to minimize the effects of the baseline shifting between FT-IR measurements. Minor baseline corrections were performed by the auto-baseline correction function of the OMNIC software included with the Nicolet FT-IR. A density normalization factor was not applied as the density variations among samples were less than the inherent noise of the absorption signal within a single sample. The four measurements of each sample replication were averaged prior to analysis of variance (ANOVA; α = 0.05). Fisher’s least significant difference (LSD) and Tukey’s highly significant difference (HSD) were used to determine differences among oxidation times and to select wavenumbers with significant differences among each oxidation time. Wavenumber ranges identified in prior research or of interest from this study (see Table 1) were similarly subjected to ANOVA and Fisher’s LSD. In some cases, researchers had specified using either the area or peak of a given wavenumber range, but in other cases it was unclear. In this study, the integrated area of wavenumber ranges was used for analysis based on ASTM E2412-10 [28]. When wavenumber ranges had statistically significant differences among all of the oxidation times, but did not appear to have definite peaks that could be attributed to molecular bonds, a second derivative analysis was performed to determine if hidden peaks existed in the data. Regression analysis was used with all 12 FT-IR measurements of each oxidation time to estimate the predictability of oxidation time based on absorbance.
3. Results and Discussion
The TBN and kinematic viscosity results of commercial engine oil analysis from each oxidation time (including 0 h) are summarized in Table 2. TBN decreased with oxidation time from 7.2 for fresh oil (0 h) to 1.8 after 144 h. The engine oil reached the reject level of TBN at or below 50% of fresh engine oil [11] after 120 h of oxidation. These commercial lab results indicate that the thermal oxidation method was successful in generating oil samples with various levels of oxidation.
Table 2.
Total base number (TBN) and viscosity results from commercial engine oil analysis for gasoline engine oil with different oxidation times.
3.1. Selection of Wavenumbers and Wavenumber Ranges
The mean absorbance for each oxidation time is depicted in Figure 2. There were significant differences (F(6,14), p < 0.05) among oxidation times at each wavenumber for the following ranges of wavenumbers: 442–457 cm−1, 517–696 cm−1, 795–879 cm−1, 897–1288 cm−1, 1500–1545 cm−1, 1552–2216 cm−1, 2823 cm−1, 2827–2831 cm−1, 3024 cm−1, 3068–3570 cm−1, and 3575–4000 cm−1. In most of these ranges, only some of the oxidation times could be distinguished from some of the others and the mean absorbance did not always increase or decrease with the oxidation time.
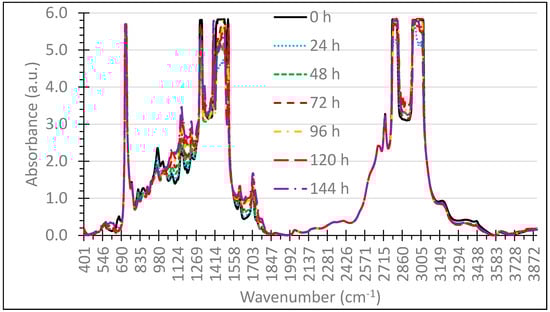
Figure 2.
Mean absorbance values from Fourier transform-infrared spectroscopy (FT-IR) for each oxidation time across the entire range of 400–3900 cm−1 wavenumbers.
The number of wavenumbers of interest was reduced by identifying wavenumbers in which each oxidation time was significantly different from all of the other oxidation times based on Fisher’s LSD or Tukey’s HSD. All wavenumbers meeting this criterion had absorbance increasing with each increase in oxidation time. There were no occurrences of absorbance decreasing with increased oxidation time that met the criteria of significance among each oxidation time. The resulting wavenumbers of interest were 1065–1074 cm−1, 1078–1144 cm−1, 1178–1219 cm−1, 1572–1593 cm−1, 1612–1682 cm−1, and 1711–1730 cm−1. Narrower wavenumber ranges of interest based on Tukey’s HSD were 1120–1140 cm−1, 1614–1678 cm−1, and 1714–1726 cm−1. These wavenumbers all had significant differences among all oxidation times.
Wavenumber ranges from 830–1075 cm−1 (see Figure 3) were typically associated with antioxidants [26,27,29], ZDDP [28], antiwear [28], and sulfonate detergent [29] additives. Although there were no wavenumbers below 1065 cm−1 in this region where all oxidation times were significantly different from the others, an interesting inversion was observed in the absorbance spectra. Below wavenumber 1030 cm−1, the shortest oxidation time had the highest mean absorbance, but the order inverted by wavenumber 1047 cm−1, with the absorbance increasing with oxidation time. In the 830–868 cm−1 range, 0 h had a significantly higher absorbance than the other times and in the 852–860 cm−1 range 0 h, 24 h, and 48 h were significantly different from all other oxidation times. In the 947–1016 cm−1 range, 0 h had a significantly higher absorbance than the other times and in the narrower 955–1007 cm−1 range, 24 h was significantly different from all other oxidation times. Furthermore, in the further restrictive 966–980 cm−1 range, 48 h was also significantly different from all other oxidation times. The lack of significant differences among the longer oxidation times was suspected to indicate that the oxidation process had severely depleted antioxidants in the engine oil after 48 h. Even when antioxidants were depleted, detergent additives were still present to neutralize acidic compounds caused by oxidation, based on TBN levels (see Table 2).
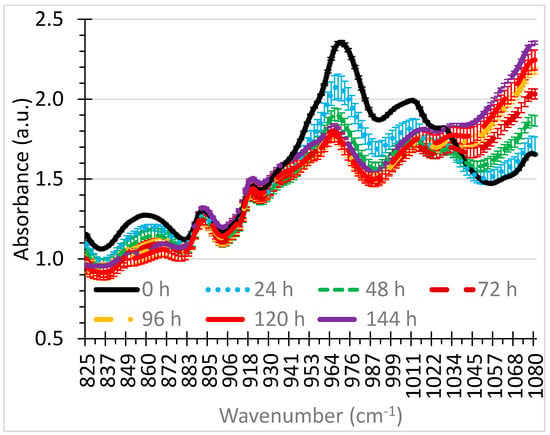
Figure 3.
Absorbance means of seven oxidation times, with error bars of 95% confidence intervals, across the 825–1080 cm−1 wavenumber range.
The change in FT-IR results between shorter and longer oxidation times was similar to prior studies [26] but the difference was noted in a relatively narrow range of wavenumbers in this study.
The absorbance of wavenumbers in the range of 1061–1234 cm−1 were depicted in Figure 4 and typically relate to sulfur oxides, viscosity improvers, sulfonate detergents, and sulfate by-products [28,29,30]. Absorbance increased with oxidation time across this entire range and three of the ranges (1065–1074 cm−1, 1078–1144 cm−1, and 1178–1219 cm−1) that met the criteria for significant differences among all oxidation times were included. The wavenumbers in the region 1146–1176 cm−1 that included the relative peak near wavenumber 1153 cm−1 were unable to distinguish all oxidation times. The 95% confidence intervals of 0 h and 24 h and 96 h and 120 h can be seen to overlap in Figure 4, indicating that the relative peak is not as good at discriminating oxidation times as the areas on each side of the peak.
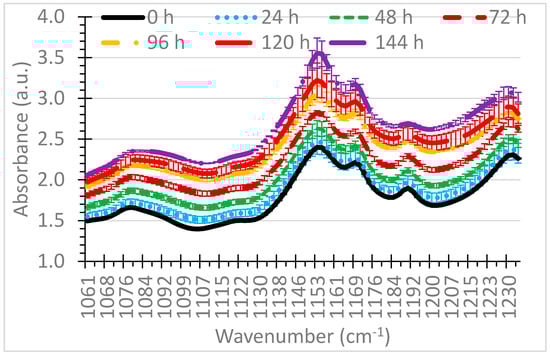
Figure 4.
Absorbance means of seven oxidation times, with error bars of 95% confidence intervals, across the 1061–1234 cm−1 wavenumber range that includes several ranges of significance among each of the oxidation times.
The absorbance for wavenumbers in the range of 1570–1734 cm−1 are charted in Figure 5. This region includes nitration, olefinic absorption, carbonyl compounds, and oxidation [26,27,28,29,30,31].
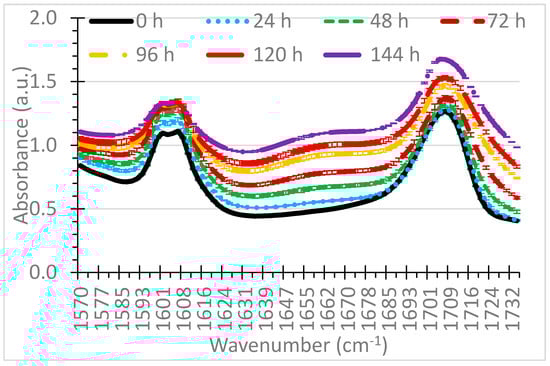
Figure 5.
Absorbance means of seven oxidation times, with error bars of 95% confidence intervals, across the 1570–1734 cm−1 wavenumber range that includes several ranges of significance among each of the oxidation times.
The absorbance generally increased with oxidation time across this entire region and three ranges (1572–1593 cm−1, 1612–1682 cm−1, and 1711–1730 cm−1) met the criteria for significant differences among all oxidation times. Similar to Figure 4, the relative peaks centered near 1605 cm−1 and 1705 cm−1 wavenumbers were excluded from the ranges with significant differences among all oxidation times. The 1612–1682 cm−1 region between peaks was of particular interest due to the clear separation of 95% confidence interval bars (see Figure 5).
Areas of wavenumber ranges identified in literature and this study (see Table 1) were also analyzed similarly to the individual wavenumbers. Each of the areas of the wavenumber ranges had highly significant differences (F(6,14), p < 0.0001) among oxidation times. Based on Fisher’s LSD only a few ranges had significant differences among each oxidation time. These ranges were area of 1065–1074 cm−1, 1078–1144 cm−1, 1100–1200 cm−1, 1120–1140 cm−1, 1178–1219 cm−1, 1572–1593 cm−1, 1580–1680 cm−1, 1600–1650 cm−1, 1612–1682 cm−1, 1614–1678 cm−1, 1630–1765 cm−1, 1660–1710 cm−1, 1711–1730 cm−1, and 1714–1726 cm−1. These ranges can be seen in Figure 4 and Figure 5. Other wavenumber ranges (1650–1820 cm−1, 1660–1800 cm−1, 1670–1800 cm−1, 1685–1725 cm−1, 1700–1750 cm−1, and 1700–1800 cm−1) had significant differences among all oxidation times, except for 0 h and 24 h.
3.2. Predicting Oxidation Time
Linear regression was applied to each of the selected individual wavenumbers to predict the oxidation time based on absorbance (see Figure 6). Each of the models was a strong fit with R2 > 0.95. For a single wavenumber, the best model was at 1624 cm−1 with R2 = 0.994 and root mean square error (RMSE) = 3.70. RMSE units were hours between oxidation times. The wavenumber ranges with significant differences among each oxidation time also produced strong models with R2 > 0.97 (see Table 3). The area of the range 1614–1678 cm−1 produced the best fit with R2 = 0.993 and RMSE = 4.13 (see Figure 7). A narrower range of 1622–1628 cm−1 improved the model to R2 = 0.994 and RMSE = 3.74, which provided a narrow area instead of relying on a value at a single wavenumber of 1624 cm−1. While all models were very strong, the wavenumbers with the best linear models were in the nitration region [28].
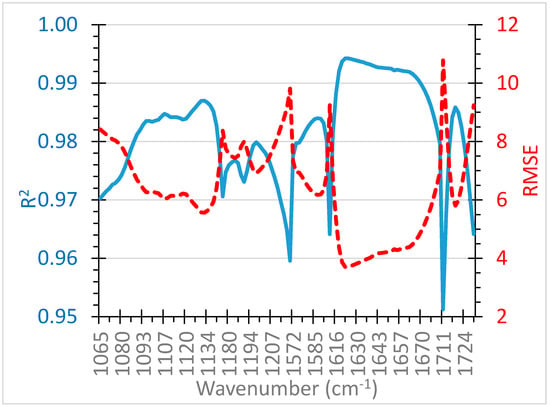
Figure 6.
Linear regression model fit metrics of absorbance of each selected wavenumber in predicting oxidation time.
Table 3.
Summary of relative performance of linear it for wavenumber ranges used in this study.
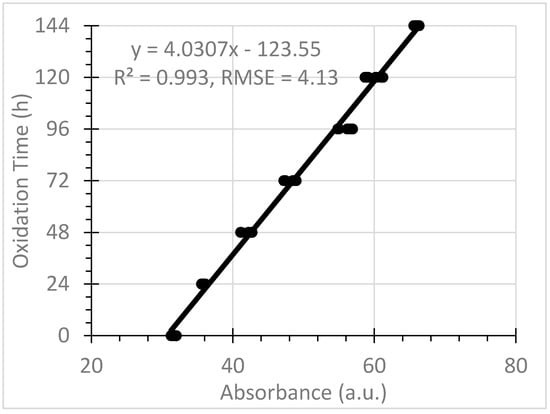
Figure 7.
Linear model of absorbance of area of 1614–1678 cm−1 predicting oxidation time.
Curiously, the wavenumber ranges generating the best linear models did not appear to have definitive peaks associated with them that one could attribute to molecular bonds. Figure 8 illustrates those ranges within the 1610–1720 cm−1 wavenumbers with second derivatives, which were used to reveal the possible origins of this distinctive separation of all oxidative levels. The region in question did have potentially unforeseen peak formations and changes with increased oxidation within Figure 8. As seen in the original absorbance data, there is a broad, yet subtle rise developing between 1630 and 1680 cm−1 that also shows up in the noisy second derivative in that section. At either edge of this formation, the oxidation times of 96 h, 120 h, and 144 h yielded noticeable differences from all other oxidation levels, especially with the second derivative data. From approximately 1620 to 1625 cm−1, the separation and concavity changes suggest nascent peak formation in the top three levels of oxidation. Perhaps even more drastically, these three oxidative levels are seen in the second derivative data with a decreasing ~1710 cm−1 peak and a strongly developing ~1703 cm−1 peak in its place. Hydrogen bonding interactions with a protonated carboxylic group may be responsible for a red shifting in the frequency [32].
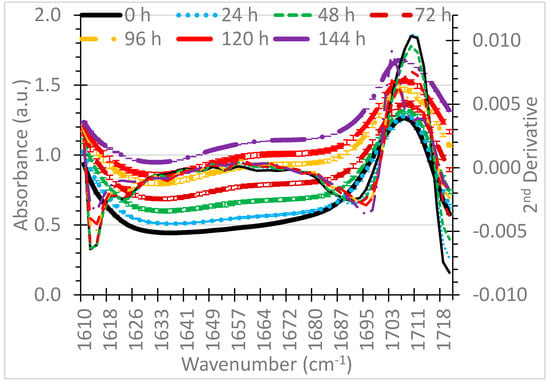
Figure 8.
Absorbance means of seven oxidation times, with error bars of 95% confidence intervals, across the 1610–1700 cm−1 wavenumber range that included the wavenumber and range with the best linear regression model, with 2nd derivatives (multiplied by −1) indicated by thinner lines.
While no definitive bond formation in the data could be attributed to the broadest section within that range, this region is known for C=C and C=O bonds. As subtle changes occur in the carbon chains, the superposition of a number of these bonds may be partially responsible for such clear distinction between all oxidation levels at the broad region. Besides the possible nascent peak formations and conjugations taking place in this section, a more striking clue of changes in C=C bonds is evident from 1620 to 1625 cm−1 in increasing order for the three longest durations of oxidation with obvious changes in concavity. Thermal pyrolysis may be breaking the carbon-hydrogen chains down into various units prior to oxidation into different carbonyls.
At the other end of this region, around 1710 cm−1, a C=O bond seems reasonably prominent. The C=O bonds in non-oxidized oil samples could possibly be attributed to residual dewaxing ketones, antiwear β-lactam, or possibly esters shifted to lower frequencies with conjugation [33,34,35]. As one might expect, the spectra of these oil samples are so active across the entire range that feasible confirmation peaks for these organics appear in the data. However, as the duration of oxidation is increased, this ~1710 cm−1 peak begins disappearing and a new C=O peak begins to take its place within the oil. This peak’s shoulder likely contributes to the keen separation of the lower frequencies within this region, leading to clear and measurable distinctions among the absorbance profiles of the oxidation times.
4. Conclusions
Based on the results of this study, absorption peaks near wavenumbers 860 cm−1 and 970 cm−1 were inversely related to 0 h, 24 h, and 48 h oxidation times and absorbance for each of these oxidation times was significantly different from all other times. The longer oxidation times were not distinguishable, presumably due to the depletion of antioxidants.
Wavenumbers in the ranges of 1065–1219 cm−1 and 1572–1730 cm−1 generally resulted in significant differences among each of the seven oxidation times, with the absorbance increasing with the oxidation time. The exceptions within these ranges were the intermediate peaks near 1150 cm−1, 1600 cm−1, and 1700 cm−1. The regions before and after these peaks were better able to distinguish the oxidation times than the peaks.
The linear regression of the wavenumber and wavenumber ranges that had statistical significance difference among all the oxidation times resulted in very strong models with R2 from about 0.95 to over 0.99 and RMSE from 3.9 to about 10.0. The single wavenumber with the best model was 1624 (R2 = 0.994, RMSE = 3.7) and the best range was with 1614–1678 cm−1 (R2 = 0.993, RMSE = 4.13). The range of 1614–1678 cm−1 was between intermediate peaks, but 2nd order derivative analysis hinted at the possibility of some subtle changes between oxidation levels.
Author Contributions
Conceptualization, A.M.A., T.H., D.G.W. and P.S.; formal analysis, A.M.A., T.H., P.S. and D.G.W.; investigation, A.M.A., T.H., P.S. and D.G.W.; methodology, A.M.A., T.H. and P.S.; resources, P.S.; supervision, P.S. and D.G.W.; writing—original draft, A.M.A., T.H., P.S. and D.G.W.; writing—review & editing, A.M.A., T.H., P.S. and D.G.W.
Funding
This research received no external funding.
Conflicts of Interest
The authors declare no conflict of interest.
References
- Macián, V.; Tormos, B.; Gómez, Y.A.; Salavert, J.M. Proposal of an FTIR Methodology to Monitor Oxidation Level in Used Engine Oils: Effects of Thermal Degradation and Fuel Dilution. Tribol. Trans. 2012, 55, 872–882. [Google Scholar] [CrossRef]
- Soleimani, M.; Sophocleous, M.; Glanc, M.; Atkinson, J.; Wang, L.; Wood, R.J.K.; Taylor, R.I. Engine oil acidity detection using solid state ion selective electrodes. Tribol. Int. 2013, 65, 48–56. [Google Scholar] [CrossRef]
- Faure, D.; Hipeaux, J.C.; Guevellou, Y.; Legros, A. Oxidation stability of gasoline engine lubricants: Effect of base-oil chemistry in laboratory and engine tests. Lubr. Sci. 1999, 5, 337–360. [Google Scholar] [CrossRef]
- Lansdown, A.R. Lubrication and Lubricant Selection a Practical Guide, 3rd ed.; The American Society of Mechanical Engineers: New York, NY, USA, 2004. [Google Scholar]
- Aikawa, K.; Maruyama, M. Development of an Oil Deterioration Monitoring System by Estimating Base Number; SAE Technical Paper 2007-01-1565; SAE International: Warrendale, PA, USA, 2007. [Google Scholar] [CrossRef]
- Soleimani, M.; Sophocleous, M.; Wang, L.; Atkinson, J.; Hosier, I.L.; Vaughan, A.S.; Taylor, R.I.; Wood, R.J. Base oil oxidation detection using novel chemical sensors and impedance spectroscopy measurements. Sens. Actuators B Chem. 2014, 199, 247–258. [Google Scholar] [CrossRef]
- Amat, S.; Braham, Z.; Le Dreau, Y.; Kister, J.; Dupuy, N. Simulated aging of lubricant oils by chemometric treatment of infrared spectra: Potential antioxidant properties of sulfur structures. Talanta 2013, 107, 219–224. [Google Scholar] [CrossRef] [PubMed]
- Canter, N. Use of antioxidants in automotive lubricants. Tribol. Lubr. Technol. 2008, 64, 12–19. [Google Scholar]
- Basu, A.; Berndorfer, A.; Buelna, C.; Campbell, J.; Ismail, K.; Lin, Y.; Rodriguez, L.; Wang, S.S. Smart Sensing of Oil Degradation and Oil Level Measurements in Gasoline Engines; SAE Technical Paper 2000-01-1366; SAE International: Warrendale, PA, USA, 2000. [Google Scholar] [CrossRef]
- ASTM. ASTM D2896—15 Standard Test Method for Base Number of Petroleum Products by Potentiometric Perchloric Acid Titration; ASTM: West Conshohocken, PA, USA, 2015. [Google Scholar]
- Hu, T.; Teng, H.; Luo, X.; Chen, B. Impact of Fuel Injection on Dilution of Engine Crankcase Oil for Turbocharged Gasoline Direct-Injection Engines. SAE Int. J. Engines 2015, 8, 1107–1116. [Google Scholar] [CrossRef]
- Agoston, A.; Otsch, C.; Jakoby, B. Viscosity sensors for engine oil condition monitoring—Application and interpretation of results. Sens. Actuators A Phys. 2005, 121, 327–332. [Google Scholar] [CrossRef]
- Cheek, G.T.; Mowery, R. Determination of Antioxidants in Lubricating Oils Using Ultramicroelectrodes. Anal. Chem. 1989, 61, 1467–1469. [Google Scholar] [CrossRef]
- Dickert, F.L.; Forth, P.; Lieberzeit, P.A.; Voigt, G. Quality control of automotive engine oils with mass-sensitive chemical sensors—QCMs and molecularly imprinted polymers. Fresenius’ J. Anal. Chem. 2000, 366, 802–806. [Google Scholar] [CrossRef]
- Duchowski, J.K.; Mannebach, H. A Novel Approach to Predictive Maintenance: A Portable, Multi-Component MEMS Sensor for On-Line Monitoring of Fluid Condition in Hydraulic and Lubricating Systems. Tribol. Trans. 2006, 49, 545–553. [Google Scholar] [CrossRef]
- Kauffman, R.E. Development of a Remaining Useful Life of a Lubricant Evaluation Technique. Part Ill: Cyclic Voltammetric Methods. Lubr. Eng. 1989, 45, 709–716. [Google Scholar]
- Lieberzeit, P.A.; Glanznig, G.; Leidl, A.; Voight, G.; Dickert, F.L. Nanostructured Polymers for Detecting Chemical Changes During Engine Oil Degradation. IEEE Sens. J. 2006, 6, 529–535. [Google Scholar] [CrossRef]
- Moon, S.-I.; Paek, K.-K.; Lee, Y.-H.; Kim, J.-K.; Kim, S.-W.; Ju, B.-K. Multiwall Carbon Nanotube Sensor for Monitoring Engine Oil Degradation. Electrochem. Solid-State Lett. 2006, 9, H78–H80. [Google Scholar] [CrossRef]
- Price, R.J.; Clarke, L.J. Chemical Sensing of Amine Antioxidants in Turbine Lubricants. Analyst 1991, 116, 1121–1123. [Google Scholar] [CrossRef]
- Smiechowski, M.F.; Lvovich, V.F. Iridium oxide sensors for acidity and basicity detection in industrial lubricants. Sens. Actuators B Chem. 2003, 96, 261–267. [Google Scholar] [CrossRef]
- Méndez Aller, M.; Abdul-Munaim, A.M.; Watson, D.G.; Preu, S. Error Sources and Distinctness of Materials Parameters Obtained by THz-Time Domain Spectroscopy Using an Example of Oxidized Engine Oil. Sensors 2018, 18, 2087. [Google Scholar] [CrossRef]
- Ahmad, I.; Ullah, J.; Ishaq, M.; Khan, H.; Gul, K.; Siddiqui, S.; Ahmad, W. Monitoring of oxidation behavior in mineral base oil additized with biomass derived antioxidants using FT-IR spectroscopy. R. Soc. Chem. Adv. 2015, 5, 101089–101100. [Google Scholar] [CrossRef]
- Guan, L.; Feng, X.L.; Xiong, G.; Xie, J.A. Application of dielectric spectroscopy for engine lubricating oil degradation monitoring. Sens. Actuators A Phys. 2011, 168, 22–29. [Google Scholar] [CrossRef]
- Rahimi, B.; Semnani, A.; Nezamzadeh-Ejhieh, A.; Langeroodi, H.S.; Davood, M.H. Monitoring of the Physical and Chemical Properties of a Gasoline Engine Oil during Its Usage. J. Anal. Methods Chem. 2012, 2012, 819524. [Google Scholar] [CrossRef]
- van de Voort, F.R.; Sedman, J.; Cocciardi, R.A.; Pinchuk, D. FTIR Condition Monitoring of In-Service Lubricants: Ongoing Developments and Future Perspectives. Tribol. Trans. 2006, 49, 410–418. [Google Scholar] [CrossRef]
- Ofunne, G.C.; Maduako, A.U.; Ojinnaka, C.M. Studies on the ageing characteristics of automotive crankcase oils. Tribol. Int. 1989, 22, 401–404. [Google Scholar] [CrossRef]
- Ofunne, G.C.; Maduako, A.U.; Ojinnaka, C.M. High temperature oxidation stability of automotive crankcase oils and their base oils. Tribol. Int. 1990, 23, 407–412. [Google Scholar] [CrossRef]
- ASTM International. ASTM E2412-10(2018) Standard Practice for Condition Monitoring of In-Service Lubricants by Trend Analysis Using Fourier Transform Infrared (FT-IR) Spectroscopy; ASTM International: West Conshohocken, PA, USA, 2018. [Google Scholar] [CrossRef]
- Egharevba, F.; Maduako, A.U. Assessment of oxidation in automotive crankcase lube oil: Effects of metal and water activity. Ind. Eng. Chem. Res. 2002, 41, 3473–3481. [Google Scholar] [CrossRef]
- Nguele, R.; Al-Salim, H.; Sasaki, K. Oil Condition Monitoring Degradation Mechanisms and Additive Depletion. J. Multidiscip. Eng. Sci. Technol. 2015, 2, 355–360. [Google Scholar]
- Moehle, W.E.; Cobb, T.W.; Schneller, E.R.; Gatto, V.J. Utilizing the TEOST MHT® to Evaluate Fundamental Oxidation Processes in Low-Phosphorus Engine Oils. Tribol. Trans. 2007, 50, 96–103. [Google Scholar] [CrossRef]
- Nie, B.; Stutzman, J.; Xie, A. A vibrational spectral maker for probing the hydrogen-bonding status of protonated Asp and Glu residues. Biophys. J. 2005, 88, 2833–2847. [Google Scholar] [CrossRef] [PubMed]
- As’ad, A.M.; Yeneneh, A.M.; Obanijesu, E.O. Solvent Dewaxing of Heavy Crude Oil with Methyl Ethyl Ketone. J. Pet. Environ. Biotechnol. 2015, 6, 213. [Google Scholar] [CrossRef]
- Kalyani; Jaiswal, V.; Rastogi, R.B.; Kumar, D. Tribological investigations on β-lactam cephalosporin antibiotics as efficient ashless antiwear additives with low SAPS and their theoretical studies. RSC Adv. 2014, 4, 30500–30510. [Google Scholar] [CrossRef]
- Yao, T.; Yang, H.; Guo, L.; Fei, Y.; Jiang, H.; Bian, S.; Wu, T. The Deterioration Mechanism of Diester Aero Lubricating Oil at High Temperature. J. Spectrosc. 2017. [Google Scholar] [CrossRef]


© 2019 by the authors. Licensee MDPI, Basel, Switzerland. This article is an open access article distributed under the terms and conditions of the Creative Commons Attribution (CC BY) license (http://creativecommons.org/licenses/by/4.0/).