1. Introduction
Adhesive failure occurs when an adhesive is separated from a substrate or surface [
1]. For example, in a tribosystem, grease can act as an adhesive in a wheel bearing. If adhesive failure occurs in the bearing, metal-to-metal contact becomes inevitable in the tribosystem, which will result in an increase in frictional force. Ultimately, this can end with a seizure of the wheel bearing, where a seizure is defined as a localized fusion of metal between two rubbing surfaces [
2]. Wear is an important factor when considering adhesive failure [
3]. The adhesive behavior of lubricants is of interest when considering adhesive failure in a tribosystem. Therefore, there must be reliable methods to accurately determine when and how adhesive failure occurs in a tribosystem, so lubricant manufacturers can ensure their products do not fail.
Determining the tribological load-carrying capacity of lubricants is typically done via step tests, which are also referred to as seizure tests, with standardized procedures and parameters in compliance with ASTM standards, such as ASTM D5706 and ASTM D7421. During these step tests, the normal force is increased in steps until a final load is reached, or until adhesive failure occurs [
2]. Historically, analysis of the development of the coefficient of friction as the load increases has been used as the main criterion for determining adhesive failure. The criteria used to determine seizure is as follows: either a stoppage of the machine, an increase in the coefficient of friction of at least 0.2 for over 20 s, or if the coefficient of friction increases more than 0.35 [
4].
However, it may not be sufficient to only analyze the coefficient of friction. The reproducible identification of the time of failure of a tribosystem and the interpretation of the underlying effects, along with the increasing complexity and efficiency of lubricants and tribometers, place growing demands on the technical and tribological knowledge of the experimenters. If only the development of coefficient of friction is measured, it can be difficult to determine the exact moment of adhesive failure, and signs indicating that adhesive failure is about to occur cannot be seen. As a result, the development of new measurement technologies and methods can gain more data depth and can provide further insight into the tribosystem.
The step tests can be interpreted outside of the standardized characteristics to further understand the adhesive behavior and failure. The SRV® technology—where SRV stands for the German acronym for oscillation, friction, and wear—is capable of analyzing lubricants in terms of parameters besides only the development of the coefficient of friction. The SRV®5 instrumentation is in compliance with ASTM D5706 for greases and ASTM D7421 for lubricating oils, and measures various criteria to more accurately interpret step tests and determine adhesive failure. This paper will point out suggestions and approaches for discussion on how the interpretation of step tests beyond the standardized characteristics can lead to new knowledge in tribological research and development. The paper will also explore the capability and applicability of the SRV® instrument when used for research and development projects by applying the tribometer to Stribeck’s theory and other tribological assessments.
When examining the tribological behavior of lubricated systems, Stribeck’s theory of the speed-dependent coefficient of friction must be considered. Stribeck’s theory states that the friction and lubrication relationship is characterized by the basis of η
V/
F, where η is the viscosity,
V is the sliding velocity, and
F is the normal force [
5]. The coefficient of friction is a function of the value of η
V/
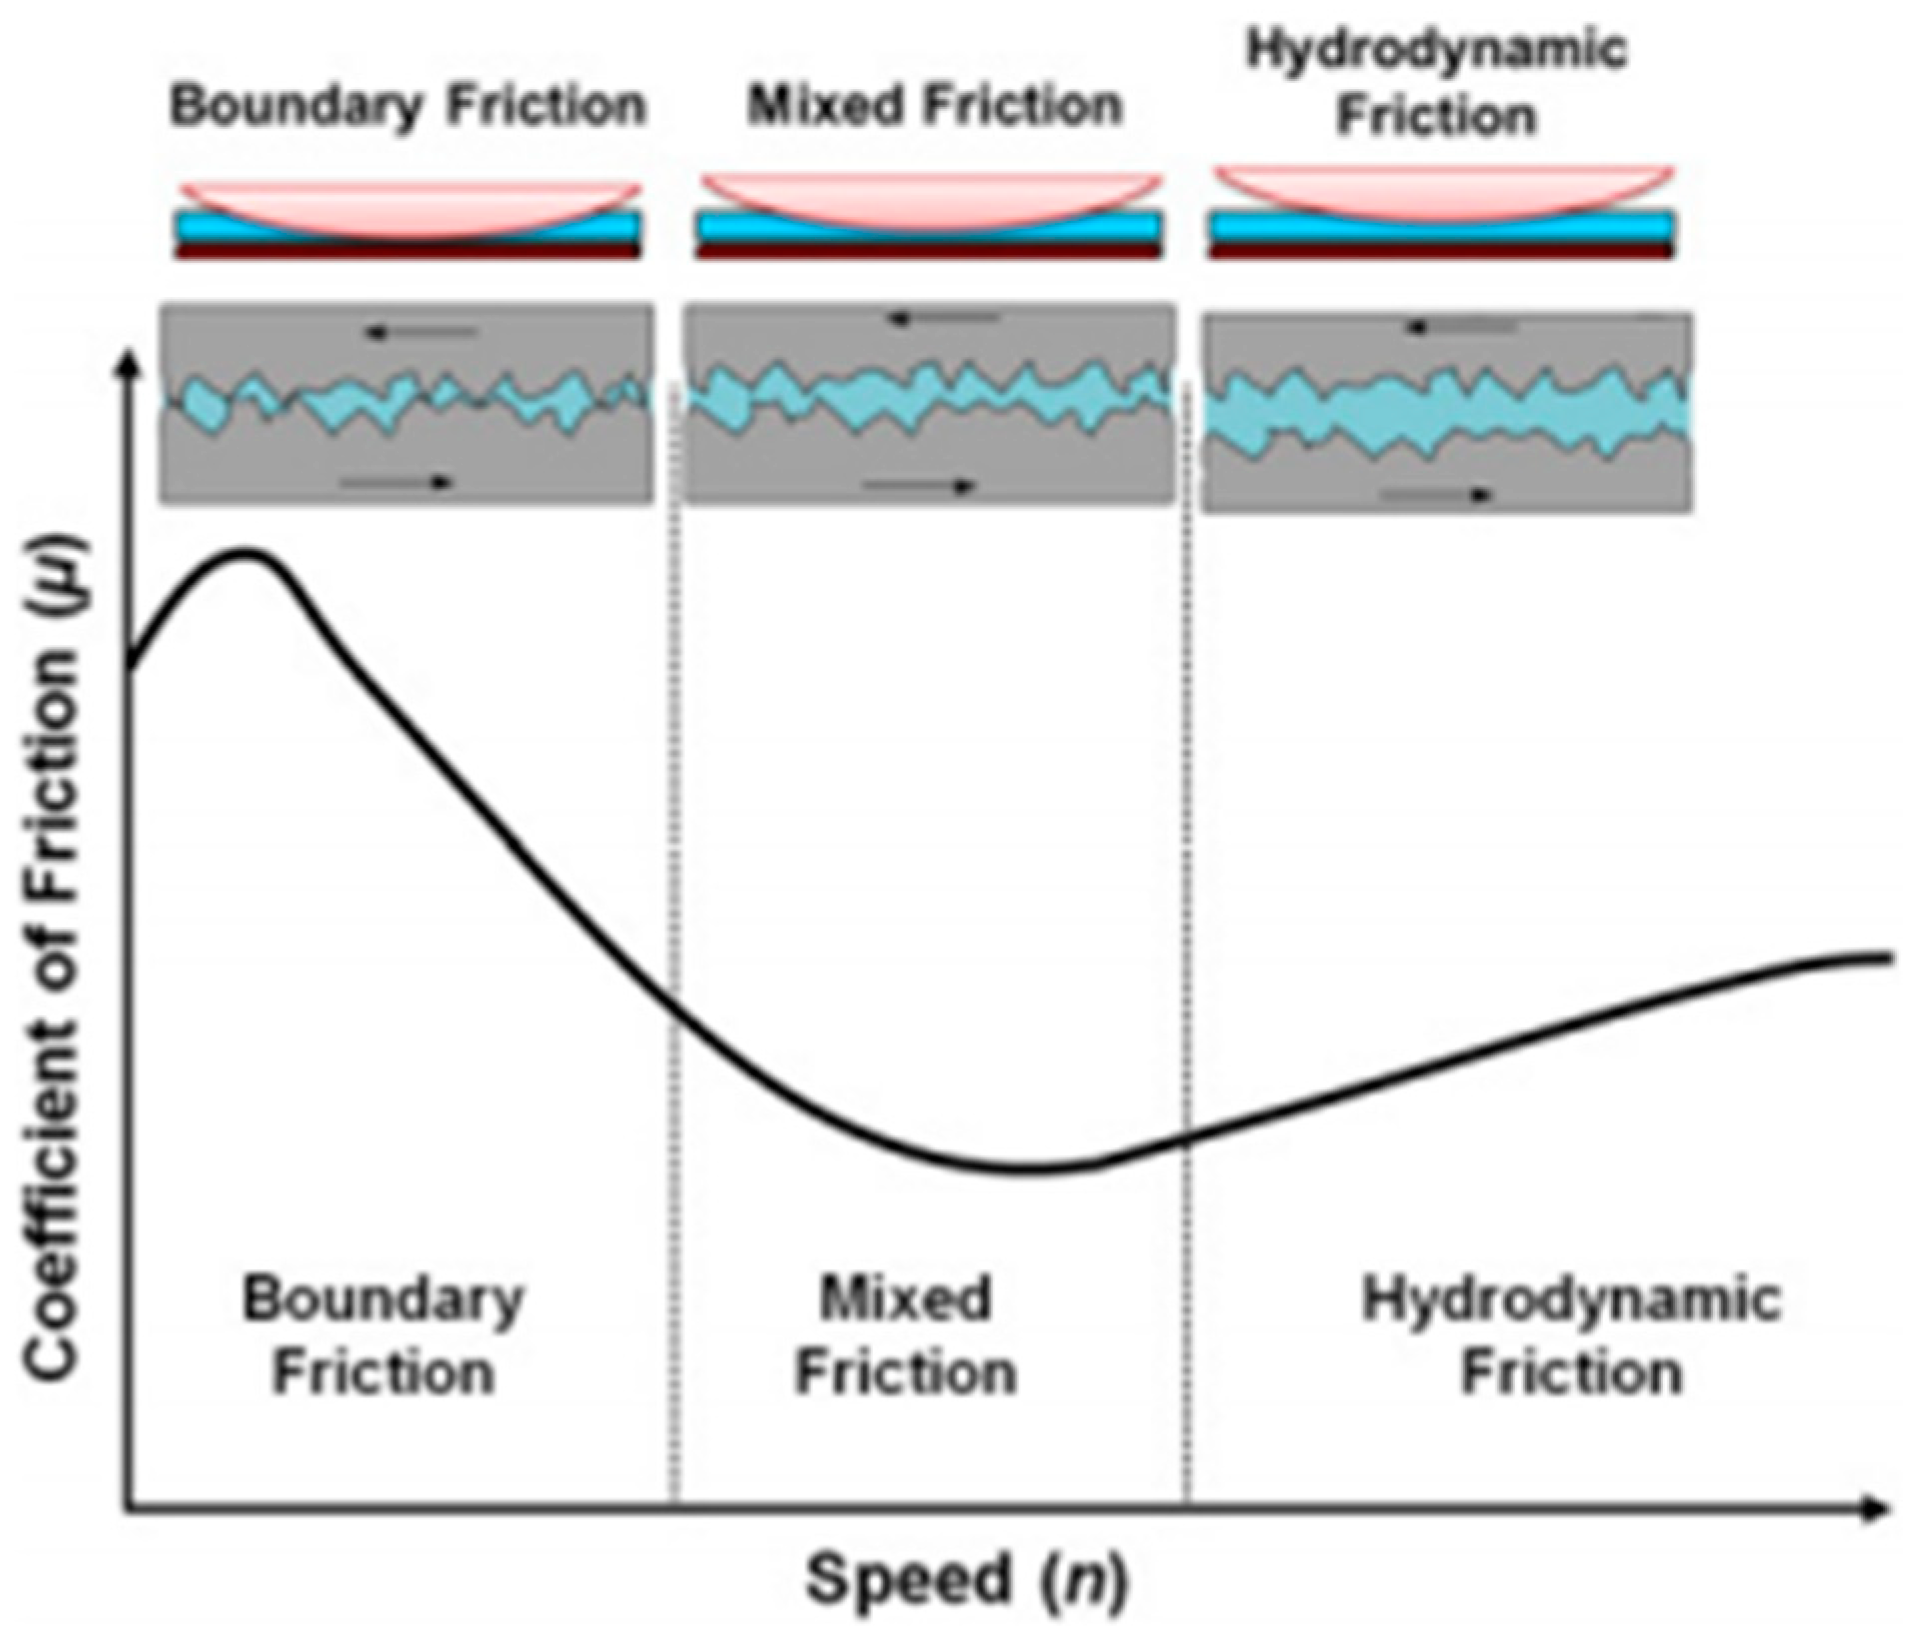
F. Typically, Stribeck’s theory is applied to rolling journal bearings, where the sliding velocity is unidirectional. An example of a typical Stribeck curve is shown in
Figure 1, where there are three lubrication regimes, which also depend on the lubricant’s film thickness. Due to the oscillatory motion of the SRV
®, Stribeck’s theory must be slightly adjusted, since the motion is not unidirectional. With a reciprocating motion, the sliding speed is characterized by the stroke and the frequency due to the instrument’s sinusoidal motion. When applying Stribeck’s theory to oscillatory and reciprocating motions, the velocity must be fully developed across each stroke, to ensure sufficient build-up of pressure and film thickness such that the boundary friction regime can be achieved. However, reciprocating tests, especially those with high frequency, induce high values of acceleration at the end of the stroke, which can create high stresses in adhesives and can lead to adhesive events [
6]. For some tribosystems, this can be a challenge when applying Stribeck’s theory to a reciprocating test rig, as it may be difficult to reach the boundary friction regime. With the SRV
® instrument, the hydrodynamic regime can be reached under circumstances of low normal force and high frequency and high stroke.
2. Experimental and Evaluation Procedure
In this study, 10 lubricants from the last SRV® round robin test which served as reference samples underwent tribological testing for their load-carrying capacity according to ASTM D5706 for greases and ASTM D7421 for oils. During the tests, not only the usual parameters test load, temperature, frequency, stroke, and coefficient of friction (COF) were measured, but also further measurement data and results were taken: electrical contact resistance, drive current of the oscillation drive (as an indicator for the required drive power), zero position of the motion, and the effective value of the COF. The SRV® is capable of producing results that comply with the reliability and reproducibility statements in ASTM D5706, D7421, and related specifications.
For further evaluation, a program was developed which converts the measurements and results into further tribological characteristics and can recognize and evaluate effects by logically connecting measurements and results during the tests. The following secondary tribological characteristics were calculated: mean friction power per period, mean friction energy per period, friction force, crest factor, smoothed COF curve, and the noise bandwidth of the COF. The following criteria were used for the evaluation of adhesive effects: evaluation of COF smoothness, recognition of stroke fluctuations, recognition of significant COF changes, and recognition of adhesive failure.
3. Evaluation of Step Tests with New Techniques
The new measurement and result channels can, with varying significance, be used as an interpretation aid for seizure load tests and especially for early recognition of adhesive failure.
3.1. Measurement of Electrical Resistance
The electrical contact resistance between the two specimens is primarily determined by the chemical composition of the lubricant as well as by the resulting reaction layer on the surfaces of the friction partners. The electrical resistance is a complex parameter to use when analyzing tribosystems, since it is affected by many factors, such as temperature and lubricant composition. Lubricant film thickness is known to be another important factor that influences the electrical contact resistance. As a result, measurement of the electrical resistance can provide information regarding the frictional regimes as mentioned in Stribeck’s theory and adhesive behavior of the lubricant [
8].
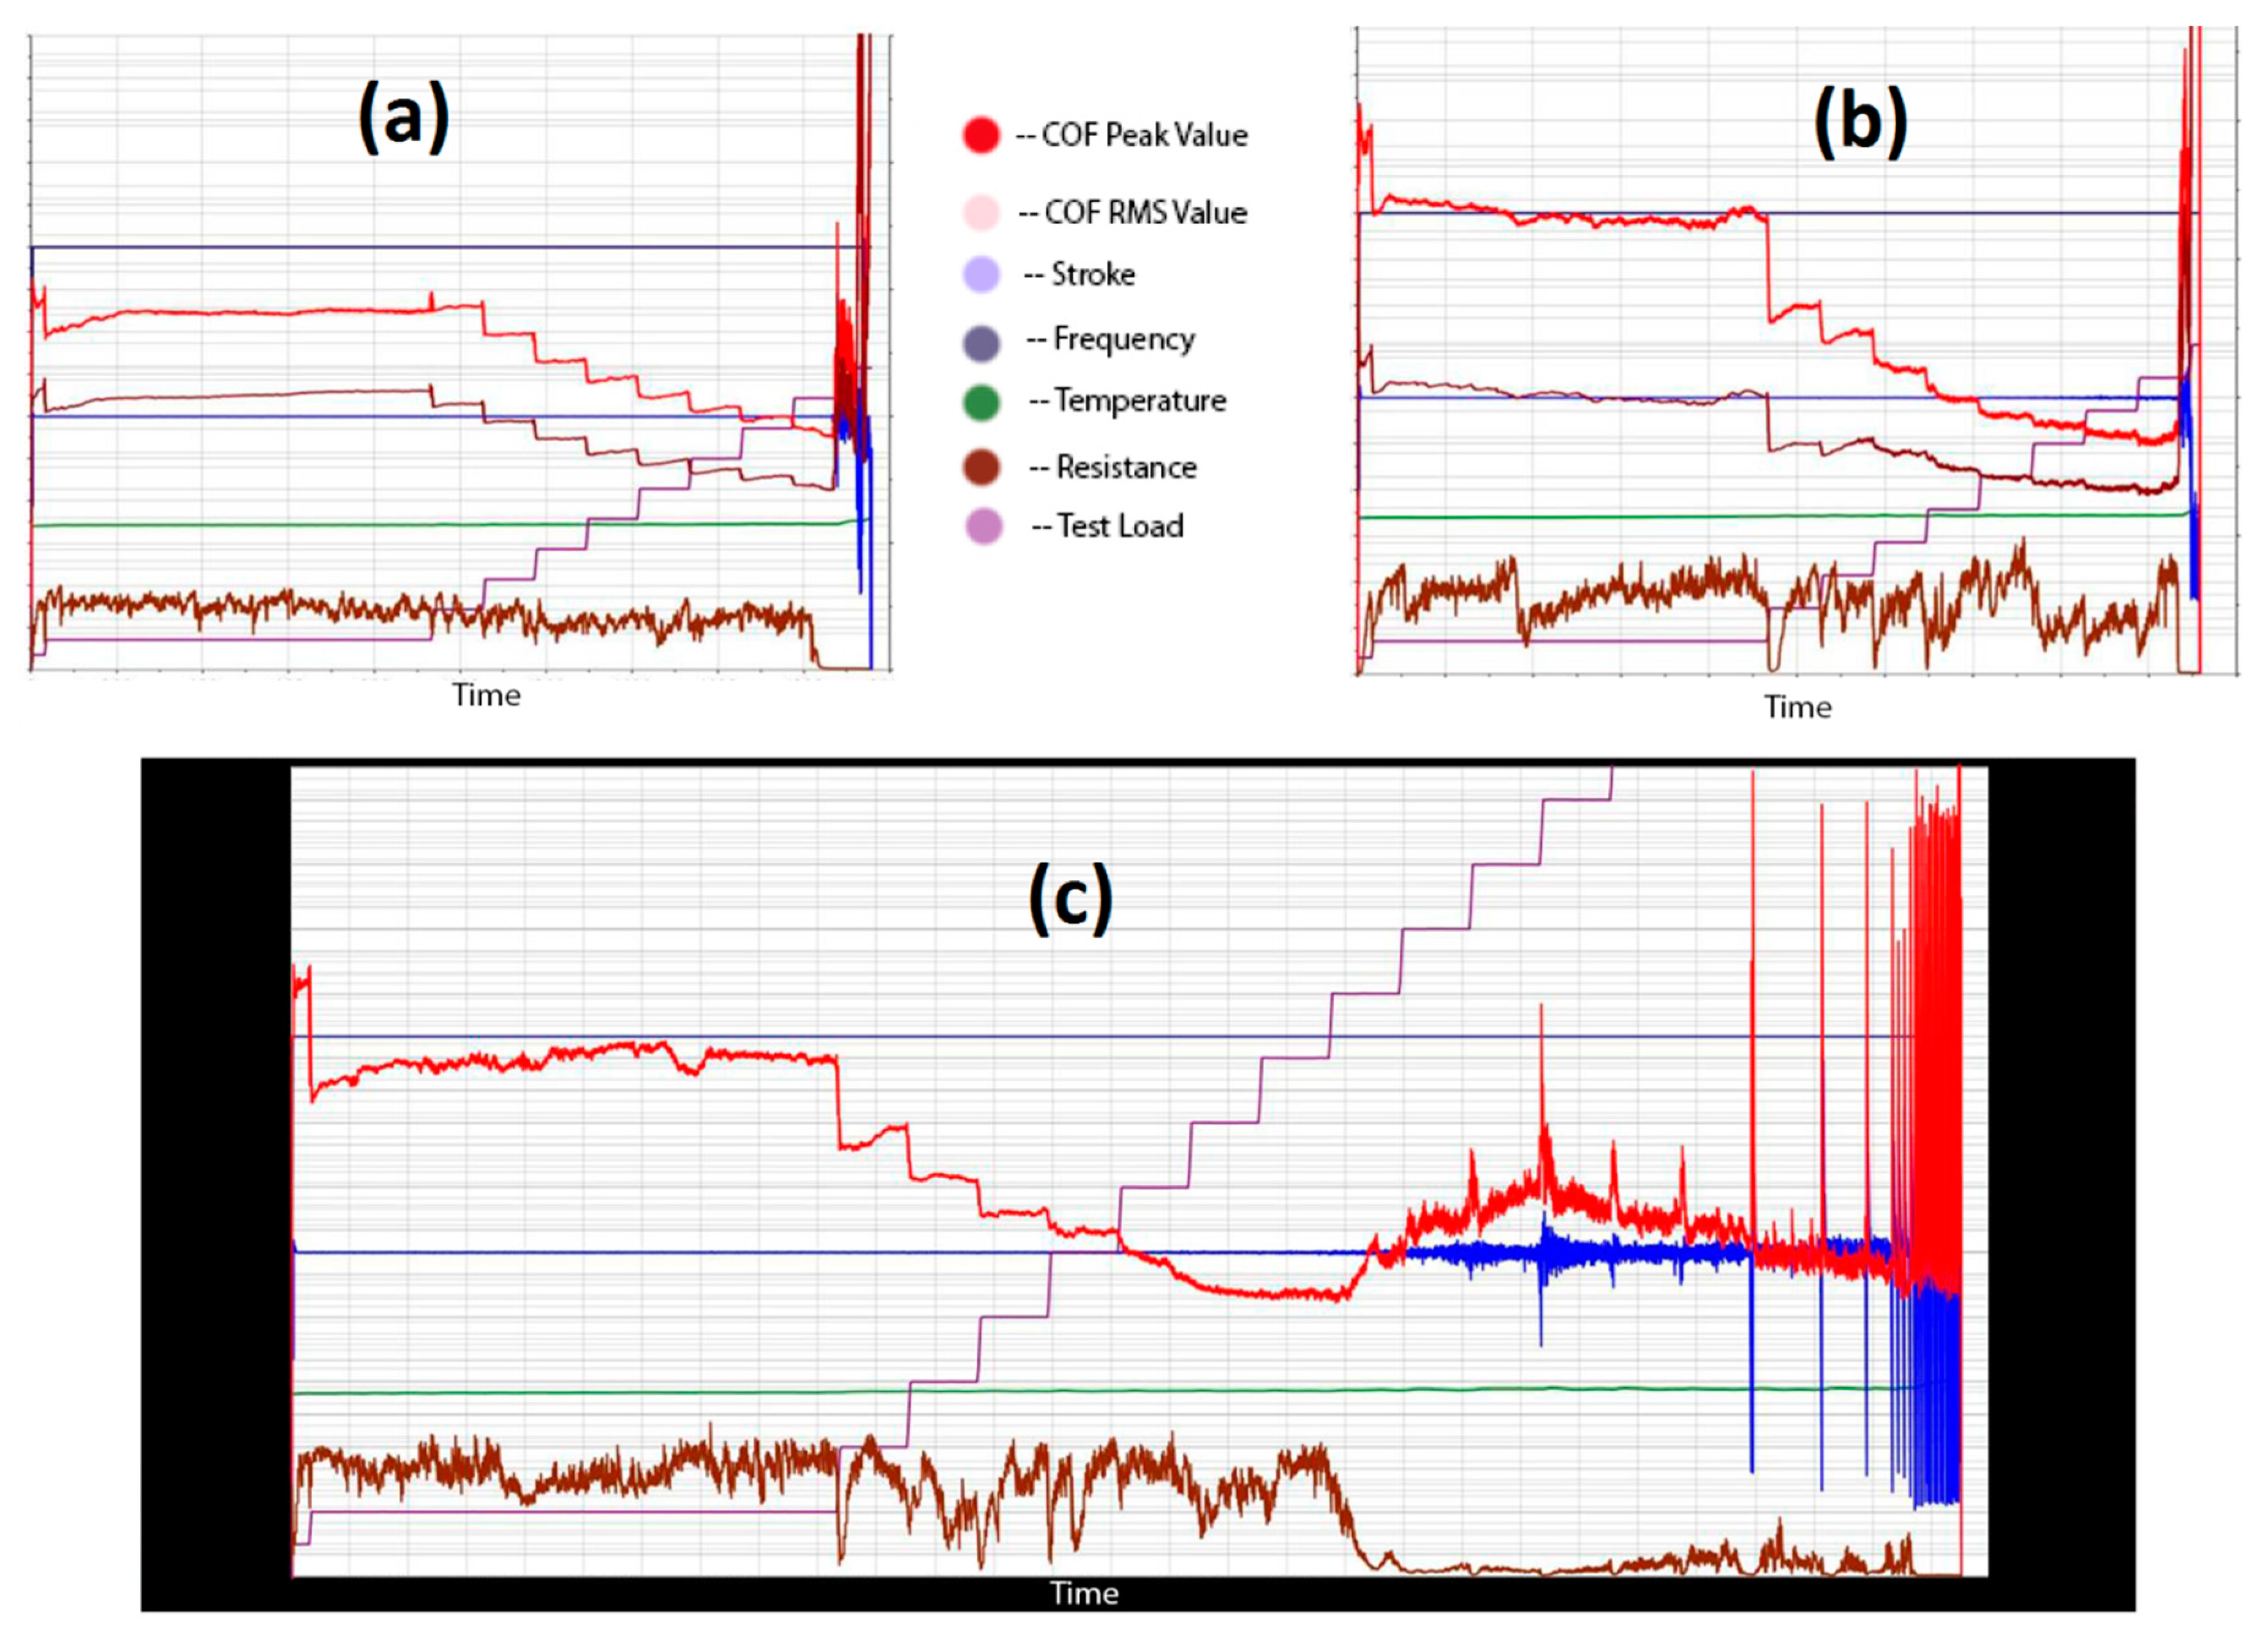
The measurement of the electrical resistance can therefore only be used to study the adhesive behavior for certain lubricant types, whose chemical components are not electrically conductive and who do not produce any electrically conductive reaction products on the surfaces of the friction partners. When these conditions are fulfilled, one finds that:
1. The electrical resistance increases after the beginning of the test and levels off at a certain level.
Figure 2a shows an example of this behavior.
2. For some lubricants, the electrical resistance briefly collapses and levels off again after increasing the test load. This is observed in
Figure 2a.
3. During the test of some lubricants, the electrical resistance hardly reacts to any changes in the normal force at all. This can be seen in
Figure 2b.
4. The electrical resistance approaches zero shortly before adhesive failure occurs. This is shown in
Figure 2c.
5. The electrical resistance in the friction contact can change significantly during one oscillation period. Generally, the minimum resistance is located at the turning points and the maximum resistance can be found at the zero crossing of the movement (maximum sliding speed). This behavior changes depending on the applied normal force.
These patterns are not always able to properly describe the adhesive behavior, as there are bound to be some exceptions. For example, the electrical resistance can unexpectedly breakdown and approach zero. Typically, this indicates that adhesive failure has occurred or is about to occur. For some exception cases, this unexpected resistance breakdown can occur early, such that it does not indicate adhesive failure. Therefore, other parameters should be analyzed alongside the electrical resistance to further understand the adhesive mechanism and adhesive failure occurrences.
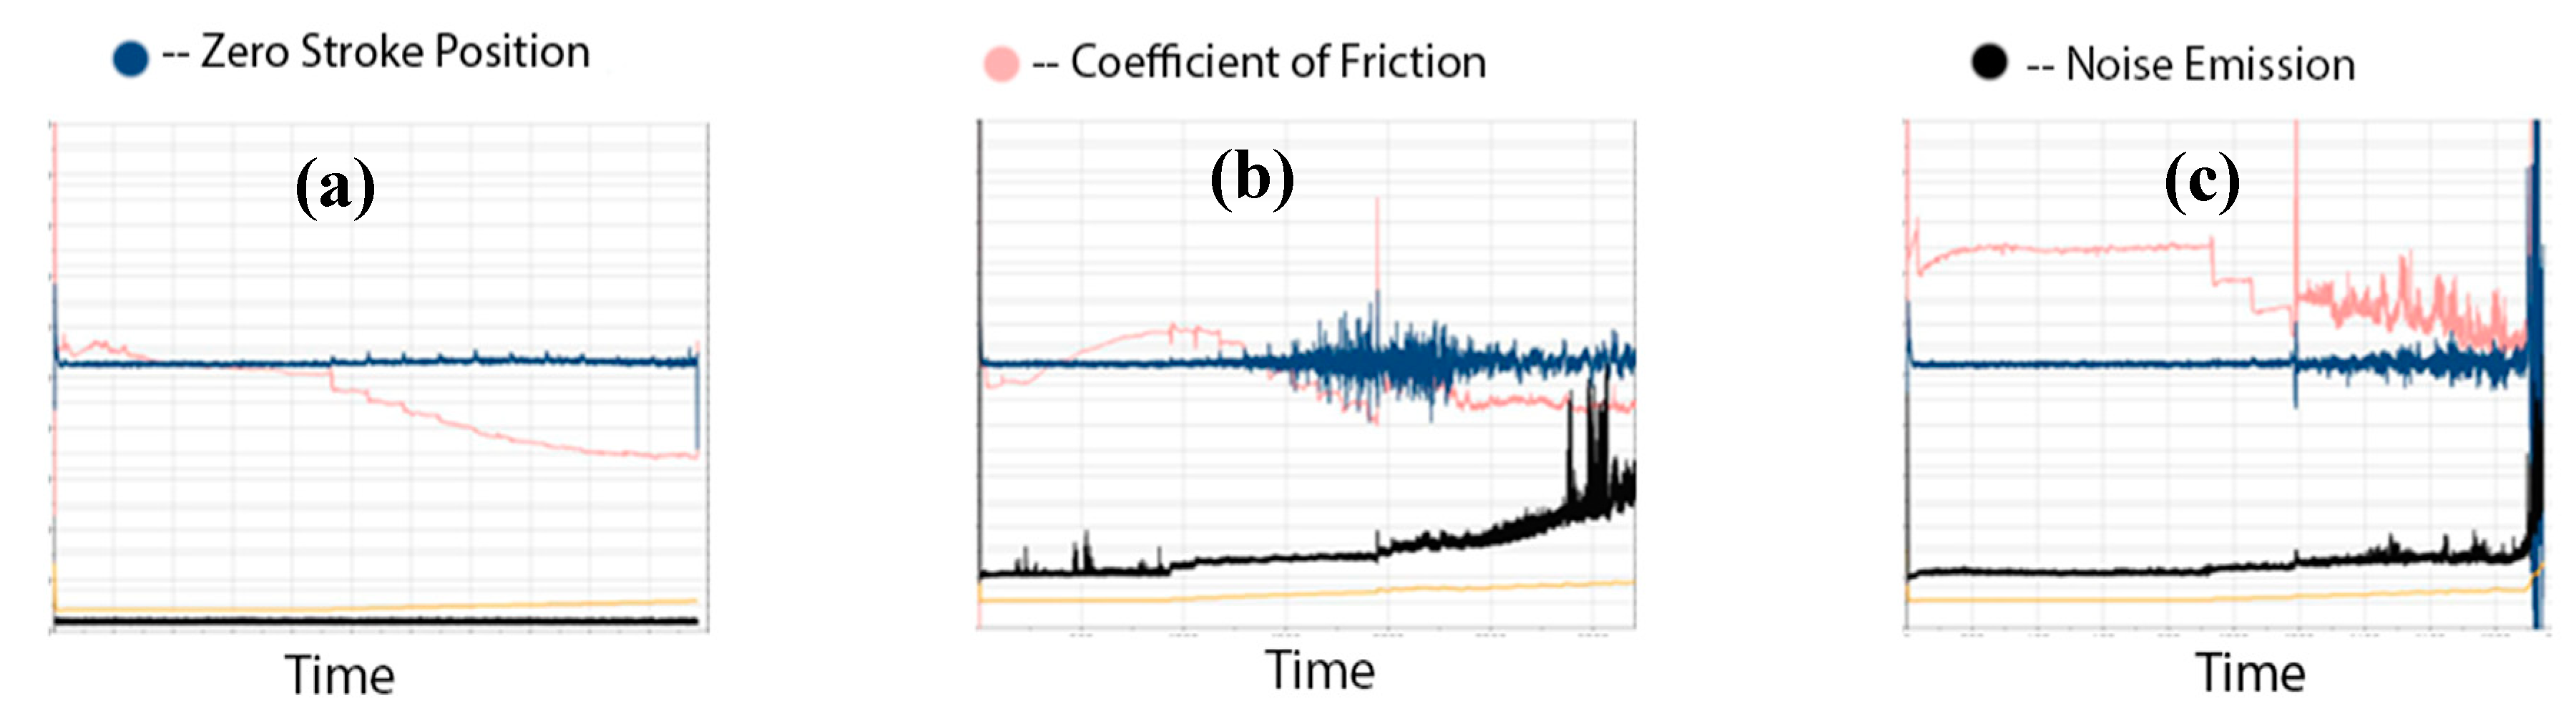
3.2. Measurement of the Zero Stroke Point
The analysis of the high-resolution position data reveals that adhesive moments in the tribocontact lead to the displacement of the position signal around the zero point. Using suitable integration of the position signal, the zero signal can be extracted and analyzed as a tribometric result. This analysis shows that for certain tribosystems, adhesive failure announces its occurrence beforehand with a strong displacement of the zero point. For most of the examined tribosystems, a significant zero-point displacement occurs only after an initial adhesive event. A significant displacement is considered as a shift of more than 0.01 mm around the zero point. Three examples of zero stroke point measurements are shown in
Figure 3.
As seen in
Figure 3, analysis of the zero stroke position can indicate the occurrence of an adhesive event or failure, due to the elasticity of the electromagnetic linear drive and the controller characteristics. This is shown in
Figure 3b,c, where there are irregularities in the zero-stroke position before and after major adhesive events. When other measurements are analyzed alongside the zero stroke position, these adhesive events and failures can clearly and more easily be identified.
3.3. Effective Value of the COF
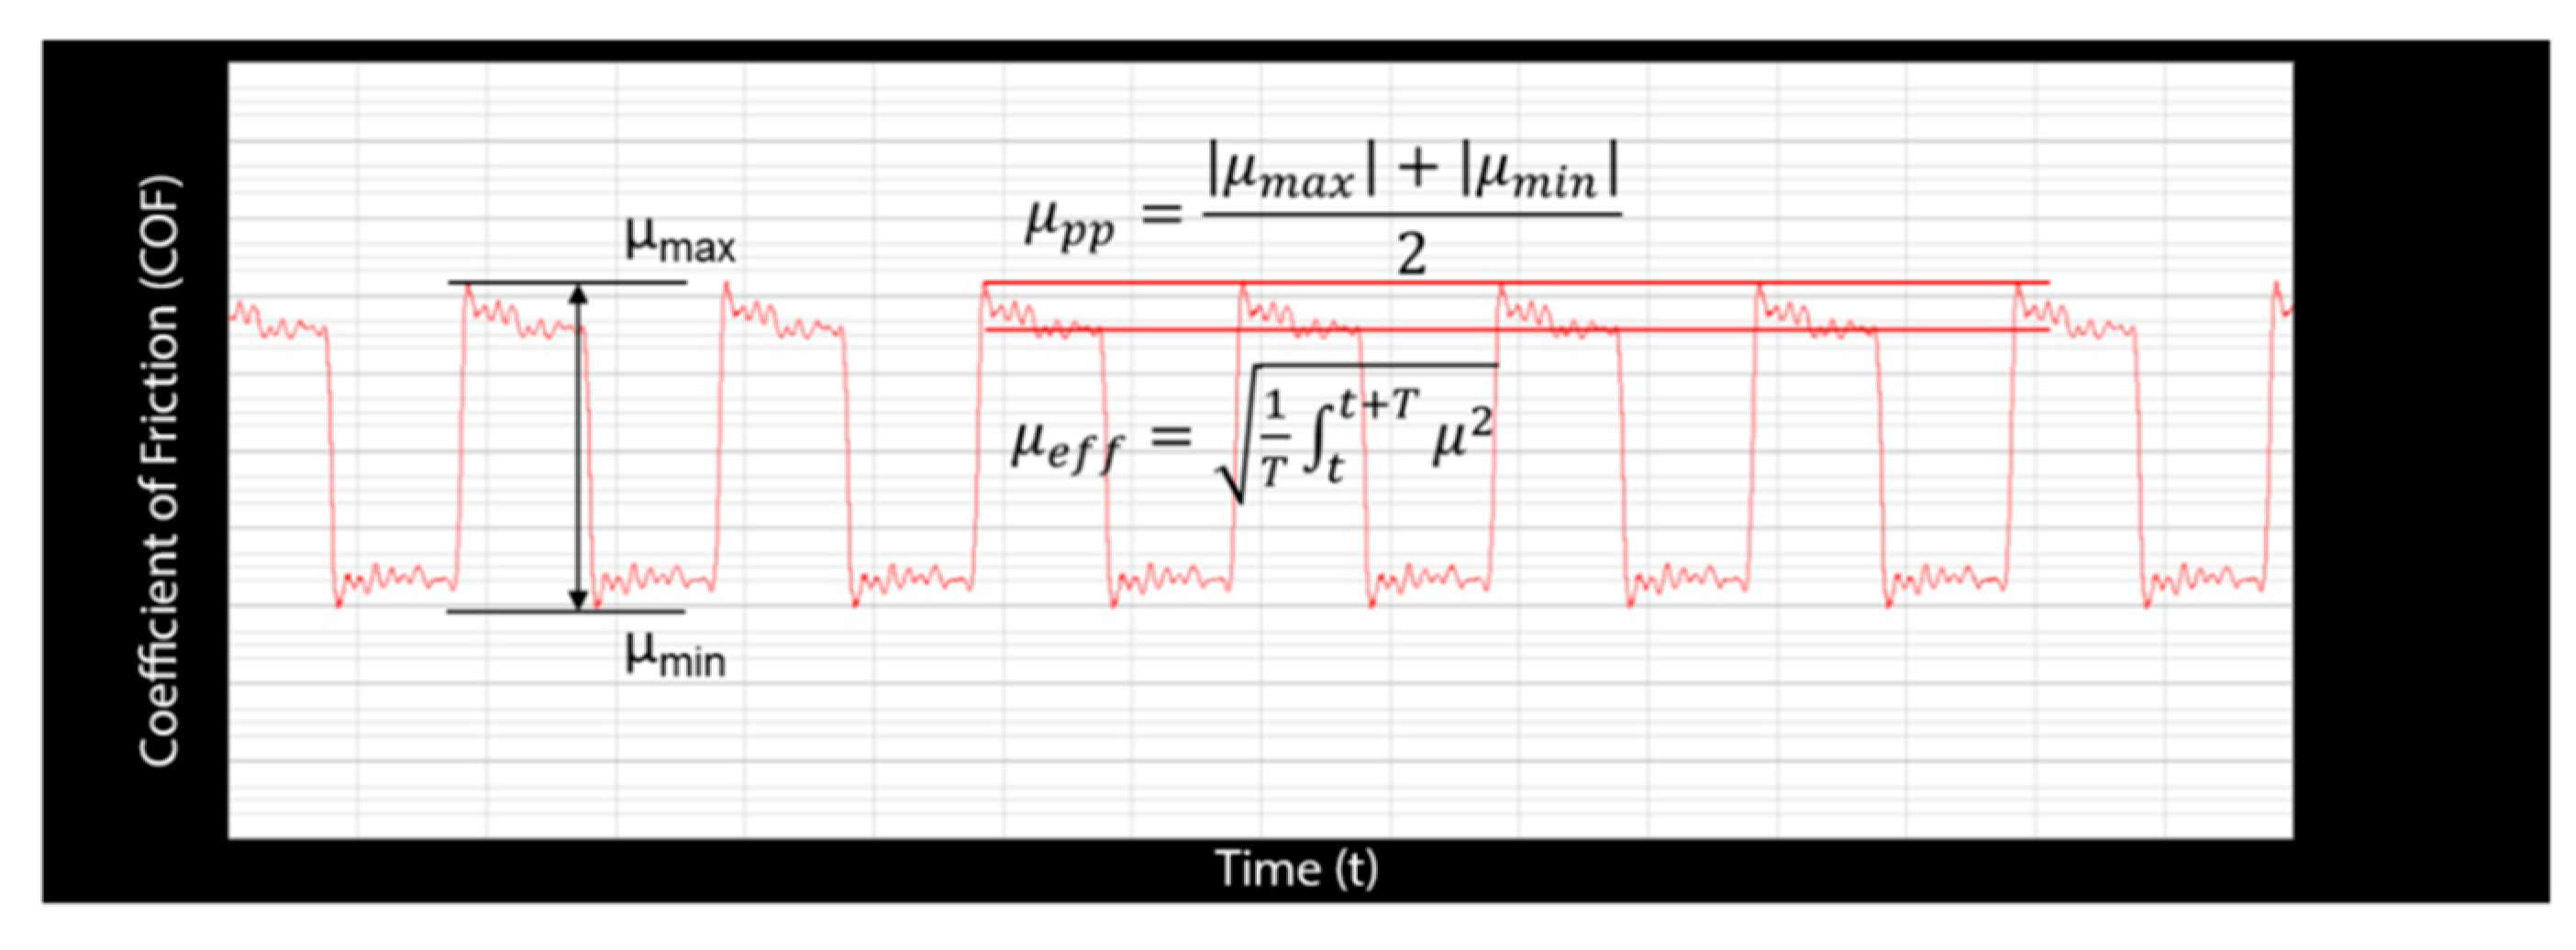
The effective value of the COF—as opposed to the typically reported peak value—gives more weight to the sliding part of the friction behavior than the static part due to its integrating character. The effective COF is taken as the root-mean-square (RMS) value of the COF across each stroke. The comparison of effective and peak value, on one hand, gives information on the form of static behavior at the turning points of the motion, and on the other hand allows for a rough mathematically derived assessment of the signal form of the original friction signal.
All tests show that the ratio of peak to effective value decreases with increasing test load, which suggests that the static and sliding portions of the friction behavior converge. Equations to calculate both COF values are shown in
Figure 4, and shows their graphical relationship.
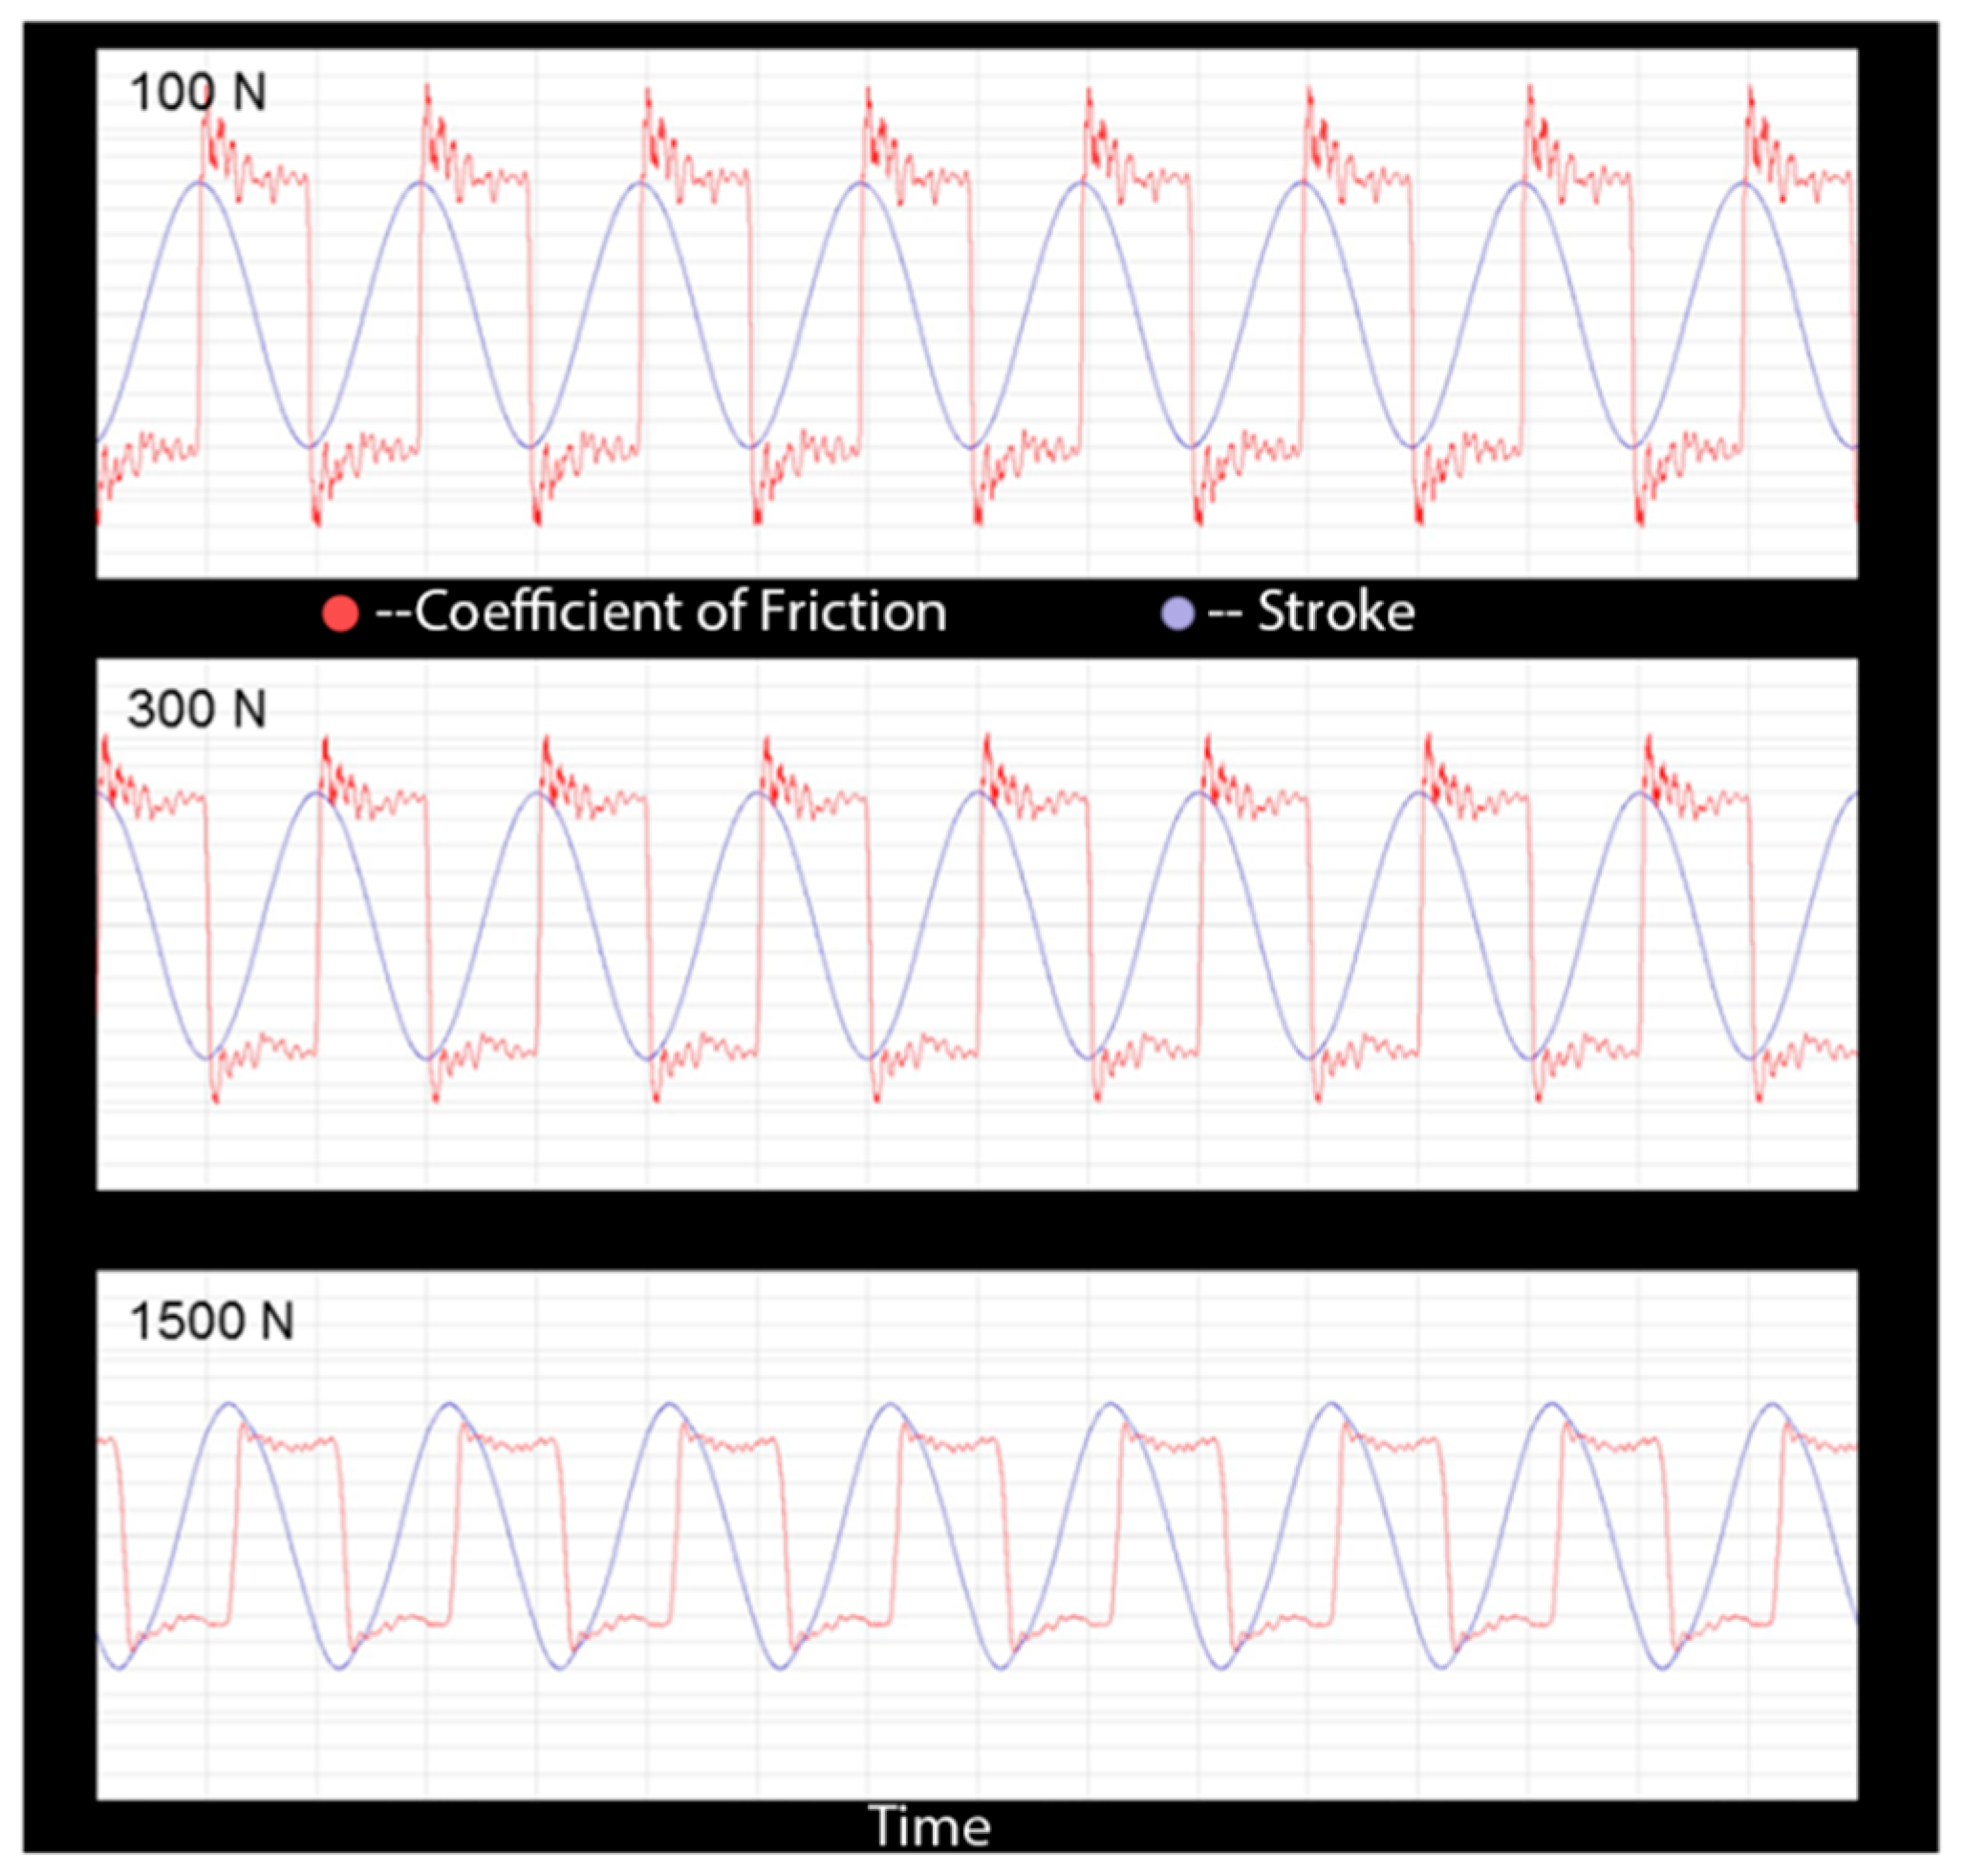
The ratio of the peak to effective COF values will change with the test load. This ratio decreases with an increasing test load. As a result, the shape of the COF curve changes with increasing test load, and it becomes more rectangular, which may indicate possible surface smoothening, or even the frictional force becoming independent of the sliding speed, indicating that the boundary frictional regime has been achieved. This is shown in
Figure 5.
3.4. Sliding Speed
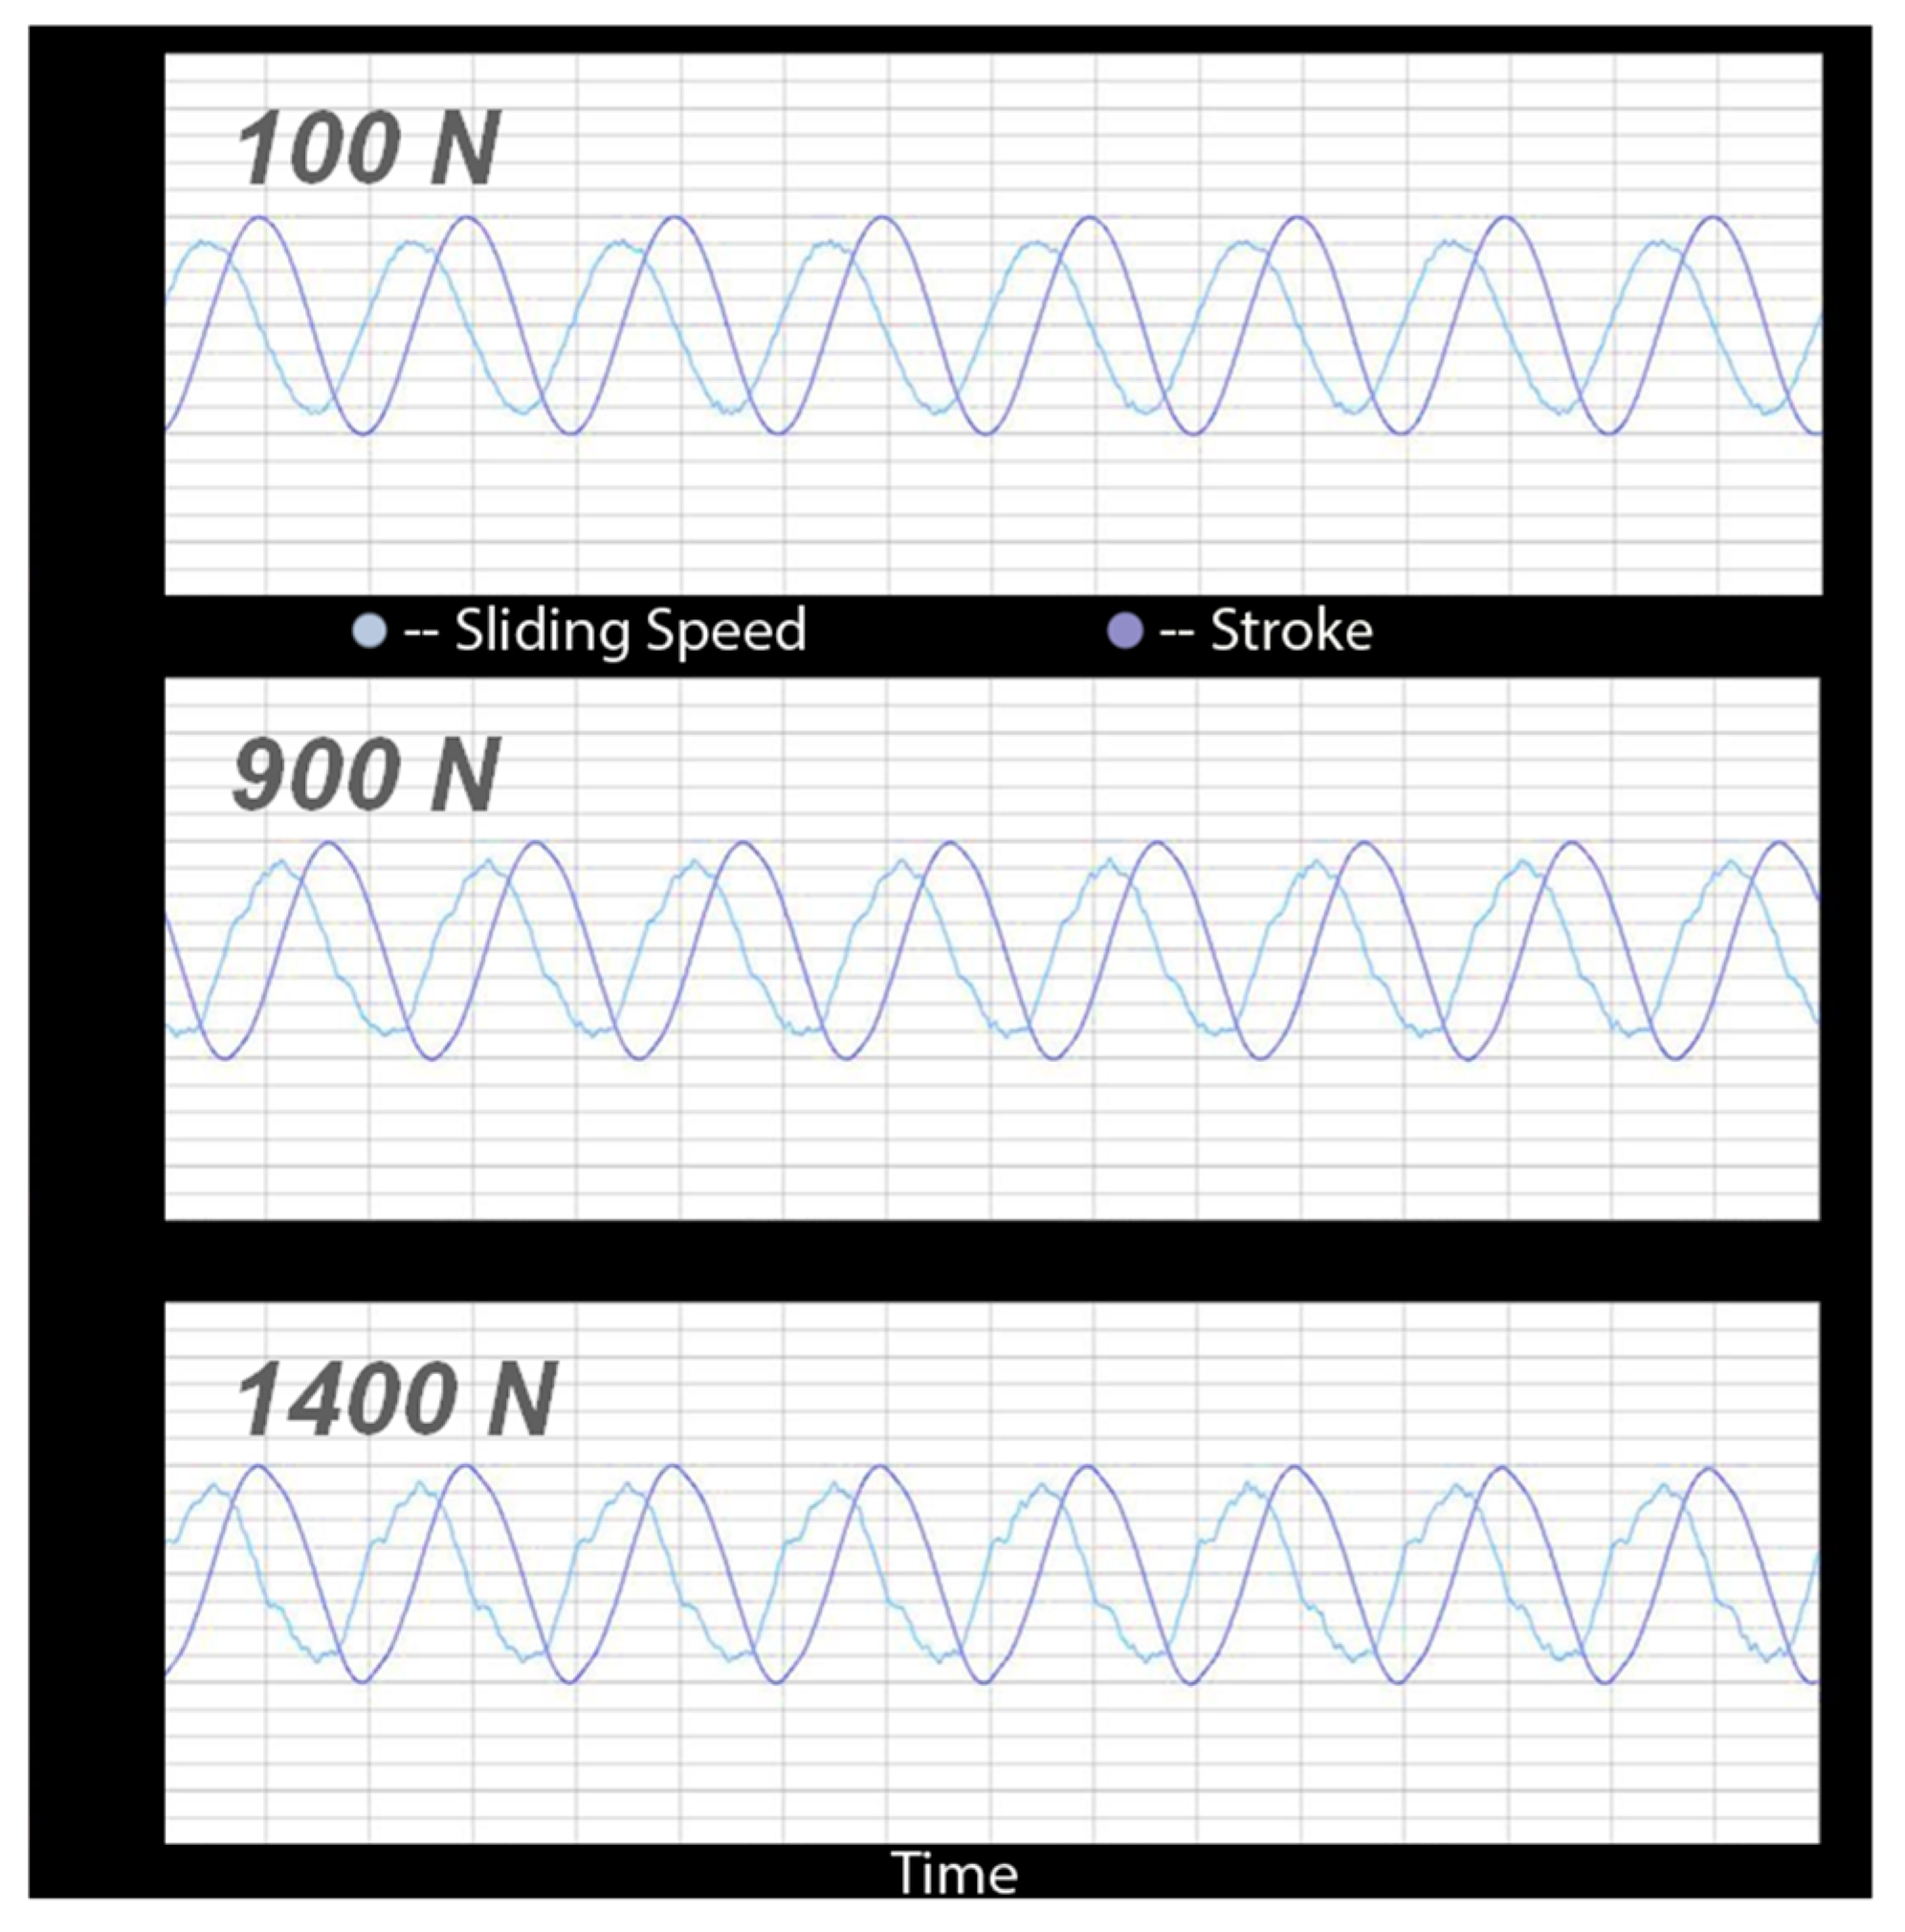
The sliding speed can be taken as the differential of the position signal, which enables the user to make clarifying statements of the continuity of the motion. Considering the search for adhesive effects, it can easily be supposed that a disruption of the motion will be seen along with an adhesive event. An example of this behavior is shown in
Figure 6. In this example, an adhesive event was observed at a test load of 1200 N. As the load increases beyond this adhesive event, the sliding speed transitions from a smooth curve, as seen at a load of 100 N, to a disrupted curve with disturbances, which is observed at a load of 1400 N.
4. Automated Analyses
Using automated analysis algorithms, the insight gained from the test series can be enhanced by calculating additional data which makes possible further correlations. The analysis algorithm used here determines the pass load of step tests according to the current scuffing criteria and correlates it to the calculated values from the original measurements. These are, for example: crest factor, mean frictional power per period (Watt, W), mean frictional energy per period (Joule, J), cumulated friction energy (Joule, J), mean friction force (N), and temperature at seizure (°C). The information thus acquired can be correlated accordingly to draw further conclusions.
The crest factor is defined as the ratio of the peak COF value to the effective RMS COF value. This ratio was discussed previously in
Section 3. A high crest factor indicates the peak COF value is large compared to the effective value. In this scenario, the static frictional component is more dominant than the sliding frictional components. The crest factor helps mathematically describe the shape of the COF signal graphs. A crest factor of around 1 indicates a rectangular-shaped graph, a crest factor of around 1.41 (square root of 2) indicates a sinusoidal shaped graph, and a crest factor greater than 1.41 (square root of 2) indicates a graph with pointy and more random peaks. To further analyze the COF curve, the peak COF curve can be smoothed, using reference values in the data to recognize irregularities. Additionally, a noise bandwidth of the COF can be taken as the sliding average and the standard deviation of the COF curve. This noise bandwidth produces a tolerance band around the COF curve, easing the ability to recognize outliers which may indicate an adhesive event. For example, a criterion that is looked at to recognize any adhesive events is if the smoothed COF curve lies within the noise bandwidth of the COF curve. This may indicate adhesive failure, especially if any significant changes to the COF occur.
Additionally, the mean frictional power and energy per period can be calculated. The equations to calculate these characteristics are shown in Equations (1) and (2).
where P
f—mean frictional power per period, W; W
f —mean frictional energy per period, J; F
N—normal force, N; µ
eff—temporal effective COF value over one period; S
per—sliding path over one period, m; T—period duration, s.
The cumulated friction energy can be calculated by a summation of mean frictional energy per period until the cutoff criteria are reached, ending the test. The mean friction force is the average value of the friction force for each period, where the friction force is calculated as the product of the effective COF and the normal force. The temperature at seizure is the temperature of the test disk at which the cutoff criteria are reached. These factors can be used for numerical analysis to further understand the adhesive behavior, events, and failure.
5. Results and Discussion
Stribeck’s theory can be tested with the SRV
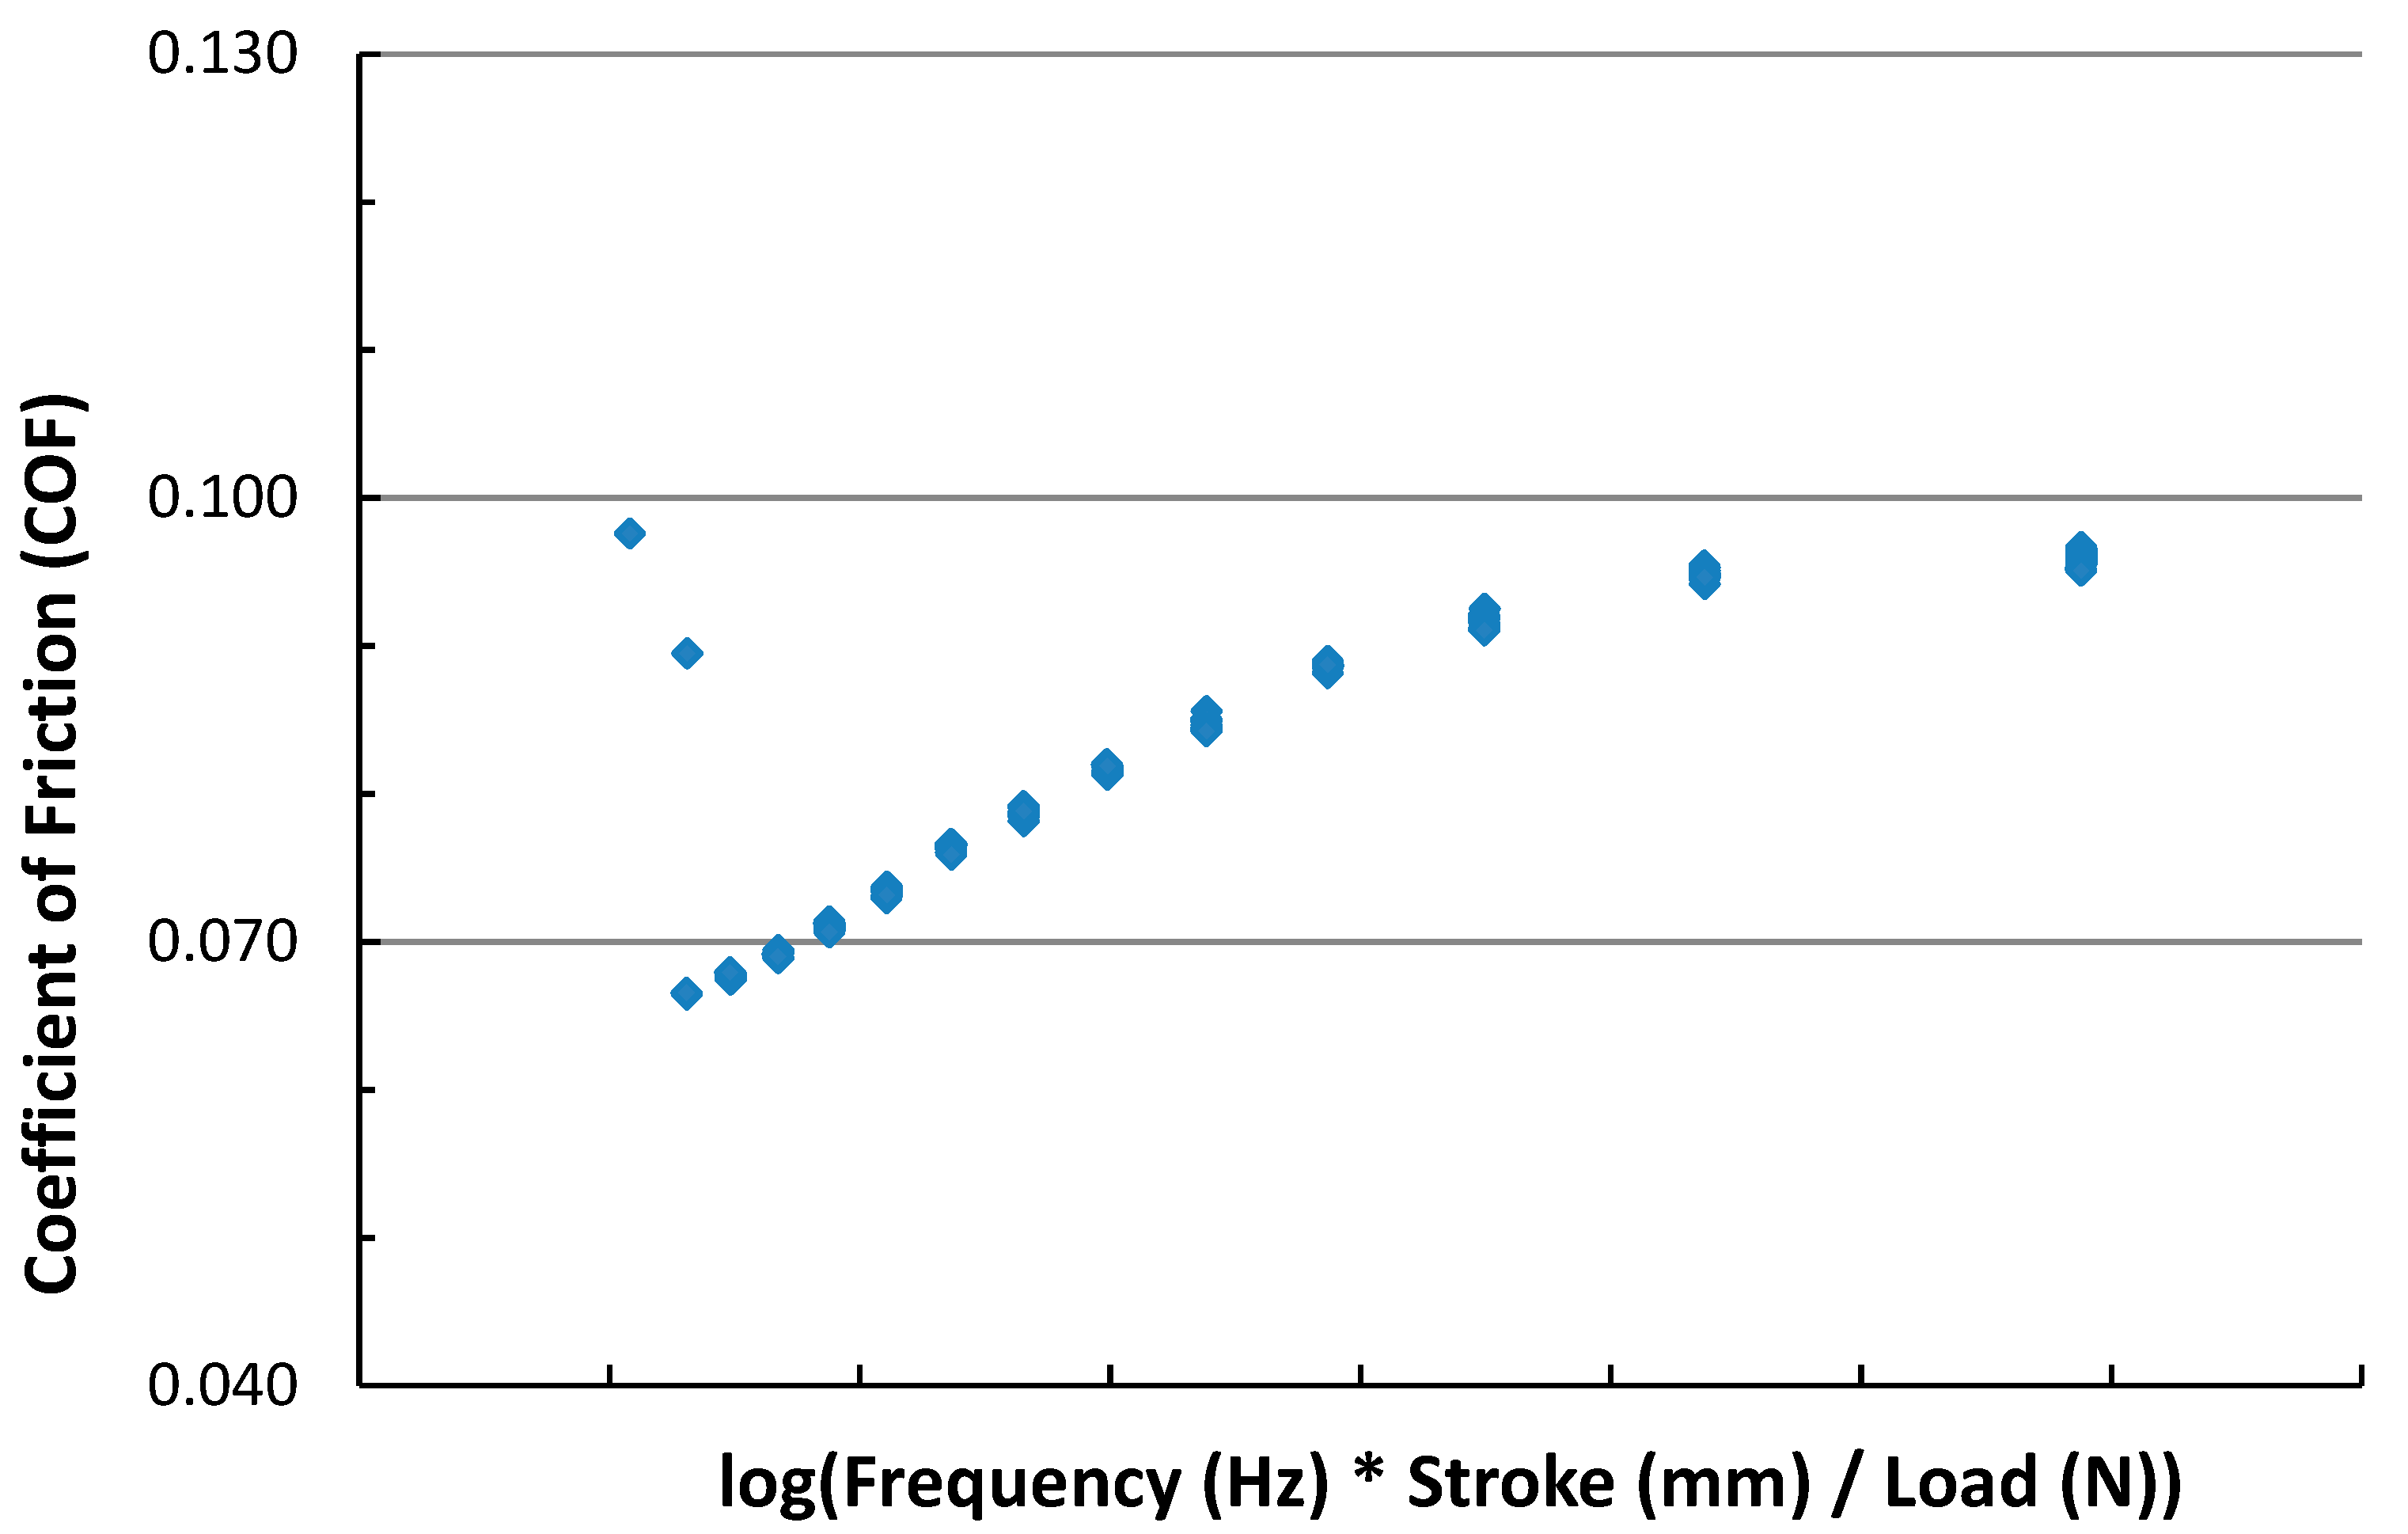
® instrument to determine the accuracy of this theory with oscillatory motion. Considering the oscillatory and reciprocating motion, the sliding speed of Stribeck’s theory is taken as the product of the stroke (mm) and frequency (Hz). If Stribeck’s theory can be applied to the oscillatory motion, a relationship similar to that shown in
Figure 1 should be shown. Data for the test load, frequency, stroke, and coefficient of friction were collected for a step test done on one of the ten lubricants. The COF was plotted as a function of the logarithm of the sliding speed divided by the test load, and this plot is shown in
Figure 7.
Figure 7 shows a relationship that is near to that of Stribeck’s theory. The plot begins at a maximum COF, then decreases as the sliding speed increases or the load decreases. This pattern occurs in the boundary frictional regime, where there is predominantly frictional contact between the two surfaces. Then, a minimum COF value is reached. This occurs in the mixed frictional regime, where there are frictional considerations from both the lubricant and contact between the two surfaces. Then, the COF increases as the sliding speed increase further, or with decreasing load. This occurs in the hydrodynamic friction regime, where the frictional contributions come from the lubricant. However, the Stribeck curve obtained using the oscillatory SRV
® instrument in
Figure 7 is not as smooth as a traditional Stribeck curve, particularly in the low sliding speed and high test load regimes. This is attributed to the nature of the SRV
® test procedure, where the sliding speed is held nearly constant, and the test load is increased incrementally until adhesive failure occurs. The step tests aim to find the maximum load in which adhesive failure occurs, which will happen suddenly in the boundary frictional regime where there is minimal contact lubrication. Additionally, the relationship in
Figure 7 assumes that the viscosity of the lubricant remains constant throughout the test. This assumption is believed to not be a significant source of error, since the viscosity of the lubricant is likely to only change minimally as the temperature only experiences a minor increase throughout the test. In the mixed lubrication regime, changes in the coefficient of friction are generally highly sensitive changes to the film thickness, which varies with the test load [
9]. To achieve a smoother Stribeck curve in the mixed and boundary frictional regime using this instrumentation, perhaps smaller incremental increases in the test load can be made while under high test load, to account for the tribosystem’s sensitivity to changes in lubricant film thickness. Applying Stribeck’s theory to the SRV
® tribometer allows further understanding of the adhesive and lubrication behavior and mechanism of the tribocontact.
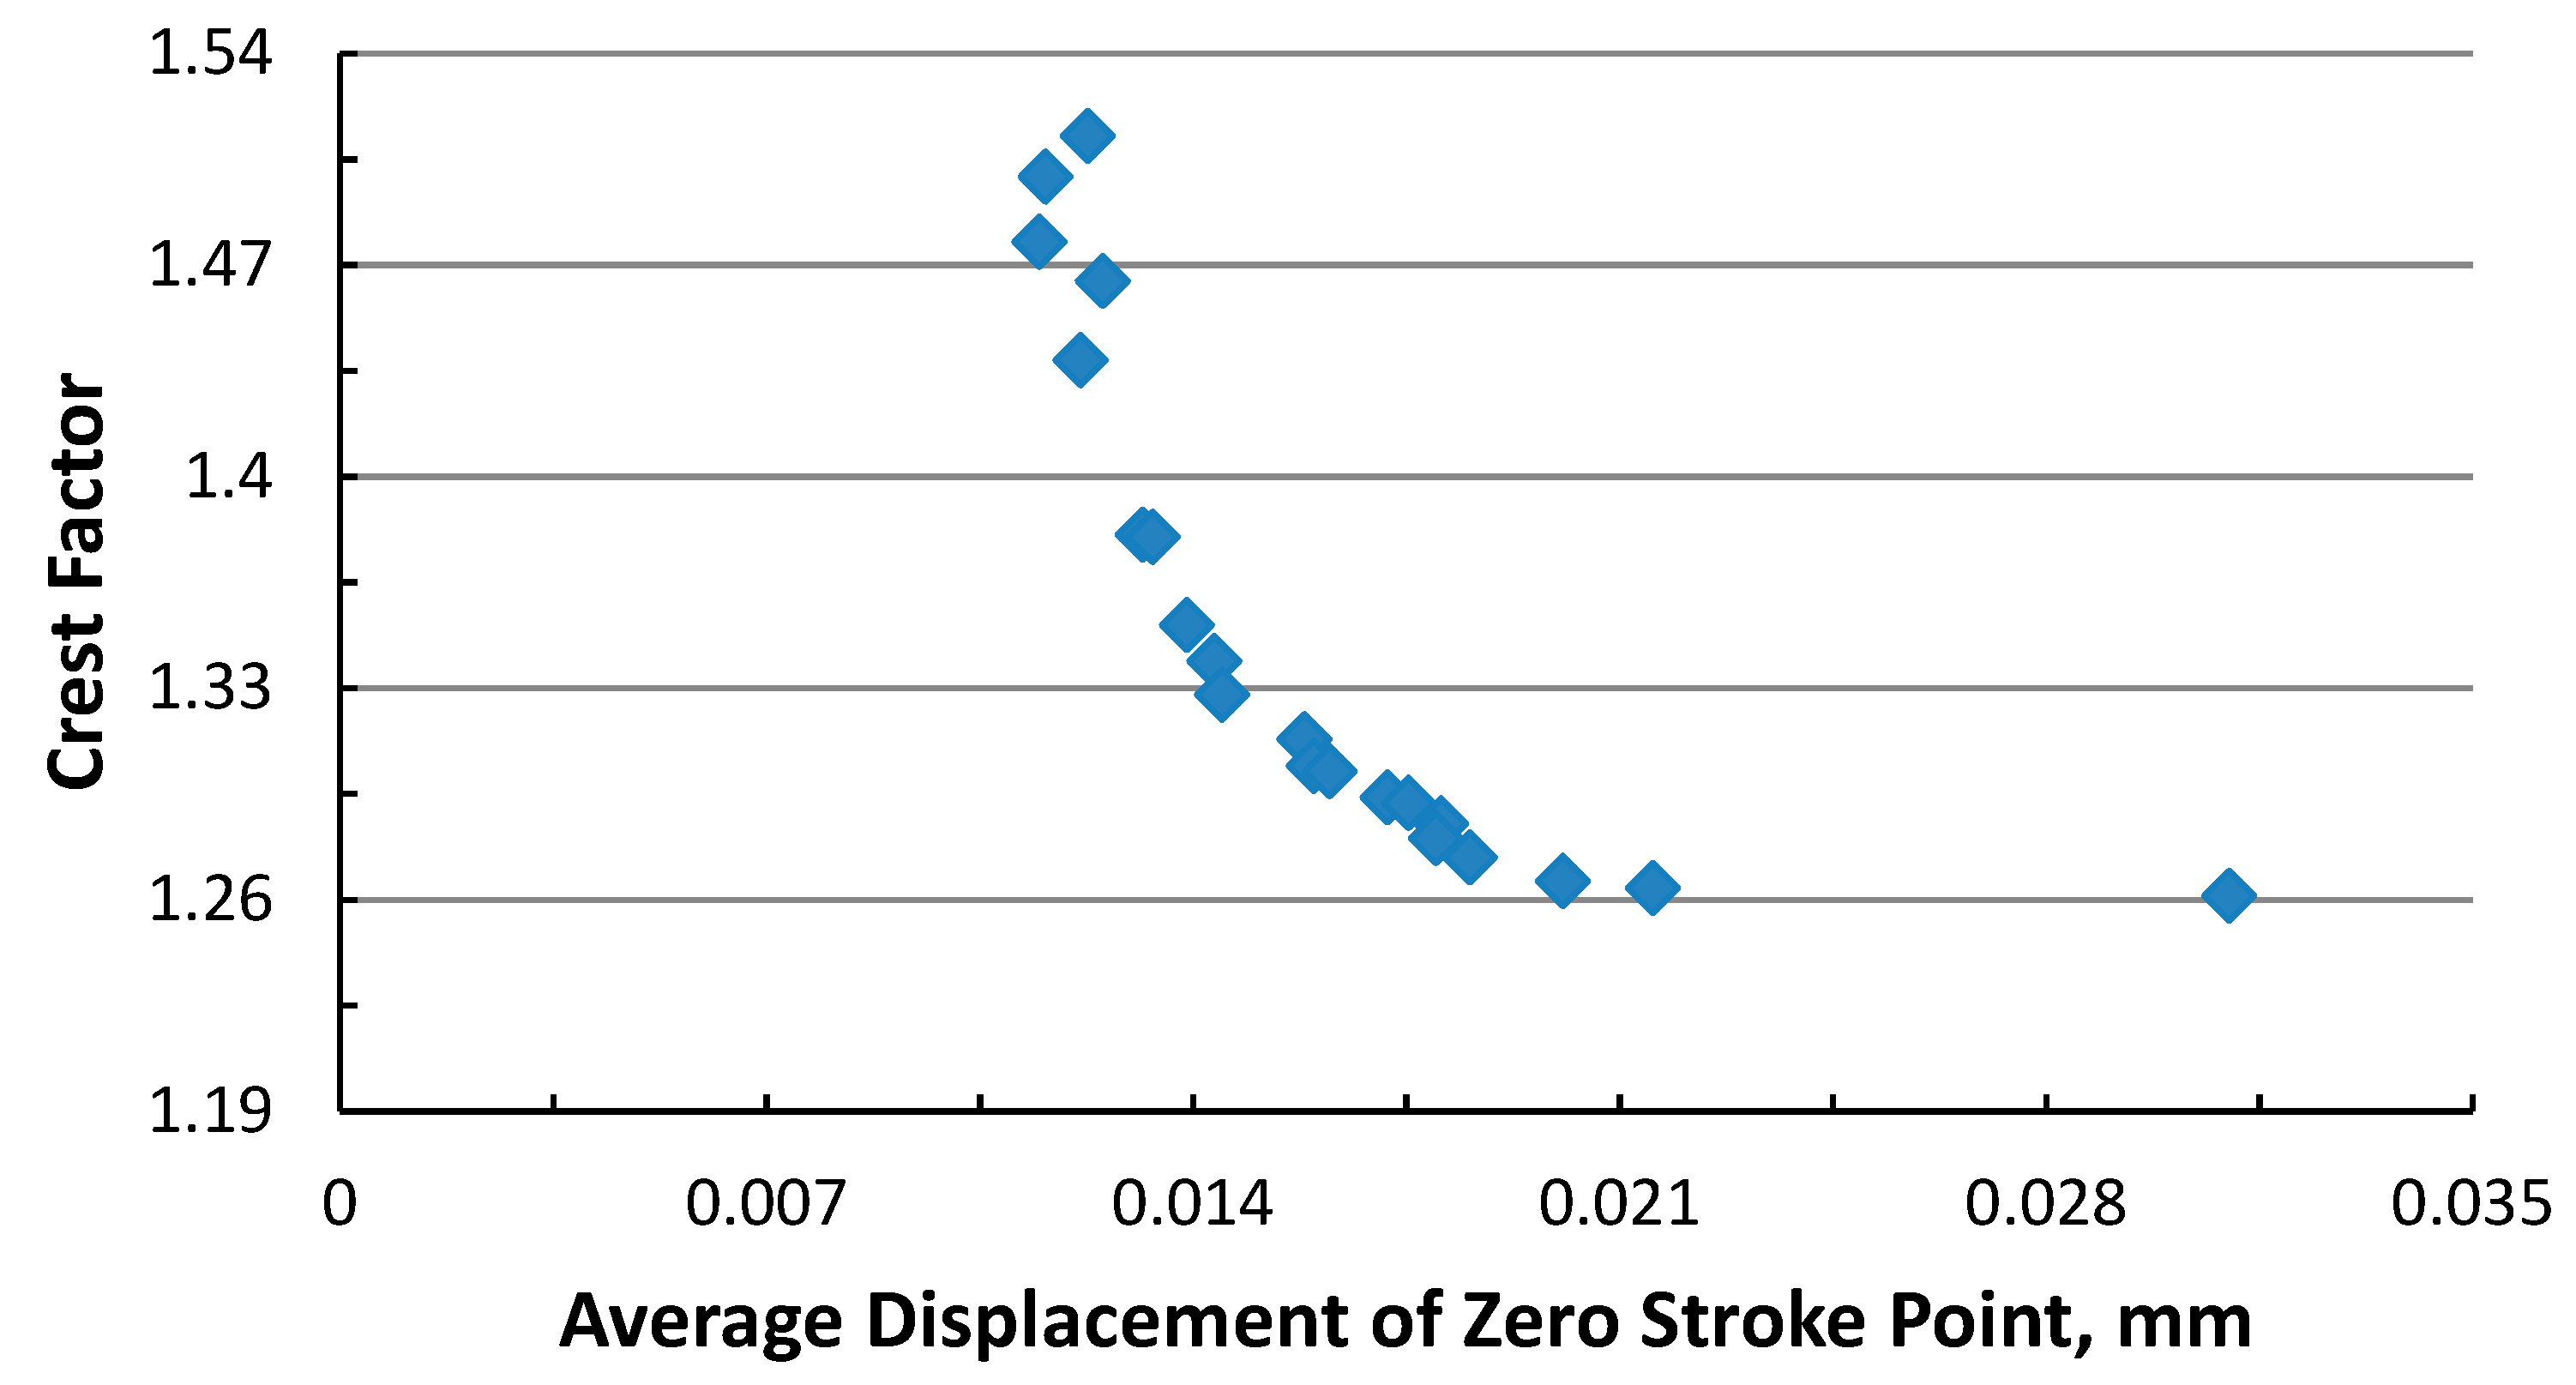
The displacement of the zero-stroke point can also be used to analyze the adhesive behavior of lubricants. The SRV
® instrument can be used to determine how the displacement of the zero stroke point changes as the test load increases. An increase in the displacement of the zero stroke point can indicate an increase in the tribosystem’s friction, which could be attributed to increased surface roughness. As previously mentioned, the crest factor is employed to relate the peak COF to the RMS COF values. A higher crest factor value represents a tribosystem with a more dominant static frictional force, and a lower crest factor represents a tribosystem with a more dominant sliding frictional force. To understand how the displacement of the zero stroke point is influenced by the frictional forces, a plot of the of this displacement and the crest factor is shown in
Figure 8, where the average absolute value of the displacement of the zero stroke point for each increase in test load is shown. The data used in
Figure 8 is from a step test performed on one of the ten lubricants.
As seen in
Figure 8, the crest factor decreases exponentially as the displacement of the zero stroke point increases. This indicates that as the displacement of the zero stroke point increases with each test load, the frictional contributions from the sliding friction force become more prominent, relative to the static frictional force. This potentially occurs due to an increase in surface roughness and a decrease in adhesive effectiveness. By applying the results in
Figure 8 to that of Stribeck’s theory (which can be visualized in
Figure 1), as the displacement of the zero stroke point increases, the tribosystem moves further down the mixed frictional regime as it approaches the boundary frictional regime. As the tribosystem shifts across these regimes, the interaction between the surface contacts increases with reduced lubricant adhesion, which contributes to the increase in the prominence of the sliding frictional force. Moments before failure, the displacement of the zero stroke point suddenly increases, as the sliding frictional forces dominate the frictional force until adhesion failure occurs. By analyzing the relationship of the zero-stroke point and crest factor, the adhesive behavior of lubricants can be explained to a greater extent.
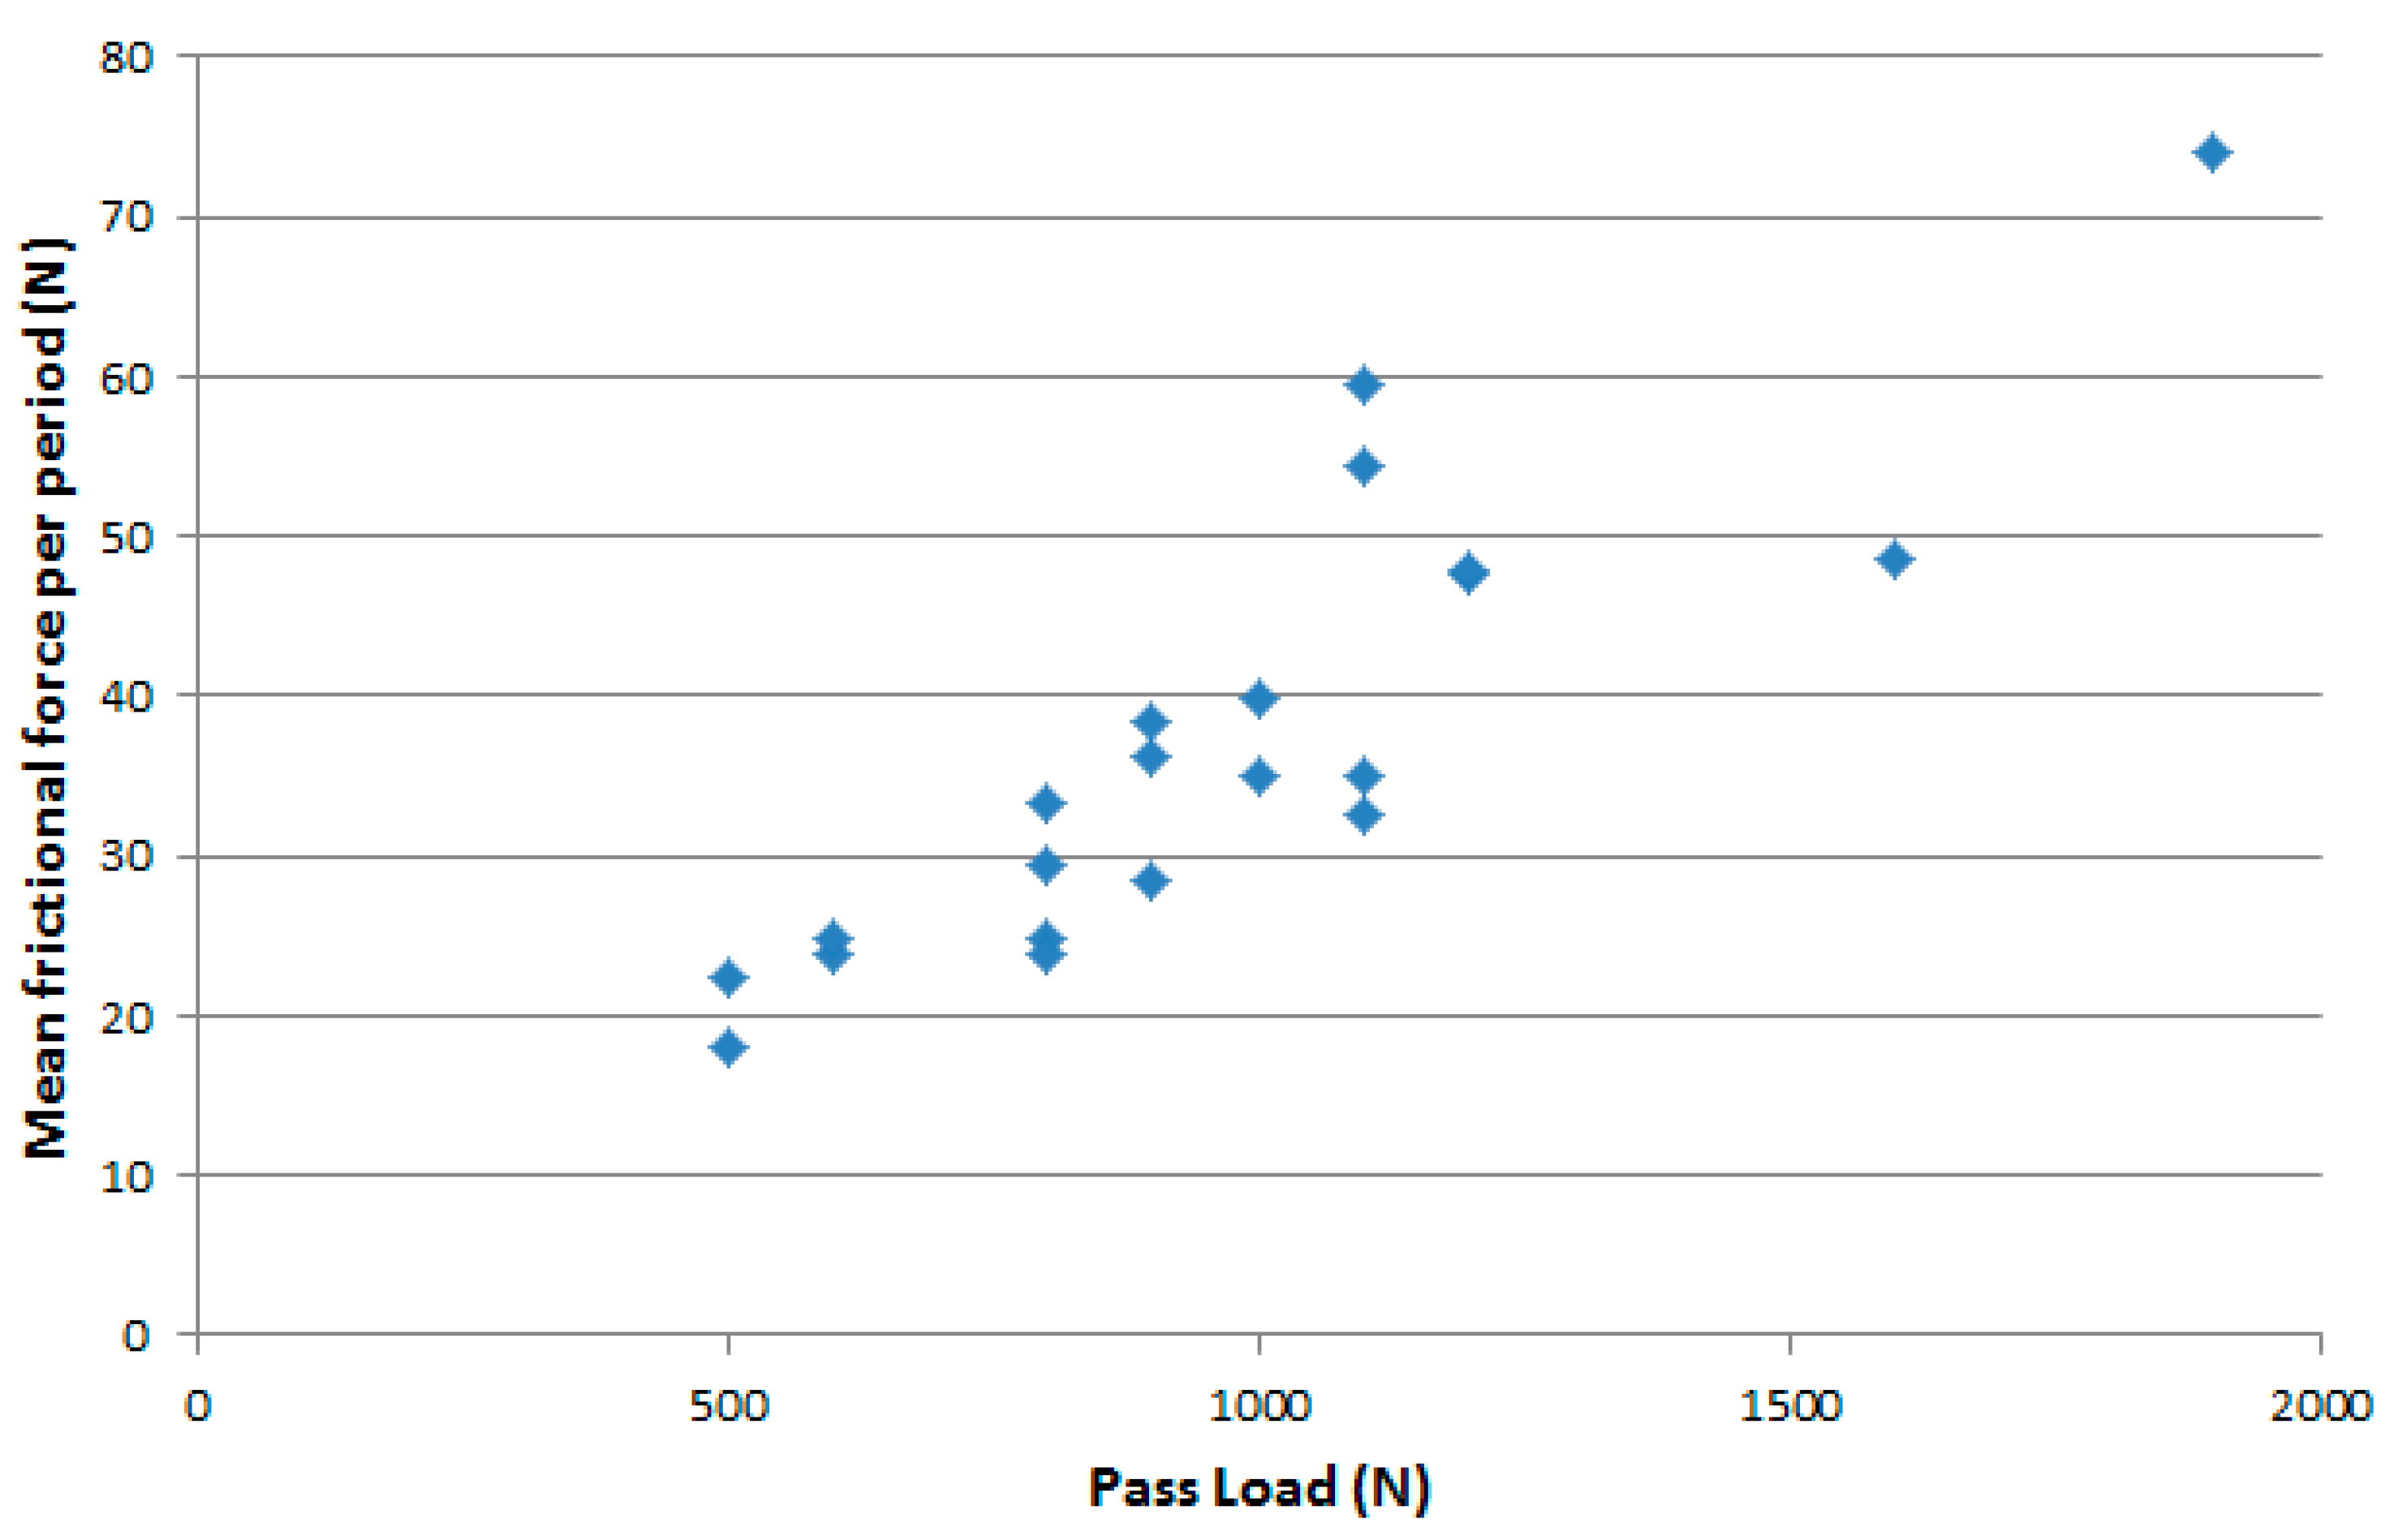
Each of the 10 lubricants used in this study was tested twice. The frictional energy and power losses can be analyzed to further understand the adhesive mechanisms of these lubricants. These frictional losses vary with the pass load, as higher loads are expected to produce larger amounts of frictional energy. A plot of the mean frictional force per period as a function of the pass load is shown in
Figure 9. This plot confirms the anticipated relationship, where increasing the load results in an increase in frictional energy, considering the sliding path per period was held constant.
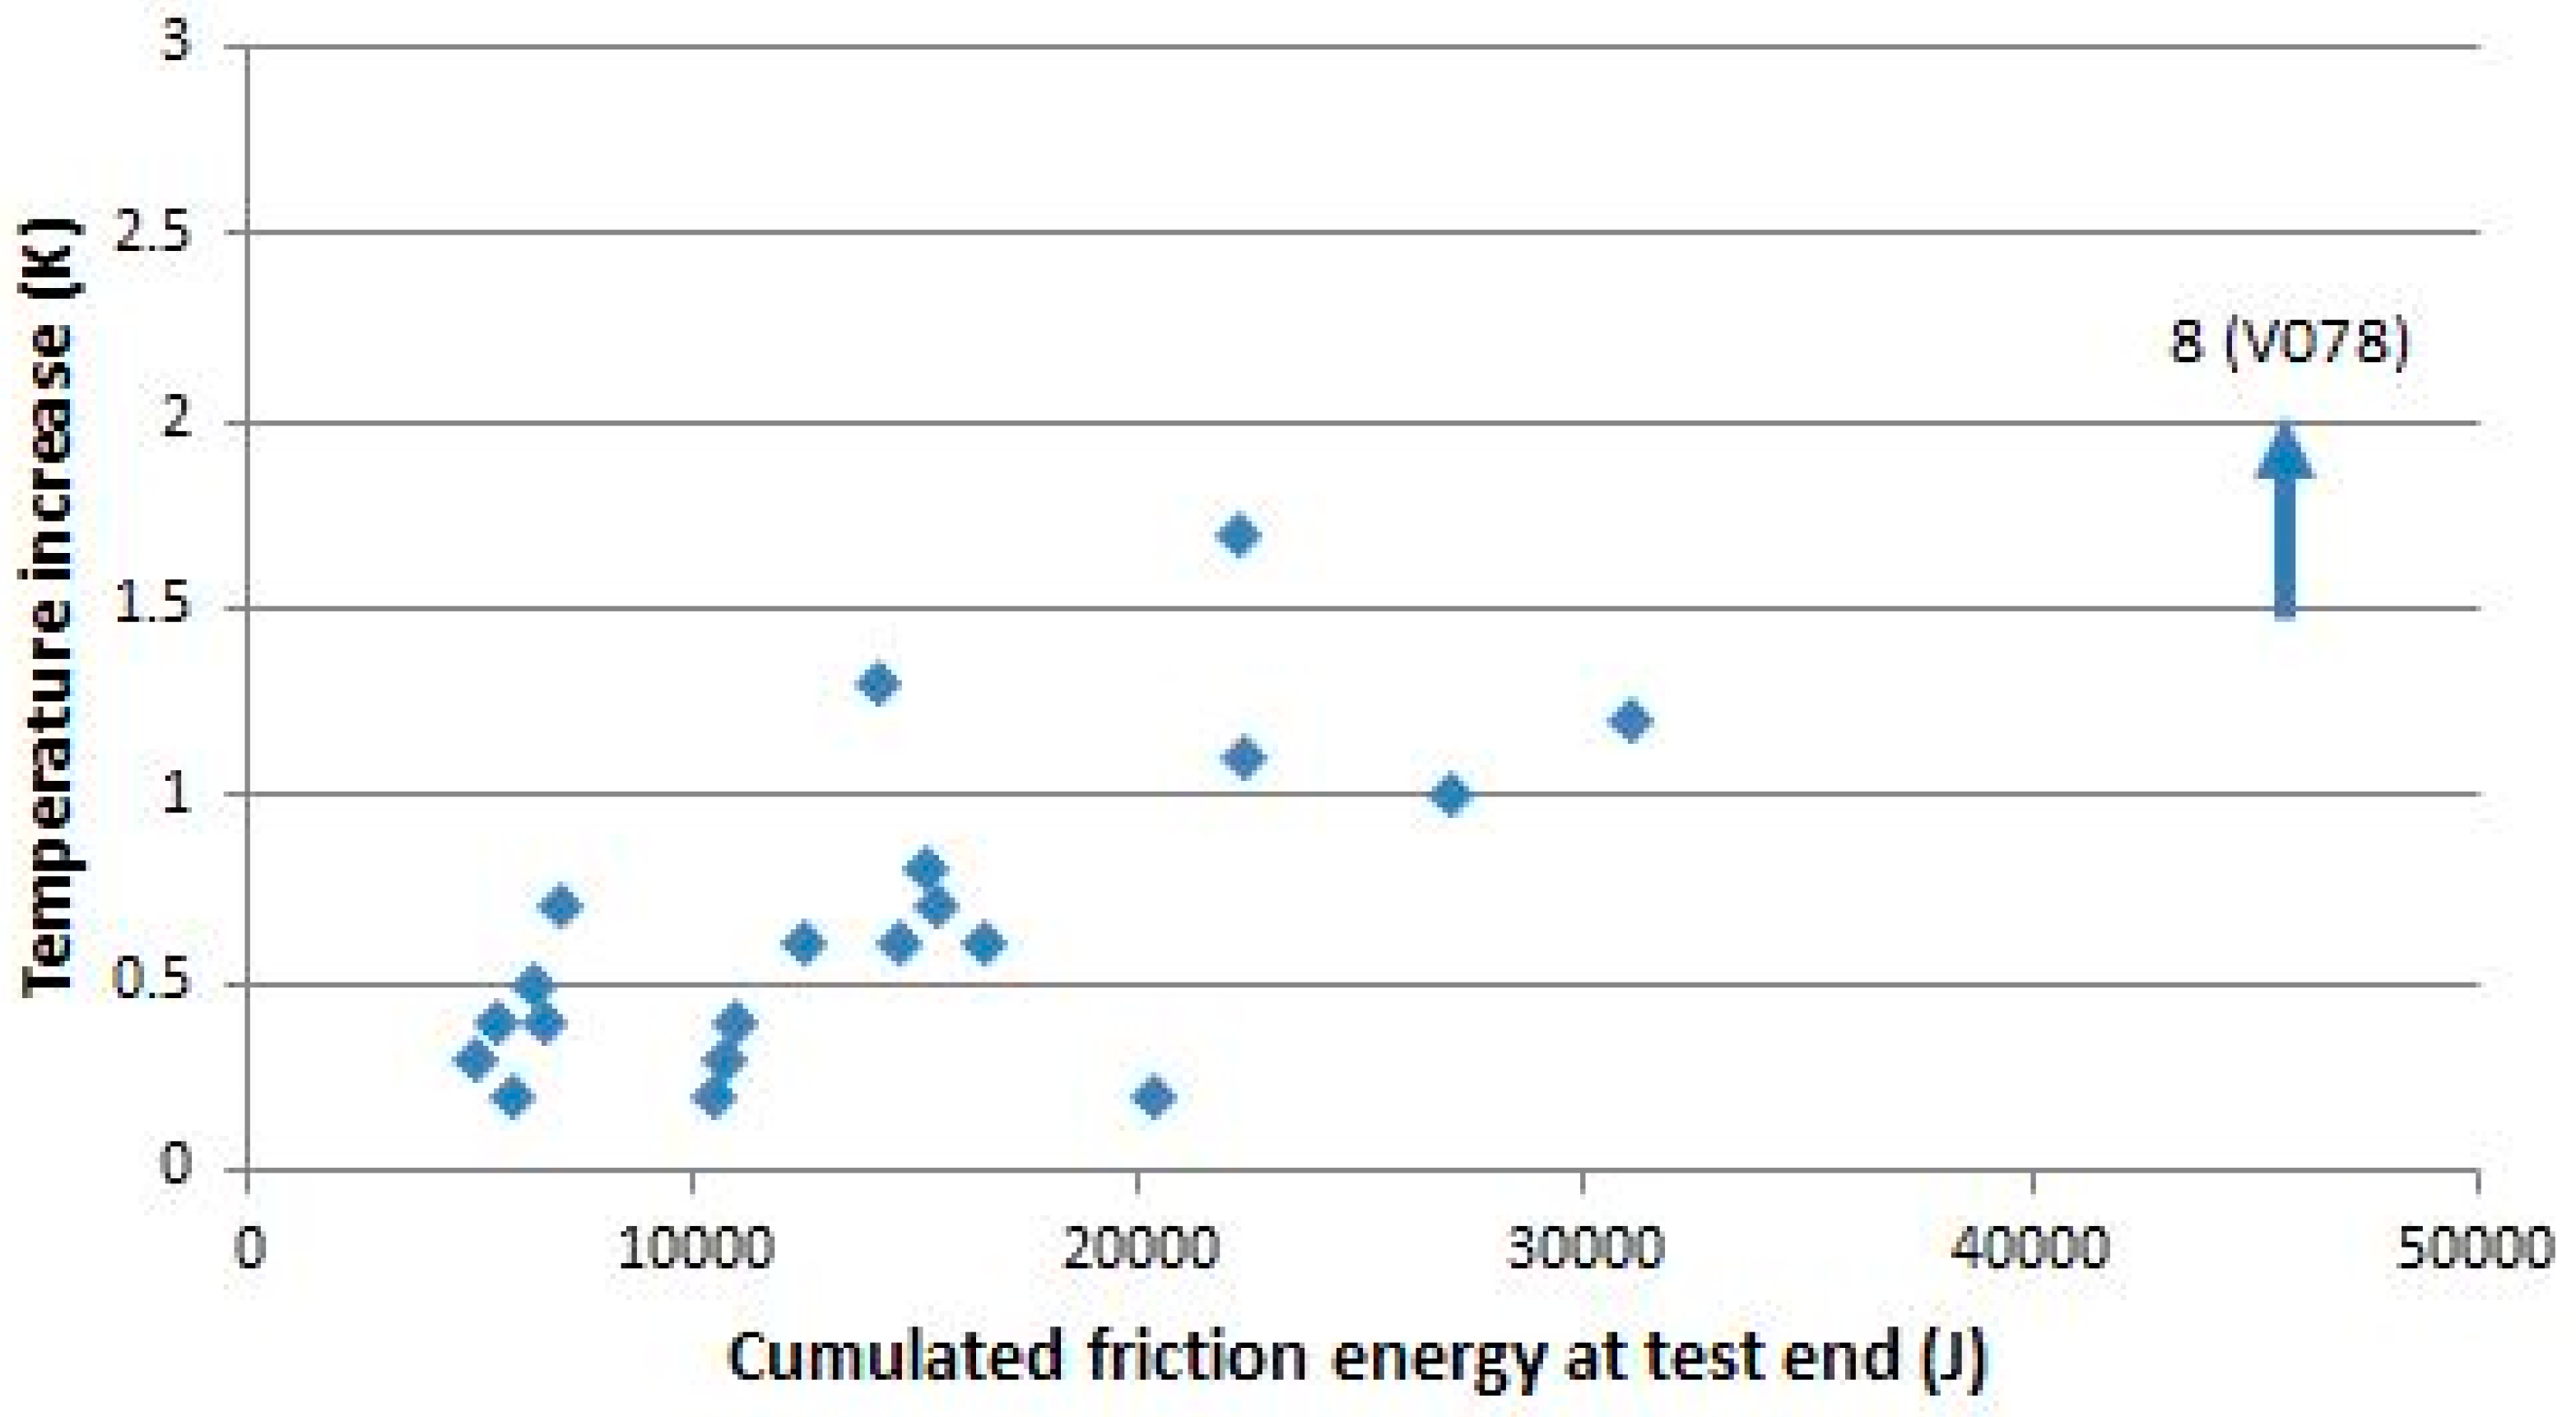
Additionally, some of these advanced correlations were calculated, and the correlation between temperature increase compared to its setpoint value and the cumulated friction energy is shown in
Figure 10. This plot reveals that the temperature in the friction contact goes up in many cases when the energy increases. Obviously, not all tribosystems convert friction to thermal energy in the same way, but most follow this general trend of increasing temperature with more cumulated friction energy.
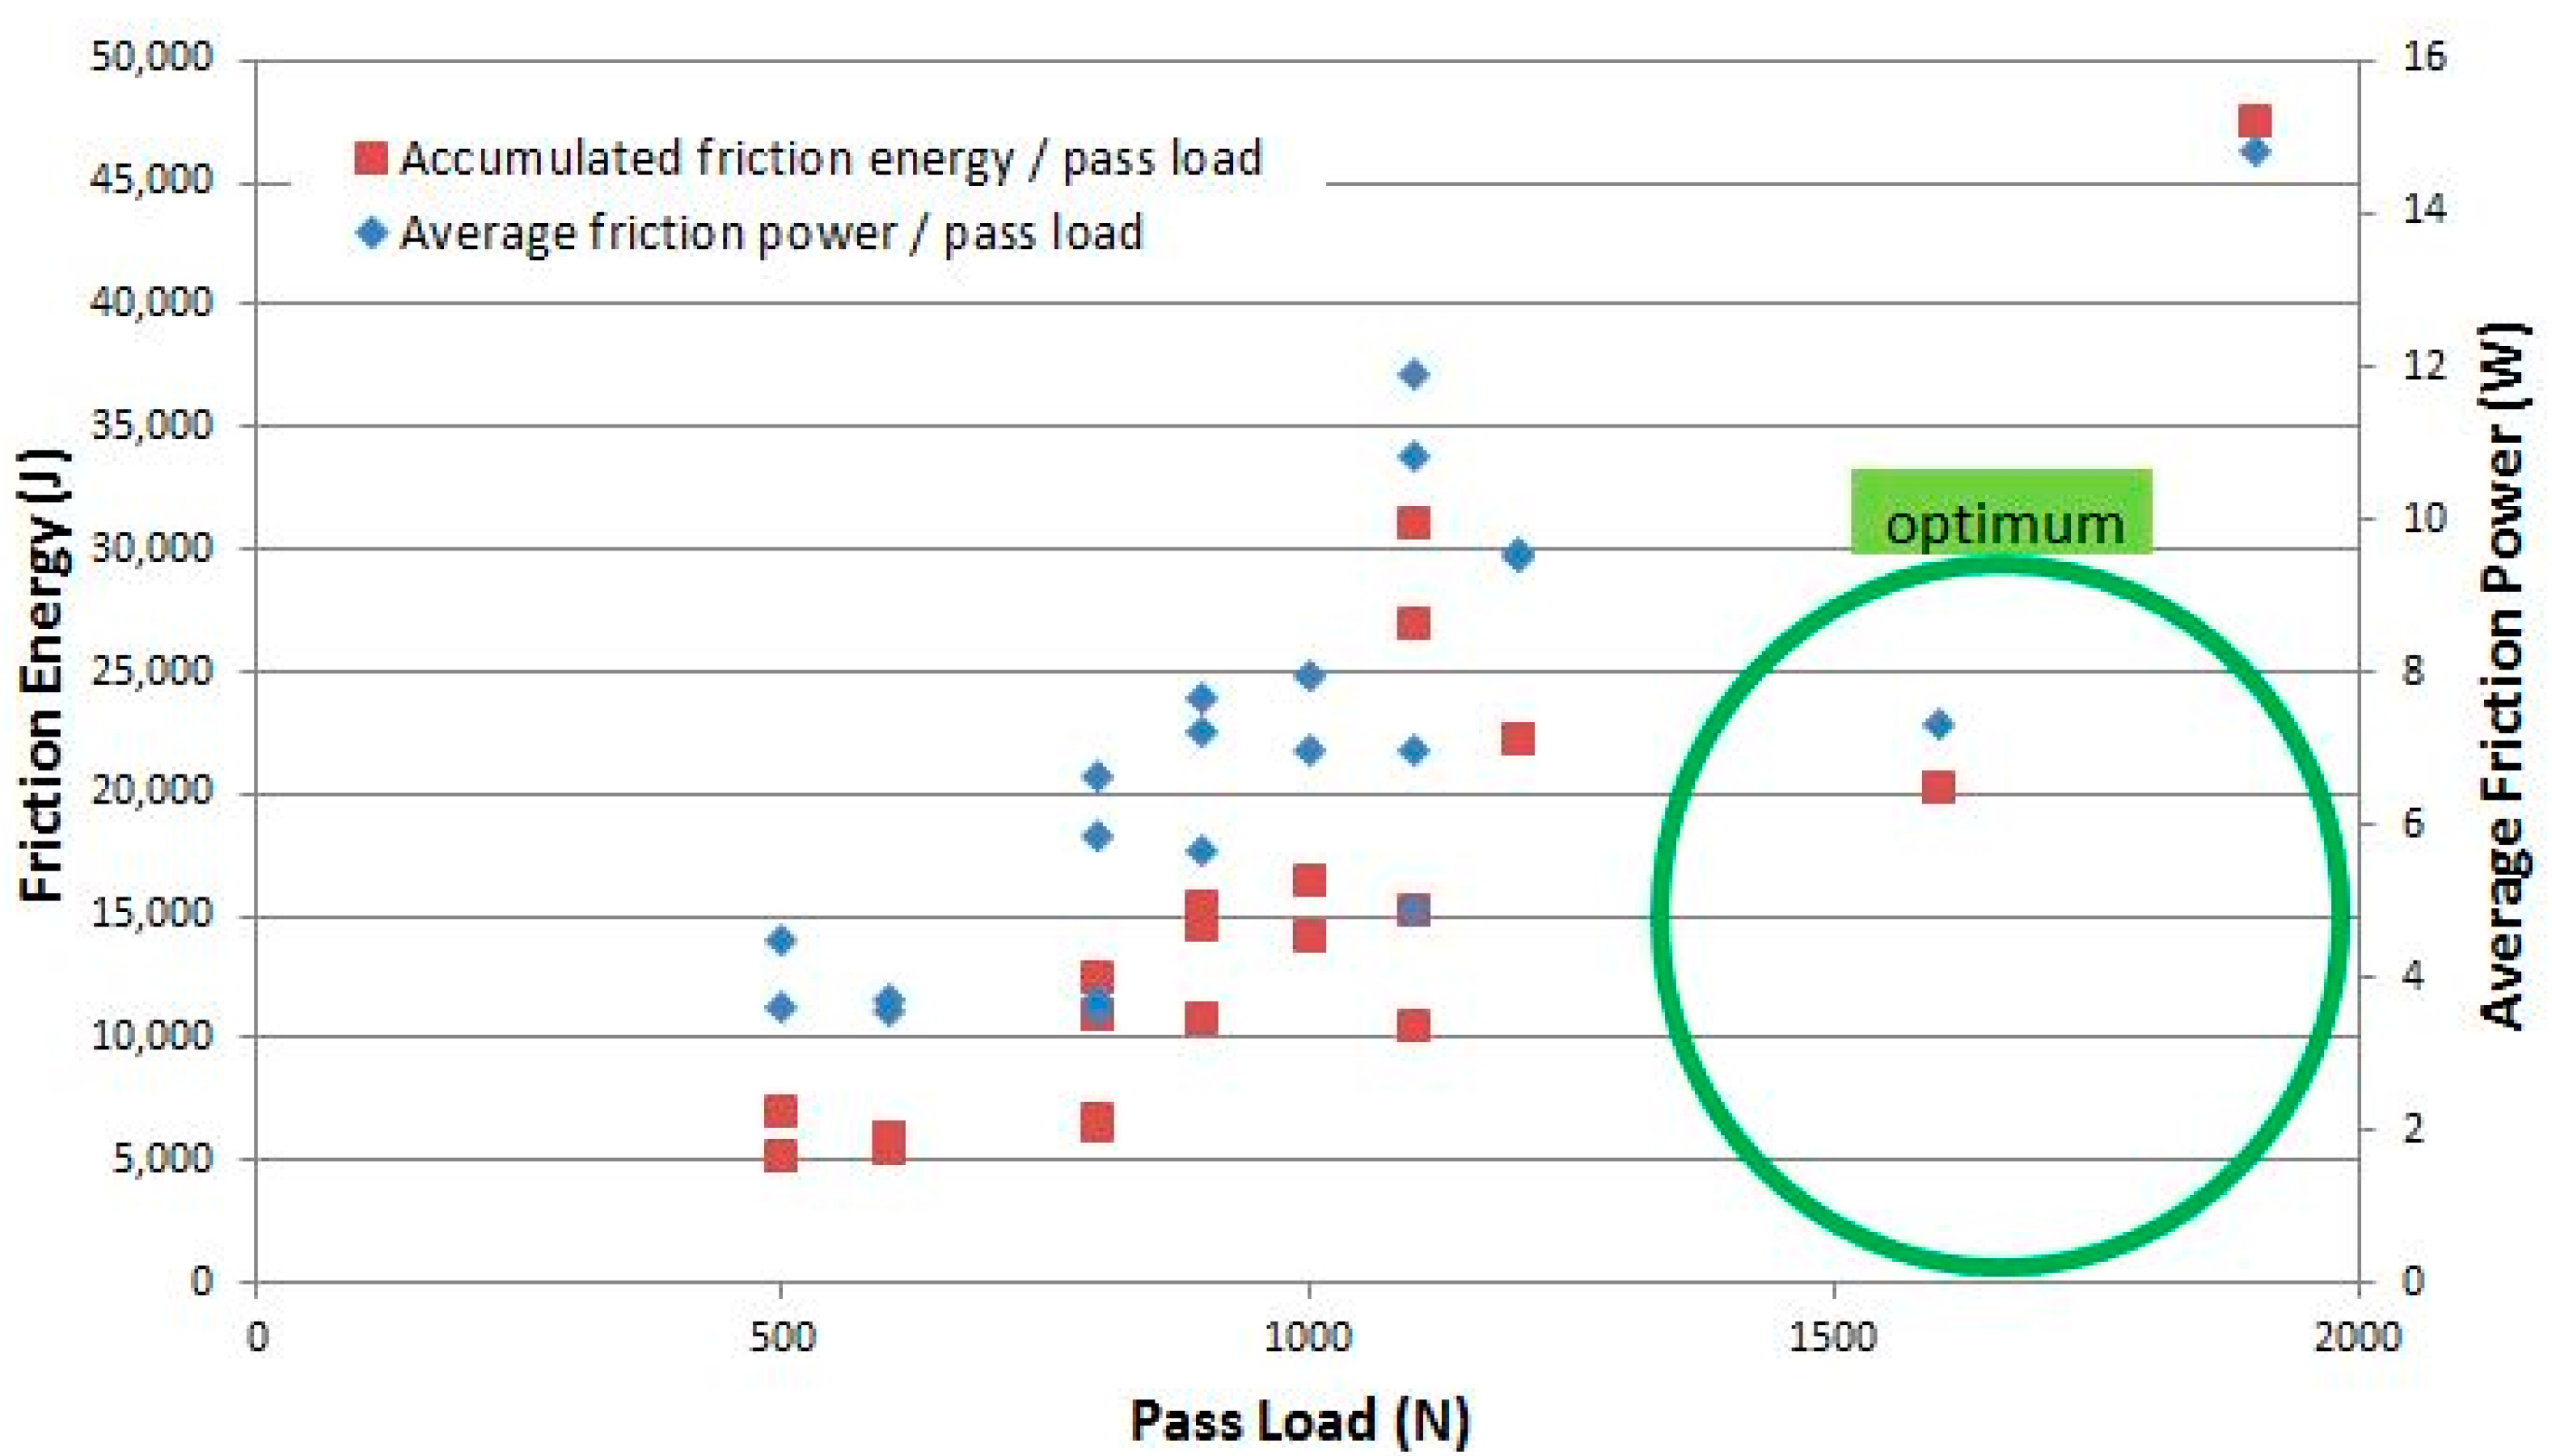
The correlation of friction energy and friction power to the reached pass load shows approaches to a new evaluation option for lubricants. For the highest possible pass load, the lowest possible amount of friction energy should be generated. This would indicate the most efficient operating load for a grease, meaning it has the lowest COF with respect to the load. An example of this relationship for the ten different lubricants is shown in
Figure 11. The optimum area is circled; where the frictional energy and power are lowest with the highest pass loads.
6. Conclusions
By only analyzing the development of the coefficient of friction of a tribosystem, information regarding the adhesive behavior of the lubricant is missed. The presented study illustrates that the SRV® tribometer can provide results that go far beyond an evaluation according to the test standards and allow for significant conclusions to be drawn for research and development. Evaluating factors such as the electrical resistance, zero stroke point, effective COF value, and sliding speed can reveal some of this valuable information to help analyze the tribosystem’s adhesive behavior. Additionally, these factors can derive parameters that can explain the adhesive behavior further, such as analyzing the increase in temperature with respect to the cumulative frictional energy across the test time. Therefore, the SRV® system can identify the occurrence of adhesive failure or other adhesive events more effectively than typical standardized step tests. The SRV® system was shown to be versatile in its applications. It can be used to help research and develop new lubricant formulations by determining optimal tribological properties, such as minimized frictional energy and power with high pass loads. Stribeck’s theory was shown to be applied to the oscillatory motion used in the SRV® tribometer, by slightly modifying the sliding speed in terms of frequency and stroke. Also, the measurement of the displacement of the zero stroke point was used to analyze the behavior of the static and sliding frictional forces as the test load increases.
Author Contributions
Conceptualization, G.P., R.S., and P.I.; data curation, G.P.; formal analysis, P.I.; methodology, G.P.; project administration, R.S.; resources, G.P. and P.I.; supervision, G.P. and R.S.; writing—original draft, P.I.; writing—review and editing, G.P., R.S, and A.S.
Funding
This research received no external funding.
Conflicts of Interest
The authors declare no conflict of interest.
References
- Ellsworth Adhesives. 5 Tips to Avoid Bond Failures - Expert Advice from Ellsworth Adhesives. Available online: https://www.ellsworthadhesives.co.uk/5-tips-to-avoid-bond-failures-blog/ (accessed on 8 February 2019).
- D02 Committee. Test Method for Measuring Friction and Wear Properties of Lubricating Grease Using a High-Frequency, Linear-Oscillation (SRV) Test Machine; ASTM International: West Conshohocken, PA, USA. [CrossRef]
- Quinn, T.F.J. The Role of Wear in the Failure of Common Tribosystems. Wear 1984, 100, 399–436. [Google Scholar] [CrossRef]
- D02 Committee. Test Method for Measuring Friction and Wear Properties of Extreme Pressure (EP) Lubricating Oils Using SRV Test Machine; ASTM International: West Conshohocken, PA, USA. [CrossRef]
- Maru, M.M.; Tanaka, D.K. Consideration of Stribeck Diagram Parameters in the Investigation on Wear and Friction Behavior in Lubricated Sliding. J. Braz. Soc. Mech. Sci. Eng. 2007, 29, 55–62. [Google Scholar] [CrossRef]
- Barriga, J.; Kalin, M.; Van Acker, K.; Vercammen, K.; Ortega, A.; Leiaristi, L. Tribological Performance of Titanium Doped and pure DLC Coatings Combined with a Synthetic Bio-Lubricant. Wear 2006, 261, 9–16. [Google Scholar] [CrossRef]
- Pondicherry, K.S.; Florian, R.; Joerg, L. Extended Stribeck Curves for Food Samples. Biosurf. Biotribol. 2018, 4, 34–37. [Google Scholar] [CrossRef]
- Rosenkranz, A.; Martin, B.; Bettscheider, S.; Gachot, C.; Kliem, H.; Mücklich, F. Correlation between Solid-Solid Contact Ratios and Lubrication Regimes Measured by a Refined Electrical Resistivity Circuit. Wear 2014, 320, 51–61. [Google Scholar] [CrossRef]
- Vlădescu, S.C.; Medina, S.; Olver, A.V.; Pegg, I.G.; Reddyhoff, T. Lubricant Film Thickness and Friction Force Measurements in a Laser Surface Textured Reciprocating Line Contact Simulating the Piston Ring-Liner Pairing. Tribol. Inter. 2016, 98, 317–329. [Google Scholar] [CrossRef]
© 2019 by the authors. Licensee MDPI, Basel, Switzerland. This article is an open access article distributed under the terms and conditions of the Creative Commons Attribution (CC BY) license (http://creativecommons.org/licenses/by/4.0/).


