Article

Biobased Lubricating Oil Prepared from Ethyl Cellulose/Montmorillonite Additives and Waste Cooking Oil

1
College of Material Science and Art Design, Inner Mongolia Agricultural University, Hohhot 010018, China
2
National Forestry Grassland Engineering Technology Research Center for Efficient Development and Utilization of Sandy Shrubs, Inner Mongolia Agricultural University, Hohhot 010018, China
*
Author to whom correspondence should be addressed.
These authors contributed equally to this work.
Lubricants 2025, 13(9), 417; https://doi.org/10.3390/lubricants13090417
Submission received: 22 July 2025 / Revised: 27 August 2025 / Accepted: 12 September 2025 / Published: 17 September 2025

Abstract

Mineral oil-based lubricants contain harmful elements, such as sulfur and phosphorus, pose significant harm to the environment. In current research on the application of waste oils and fats in bio-based lubricants, most studies focus on single pretreatment processes or additive preparation, lacking systematic investigations into the combined use of composite pretreatment and additives on lubricant performance. Moreover, the decolorization efficiency of traditional physical adsorption methods for treating waste oils and fats is limited, making it difficult to meet the raw material requirements for bio-based lubricants. The purpose of this study is to conduct composite pretreatment processes on waste oils and fats, understand the impacts of parameters such as additive dosage and environmental factors on lubricant performance, establish an environmentally friendly and performance-compliant preparation process for bio-based lubricants, and provide a theoretical basis and technical support for its industrial application. Recent studies have shown that new decolorization processes for waste oil treatment significantly improve decolorization and recovery rates, as evidenced by research comparing new and traditional methods. Pretreatment with hydrogen peroxide, activated clay, and activated carbon significantly improved the color and odor of treated waste oil, meeting standards for bio-based lubricant production. The intercalation polymerization reaction between ethyl cellulose (EC) and montmorillonite (MMT) was employed to develop an additive (CTAB-MMT/KH560-EC). A thorough investigation was performed to analyze the impact of temperature, processing time, and additive concentration on the rheological behavior. The bio-based lubricant exhibited a kinematic viscosity of 200.3 mm2/s at 40 °C and 28.3 mm2/s at 100 °C, meeting the standard conditions as outlined in ASTM D2270-10e1. This lubricant achieved an improved low-temperature performance with a pour point of −22 °C, a friction coefficient of 0.081, and an average pitting diameter of 0.94 mm, indicating its suitability for a range of applications. These lubricants exhibit outstanding viscosity characteristics, meeting the relevant requirements for energy and environmental applications in green, eco-friendly, and biodegradable sustainable development strategies while expanding their application scope.

1. Introduction

Lubricating oil is crucial for mechanical operations, serving as a fundamental element that ensures optimal performance and stable operation. In the context of sustainability, low-carbon lubricants are gaining prominence as they contribute to reducing carbon emissions and align with global efforts towards a greener future. In addition to extending service life and reducing friction between components, it also performs cleaning, sealing, and cooling functions [1]. Usually composed of 1–30% additives and 70–90% base oil [2], lubricants comprise high-viscosity and low-volatility hydrocarbons as well as non-hydrocarbon compounds (refer to Table 1 [3,4,5,6] for details). Additives are categorized into antioxidants, extreme pressure agents, friction modifiers, anti-coking agents, corrosion inhibitors, viscosity regulators, detergents, and defoamers. The late 20th-century industrial advancements led to a significant increase in the global demand for lubricants, particularly for high-viscosity, premium-grade base oils, as evidenced by the 2.8% compound growth rate in global lubricant consumption from 2019 to 2023, reaching 41.40 million tons in 2023. Oils are projected to reach 57.3 Mt [5] by 2025. However, modern machinery’s increasingly stringent requirements have led to the replacement of natural animal and plant oils with mineral-based oils, offering superior stability and versatility. Mineral oil-based lubricants, as per various international and national standards, such as NB/SH/T 0822-2010 [7] and HS/T 75-2023 [8], are required to have controlled levels of environmentally hazardous elements like sulfur and phosphorus. Furthermore, conventional lubricant additives predominantly consist of inorganic compounds, resulting in significant environmental risks from waste lubricant disposal [6].
Perera Madhavi et al. [9] developed bio-based lubricants using non-edible oils, agricultural by-products, and waste material. Compared to mineral-based lubricants, these bio-based alternatives demonstrate lower production costs, superior ecological performance, and more excellent tribological properties. Xiangyu Liu et al. [10] introduced an innovative method for fluid property modification and viscosity adjustment through high-concentration inorganic nanoparticles. Using the in situ Stober sol–gel technique, they synthesized a nano-SIO2/PAG suspension with stable, high concentration, and controllable viscosity, which was used as a viscosity regulator for vegetable oil. The study revealed that smaller nanoparticle sizes enhanced thickening effects and viscosity levels. Sharma et al. [11] conducted a series of isomerization modifications on soybean oil using anhydrides with varying chain lengths. Results showed that chemically modified soybean oil-based oils exhibited superior oxidative stability compared to their unmodified counterparts. When mixed with suitable additives, these base oils exhibited oxidative stability comparable to that of mineral oil formulations. Ping Liu et al. [12] synthesized two soybean oil additives modified with boron and nitrogen, namely BNS1 and BNS2, with different chain lengths. Both additives notably enhanced the wear resistance properties of rapeseed oil. Currently, nanometer decanting agent materials primarily employ nano-montmorillonite [13,14], with a focus on solution-blending methods for their preparation. Solution blending and melt blending are combined with organic modification to enhance particle stability in crude oil [15]. Nanometer precipitant in the oil phase provides nucleation sites [16]. By interacting with wax in the oil phase, they improve wax crystal morphology and weaken its network structure. Simultaneously, these nanoscale agents also affect colloids and asphaltenes in the oil. Through providing central nucleation sites, they disrupt the original cross-linking structures of colloids and asphaltenes within the oil. This enables asphaltenes and colloids to maintain their dispersion and stability, thereby minimizing their propensity to aggregate. Consequently, this enhances the rheological properties of crude oil. As global environmental consciousness intensifies, the research and promotion of environmentally friendly lubricating oils has received strong support worldwide, with a projected market size of USD 1.14 billion by 2030 [17]. These lubricants not only fulfill equipment operational requirements but also exhibit rapid biodegradability, contributing to significant ecological advantages. Consequently, developing environmentally sustainable lubricants has emerged as a key area of focus. The conversion of waste oils into bio-based lubricants is increasingly acknowledged as a significant strategy for developing sustainable energy sources, as evidenced by the growing market and technological advancements in recycling processes. One advantage of converting waste oils into bio-based lubricants is that it transforms waste into valuable resources. Waste grease generally comes from frying waste oil generated by the catering industry, as well as by-products produced in the production process of food processing industries such as fried food factories and oil refineries. Through processes like esterification and distillation, waste oils can be processed into bio-based lubricants, while the remaining materials can be repurposed as eco-friendly building materials such as plant-based asphalt or chemical products like detergents [18]. The utilization rate of renewable resources has significantly increased, contributing to the maximization of resource utilization and alleviating the tensions in China’s energy supply [19]. Moreover, converting waste oils into bio-based lubricants not only eliminates their re-entry into food chains but also curbs the illicit production, distribution, and consumption of these oils, addressing the issue at its root. This ensures public health while improving urban environments. On the other hand, utilizing waste oils for bio-based lubricant production reduces raw material costs and decreases dependence on fossil fuels. Hence, they are a crucial raw material for producing bio-based lubricants.
The production of bio-based lubricants from waste oils offers cost advantages but requires advanced processing technology. During repeated high-temperature frying, edible oils’ fatty acids and glycerides produce colored compounds or potential chromophores [20]. Concurrently, proteins and phospholipids decompose into dark compounds. Small molecules, such as aldehydes and ketones, impart the distinctive rancid odor to waste oils. Traditional methods employ activated clay to adsorb pigments and impurities dispersed in oils [21]. Although simple to operate, the complex composition of waste oils prevents effective physical adsorption, leaving residual dark coloration. Research demonstrates that hydrogen peroxide oxidation significantly improves treatment efficiency for dark waste oil feedstocks. This rapid method with high recovery rates provides a viable pretreatment solution for waste oil processing.
Current research on the preparation of bio-based lubricants from waste oils mostly focuses on a single link such as pretreatment technology or additive development, and an integrated and efficient conversion technology system has not yet been built; At the same time, the existing preparation process still has significant shortcomings in environmental friendliness and performance adaptability. Therefore, the development of efficient treatment and resource utilization technology for waste oil and its use as raw material to realize the preparation scheme of high-performance bio-based lubricating oil constitutes the core scientific issue studied in this paper.
This study employs a hydrogen peroxide oxidation method combined with activated clay and activated carbon adsorption to treat waste oils, meeting the raw oil requirements for bio-based lubricants. By utilizing long-chain ethyl cellulose [22] and layered montmorillonite with excellent dispersibility through intercalation polymerization, we developed additives that significantly enhance the kinematic viscosity of bio-based lubricants and reduce their pour point, significantly improving their high-temperature viscosity stability and low-temperature fluidity. This is in line with findings from studies such as those highlighted in Reference [23], which examines the impact of bio-based lubricants on engine performance, and Reference [5], which details the synthesis of bio-based lubricant base oils with superior stability and viscosity-temperature characteristics. Bio-based lubricants have been proven to offer cost-effective solutions with superior viscosity-temperature characteristics and a wide range of viscosity adaptability, making them suitable for a variety of climate zones and application zones. The purpose of this study is to construct an efficient conversion technology system for bio-based lubricating oil using waste oil as raw material by optimizing the waste oil pretreatment process. We explore the preparation methods of additives and their influence mechanisms on key performance indicators of bio-based lubricants, such as viscosity-temperature characteristics and kinematic viscosity range. The ultimate goal is to develop bio-based lubricating oil products with excellent comprehensive properties, namely high cost-effectiveness, wide temperature range and viscosity-temperature stability, and wide kinematic viscosity adaptability, and to expand their applicability in multi-climate regions, thereby promoting the practical application of bio-based lubricating oil.
Based on its environmental friendliness and wide temperature range adaptability, bio-based lubricants have been expanded to light-duty lubrication scenarios for small- and medium-sized machinery, such as agricultural equipment and household generators, and are widely used in industrial equipment auxiliary systems, significantly reducing the risk of food contamination through degradable characteristics.
Table 1. Simplified Information of Selected Base Oils.
TypeIngredientCharacteristic
Synthetic base oilSynthetic base stocks such as poly-α-olefin, synthetic esters, polyethers, fluorosilicones, and phosphate esters.Key Properties: excellent viscosity index, superior low-temperature fluidity (low pour point), high flash point for safety, minimal volatility, oxidation stability and so on;
Drawbacks: poor economic performance, elaborate process required.
Mineral oil base oilElevated boiling point HMW hydrocarbons, non-hydrocarbon constituents, and related compounds.Key Properties: consistent performance, broad applicability, and cost-effective manufacturing;
Drawbacks: finite, and great harm to the environment.
Plant oil base oil [24]Botanical lipids and their modified constituents. Unrefined plant oils and refined vegetable oil products.Key Properties: renewable, easy to degrade, low environmental harm, elevated flash point, exceptional lubricity, and minimal evaporation loss;
Drawbacks: exhibits a limited kinematic viscosity range and demonstrates poor resistance to oxidation.

2. Materials and Methods

2.1. Materials and Reagents

Cetyltrimethylammonium bromide (CTAB), ethyl cellulose (EC), montmorillonite (MMT), anhydrous ethanol (W ≥ 98%), N, N-dimethylformamide (DMF), benzoyl peroxide (BPO), hydrogen peroxide, activated clay, activated carbon, starch, sodium thiosulfate, potassium dichromate, and potassium iodide were purchased from Shanghai McLean Biochemical Technology Co., Ltd. (Shanghai, China).

2.2. Experimental Methods

2.2.1. Waste Oil Lipid Pretreatment

Waste oil underwent pretreatment processes including centrifugal separation, degumming, hydrogen peroxide oxidation, and combined adsorption using activated clay and activated carbon, followed by dehydration drying, all to fulfill the prerequisites for bio-based lubricant production. The study examined the impact of hydrogen peroxide oxidation duration, temperature, and dosage on treatment efficiency, with particular attention to the synergistic effects observed when combining these parameters, as well as the impact of mixing ratios, dosage, temperature, and duration of activated carbon and activated clay on waste oil processing. Both hydrogen peroxide oxidation processes and combined adsorption with activated clay/activated carbon were evaluated using decolorization rate as the key performance indicator.

2.2.2. Preparation of CTAB-MMT/EC Additive

We placed 5 g of MMT in a beaker and stirred it with deionized water in a 70 °C water bath for 30 min until fully dissolved. Then, we added 20% (by dry MMT mass) [25] of CTAB for modification treatment, and continued stirring for 3 h. After the reaction, we first wash the mixture with deionized water, and then wash it with anhydrous ethanol until the supernatant becomes neutral. The resulting CTAB-MMT precipitate was dried and ground for later use.
We prepared the CTAB-MMT and EC suspension in a three-necked flask using DMF as the solvent, and the mass ratio under the absolute dry weight calculation conditions was 1:1 [26]. After 30 min of ultrasound dispersion, stir the mixture under nitrogen atmosphere for 8 h [27,28] with BPO as the initiator. Following the reaction, the precipitate was collected by washing with anhydrous ethanol. The resulting CTAB-MMT/KH560-EC suspension was vacuum-dried for 12 h and ground into powder for subsequent use.

2.2.3. Preparation of Bio-Based Lubricating Oil Through CTAB-MMT/KH560-EC Modification of Waste Oil

Step 1: Accurately weigh 50 g of pre-treated waste oil (feedstock oil) and put it in a clean three-necked flask.
Step 2: Use a constant-temperature digital oil bath (Jiangsu Kexi Instrument Co., Ltd, Xuzhou, China) as a heating instrument. Weigh CTAB-MMT/KH560-EC solutions (0.5%, 1%, 1.5%, 2%, 2.5%, and 3%) according to the required mass ratios. Heat the feedstock oil to target temperatures (120 °C, 150 °C, 180 °C, 210 °C, 240 °C, and 270 °C). Upon attaining the target temperature, introduce the CTAB-MMT/KH560-EC mixture solution and control the reaction time (0.5 h, 1 h, 1.5 h, 2 h, 2.5 h, 3 h, 3.5 h, and 4 h). Maintain the reaction vessel seal to prevent oxygen ingress that could cause oxidation reactions producing insoluble gums and precipitates [29,30,31].
Step 3: Allow the reacted samples to cool in a sealed container, and then filter to obtain the final product.

2.3. Determination of Physical and Chemical Properties of Waste Oil

Determination of physicochemical properties decolorization rate determination.
Spectrophotometric wavelength scanning of waste grease in the range of 400–800 nm shows that waste grease has the maximum absorption value of 520 nm. Using petroleum ether as a reference, the absorbance value of waste oil before and after pretreatment is measured at a wavelength of 520 nm to express the decolorization rate of waste oil:
N   = ( A A 1 ) A   ×   100%
where N is the decolorization rate (%) of waste oil,
  • A is the absorbance of waste oil, and
  • A1 is the absorbance of waste oil after pretreatment.

2.4. Structural Performance Characterization of CTAB-MMT/KH560-EC

Fourier-Transform Infrared (FTIR) Spectroscopy

An appropriate amount of each dried material—pristine MMT, organically modified MMT, ethyl cellulose, and CTAB-modified MMT—was weighed out. Dry it, mix it evenly with potassium bromide and compress it, and test it with ALPHA. The FTIR analysis was conducted under the following conditions: a scan rate of 32 scans per second and a resolution of 4 cm−1, with a test wavenumber range of 400~4000 cm−1.

2.5. Measurement of Rheological Properties of Lubricating Oil

2.5.1. Analysis of Lubricating Oil Kinematic Viscosity

The experiment was conducted in accordance with the GB/T 265-1988 [32] method to determine the sample’s kinematic viscosity. The kinematic viscosity of e was determined using the SYD-265D-1 petroleum product kinematic viscosity tester, which meets the requirements of the Chinese national standard SY/T 5651 [33] and GB/T 265 [32], as well as the ASTM D445 [34] standard. The experimental procedure is as follows: Step 1, select the liquid in the bath. Different temperature control media are used for different test temperatures. When the temperature is between 20 and 50 °C, water is selected, and when the temperature is between 50 and 100 °C, glycerin is selected. Step 2: Select the capillary tube. The selection criteria are as follows: If the sample’s flow time in the capillary tube is below 200 s, select a capillary tube with a smaller internal diameter for measurement. For samples with flow times exceeding 500 s, select a capillary tube with a larger internal diameter. Capillary tubes with flow times between 200 and 500 s provide optimal measurement results. Step 3: After selecting a suitable temperature-controlled medium and capillary diameter, perform four parallel measurements per set to calculate an average value, thereby reducing measurement errors.

2.5.2. Determine the Viscosity Index

The viscosity index indicates the degree to which the viscosity of all fluids changes with temperature. The higher the viscosity index, the less the fluid viscosity is affected by temperature [35]. Tests are conducted and calculations performed in accordance with National Standard GB/T1995-1998 [36], and the viscosity index VI is calculated according to the formulas (2) and (3):
V I   =   ( antilog   N ) 1 0.00715 + 100
N = L og   H L og   U L og   Y
where H is obtained from the kinematic viscosity reference table;
  • U represents the kinematic viscosity of the sample at 40 °C, and the unit is mm2/s;
  • Y represents the kinematic viscosity of the sample at 100 °C, and the unit is mm2/s.

2.5.3. Characterization of the Freezing Point Behavior of Lubricating Oils

The SYP1008-V Petroleum Product Pour Point Tester was tested in accordance with the updated method specified in NB/SH/T 0248-2019 [37], which includes the determination of the cold filter plugging point for diesel and domestic heating fuels. First, the sample was heated in a water bath to 50 ± 1 °C. Subsequently, the test tube, containing the sample and a thermometer, was left to cool naturally at room temperature until it reached 35 ± 5 °C, after which it was immersed in a cold bath. After the temperature of the thermostatically controlled bath box is stable at the set value, tilt the box body at 45 degrees for one minute, and then take out the test tube to check the liquid level stability. The test temperature is raised in 4 °C increments, with the test repeated at each step, until the liquid level shows no movement. This temperature is then noted. A further 2 °C increase is applied. If this final increase causes the level to move, the freezing point of the sample is recorded as the prior temperature at which the level was stationary.
The crystalline morphology of lubricating oil samples was observed using DM2700P polarized optical microscope (Leica, Wetzlar, Hesse, Germany) at a cooling rate of 0.7 °C/min and microscopic photos were taken at 100× magnification with a 1 °C interval.

2.5.4. Friction Wear Test

The instrument required for sample tribological performance testing is the MRS-1J high-frequency reciprocating friction tester shown in Figure 1. This testing machine is a key piece of equipment for determining the friction and wear properties of lubricating oil under laboratory conditions by simulating the reciprocating sliding contact state of the lubricating oil and monitoring the friction force in real time. According to the tested friction and wear properties, the fields that can be applied in this study, such as small- and medium-sized machinery and industrial equipment auxiliary systems, are determined. The selected friction ball is a precision-bearing steel ball with a diameter of 12.7 mm, which underwent long-term grinding at a. The lubrication performance can be evaluated in just a few minutes. The lubricating performance of the lubricating oil was determined by grinding at a rate of 1200 r/min for 30 min under a load of 392 N. The experiment begins by injecting 2 milliliters of the test oil sample into the oil tank, and it is essential that the mating surface between the sphere and gasket remains entirely underwater. The balance rod is installed on the fixture at the top of the instrument, and the load is applied by hanging weights. Upon completion of the experiment, the central computer control system monitors real-time data, including the test temperature, friction coefficient, and humidity ion coefficient, test temperature, and humidity. Following the test, the steel balls were removed and cleaned. Subsequently, the diameters of the abrasion marks were measured along both the X and Y axes, and the mean scratch length (NWSD) was determined using Equation (4):
AWSD   =   X   + Y 2

3. Results and Discussion

3.1. Effect of Hydrogen Peroxide on the Pretreatment of Waste Oil

As shown in Figure 2a, at 40 min, the decolorization rate of waste oil reached 40%. However, as the decolorization process continued and reaction time was extended, the concentration of hydrogen peroxide decreased, leading to substantial oxidation of the reactants, which in turn caused the decolorization rate to gradually reach a plateau. Figure 2b reveals that temperature significantly enhances hydrogen peroxide activity. Optimal decolorization effect occurs around 60 °C, a temperature at which hydrogen peroxide decomposition is approximately 50%, and molecular motion is sufficient to accelerate the contact between oil and hydrogen peroxide, thereby improving decolorization rates. Higher temperatures, however, can eventually lead to a decrease in decolorization efficiency due to potential side reactions or decomposition of hydrogen peroxide. Higher temperatures reduce decolorization efficiency due to excessive decomposition of hydrogen peroxide, which compromises its oxidative decolorization function. Figure 2c demonstrates that, while increased hydrogen peroxide dosage boosts free hydroxyl groups in the solution, facilitating pigment polymer degradation, excess hydrogen peroxide itself reacts rapidly with hydroxyl groups to form colored compounds. This indicates an optimal dosage [38]. At 60 °C, using 6% hydrogen peroxide, a decolorization rate of 45% was achieved. However, according to research, increasing the temperature to 90 °C and using a higher concentration of hydrogen peroxide (30%) can significantly enhance the decolorization rate, reaching up to 82.2%.

3.2. Influence of Activated Clay and Activated Carbon on the Treatment Effect of Waste Oil

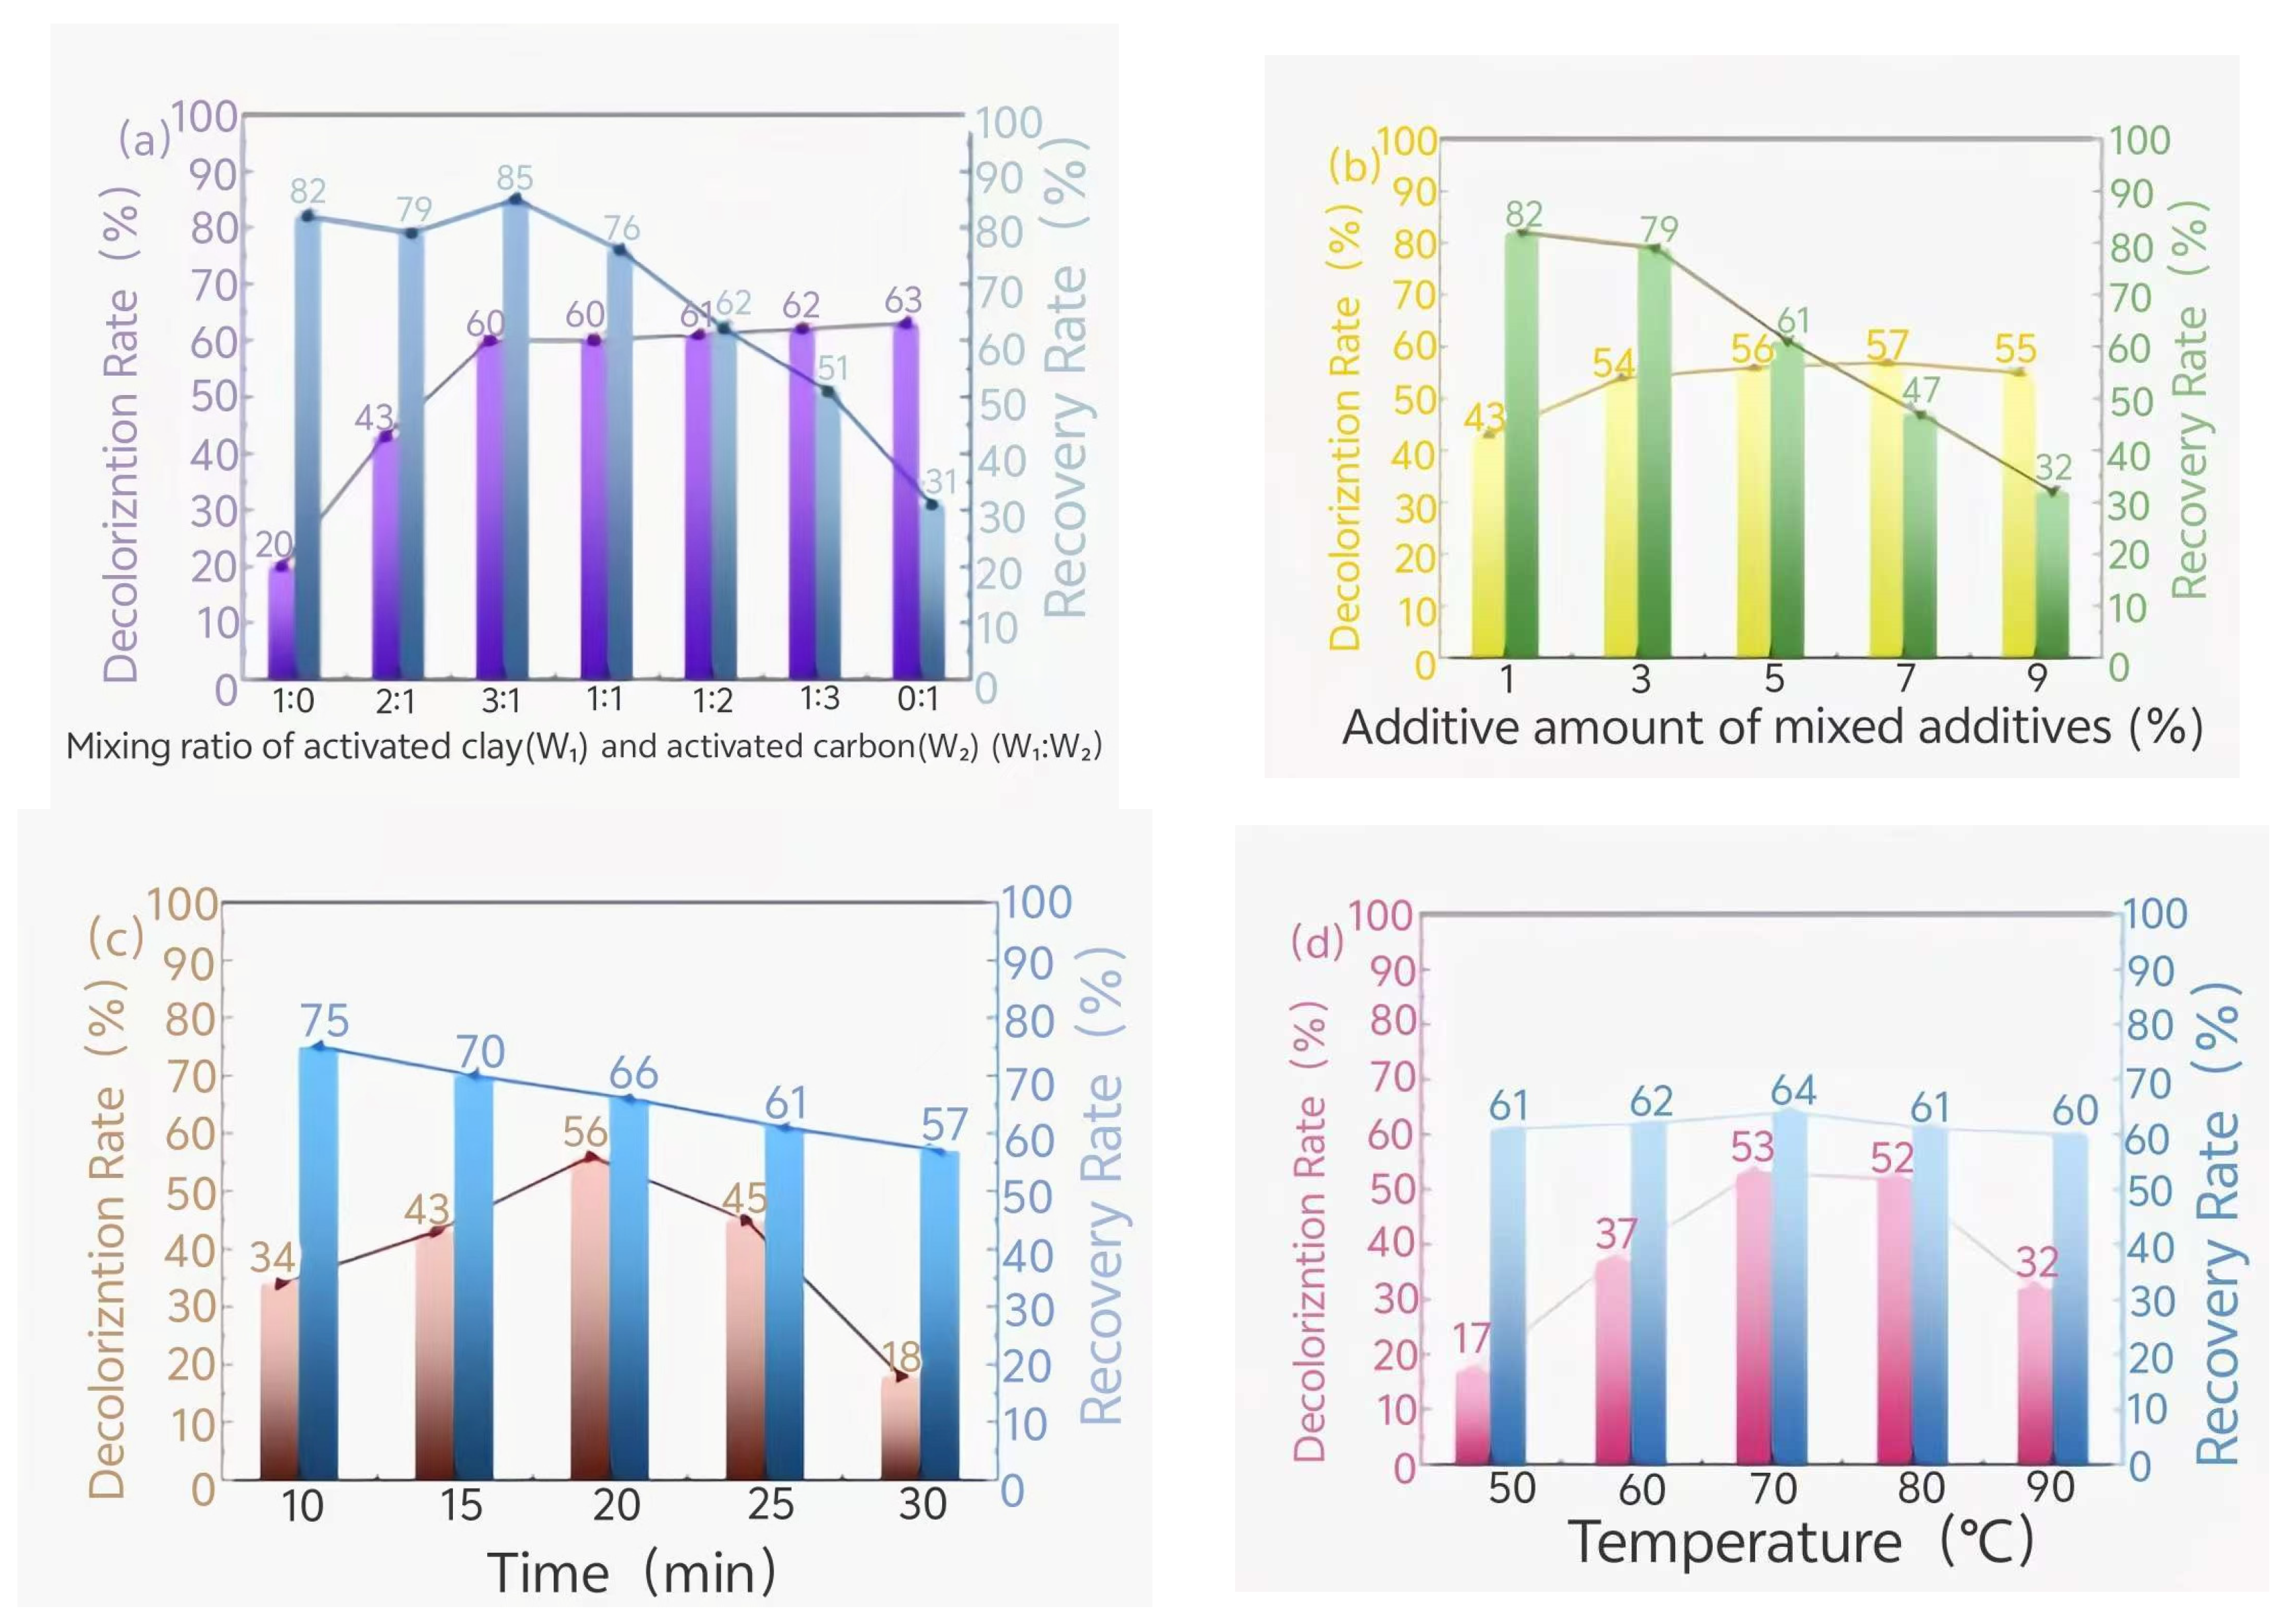
As shown in Figure 3a, using activated clay alone for decolorizing waste oil yields only 20% decolorization efficiency. While activated carbon achieves 70% decolorization, it simultaneously adsorbs substantial oil content, reducing recovery to 30%. A certain proportion of activated clay and activated carbon are mixed to treat the waste oil, and the treatment effect is obvious. After comprehensive evaluation, a mixture in a 3:1 ratio achieves 60% decolorization and 85% oil recovery. Figure 3b demonstrates that the optimal adsorbent mixture comprises 3% of the oil’s weight. Figure 3c shows that decolorization rates increase with time between 10 and 20 min, as prolonged contact boosts adsorption efficiency. However, beyond 20 min, decolorization decreases due to saturated adsorption capacity, leading to accelerated oxidation and subsequent color darkening. Recovery also gradually decreases. Figure 3d demonstrates temperature-dependent decolorization: lower temperatures reduce viscosity and decolorize inefficiently, whereas higher temperatures decrease viscosity, improving adsorption efficiency through enhanced pigment–matrix contact. When the temperature exceeds 70 °C, the decolorization rate of waste oil actually decreases with rising temperatures. This phenomenon may occur because higher temperatures accelerate the desorption process between adsorbents and oil pigments, significantly reducing decolorization efficiency. Additionally, elevated temperatures tend to cause rapid evaporation of free moisture in adsorbents, leading to loss of surface activity and diminished adsorption performance. Therefore, the optimal treatment conditions for waste oil are as follows: a 3:1 ratio of activated clay to activated carbon mixture, 3% additive content based on oil weight, 20 min mixing time, and 70 °C temperature.

3.3. Comparison of Main Indexes Before and After Waste Oil Treatment

From the content of Table 2, it can be seen that the acid value of the waste oil after processing is increased due to hydrogen peroxide oxidation. Furthermore, triglyceride hydrolysis results in the production of free fatty acids, which further elevate acid levels. The peroxide value, a key indicator of lipid oxidation, reflects the extent of peroxide formation, which is influenced by storage conditions such as temperature and light exposure. Value, an indicator of lipid oxidation, reflects the forma. Although the process is irreversible, pre-treatment can notably decrease the peroxide content in waste oils. Pre-treatment significantly reduces peroxide content in waste oils. Saponification value indicates fatty acid chain length (molecular weight), which decreases with multiple processing steps without compromising oil properties. Waste oils contain relatively low water and phospholipids. Furthermore, from a visual perspective, the waste oil appears as a dark brown, turbid liquid. Following pretreatment, the color of the waste oil has been notably enhanced from its initial dark brown to a light yellow, and the strong odor has been eliminated, aligning with the standards for the preparation of environmentally friendly bio-based lubricating oils.

3.4. Structural Characterization of CTAB-MMT/EC Composites

3.4.1. FTIR Characterization

Figure 4 shows the CTAB-MMT/KH560-EC composites with different CTAB molar ratios and the FTIR spectra of pure MMT and EC. The infrared spectrum exhibits peaks at 2926 cm−1 and 2855 cm−1, which are indicative of the successful grafting of CTAB onto the MMT surfaces, as these peaks correspond to the characteristic stretching vibrations of alkyl chains 2855 cm. The reduced intensity of the absorption band at 1036 cm−1 is attributed to the Si-O stretching vibration. As observed by FTIR-ATR, the intercalation of EC molecules within the MMT nanosheet structure formed coordination or complexation with Si-O groups upon increasing the CTAB dosage to a level of 20%. At a CTAB loading of 20%, the characteristic peak intensity of CTAB-MMT/KH560-EC at 2926 cm−1, 2855 cm−1, and 1611 cm−1 was significantly enhanced, and these spectral features changes closely corresponded to the EC molecule’s characteristic vibrations: the band at 2894 cm−1 is assigned to C-H symmetrical stretching, the one at 1611 cm−1 to O-H bending, and the complex band at 1056 cm−1 arises from overlapping C-C, C-OH, and C-H stretching modes. The FTIR features demonstrate that CTAB’s intercalation facilitated more EC molecules into MMT’s interlayer structure, ultimately forming an intercalated CTAB-MMT/KH560-EC nanocomposite. This outcome provides crucial structural insights for optimizing composite material properties.

3.4.2. Scanning Electron Microscope Analysis

Figure 5 presents SEM micrographs of the samples before and after MMT modification. Figure 5A shows that the unmodified MMT presents a typical coalescent lamination morphology, and the lamellar structure is closely packed. In contrast, Figure 5B shows that, after CTAB modification, the lamellar structure of OMMT is obviously dispersed, indicating that the composite modification of CTAB and EC promotes the delamination and exfoliation of MMT, resulting in the expansion of montmorillonite layer spacing (this phenomenon was further verified in subsequent XRD analysis). Additionally, the edges of delaminated MMT exhibit pronounced aggregation and overlapping, likely due to bridging effects between modified particles caused by EC addition. As shown in Figure 5C, EC is uniformly distributed across the surface and interlayer structures of MMT, demonstrating its effective dispersion capability. Notably, the CTAB-MMT/KH560-EC composite maintains intact lamellar structure with uniform dispersion, further confirming the effectiveness of the modification process.

3.4.3. XRD Analysis

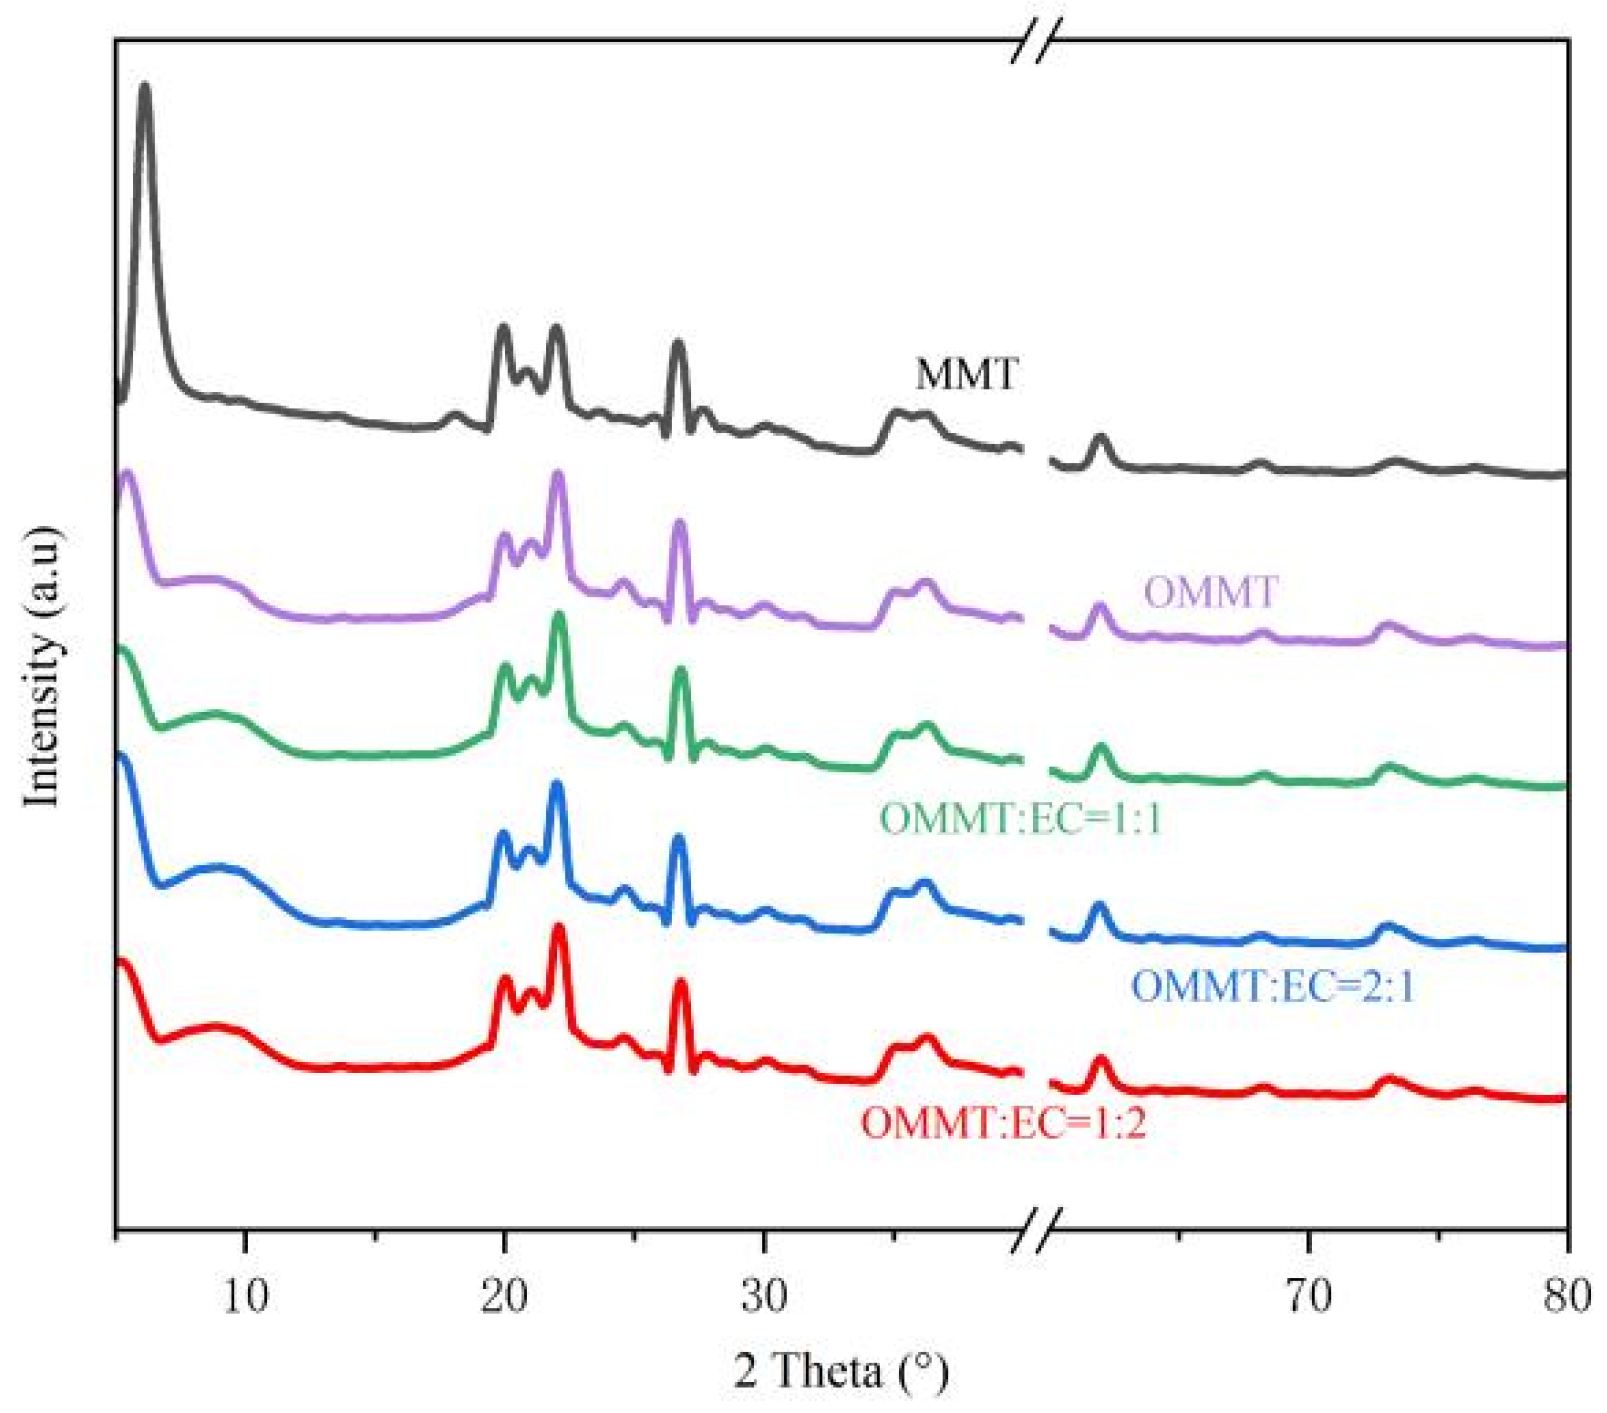
As can be seen from Figure 6, the characteristic diffraction peak of montmorillonite (MMT) is observed at 2θ = 6.02°, which aligns with the typical diffraction pattern for this mineral, as confirmed by XRD analysis. This corresponds to the characteristic diffraction peak of montmorillonite (MMT). According to the Bragg equation (n λ = 2dsinθ), the calculated interlayer spacing d of MMT is 1.371 nm. SEM image analysis confirms that the modified montmorillonite maintains a uniform dispersion and nanoscale lamellar structure, further verifying MMT’s typica. The diffraction peak characteristic of this material shifts to 2θ = 5.26°, corresponding to an expanded interlayer spacing d of 1.674 nm, which is consistent with the increased interlayer distances observed in montmorillonite after organic modification, as evidenced by studies showing interlayer expansions to 2.045 nm. The increased interlayer spacing indicates successful grafting of CTAB onto MMT. The XRD profile of CTAB-MMT/KH560-EC exhibits a further shift in the characteristic diffraction peak of MMT to 2θ = 5.02°, indicating an increased interlayer spacing d to 1.784 nm, as determined by the Bragg equation. This result demonstrates successful intercalation of EC into MMT’s lamellar structure. Combined with FTIR, SEM, and XPS characterization, the successful synthesis of CTAB-MMT/KH560-EC is confirmed. Additionally, CTAB-MMT/KH560-EC samples were prepared using OMMT:EC ratios of 1:2 and 2:1. XRD analysis showed that the interlayer spacing of the two proportions of additives was almost the same as that of OMMT:EC = 1:1 CTAB-MMT/KH560-EC additives, which further verified the effective intercalation of EC between MMT layers and the stability of the structure.

3.4.4. XPS Analysis

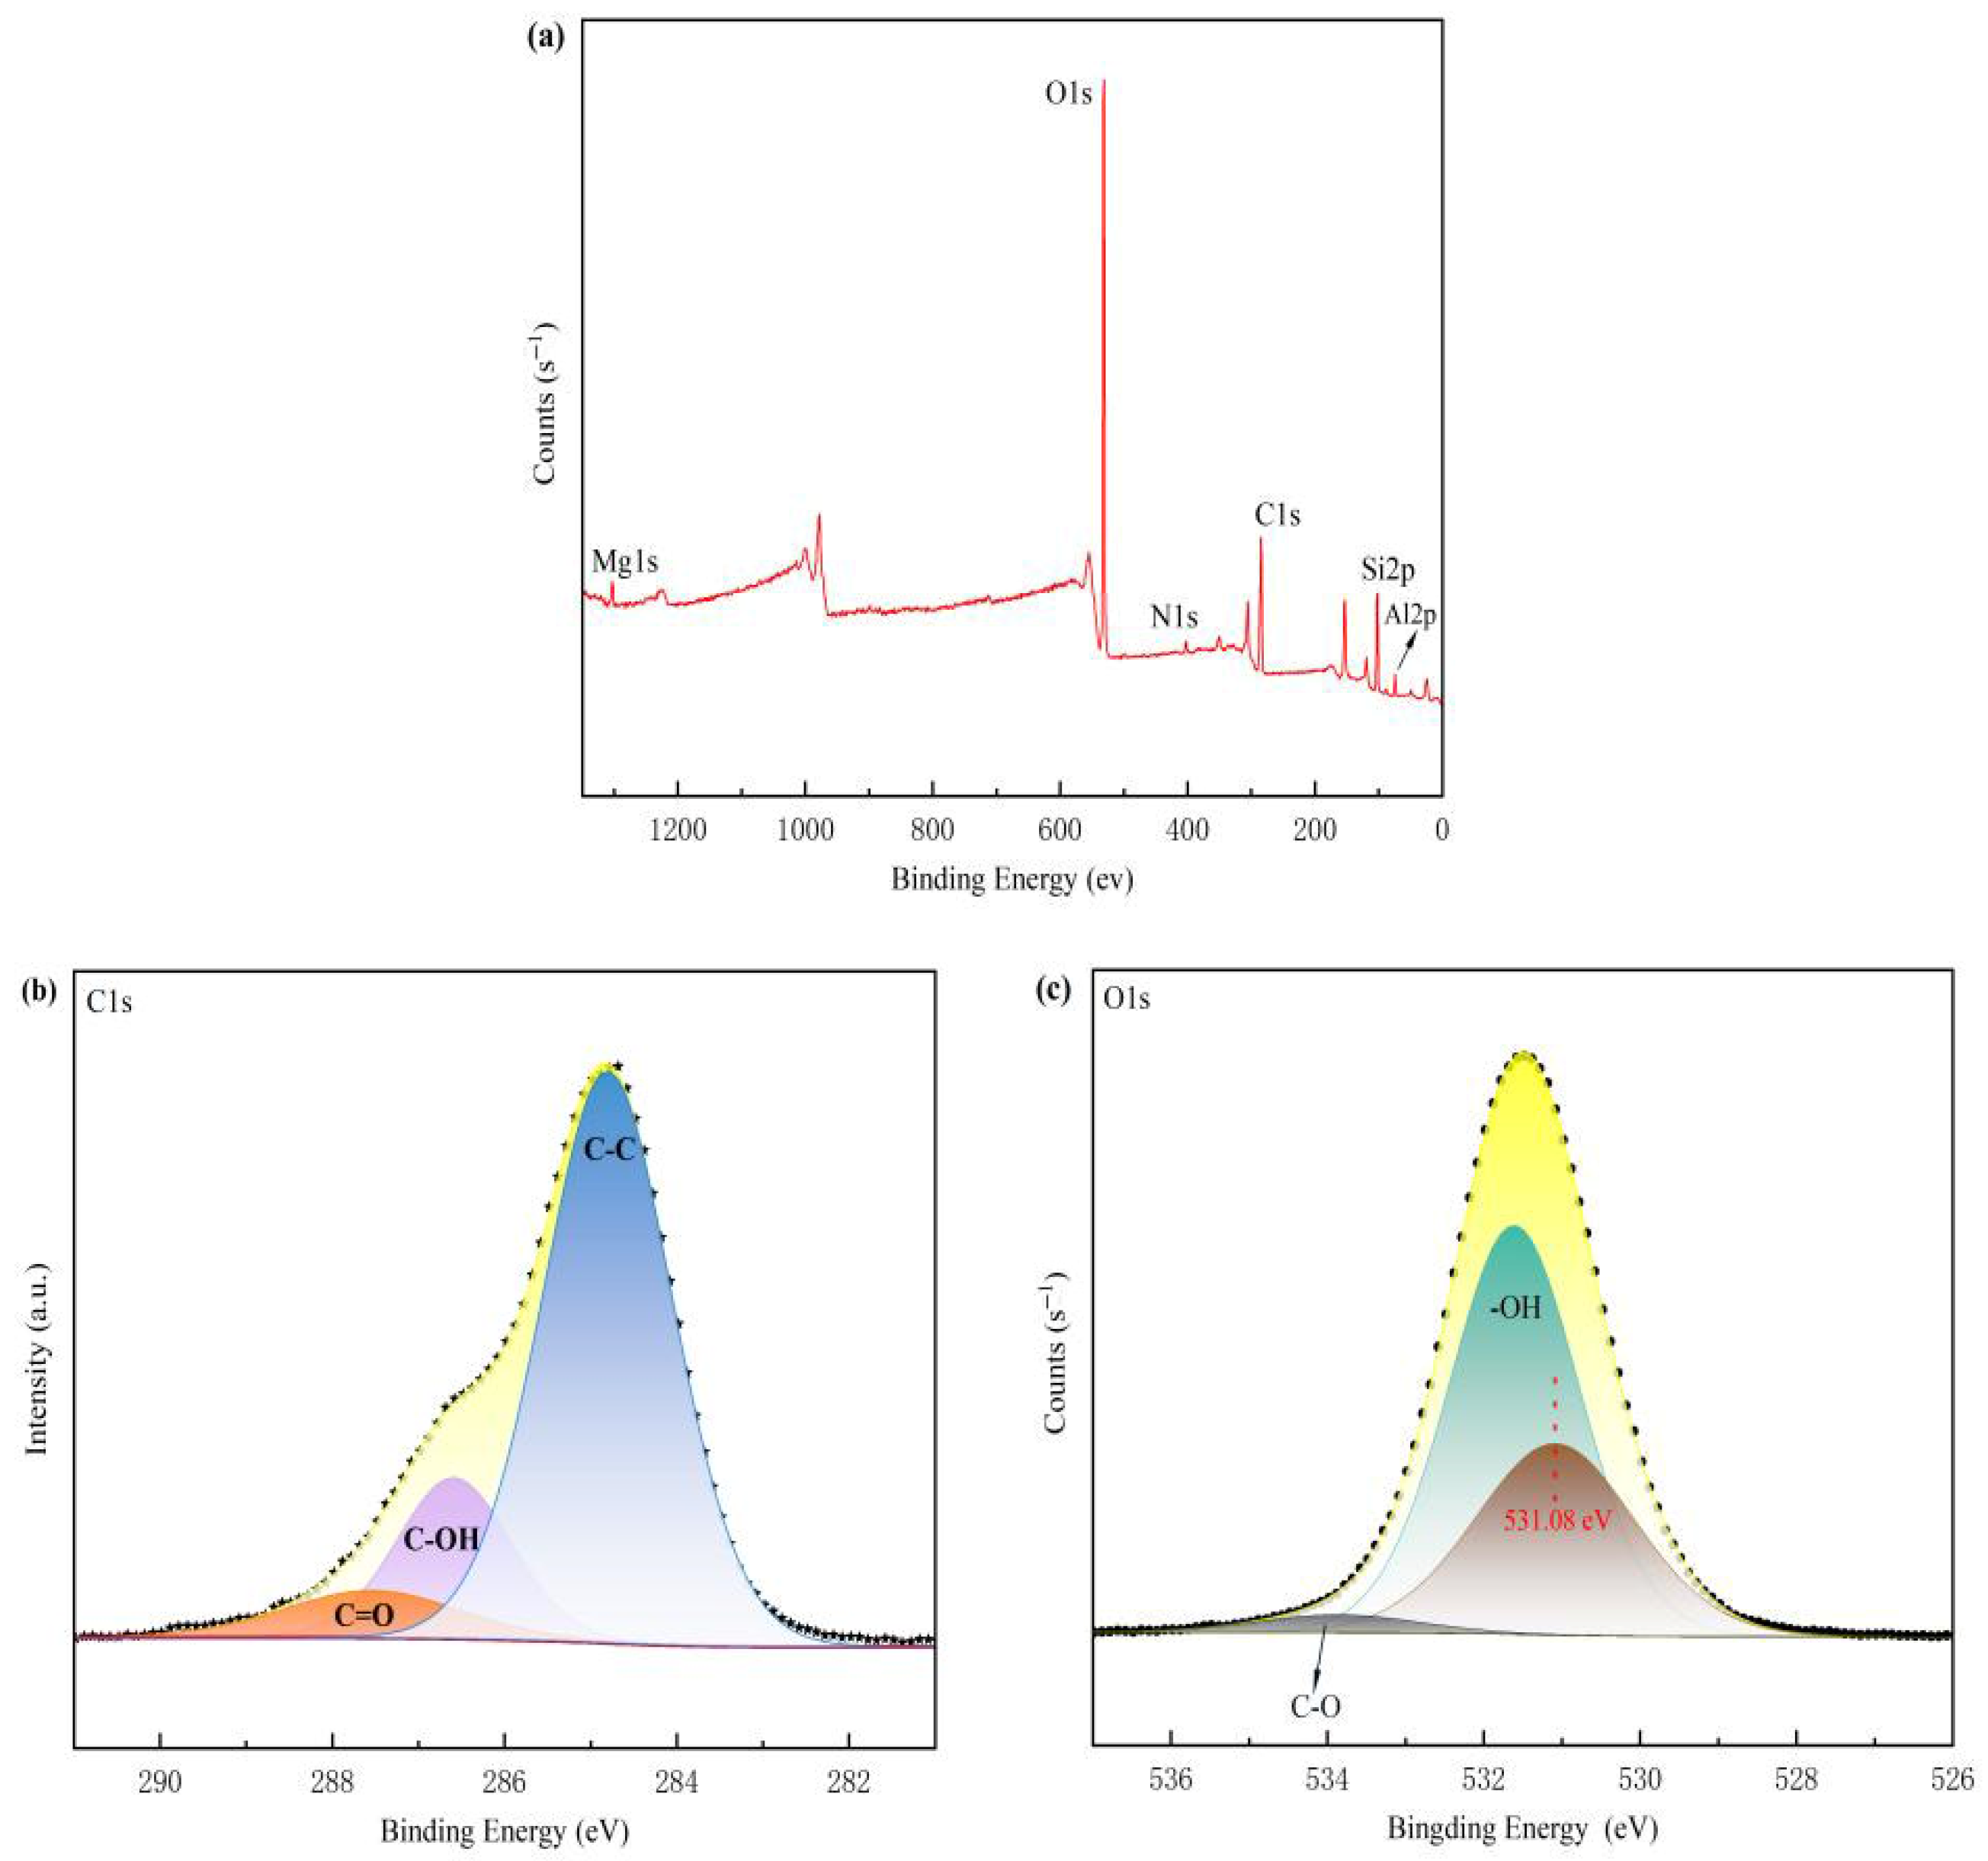
XPS analysis was conducted. The total XPS spectrum (Figure 7a) confirms the presence of silicon, aluminum, and magnesium elements in CTAB-MMT/KH560-EC, as the photoelectron peaks for Si (2p), Al (2p), and Mg (2p) are located at their respective binding energies of 103 eV, 75 eV, and 50 eV, respectively, as detailed in the XPS binding energy reference table. Further analysis of the C1s XPS spectrum (Figure 7b) shows three distinct peaks indicating to C-C (284.8 eV), C=O (285.9 eV), and C-OH (287.1 eV) bonds. In the O1s XPS spectrum (Figure 7c), distinct peaks indicating to C-O (533.3 eV) and O-H (531.7 eV) bonds are evident. Additionally, a peak at 531.1 eV is indicative of lattice oxygen within Si-O, Mg-O, and Al-O structures, which corroborates the presence of various oxygen species within the material. FTIR spectroscopic analysis of CTAB-MMT/KH560-EC confirmed the successful intercalation and grafting of EC onto MMT. The characteristic peaks observed in the FTIR spectrum were consistent. Specifically, the C-H stretching vibrational feature at 2900 cm−1, the C=O stretching vibrational feature at 1730 cm−1, and the Si-O-Si stretching vibrational feature at 1000 cm−1 in the FTIR spectra correspond to the C-C, C=O, and Si-O peaks detected by XPS, respectively, further confirming the successful composite formation between EC and MMT.
In conclusion, the results of XPS, XRD, and FTIR collectively demonstrate that EC has been successfully intercalated and grafted onto MMT in the CTAB-MMT/KH560-EC composite, achieving the expected preparation effect. This result provides a solid foundation for subsequent material performance research and application.

3.4.5. TG Analysis

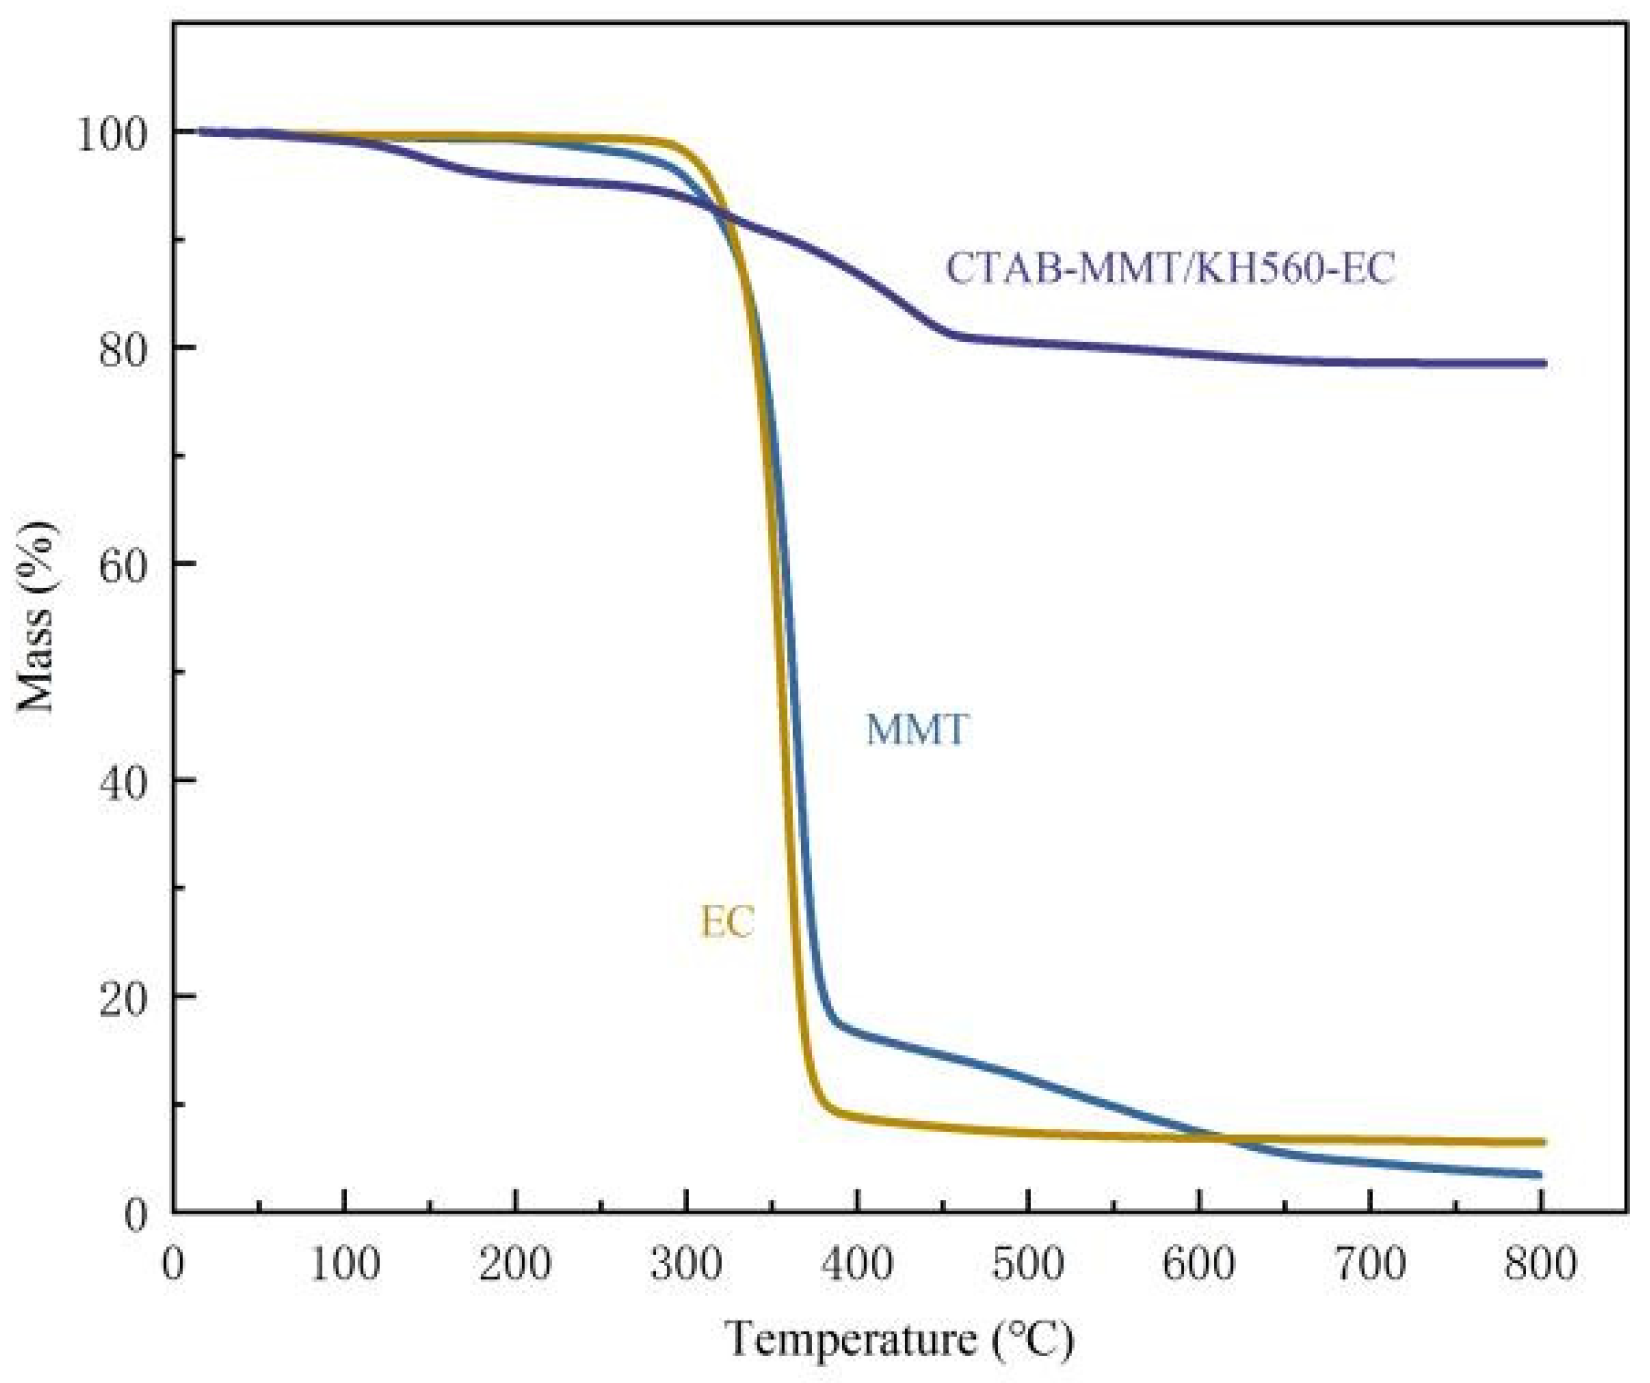
The TG curve is shown in Figure 8. Montmorillonite, a layered silicate mineral with exceptional thermal stability (50–200 °C), primarily removes adsorbed water and interlayer water. It releases structural hydroxyl groups as bound water between 200 and 300 °C, causing partial structural changes. Throughout the temperature interval, spanning 300 to 800 °C, montmorillonite undergoes partial amorphization or phase transformation but does not completely decompose, thereby forming stable aluminosilicates (e.g., amorphous silica and aluminum oxide). Complete decomposition typically requires temperatures exceeding 800 °C. Within this range, key components like SiO2 and Al2O3 remain stable and cannot undergo complete pyrolysis. During the pyrolysis process of EC, within 150 °C, adsorbed water and low molecular weight volatiles are mainly removed. The pyrolysis of EC mainly occurs between 300 and 400 °C. In the EC structure, the main chain is broken and the ethoxy side chain decomposes to generate small molecular substances such as CO, CO2, hydrocarbons, and oxygen-containing organic matters (such as aldehydes and ketones). After 400 °C, EC degradation basically reaches equilibrium, and the final products are liquid tar, carbon residue, and porous carbon residue.
Regarding the pyrolysis process of CTAB-MMT/KH560-EC, only the dehydration of montmorillonite occurs between room temperature and 300 °C. Subsequently, the decomposition of CTAB and carbonization of EC (with approximately 20% weight loss) take place between 300 and 450 °C. The “bridging” effect of KH560 elevates the decomposition temperature of EC to 450 °C, stabilizing after 800 °C. Montmorillonite (MMT), a specific type of layered silicate clay mineral, is composed of silicon–oxygen tetrahedra and aluminum–oxygen octahedra. This mineral is characterized by its high heat resistance and chemical stability, which contribute to its ability to delay the pyrolysis of EC. With high heat resistance and chemical stability, it can delay the pyrolysis process of EC while adsorbing gases and small molecule products produced by pyrolysis. Although EC gradually decomposes and carbonizes during pyrolysis, its carbonized products interact with MMT’s surface to form stable carbon-silicate composite structures. As a coupling agent, KH560 enhances interfacial bonding between MMT and EC, further improving the composite material’s thermal stability. Consequently, EC achieves complete decomposition and carbonization within 800 °C, whereas MMT’s high thermal stability prevents complete breakdown. Additionally, the carbonaceous residue formed during EC’s carbonization tightly integrates with MMT, creating stable composite residues that hinder the complete pyrolysis of CTAB-MMT/KH560-EC.

3.5. Determination of Kinematic Viscosity

3.5.1. Analysis of Rheological Properties of Lubricating Fluids

The KV (Kinematic viscosity) of the raw oil at 40 °C and 100 °C was determined to meet specific viscosity grade standards, respectively, as shown in Table 3.
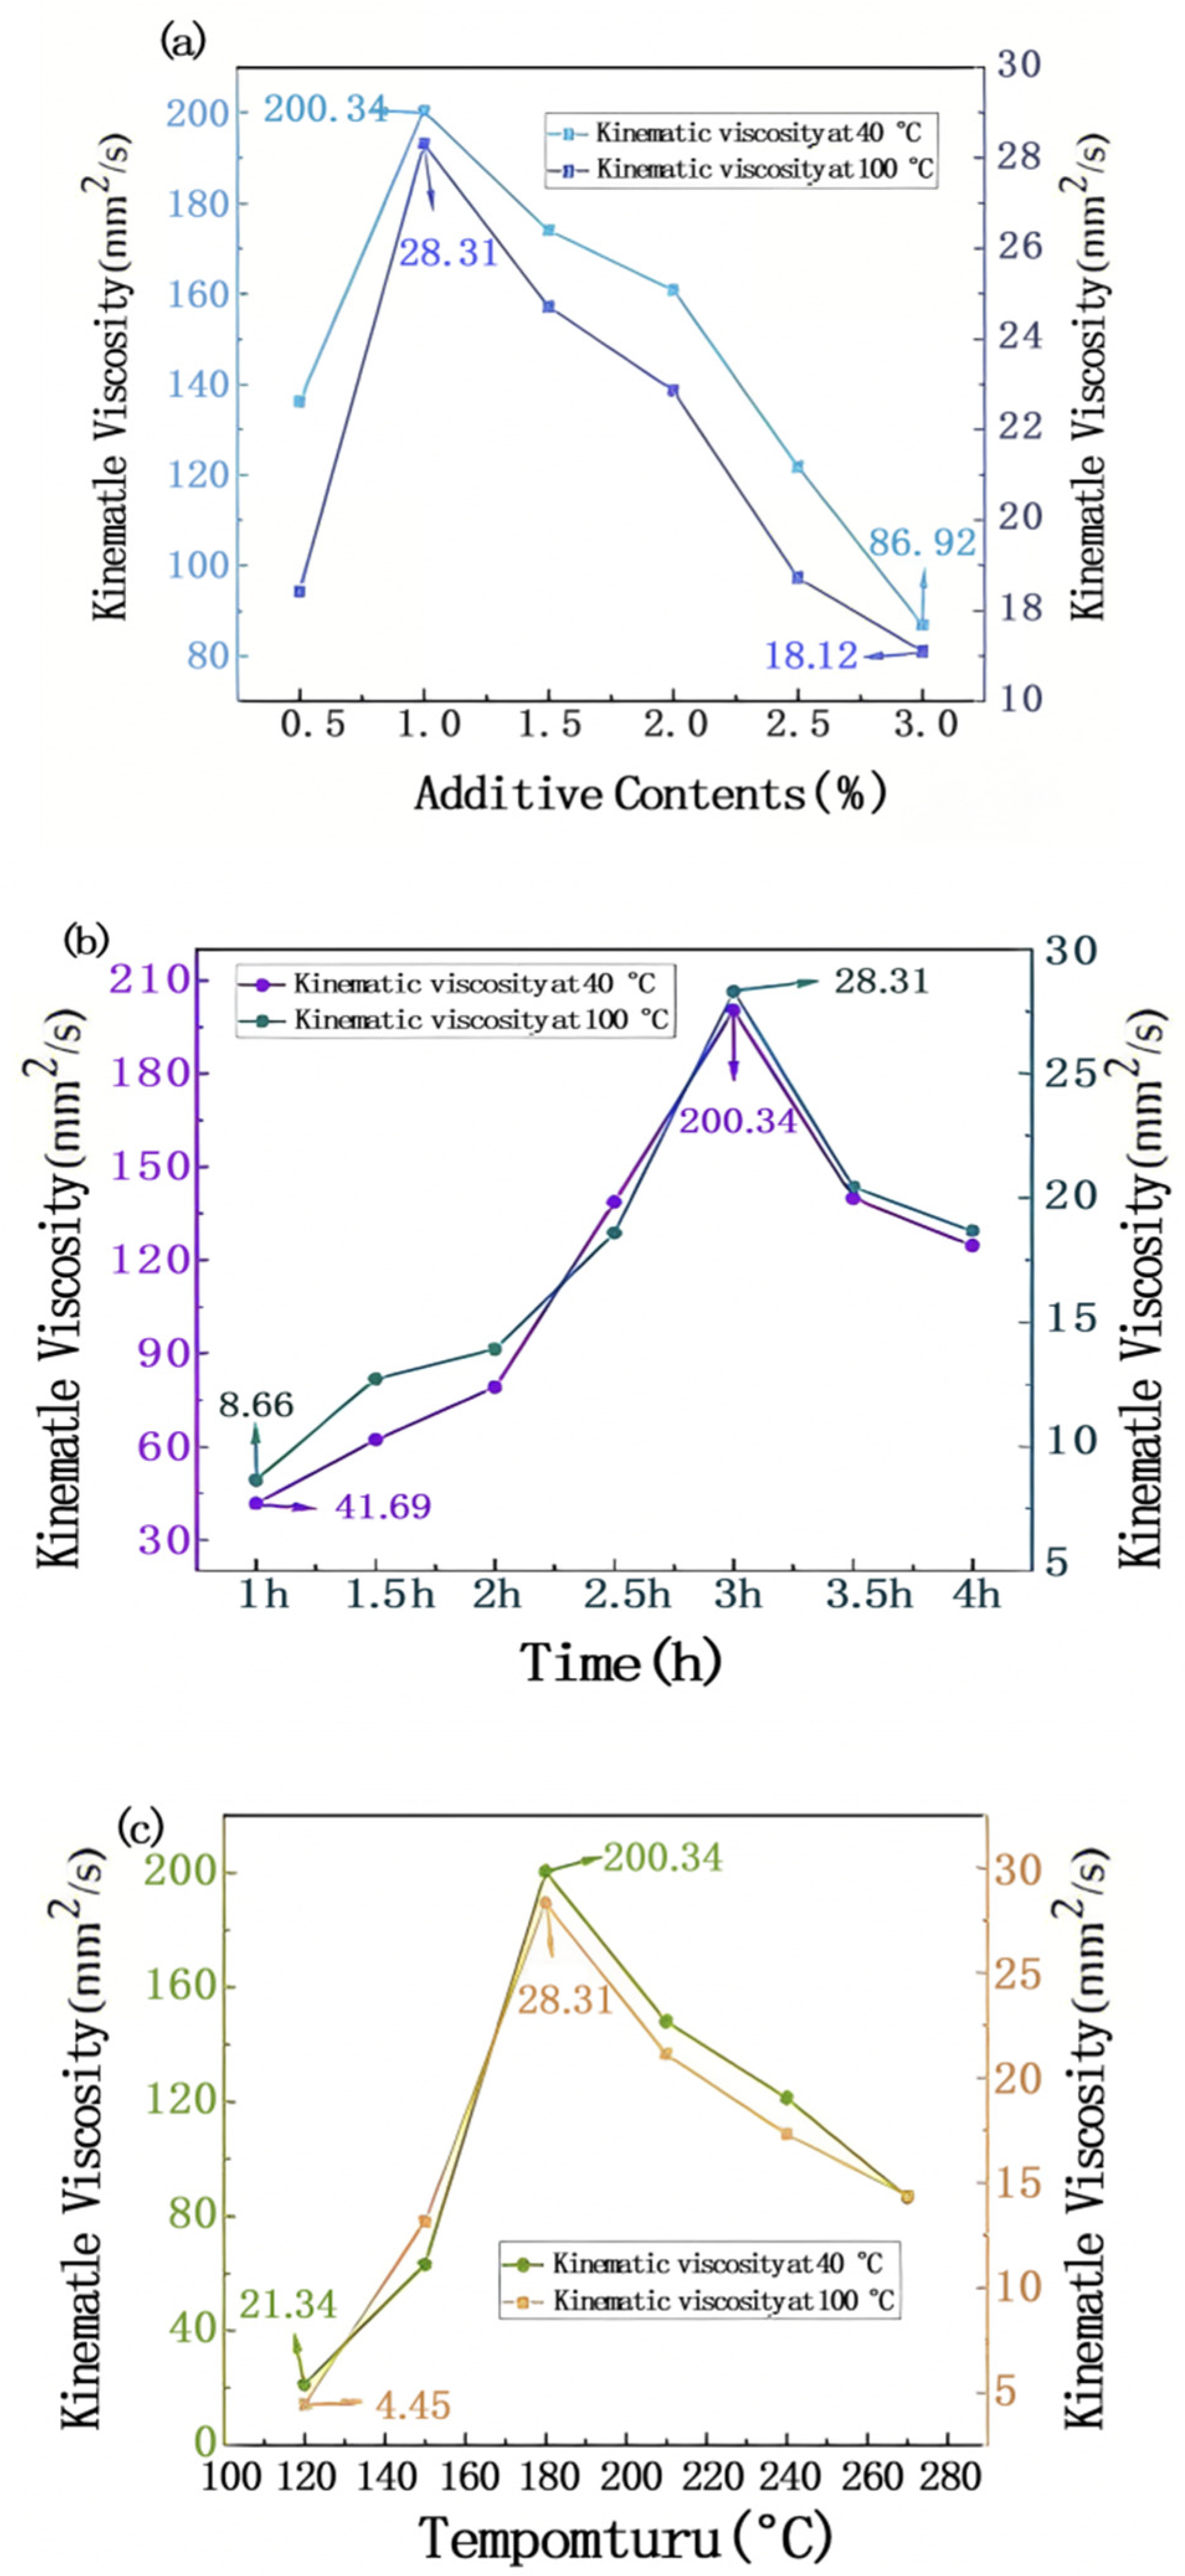
When CTAB-MMT/KH560-EC serves as an additive, its long chains react with unsaturated double bonds in waste oil, forming branched architectures. This enhanced branching promotes entanglement with adjacent molecules, thus elevating flow resistance and viscosity. As shown in Figure 9a–c, under conditions of 180 °C and 2 h reaction time with 1 wt% CTAB-MMT/KH560-EC, the kinematic viscosity of the lubricating oil increases at 40 °C. The kinematic viscosity is 200.3 mm2/s, which is 188.9 mm2/s higher than that of waste oil (Table 3). As a long-chain polymer, when EC is dissolved or dispersed in vegetable oil, its molecular chains form a three-dimensional network structure through physical entanglement, which directly increases the viscosity of lubricating oil. However, the molecular chains of EC may be partially de-entangled at high temperatures, but after composite MMT, the thermal stability of montmorillonite can inhibit this process, thus reducing the viscosity decline at high temperatures. In addition, polar groups such as -OH of EC can combine with the MMT surface through hydrogen bonding or van der Waals force to form a more stable composite structure. This interface effect not only strengthens the compatibility between the two, but also effectively promotes the uniform dispersion of MMT in oil. EC molecules are inserted between the layers of MMT, expanding the interlayer spacing, significantly increasing the specific surface area of MMT, and improving its viscosity, increasing the efficiency of the lubricating oil. Under the action of shear force (such as mechanical motion), the network structure of the composite may be temporarily destroyed, but the strong interfacial bonding force of CTAB-MMT/KH560-EC can accelerate the structural recovery and maintain the viscosity stability (shear stability). The solubility of CTAB-MMT/KH560-EC in XSBO was significantly improved with the increase in preparation temperature, and once the processing temperature attained or surpassed the melting point of CTAB-MMT/KH560-EC, CTAB-MMT/KH560-EC was in a molten state and was able to mix more effectively with Xanthoceras sorbifolia oil, thus significantly improving the kinematic viscosity. When the temperature is cooled, there is no precipitation or flocculation in the sample, suggesting the formation of a stable blend system and confirming the notable enhancement in kinematic viscosity. However, further increase in CTAB-MMT/KH560-EC content resulted in a decline in viscosity, likely attributable to intensified self-aggregation of CTAB-MMT/KH560-EC within the mixture, resulting in a weakened mixing effect with Xanthoceras sorbifolia oil, thus reducing the kinematic viscosity. In addition, according to the FTIR analysis results, the introduction of trans double bonds can enhance the viscosity-temperature properties of lubricating oil and reduce the kinematic viscosity loss at high temperatures. Under these conditions, according to the GB/T 1995-1998 [36] standard, the viscosity index (VI) of the lubricating oil is 150.7, which indicates that the lubricating oil belongs to the extra-high viscosity index lubricating oil with excellent viscosity-temperature performance.
CTAB-MMT/KH560-EC significantly increases the KV of vegetable oil-based lubricants and optimizes their temperature stability and shear responsiveness through polymer chain entanglement, nanosheet layer filling, interfacial synergistic effects, and the formation of a thermally stable network. This multi-scale composite mechanism enables lubricating oil to maintain better lubricating performance under a wide temperature range and complex working conditions.

3.5.2. Lubricating Oil Freezing Point Analysis

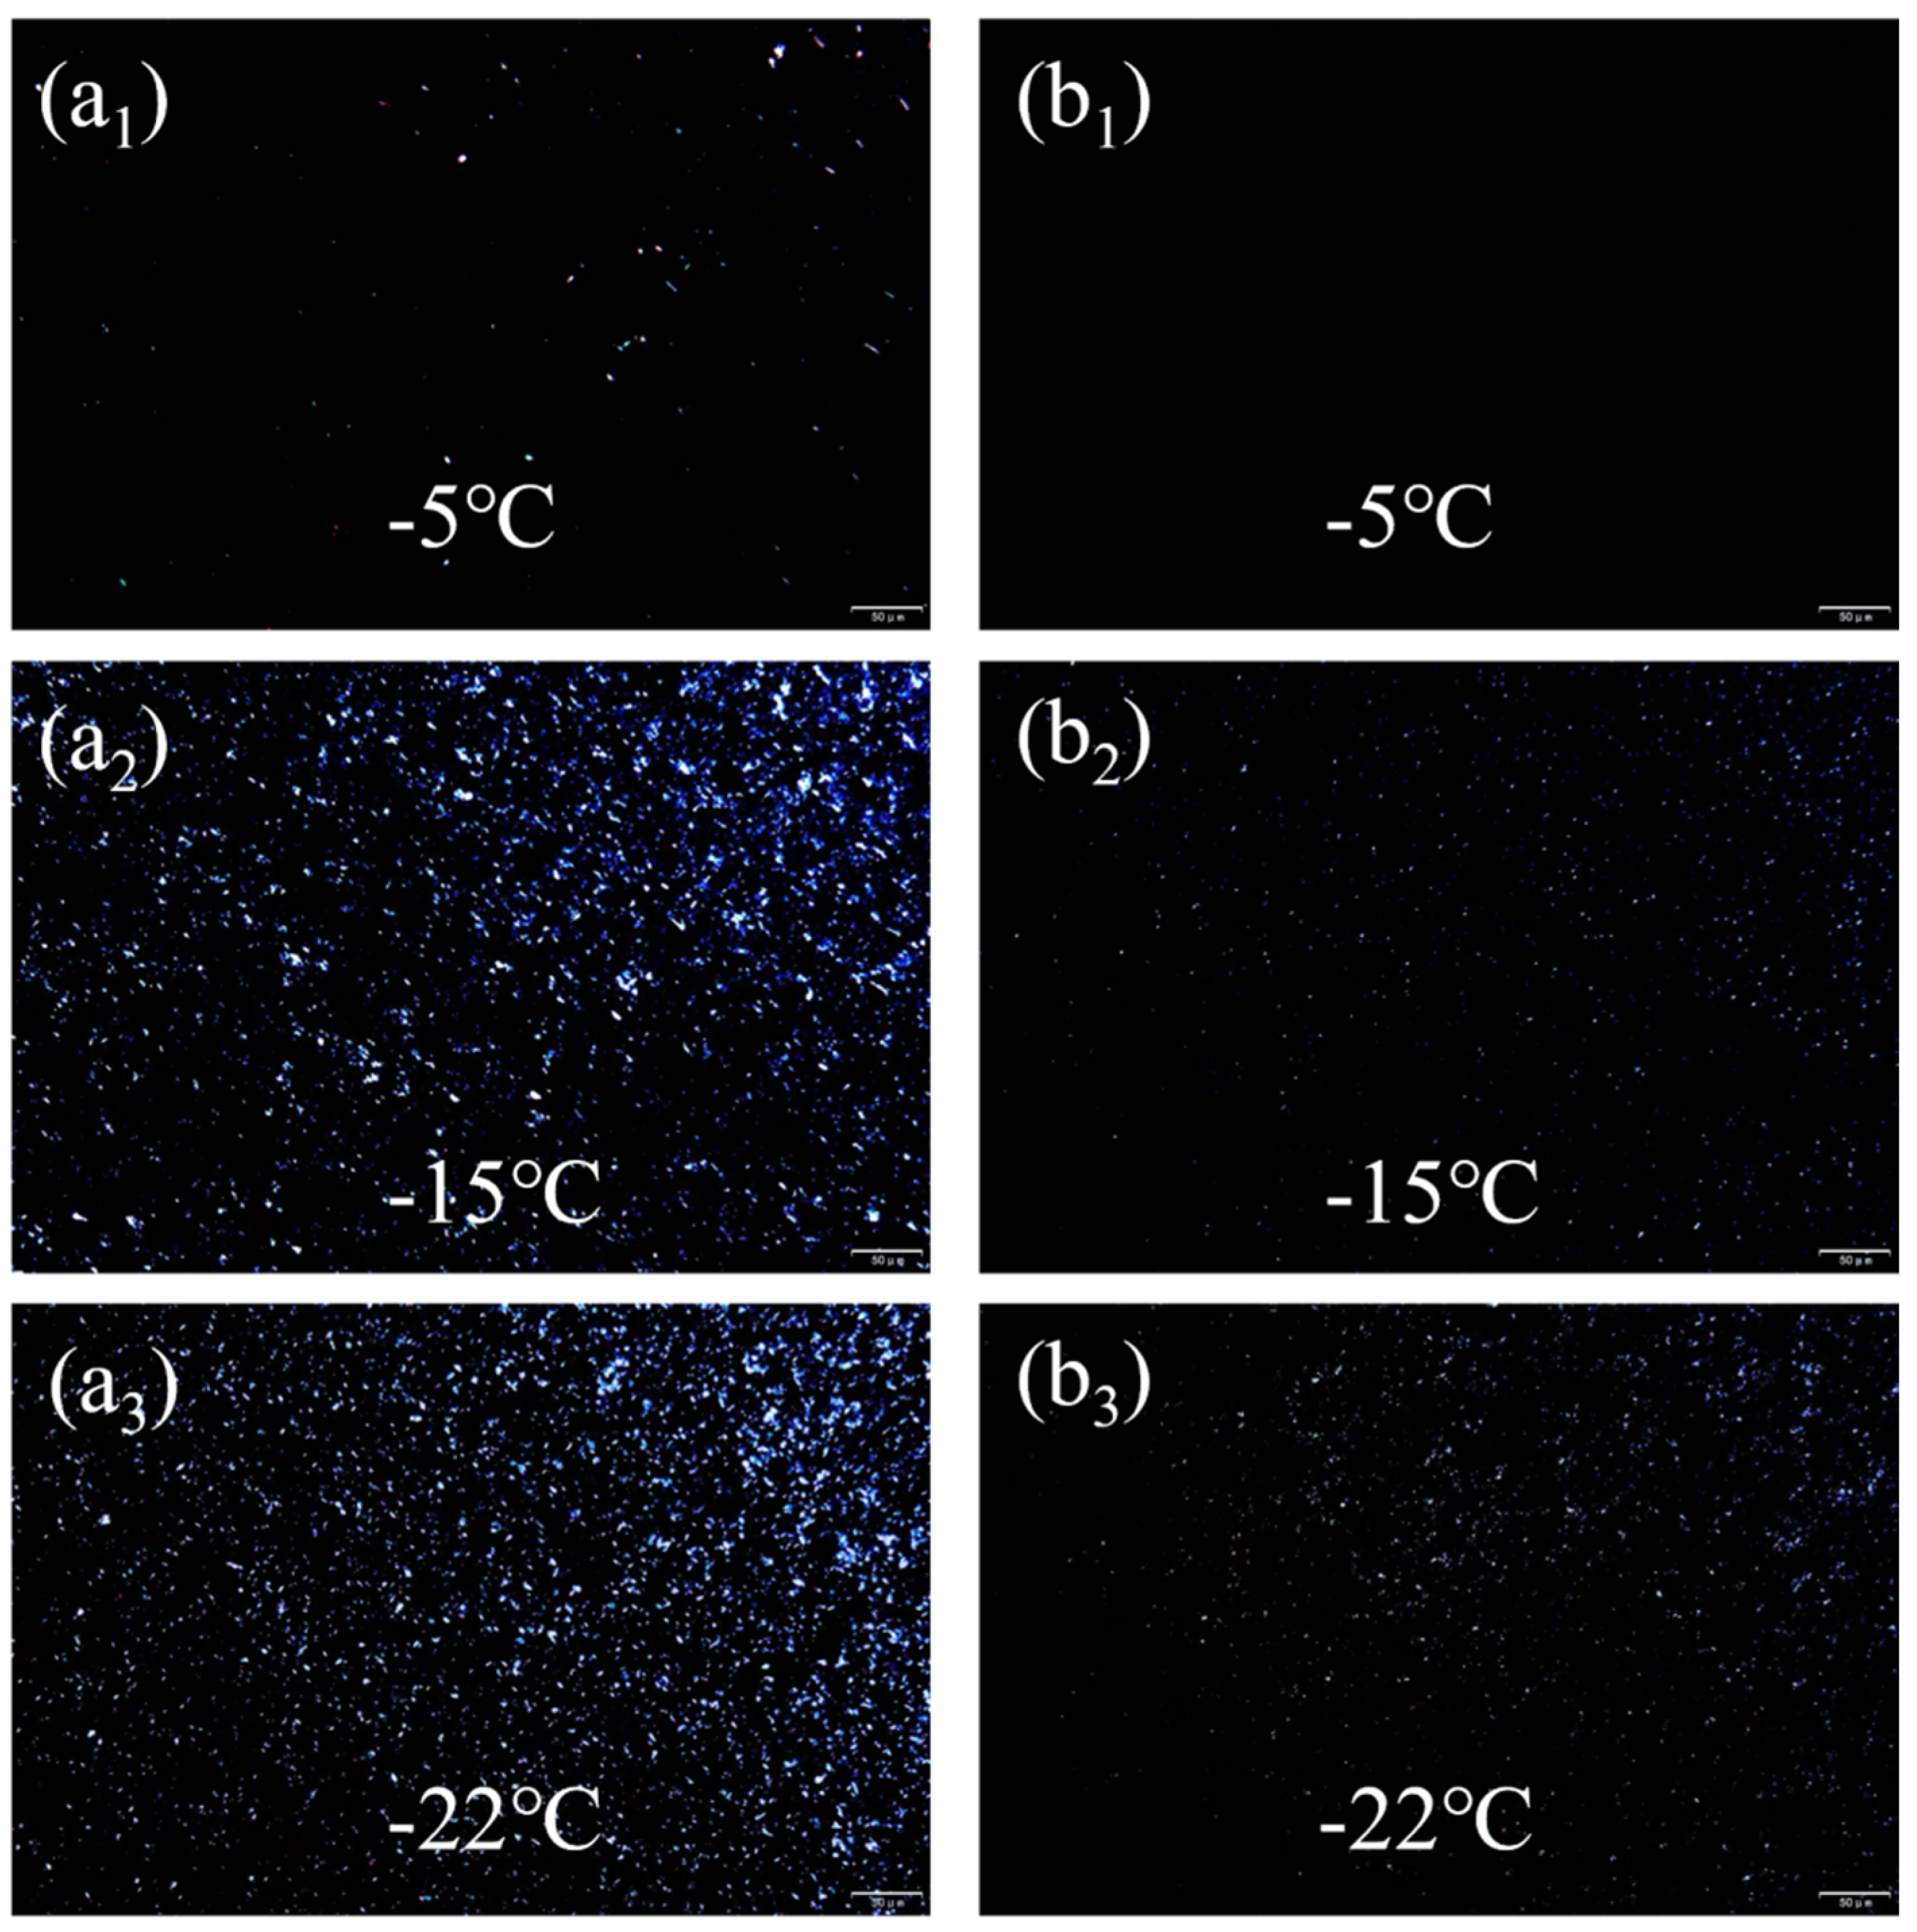
The crystalline morphology observed using polarized optical microscopy is shown in Figure 10. At −5 °C, the polarized images of waste oil (a1) and the 1% CTAB-MMT/KH560-EC-modified lubricant (b1) revealed distinct differences in crystal quantity, size, and shape [39,40]. In the waste oil, crystalline morphology initially exhibited needle-like structures that gradually increased in number. Finally, the crystal structure of these needle-like crystals accumulates continuously, forming a three-dimensional network structure; therefore, the fluidity is lost when the temperature decreases from −5 °C to −22 °C. However, the lubricating oil modified by CTAB-MMT/KH560-EC produced smaller needle-like crystals, and the number of crystals increased with a temperature decrease from −5 °C to −22 °C. At the same temperature, compared with Figure 10(a1–a3,b1–b3)), the number of lubricating oil crystals is significantly less than that of waste grease and the crystal size presents a smaller penalty-like structure. Adding CTAB-MMT/KH560-EC to waste grease can make the arrangement and distribution of needle-like crystals neat, and at the same time, make the needle-like crystals become tiny and uniform close to penalty-like crystals. Furthermore, when the temperature decreases from −5 °C to −22 °C, the crystal size gradually increases. The inhibition mechanism of CTAB-MMT/KH560-EC can be explained as follows. On the one hand, according to previous studies, CTAB-MMT/KH560-EC has good solubility and dispersibility, so it can be uniformly dispersed in waste grease, thus improving the cold flow performance. On the other hand, due to the heterogeneous nucleation mechanism of CTAB-MMT/KH560-EC, CTAB-MMT/KH560-EC provides a nucleation point for crystallization, resulting in the formation of many tiny segmented crystals. Moreover, CTAB-MMT/KH560-EC is a nanomaterial with high surface energy. In order to maintain the energy stability of the solid–liquid system, when the encapsulated crystal liquid is released from the three-dimensional network structure, small granular crystals will be formed, thus reducing the phenomenon of unequal energy. On the other hand, CTAB-MMT/KH560-EC nanomaterials can effectively promote the transformation of irregular crystals into tiny and regular granular crystals due to their high surface energy, thereby forming a stable solid–liquid interface.

3.5.3. Friction and Wear Performance of Lubricating Oil

Lubricity Property
Table 4 shows the coefficient of friction (COF) of the lubricant of 1 wt% CTAB-M, as determined through experimental procedures similar to those detailed in Reference [2], which showcase the effectiveness of additives in reducing friction in lubricating oil with 1 wt% CTAB @ MMT/EC.
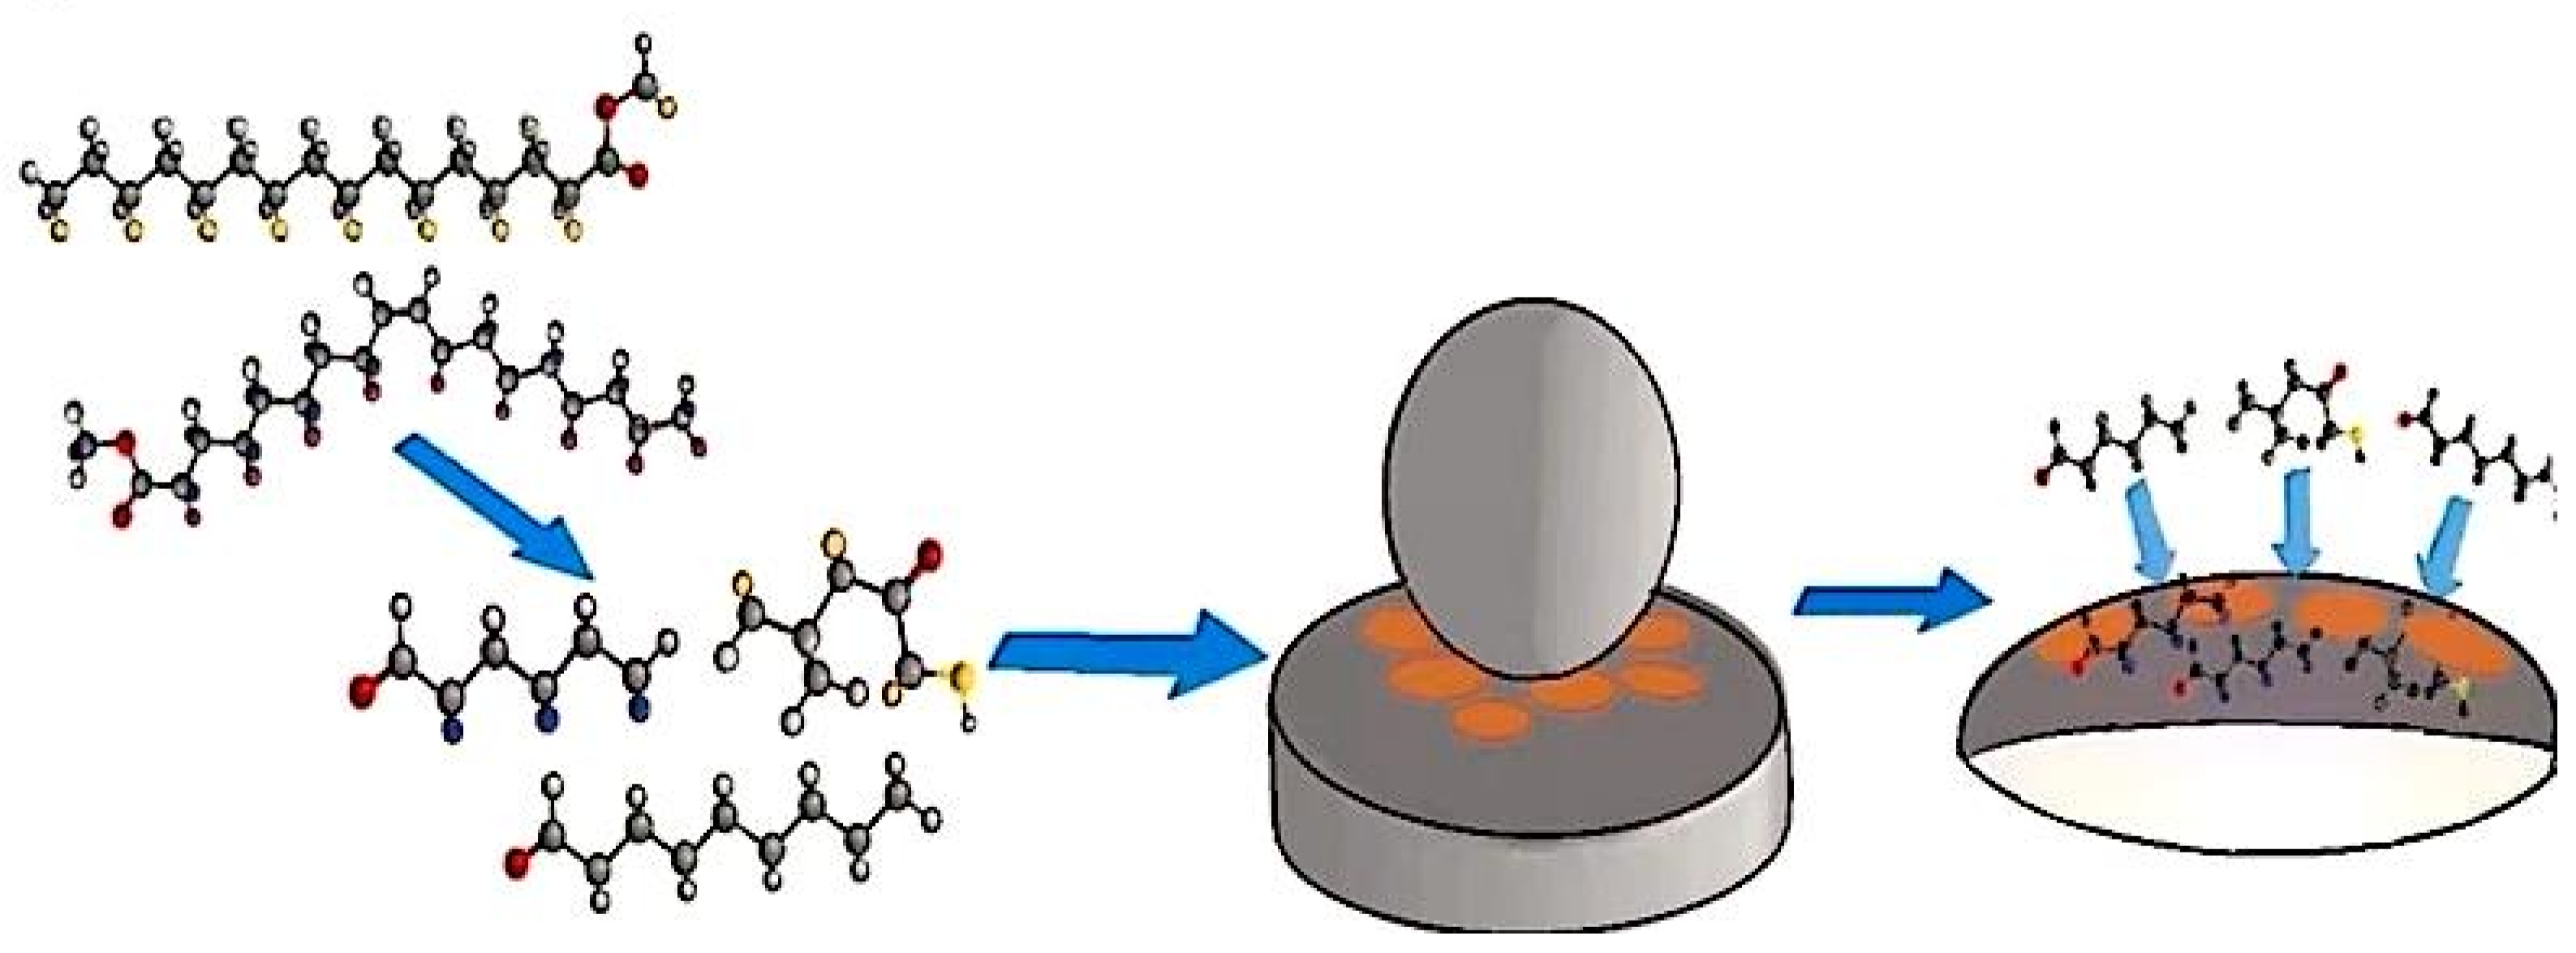
Using 1 wt% CTAB-MMT/KH560-EC of the prepared lubricant. The data in Table 5. outlines the correlation of the friction coefficient with the frictional regime, where the friction mode classification is derived from the threshold test range of classical tribology theory, and the prepared bio-based lubricating oil is determined to belong to a certain friction-mode category based on the endpoint friction coefficient measurement. Since the friction coefficient is 0.081, which is between 0.08 and 0.10, it indicates the presence of boundary friction. Boundary friction serves to diminish resistance during operation, minimizes wear, and effectively extends the service life of mechanical components under equivalent load capacity. The breakdown of unsaturated fatty acids in waste oil yields small molecules (e.g., carboxylic acids, alcohols, aldehydes, esters, ketones, and short-chain acids). Due to their polarity, or chemical affinity, these compounds readily interact with metal surfaces, facilitating the formation of boundary adsorption films [23,41,42]. Figure 11 shows the mechanism of lubricating film formation of the decomposition products of lubricating oil during friction wear. During relative surface movement, the molecular layers adsorbed onto the metal surface do not shift position but instead undergo molecular displacement. This substitution replaces direct metal-to-metal friction, thereby enhancing lubrication performance and improving anti-wear characteristics.
Wear Resistance
The results, which include assessments of wear resistance, viscosity, and flash point, are detailed in Table 6.
From Table 6, it can be seen that each lubricant was tested 3 times (Ball 1, Ball 2, and Ball 3).
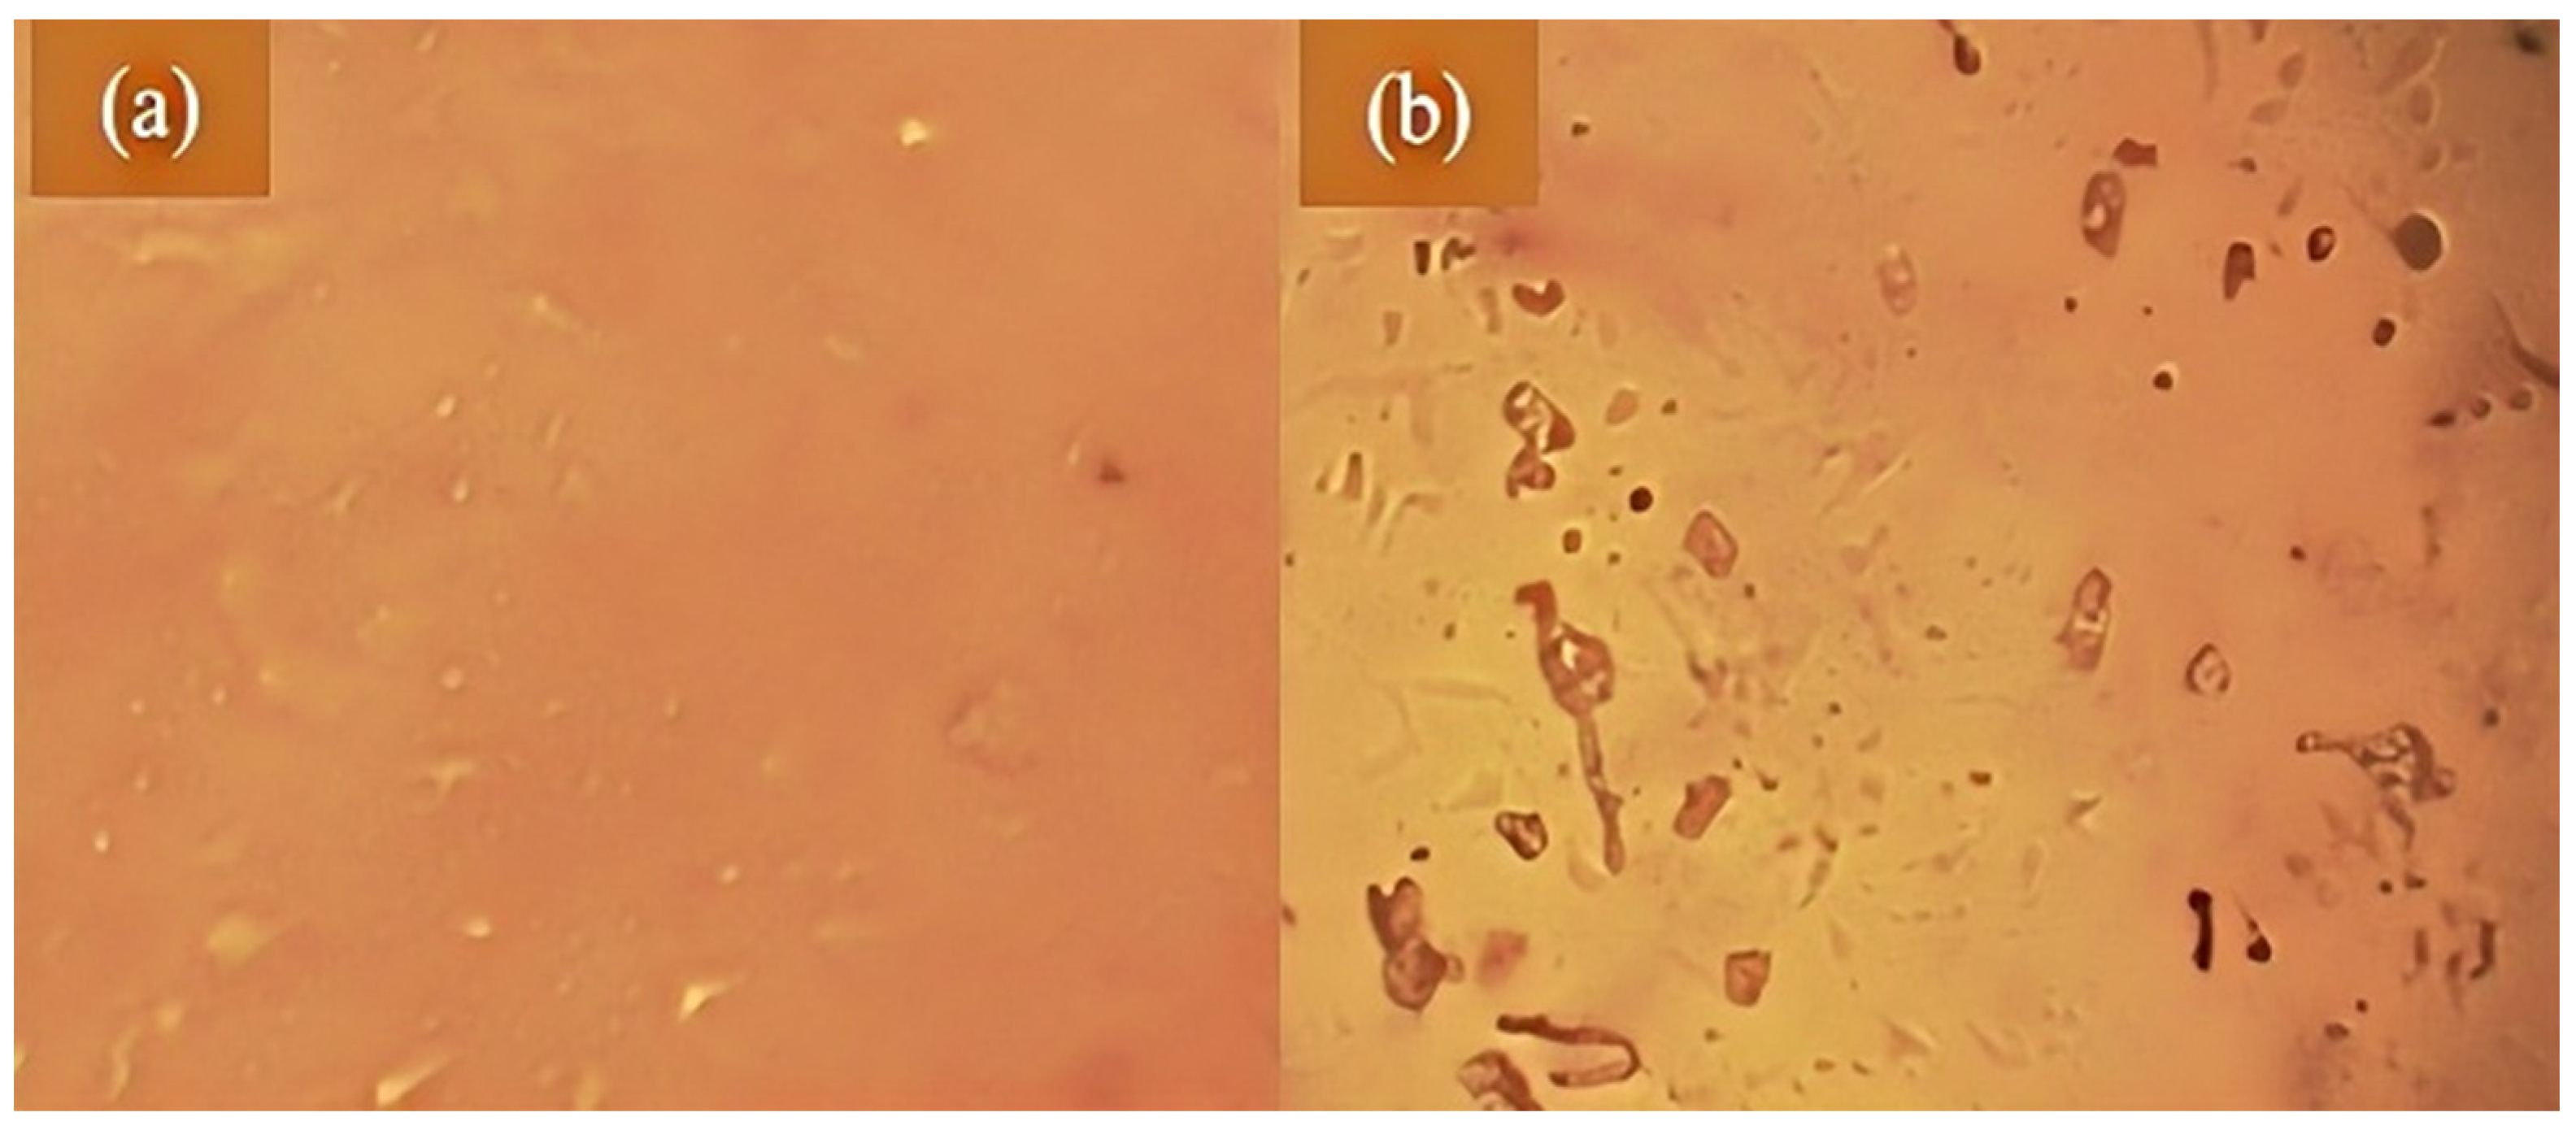
For each measured bidirectional wear (X/Y direction), a total of six data points were obtained. An average wear scar diameter of 0.81 mm was observed on waste grease, whereas the value rose to 0.94 mm on the 1 wt% CTAB-MMT/KH560-EC formulation. Compared with waste grease, the wear spot diameter of 1 wt% CTAB-MMT/KH560-EC-modified lubricating oil has increased. This is due to the increase in the number of C=C bond breakages during the high-temperature reaction. Although the double bond initially promoted the formation of a dense adsorption film on the metal surface by the fatty acid ester and enhanced the strength of the lubricating film, with further C=C bond breakage, the strength of the adsorption film weakened, which led to increased wear and the corresponding increase in wear spot diameter. In addition to this, insoluble resins and deposits, generated during friction and wear (as shown in Figure 12a,b), increase the durability of the films [43,44]. However, the larger the amount of deposits formed, the more serious the wear will be, and the larger the diameter of the wear spot will be.

3.5.4. Thermal Weight Analysis of Lubricating Oil

As illustrated in Figure 13 and its corresponding thermogravimetric (TG) curve, the waste grease exhibits minimal mass loss and remains largely stable within the temperature range of 0 °C to 100 °C. From 100 °C to 300 °C, however, a noticeable decline in mass occurs due to accelerated volatilization caused by the rising temperature. Between 300 °C and 430 °C, there is a significant weight loss of waste grease, and between 430 °C and 800 °C, the weight of waste grease decreases slowly. However, the curve of bio-based lubricating oil changes greatly between 330 °C and 450 °C and displays pronounced mass loss. In comparison to waste grease, the initial weight loss temperature of the prepared lubricating oil is roughly the same, but the temperature when it reaches stable weight loss is higher than that of waste grease, and its weight loss rate is also faster. Due to the lower decomposition temperature of CTAB-MMT/KH560-EC compared to waste grease, when they are mixed, the overall weight loss temperature will drop, which in turn reduces the thermal resistance performance. Beyond 450 °C, the TG curves of both waste grease and lubricating oil stabilize, indicating near-complete volatilization of the oils throughout the heating process. In the range of 0 °C to 300 °C, the lubricating oil exhibits a gradual weight loss and demonstrates good thermal stability, confirming its suitability for the normal operational temperature range (70–120 °C) of engine lubrication.
According to the DSC curve, the waste grease reaches the decomposition and gasification temperature of the raw oil at about 474 °C, with distinct endothermic peaks at 308 °C and 572 °C, accompanied by a rise in enthalpy. This finding aligns with the TG results, indicating favorable thermal stability of the waste grease within 0–300 °C, during which it retains structural integrity. The DSC curve of the lubricating oil further reveals endothermic reactions occurring at 342 °C and 632 °C, during which the enthalpy increases and reaches the decomposition and vaporization temperature around 479 °C. In conclusion, the lubricating oil exhibits good thermal stability in the temperature range of 0–300 °C, which is consistent with the performance of perfluoropolyether oil in a similar temperature range. In addition, the introduction of oxidation stability test methods and physical and chemical performance indexes of lubricating oil further confirms its reliability in high temperature environment.

3.5.5. Rheological Property Analysis

It can be seen from Table 7 that the viscosity index indicates the degree of change in viscosity of all fluids with temperature. The higher the viscosity index, the less the fluid viscosity is affected by temperature. The viscosity index of lubricating oil modified by 1 wt %CTAB-MMT/KH560-EC can reach more than 181.1, which belongs to the category of lubricating oil with extra-high viscosity index (≥180). Compared with waste oil, the acid value has increased. One reason is due to the contact with air during the preparation process, and the other reason is due to the nature of waste oil itself. The acid value of vegetable oil will increase under the action of air phenomenon; compared with waste grease, the freezing point drops by 10 °C, and the low-temperature flow performance is effectively improved; there is no change in the flash point, the flash point is >290 °C, and it is non-flammable. The performance of the flash point is consistent with the measurement results of thermal stability, and it maintains good stability in the range of 0–300 °C; there is no change in mechanical impurities, indicating that iron filings, sediment, dust, and other insoluble substances in waste grease are not mixed in the preparation process, and the prepared lubricating oil will not damage mechanical equipment such as oil circuits and cylinders; there is no change in ash content, indicating that the content of sludge and impurities produced after the volatilization of lubricating oil is small, which ensures the cleanliness of mechanical equipment.

4. Conclusions

We systematically optimized the pretreatment process of waste oil: first, centrifugal impurity removal, phospholipid degumming, and then decolorization by the two-step method of “hydrogen peroxide oxidation + activated carbon-activated clay composite adsorption”, and the final decolorization rate reached 65%. After pretreatment, the appearance and smell of oil were significantly improved, the methyl ester content was stable at about 90%, and key indicators such as acid value and peroxide value all met the standards of bio-based lubricating oil raw materials, laying a high-quality foundation for subsequent modification.
Bio-based lubricating oil prepared by modification of 1 wt% CTAB-MMT/KH560-EC, kinematic viscosity of 200.3 mm2/s at 40 °C, 28.3 mm2/s at 100 °C, freezing point as low as −22 °C, viscosity index 181.1 (Extra high grade), friction coefficient 0.081, average wear spot diameter 0.94 mm, and outstanding anti-wear performance. Combined with the performance characteristics, it meets the compressor lubrication scenario based on the application of standard data; gear transmission lubrication scenarios and excellent low-temperature fluidity, including industrial compressor lubrication are potential applications that are worth exploring; other potential applications are gear system lubrication for forestry trimmers, gearbox lubrication for river vessels, lubrication of winter working machines in northern China, etc.
This technology converts waste grease into high-value lubricant, and the raw material cost is only 3000 yuan/ton (60% of mineral oil), which not only alleviates the risk of “gutter oil” backflow, but also reduces the waste grease pollution of 3 tons/ton products. Based on an annual production capacity of 1000 tons, CO2 emissions can be reduced by about 2000 tons, which is in line with the dual carbon goal. At the same time, its derivatives can be further developed into release agents, etc., forming a circular economy chain.

Author Contributions

Conceptualization, S.W.; methodology, S.W.; validation, K.Z.; formal analysis, Z.W.; investigation, Z.W. and K.Z.; resources, Y.H.; data curation, Z.W.; writing—original draft preparation, S.W.; writing—review and editing, T.H.; visualization, T.H.; supervision, Y.H.; project administration, W.L.; funding acquisition, W.L.; methodology refinement, H.W.; results interpretation, H.W.; literature review, Z.L.; theoretical analysis, Z.L.; final review, G.Z.; manuscript formatting, G.Z.; experiments, H.S.; data acquisition, H.S.; initial data processing, H.S. All authors have read and agreed to the published version of the manuscript.

Funding

This work was supported by the Natural Science Foundation of Inner Mongolia (No. 2024MS03068); The Capacity Building Project of the National Forestry Grassland Engineering Technology Research Center for Efficient Development and Utilization of Sandy Shrubs (BR251013; BR221027); Student Innovation and Entrepreneurship Training Program Project of Inner Mongolia Agricultural University (202410129031, 202310129045).

Conflicts of Interest

The authors declared no potential conflicts of interest with respect to the research, authorship, and/or publication of this article.

References

  1. Chen, H.; Ding, M.J.; Li, Y.; Xu, H.M.; Li, Y.; Wei, Z. Feedstocks, environmental effects and development suggestions for biodiesel in China. J. Traffic Transp. Eng. (Engl. Ed.) 2020, 7, 791–807. [Google Scholar] [CrossRef]
  2. Zhang, S.; Chen, W. China’s Energy Transition Pathway in a Carbon Neut. Engineering 2022, 14, 64–76. [Google Scholar] [CrossRef]
  3. Muthurathinam, S.G.; Perumal, A.V. Synthesis, characterization and tribological investigation of vegetable oil methyl esters based bio-lubricants. Ind. Crop. Prod. 2023, 203, 117098. [Google Scholar] [CrossRef]
  4. Lu, J.; Zhang, Y.; Duan, Q.H.; Liu, Y.N.; Yu, K.; Wang, L.H.; Zeng, J.L. Structure Innovation and Commercialization Progress of Bio-Based Lube Base Oil. Pet. J. (Pet. Process.) 2018, 34, 2. [Google Scholar] [CrossRef]
  5. Ye, J.; Zhang, J.; Li, C.; Xu, H.; Sun, M.; Xu, L.; Yu, L. Synthesis and Lubricating Properties of Bio-Based Lubricants from Palm Oil. Chempluschem 2025, 90, e202500013. [Google Scholar] [CrossRef]
  6. Fan, N.N.; Luo, W.; Bai, Z.X. Lubricating oil additives and their development trends. Aging Appl. Synth. Mater. 2021, 50, 140. [Google Scholar] [CrossRef]
  7. NB/SH/T 0822-2010; Determination of Nitrogen Content in Lubricating Oils and Additives—Boat-Inlet Chemiluminescence Method. Petroleum Industry Press: Beijing, China, 2010.
  8. HS/T 75-2023; Determination of Glucocorticoids in Import and Export Cosmetics—Ultra-High Performance Liquid Chromatography-Tandem Mass Spectrometry Method. China Customs Press: Beijing, China, 2023.
  9. Perer, M.H.; Yan, J.Y.; Xu, L.; Yang, M.; Yan, Y.J. Bioprocess development for biolubricant production using non-edible oils, agro-industrial byproducts and wastes. J. Clean. Prod. 2022, 357, 131956. [Google Scholar] [CrossRef]
  10. Liu, X.Y.; Xu, N.; Li, W.M.; Zhang, M.; Lou, W.J.; Wang, X.B. Viscosity modification of lubricating oil based on high concentration silica nanoparticle colloidal system. J. Dispers. Sci. Technol. 2016, 12, 319. [Google Scholar] [CrossRef]
  11. Sharma, B.K.; Adhvaryu, A.; Liu, Z.S.; Erhan, S.Z. Chemical modification of vegetable oils for lubricant applications. J. Am. Oil Chem. Soc. 2006, 83, 129. [Google Scholar] [CrossRef]
  12. Liu, P.; Wang, X.; Wu, J.; Lin, W.; Feng, Y.H.; Chen, B.S.; Fang, J.H.; Jiang, Z.Q. Effect of boron-nitrogen modified soybean oil additive on biodegradability, anti-oxidation property, and lubricity of rapeseed oil. Pet. Refin. Chem. Ind. 2019, 50, 88. [Google Scholar] [CrossRef]
  13. Li, N.; Mao, G.; Wu, W.; Liu, Y. Effect Evaluation of Ethylene Vinyl Acetate/Nano-Montmorillonite Pour-Point Depressant on Improving the Flow Properties of Model Oil. In Colloids and Surfaces A: Physicochemical and Engineering Aspects; Elsevier: Amsterdam, The Netherlands, 2018; Volume 555, pp. 296–303. [Google Scholar]
  14. Yao, B.; Li, C.; Yang, F.; Sjoblom, J.; Zhang, Y.; Norrman, J.; Paso, K.; Xiao, Z.Q. Organically modified nano-clay facilitates pour point depressing activity of polyoctadecylacrylate. Fuel 2016, 166, 96. [Google Scholar] [CrossRef]
  15. Alves, B.F.; Silva, B.K.; Silva, C.A.; Celestino, G.G.; Nunes, R.C.; Lucas, E.F. Preparation and evaluation of polymeric nanocomposites based on EVA/montmorillonite, EVA/palygorskite and EVA/halloysite as pour point depressants and flow improvers of waxy systems. Fuel 2023, 333 Pt 2, 126540. [Google Scholar] [CrossRef]
  16. Liu, Q.; Mo, L.; Yan, F.; Nie, C. Study on the Effect of Nano Pour Point Depressant on Wax Oil Crystallization. E3S Web Conf. 2024, 573, 01010. [Google Scholar] [CrossRef]
  17. Zhang, K.; Li, Z.X.; Duan, R.; Li, M.Y.; Wang, J.W.; Sheng, J.; Ren, H.; Wang, S.; Wang, X.M.; Hao, Y.N. Rheological Effects of Montmorillonite and Ethyl Cellulose for Xanthoceras sorbifolium Bunge Oil-based Lubricants. Bioresources 2024, 32, 1377. [Google Scholar] [CrossRef]
  18. Liu, K.; Zhao, G.; He, B.; Chen, L.H.; Huang, L.L. Immobilization of pectinase and lipase on macroporous resin coated with chitosan for treatment of whitewater from papermaking. Bioresour. Technol. 2012, 123, 616. [Google Scholar] [CrossRef]
  19. Adam, P.H.; Malcolm, R.M.; Thomas, S. Process intensification of biodiesel production using a continuous oscillatory flow reactor. J. Chem. Technol. Biotechnol. 2003, 78, 87. [Google Scholar] [CrossRef]
  20. Shara, S.; Eissa, E.; Basta, J. Polymers additive for improving the flow properties of lubricating oil. Egypt. J. Pet. 2017, 27, 795–799. [Google Scholar] [CrossRef]
  21. Shimada, Y.; Watanabe, Y.; Sugihara, A.; Tominaga, Y. Enzymatic alcoholysis for biodiesel fuel production and application of the reaction to oil processing. J. Mol. Catal. B Enzym. 2002, 17, 133. [Google Scholar] [CrossRef]
  22. Hao, Y.N.; Fu, Y.J.; Zhang, Y.Q.; Wang, X.M.; Xie, P.F.; Xue, Z.H. Study on preparation and properties of Xanthoceras sorbifolia oil-based lubricating oil. J. Chin. Cereals Oils 2023, 38. [Google Scholar] [CrossRef]
  23. Dhar, A.; Agarwal, A.K. Experimental investigations of effect of Karanja biodiesel on tribological properties of lubricating oil in a compression ignition engine. Fuel 2014, 130, 112. [Google Scholar] [CrossRef]
  24. Love, K.; Ankush, R. Friction and wear performance of olive oil containing nanoparticles in boundary and mixed lubrication regimes. Wear 2019, 426, 819. [Google Scholar] [CrossRef]
  25. Jiang, Q.F.; Liu, W.G.; Liao, Y.X.; Guo, J.C.; Li, H.N.; Li, J.H.; Chen, Y.X.; Su, X.B.; Hua, R. CTAB modification bentonite for enhanced Re adsorption and diffusion suppression. Kerntechnik 2024, 89, 340–350. [Google Scholar] [CrossRef]
  26. Garusinghe, U.M.; Varanasi, S.; Raghuwanshi, V.S.; Garnier, G.; Batchelor, W. Nanocellulose-montmorillonite composites of low water vapour permeability. Colloids Surf. A Physicochem. Eng. Asp. 2018, 540, 233–241. [Google Scholar] [CrossRef]
  27. Jin, Y.J.; Min, S.K.; Han, M.J.; Cheol, M.S. Graphite oxide/poly(methyl methacrylate) nanocomposites prepared by a novel method utilizing macroazoinitiator. Compos. Technol. 2008, 69, 186. [Google Scholar] [CrossRef]
  28. Tapas, K.; Saswata, B.; Partha, K.; Nam, H.K.; Kyong, Y.R.; Joong, H.L. Characterization and properties of in situ emulsion polymerized poly(methylmethacrylate)/graphene nanocomposites. Compos. A: Appl Sci. Manuf. 2011, 42, 1856. [Google Scholar] [CrossRef]
  29. Sneha, E.; Karthik, G.V.S.; Thampi, A.D.; Krishna, A.; Revikumar, A.; Rani, S. Experimental and quantum chemical investigation of bio-fuels/lubricants for its oxidative stability. J. Mol. Liq. 2021, 340, 117292. [Google Scholar] [CrossRef]
  30. Colclough, T. Role of additives and transition metals in lubricating oil oxidation. Ind. Eng. Chem. Res. 2002, 26, 1888–1895. [Google Scholar] [CrossRef]
  31. Fazal, M.A.; Sundus, F.; Masjuki, H.H.; Rubaiee, S.; Quazi, M.M. Tribological assessment of additive doped B30 biodiesel-diesel blend by using high frequency reciprocating rig test. Composites 2021, 6, 995. [Google Scholar] [CrossRef]
  32. GB/T 265-1988; Determination of Kinematic Viscosity and Calculation of Dynamic Viscosity of Petroleum Products. Standards Press of China: Beijing, China, 1988.
  33. SY/T 5651-1993; Technical Conditions for Petroleum Product Kinematic Viscosity Tester. Petroleum Industry Press: Beijing, China, 1993.
  34. ASTM D445-23; Standard Test Method for Kinematic Viscosity of Transparent and Opaque Liquids (and Calculation of Dynamic Viscosity). ASTM International: West Conshohocken, PA, USA, 2023.
  35. José, M.L.R.; María, J.G.G.; Vanesa, S. Tribological Performance of a Paraffinic Base Oil Additive with Coated and Uncoated SiO2 Nanoparticles. Materials 2024, 17, 1993. [Google Scholar] [CrossRef]
  36. GB/T 1995-1998; Calculation of Viscosity Index of Petroleum Products. Standards Press of China: Beijing, China, 1998.
  37. NB/SH/T 0248-2019; Viscosity Index Improvers for Lubricating Oils—Part 1: General Rules. Petroleum Industry Press: Beijing, China, 2019.
  38. Wang, Y.; Ou, S.; Liu, P.; Zhang, Z. Preparation of biodiesel from waste cooking oil via two-step catalyzed process. Energy Convers. Manag. 2007, 48, 184–188. [Google Scholar] [CrossRef]
  39. Faraguna, F.; Kraguljac, K.; Vidović, E.; Jukić, A. Crystallization and Pour Point of Solutions of the Dispersant Poly(Styrene-Co-Methacrylate) Viscosity Modifiers in Lubricating Base Oil. Tribol. Trans. 2017, 60, 1063–1069. [Google Scholar] [CrossRef]
  40. Nestor, U.S.; Veronica, P.M.; Kiyotaka, S.; Masatoshi, M. Crystallization behavior of neat biodiesel and biodiesel treated with ozonized vegetable oil. Eur. J. Lipid Sci. Technol. 2005, 107, 689. [Google Scholar] [CrossRef]
  41. Li, F.S.; Liu, Z.W.; Ni, Z.H.; Wang, H. Effect of biodiesel components on its lubrication performance. J. Mater. Res. Technol. 2019, 8, 3681. [Google Scholar] [CrossRef]
  42. Kokhanovsky, V.A.; Maiba, I.A.; Glazunov, D.V. Properties of Lubricant Additives in Slip with Boundary Friction. Russ. Eng. Res. 2023, 43, 135–137. [Google Scholar] [CrossRef]
  43. Liu, Z.W.; Li, F.S.; Shen, J.X.; Wang, H. Effect of oxidation of Jatropha curcas-derived biodiesel on its lubricating properties. Energy Sustain. Dev. 2019, 52, 33. [Google Scholar] [CrossRef]
  44. Marcia, M.M.; Clara, M.A.; Rui, F.S.; Carlos, A.A. Assessment of boundary lubrication in biodiesels by nanotribological tests. Energy 2013, 55, 273. [Google Scholar] [CrossRef]
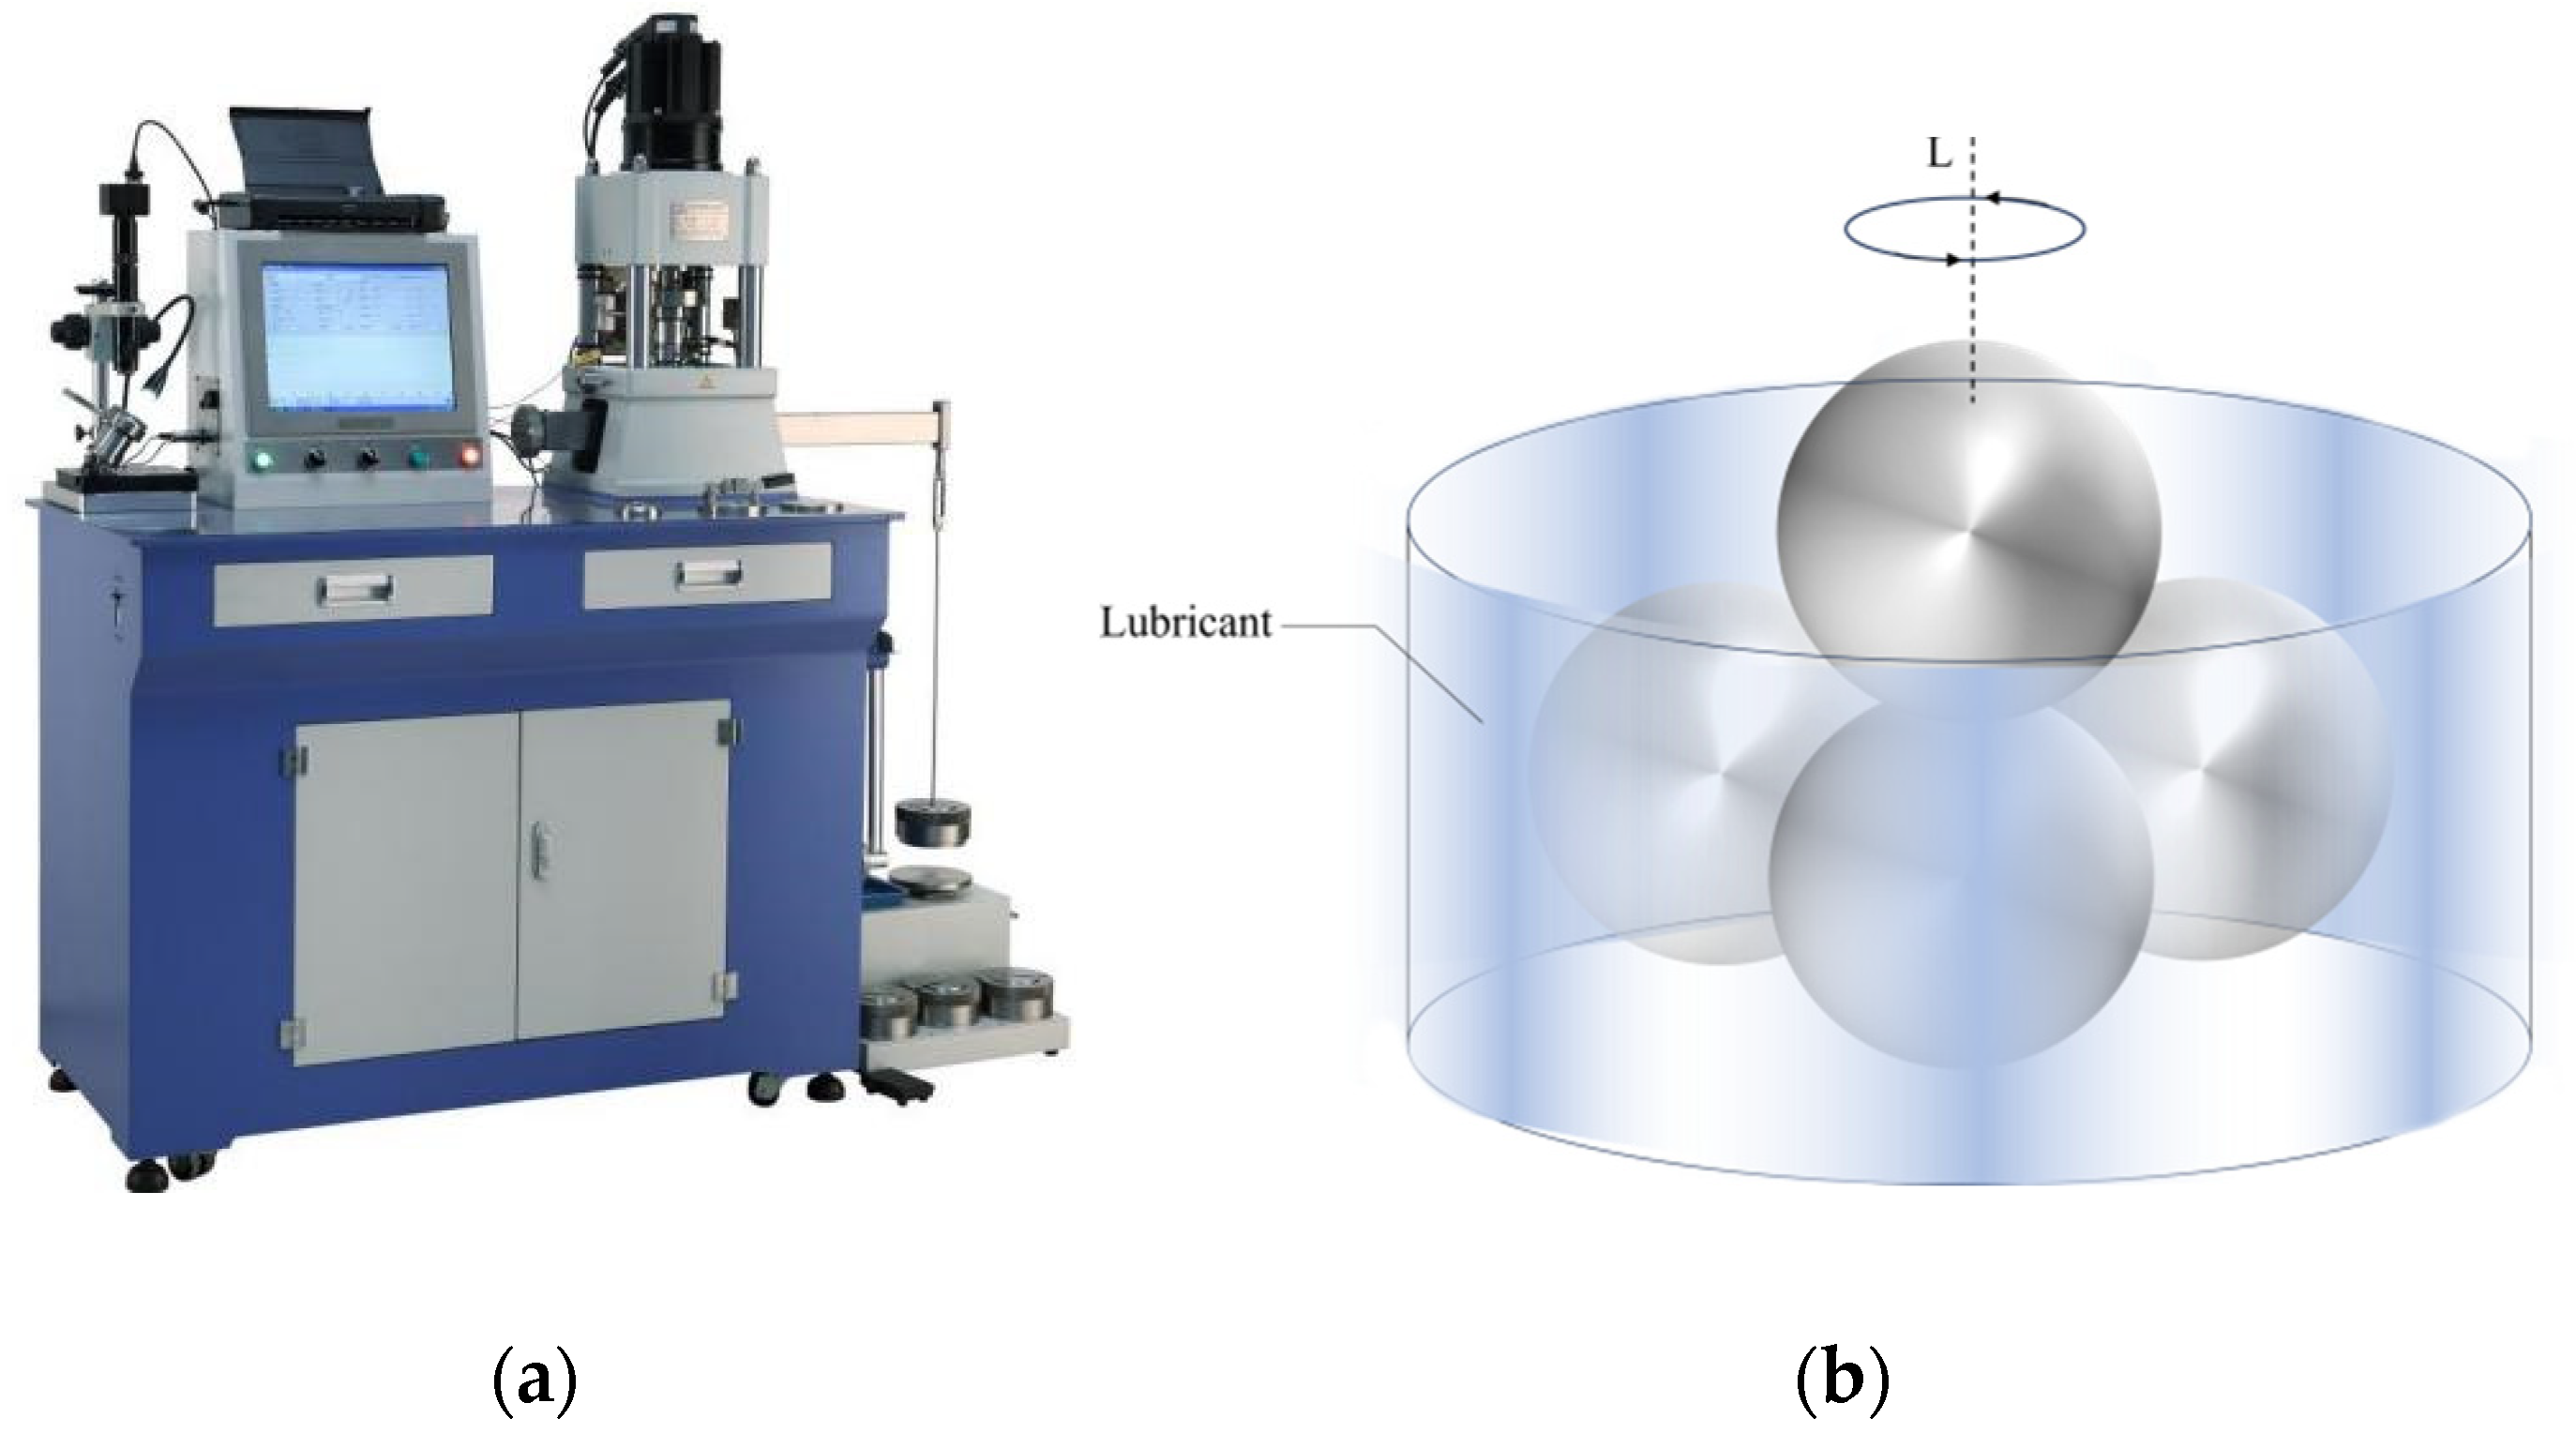
Figure 1. (a) High-Frequency Reciprocating Rig (HFRR). (b) Resistance machine schematic.
Lubricants 13 00417 g001
Figure 2. The effect of H2O2 on the pretreatment of waste oil under different conditions. (a) different times, (b) different temperatures, (c) different concentrations of H2O2.
Lubricants 13 00417 g002
Figure 3. Influence of activated clay and activated carbon on the treatment effect of waste oil. (a) different mixing ratios, (b) different additive additions, (c) different times (d) different temperatures.
Lubricants 13 00417 g003
Figure 4. The FT-IR Spectra of MMT, OMMT, EC, and CTAB-MMT/EC.
Lubricants 13 00417 g004
Figure 5. The SEM images of (A) MMT, (B) OMMT, and (C) CTAB-MMT (CTAB-modified montmorillonite), (D) CTAB-MMT/KH560-EC (CTAB-MMT modified by KH560 and EC).
Lubricants 13 00417 g005
Figure 6. XRD patterns of MMT, OMMT, and CTAB-MMT/KH560-EC [OMMT: EC (1:1, 2:1, 1:2)].
Lubricants 13 00417 g006
Figure 7. (a) XPS spectrum of CTAB-MMT/KH560-EC, (b) high-resolution XPS spectra of C1s and (c) high-resolution XPS spectra of O1s.
Lubricants 13 00417 g007
Figure 8. Thermogravimetric curves of MMT, EC, and CTAB-MMT/KH560-EC with diverse CTAB loadings.
Lubricants 13 00417 g008
Figure 9. The kinematic viscosity changes in bio-based lubricants at 40 °C and 100 °C under different preparation conditions. (a) different additive contents. (b) different times (c) different temperatures.
Lubricants 13 00417 g009
Figure 10. Polarized optical microscope images of crystal morphology of lubricating oil at different temperatures. (a1a3) are polarized optical microscopy images of the crystal morphology of lubricating oil at temperatures of −5 °C, −15 °C and −22 °C, respectively. (b1b3) are polarized light microscopy images of the crystal morphology of lubricating oil at temperatures of −5 °C, −15 °C and −22 °C, respectively.
Lubricants 13 00417 g010
Figure 11. Lubricating film formation mechanism of decomposition products during friction and wear process of lubricating oil.
Lubricants 13 00417 g011
Figure 12. (a) and (b) show the deposits generated during friction and wear in the lubricating oil.
Lubricants 13 00417 g012
Figure 13. TG-DSC: (a) Waste oil; and (b) Lubricating oil.
Lubricants 13 00417 g013
Table 2. Main index parameters of waste oil before and after pretreatment.
Acid Value (mg/g)Saponification Value (mg/g)Peroxide Value (meq/kg)Shuifen (%)Phospholipid Content (%)
Prior to pretreatment26.31207.8458.610.651.07
After the preliminary reasoning28.34200.9421.66<0.010.58
Table 3. KV of waste oil at 40 °C and 100 °C.
Name40 °C KV100 °C KV
raw oil11.4 mm2/s3.0 mm2/s
Table 4. The CTAB-MMT/KH560-EC-modified lubricant (1 wt%) exhibited a reduced friction coefficient.
NameFriction Coefficient
Waste oil0.099
1 wt% CTAB-MMT/KH560-EC0.081
Table 5. Correlation of the friction coefficient with the frictional regime.
Friction RegimeCoefficient of Friction μ
coulomb friction 0.15–0.40
boundary lubrication 0.08–0.10
mixed lubrication 0.02–0.08
fluid lubrication 0.001–0.005
Table 6. WSD of waste oil versus formulated oil (containing 1 wt% CTAB-MMT/KH560-EC).
NameNo. 1No. 2No. 3Mean Diameter of Pits
(mm)
X1Y1X2Y2X3Y3
Waste oil0.80.830.780.820.840.810.81
1 wt% CTAB-MMT/KH560-EC0.960.930.900.930.980.940.94
Table 7. RhAs are indicated in Table 7; the viscosity index (VI) is a measure of how the viscosity of lubricating oil (as a fluid) changes with temperature.
Main PerformanceWaste OilCTAB-MMT/KH560-EC Content 1%
Viscosity index120.9181.1
Acidity (mgKOHg)36.336.6
Condensation point (°C)−12−22
Flash point (°C)>290>290
Mechanical admixture (%)not havenot have
Ash content (%)0.010.01
Shuifen (%)0.050.01
Disclaimer/Publisher’s Note: The statements, opinions and data contained in all publications are solely those of the individual author(s) and contributor(s) and not of MDPI and/or the editor(s). MDPI and/or the editor(s) disclaim responsibility for any injury to people or property resulting from any ideas, methods, instructions or products referred to in the content.