Abstract
This study addresses the thermal hazards that arise during the initial engagement stage of wet clutches, where rapid heat generation within the transient lubricating film may cause premature film rupture, torque instability, and accelerated wear. To overcome these challenges, a coupled thermo–fluid model was developed to capture oil film flow, heat transfer, and viscous torque behavior under varying groove structures. A novelty of this work is the first integration of computational fluid dynamics (CFD) with response surface methodology (RSM) to systematically reveal how groove geometry—cross-sectional shape, number, and inclination angle—collectively influences peak temperature and viscous torque during the lubricating film stage. Simulation results show that spiral semi-circular grooves provide superior thermal management, reducing the peak friction plate temperature to 75.5 °C, while the optimized design obtained via RSM (groove depth of 0.89 mm, 19 grooves, and a 5.28° inclination angle) further lowers the maximum temperature to 68.2 °C and sustains torque transmission above 18.5 N·m. These findings demonstrate that rational groove design, guided by multi-objective optimization, can mitigate thermal risks while maintaining torque stability, offering new insights for the high-performance design of wet clutches.
1. Introduction
The main objective of this paper is to investigate the initial engagement process of wet clutches, with particular focus on the transient stage where torque transmission is governed by the lubricating oil film prior to asperity contact. This phase is critical because the thin film of entrained oil not only sustains viscous shear torque but also experiences rapid heat accumulation. If uncontrolled, such thermal loading may cause premature film rupture, torque instability, and accelerated surface wear, thereby undermining clutch durability. Understanding and controlling the thermo–fluid behavior of this lubricating film is therefore essential for ensuring smooth transition from the unengaged to the fully engaged state, and constitutes the central motivation of the present study. Moreover, wet clutches are widely employed in automatic transmissions and powertrain systems of new energy vehicles due to their excellent heat dissipation capacity, wear resistance, and smooth torque transfer characteristics [1]. However, under frequent engagement or high-speed and heavy-load conditions, the transient lubricating film stage is particularly vulnerable to thermal instability, which often precedes film breakdown and compromises operational reliability. These challenges have motivated numerous studies worldwide on the temperature field and engagement characteristics of wet clutch friction pairs [2].
In particular, several researchers have investigated transient temperature behavior and groove design effects in wet clutches. Zhu established a transient temperature field for the wet clutch friction pair, analyzing the effects of relative rotational speed and friction lining thickness on the transient thermal response [3].
Wang et al. simulated the transient temperature field of wet shift clutch friction and steel plates using Abaqus, highlighting radial temperature distribution patterns under linear engagement pressure [4].
Zhang et al. developed a thermal coupling model using ANSYS 11.0 to examine transient temperature and stress distributions on friction plates and oil grooves [5].
Cho et al. introduced an iterative CFD-based approach to simulate the squeeze film process in wet clutches, validated against analytical solutions and experiments [6].
Zheng et al. analyzed temperature and stress fields during the mixed friction stage, revealing relationships between maximum surface temperature, stress, and oil groove spacing [7].
Lu demonstrated via finite element simulations that double-arc oil groove friction plates improve heat dissipation compared to other designs [8].
Xiao et al. developed a 3D flow-solid model to predict friction plate temperatures during engagement [9].
Yan created a simplified finite element model with MATLAB 7.1-based optimization aimed at minimizing friction pair temperatures [10], and Ding conducted thermal coupling simulations for various oil groove structures, considering engagement pressure and material properties [11].
Taken together, these studies provide important foundations for understanding temperature evolution, oil film flow, and groove design in wet clutches. Nevertheless, Zhu and Zhang, while providing transient temperature modeling and thermal stress analysis, do not explore the influence of macro-scale groove geometry on viscous torque or systematic thermal management. Similarly, Cho and Ding advance oil-film simulation and groove effect studies but do not combine multi-parameter groove optimization with torque performance evaluation. This highlights a shared limitation: the absence of a systematic, multi-parameter approach that links groove number, cross-sectional shape, and inclination angle to both thermal regulation and torque stability during the initial engagement stage—a gap that the present study seeks to fill. In addition, several researchers have examined disengaged or transitional phases of wet clutch operation.
Leighton et al. developed a Reynolds-based numerical model that incorporated lubricant inertial effects to predict torsional viscous losses in disengaged wet brake conjunctions [12].
Morris proposed a multiphysics framework for predicting disc and interface temperatures during the slip phase of engagement [13].
Marklund developed a simulation-based design tool integrating fluid dynamics, contact mechanics, and thermal analysis to estimate torque transfer and temperature distribution under limited slip conditions [14].
Collectively, these works highlight the importance of modeling disengaged and transitional wet clutch conditions, but also underscore the lack of systematic approaches that couple detailed thermo–fluid–shear analysis with optimization frameworks to guide groove geometry design. This study addresses this by combining thermo–fluid–shear modeling with multi-objective optimization.
Based on the existing research, most studies focus on engagement process, friction plate materials, and applied pressure, whereas relatively few examine oil groove structure types, groove cross-sectional shapes, depths, or angles. Moreover, existing optimization studies largely rely on parameter fitting rather than systematic multi-objective evaluation.
Kaya et al. applied RSM and topology optimization to redesign a clutch fork, reducing stress and mass while improving stiffness [15]. Liu et al. used RSM with metaheuristic algorithms for forming process optimization [16], and Dogan et al. applied RSM and shape optimization to tractor clutch PTO fingers [17]. Collectively, these studies highlight the strengths of response surface methodology (RSM) in enabling mechanism-oriented, multi-objective optimization across mechanical components and process parameters. They illustrate how systematic exploration of parameter interactions allows quantitative prediction of performance responses, providing methodological insight relevant to the present study on wet clutch groove geometry optimization.
Nevertheless, the application of RSM specifically to wet clutch friction plates, particularly during the transient lubricating-film stage where thermal management and viscous torque are tightly coupled, remains limited. While prior work demonstrates the general potential of RSM for multi-objective design, it has largely been confined to structural components or manufacturing processes. Notably, no systematic study has yet applied RSM to optimize groove number, cross-sectional shape, and inclination in wet clutch friction pairs under coupled thermo–fluid–shear conditions. This gap underscores both the relevance and novelty of the present research, which leverages RSM as a strategic tool to capture complex variable interactions, guide optimized groove design, and set the stage for the subsequent CFD-based analysis.
In summary, while earlier investigations have significantly advanced understanding of thermal effects in wet clutches, most efforts treated groove geometry in isolation or emphasized only temperature evolution, with limited attention to how macro-structural parameters collectively influence both thermal behavior and viscous torque during the lubricating film stage. This leaves an important knowledge gap in systematic design of groove structures that can balance heat dissipation with torque stability in the critical initial phase of engagement.
The present paper addresses this gap by developing a CFD-based thermo–fluid–shear coupling model, tailored to the transient lubricating film stage, and integrating it with response surface methodology (RSM) [18]. This combined framework enables systematic evaluation of groove cross-sectional form, number, and inclination angle, and further identifies optimized parameter sets through multi-objective regression analysis. By doing so, this study aims not only to mitigate thermal hazards but also to ensure reliable torque transmission. The approach proposed herein therefore establishes a clear pathway from problem identification to solution, providing new insights and practical guidance for the high-performance design of wet clutch friction pairs [19].
2. Mathematical Model
- 1.
- Continuum and Incompressible Fluid:
The lubricating oil is modeled as a continuum and treated as incompressible. This is a standard simplification in hydrodynamic lubrication analysis, since the pressure variations that develop during clutch engagement are insufficient to cause measurable compressibility effects.
- 2.
- Uniform Initial Conditions:
The initial temperature field of both the lubricating oil and the clutch plates is assumed to be spatially uniform. This allows this study to isolate the influence of groove geometry on transient heat generation and torque transmission, without complications arising from non-uniform starting conditions.
- 3.
- Smooth Surface Contact:
The friction plate and steel plate surfaces are idealized as perfectly smooth, with surface asperities neglected. This assumption reflects the focus of the present study on the lubricating film-dominated stage, prior to direct asperity contact.
- 4.
- Constant Material Properties:
The thermal and physical properties of the lubricant, steel plate, and friction material are assumed to remain constant during the short transient engagement stage. The variation of properties with temperature is relatively small within the studied range and does not significantly affect the dominant thermo–fluid mechanisms.
- 5.
- Single-Pair Representation:
The engagement process is represented by a single friction pair with periodic boundary conditions applied. This approach is widely used because torque transmission in multi-plate clutches occurs through the repetition of individual plate interactions, and a representative pair captures the essential thermo–fluid behavior.
- 6.
- Neglect of Cavitation and Phase Change:
Phenomena such as cavitation, aeration, or phase change within the lubricating film are neglected. These effects are secondary in the short-duration lubricating film stage considered, and their exclusion improves numerical stability without undermining the accuracy of the primary thermal and flow mechanisms.
These assumptions simplify the problem to a tractable level while preserving the dominant physics of viscous shear, convective heat transfer, and torque generation during the lubricating film stage of wet clutch engagement.
2.1. Heat Generation Model of Friction Pair
The principle diagram of heat conduction in the friction pairs of a wet clutch is shown in Figure 1 [20]. During power transmission, relative sliding occurs between the friction pairs, generating transient frictional heat, which is represented by heat flux density [21,22]. Based on the relationships among the various parameters, the heat flux density can be expressed in a Cartesian coordinate system as follows [23]:
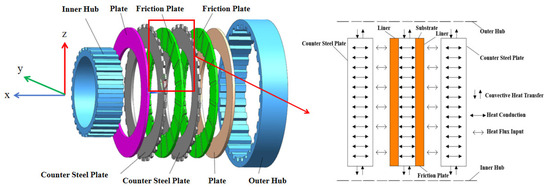
Figure 1.
Principle diagram of heat transfer process in the friction pair.
In the equation:
q represents the heat flux density at a certain point per unit area.
μ is the friction coefficient.
Pi is the contact pressure at that point.
Δω is the speed difference between the friction plate and the mating steel plate.
r is the radius of the point from the center of the friction pair.
x, y, z are the coordinates of the point.
Δω.r gives the relative linear velocity.
To ensure the temperature distribution of the fluid between the friction pairs, it is necessary to define the thermal boundary conditions on the fluid boundary. Typically, three types of thermal boundary conditions are considered: convective heat transfer, isothermal, and adiabatic boundaries.
The convective heat transfer boundary condition can be expressed as:
where
is the convective heat transfer coefficient, k is thermal conductivity of lubricant,
and
are the wall temperatures of the friction plate and the mating steel plate under convective heat transfer conditions, respectively.
The convective heat transfer coefficient is determined using the following method:
In this equation, de is characteristic length,
,
.
In the formula:
is the cross-sectional area of the fluid flow groove, for the fluid between the friction pairs is,
,
and
are the inner and outer diameters of the friction disc, h is defined as the transient thickness of the lubricating film between the friction pairs during the initial phase of engagement. Pω is the contact length between the fluid flow groove and the fluid contact surface,
and
is the characteristic length of the groove,
is the Nusselt number,
is the Reynolds number, and
is the Prandtl number.
The convective heat transfer boundary condition can be expressed as Equation (6):
The convective heat transfer coefficient is determined using the method described in Equation (7):
In the formula,
and
are the wall temperatures of the friction plate and the dual steel plate under isothermal boundary conditions, respectively.
Under continuous temperature conditions, the distribution coefficient Kq is related to the physical properties of the materials. The distribution coefficient Kq is given by:
In the equation, qs and qf represent the heat flux inputs from the mating steel plate and the friction plate, respectively. λs and λf denote the thermal conductivities; ρs and ρf are the densities; Cp, Cs, Cf: Specific heat capacities of oil, steel plate, and friction plate, used in Equations (5) and (7) to compute transient temperature rise. These parameters are critical for accurately determining the thermal response of the clutch components under engagement conditions.
The thermal conductivity values λs and λf in Table 1 are used in Equation (8) to calculate the heat partitioning ratio Kq between the friction plate and mating steel plate:

Table 1.
Material properties of the friction pair.
The heat generated by the friction plate and the steel plate can be calculated as follows:
2.2. Turbulence Model
In fluid dynamics research, the classification of flow regimes is typically based on the critical Reynolds number (Re) criterion. According to the classical theory established by Osborne Reynolds, when the Reynolds number exceeds the critical threshold (Re_c = 3.0 × 10⁵), the fluid exhibits turbulent flow; otherwise, it maintains laminar flow characteristics [24].
In this study, the lubrication characteristics of the friction pairs in a wet clutch are analyzed. The key geometric and motion parameters of the system are detailed in Table 2. Notably, the maximum angular velocity of the driving disc in the friction pair reaches 156 rad/s (corresponding to the maximum linear velocity
). The flow state of the oil film formed on the surface of this rotating component has a decisive influence on the overall lubrication performance of the system.

Table 2.
Main parameter setting.
Based on boundary layer theory, the lubrication oil flow dominated by the circumferential velocity of the driving disc can be used as a representative parameter for the flow regime of the entire friction pair. Therefore, by calculating the Reynolds number of the lubricating oil on the surface of this component, the global flow characteristics of the friction pair can be effectively determined.
Based on the characteristic parameter selection criterion for rotation-dominated flow, this study selects the driving plate of the friction pair as the characteristic analysis object and establishes a dimensionless criterion number expression based on the rotational radius (R) as follows:
In the formula:
is the density of lubricating oil, u is the dynamic viscosity, and
is the angular velocity. After calculation, the characteristic Reynolds number Re = 6.97 × 10⁴ is significantly lower than the critical threshold (Re_c = 3.0 × 10⁵), indicating that the lubricating oil in the active plate boundary layer exhibits typical laminar motion characteristics.
Further investigate the pure radial flow condition (friction pair stationary, maximum inlet velocity of lubricating oil v = 10 m/s). According to the simplified form of the Navier Stokes equation, this flow mode can be equivalent to Poiseuille flow between parallel plates, and its Reynolds number expression is:
In the formula: Vmax is radial flow velocity, r2 is hydraulic diameter; The calculated Reynolds number, Re = 6.1 × 10⁴, remains significantly lower than the critical threshold, further confirming the existence of a laminar flow regime.
Based on the flow analysis under both rotational and radial driving modes, a definitive conclusion can be established: under all operating conditions considered in this study, the lubricating oil flow in the wet clutch satisfies the laminar flow criterion of Re < Re_c. Accordingly, in the subsequent fluid dynamics simulations conducted using Fluent, the Laminar flow model is adopted to accurately characterize the system’s flow field, and this model selection is theoretically consistent and rigorously justified.
3. Temperature Field Analysis of Friction Pair During Wet Clutch Engagement
3.1. Establishment of Temperature Field Calculation Model
Computational fluid dynamics (CFD) is one of the effective methods for calculating temperature fields. To verify the correctness of the aforementioned theory, the friction pair temperature field model established in this study is solved using ANSYS Fluent software 2023R1. A heat–flow coupling approach is adopted to analyze the temperature distribution during the engagement process of the friction pair. Given that torque transmission in wet clutches occurs through successive engagement of individual friction pairs, analyzing a single representative pair is sufficient to capture the thermal behavior. Moreover, since the oil film formed between the friction pairs exhibits a nearly annular contact pattern, the model is simplified accordingly, as shown in Figure 2 (the internal and external gears of the driving and driven plates are not depicted). In this context, simulation analyses are conducted on radial-groove and spiral-groove friction plate structures to investigate their influence on heat dissipation characteristics.
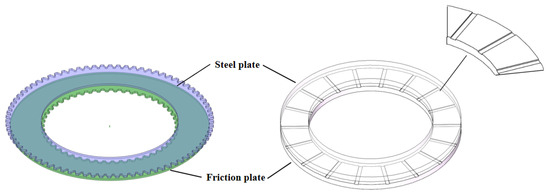
Figure 2.
Coupled calculation model of heat flux for a single pair of friction pairs.
3.2. Boundary Condition Setup
In this study, Fluent software is used to simulate the temperature field during the friction pair engagement process. The following boundary conditions are set to ensure an accurate solution of the temperature field [25]. It is important to note that the present study focuses exclusively on the transient viscous shear stage prior to asperity contact, where the lubricating film remains dominant. Any references to oil film rupture herein refer specifically to premature rupture within this stage, not to the intended breakdown associated with boundary lubrication in fully engaged clutches.
Initial Conditions: The fluid is considered incompressible with a density of 850 kg/m3, and the ambient pressure is set to standard atmospheric pressure.
Oil Properties and Film Behavior: The oil temperature is set to 27 °C, with a density of 850 kg/m3 and a dynamic viscosity of 0.01 Pa·s. During the engagement process (t = 0.5 s), the lubricating film thickness is dynamically reduced from 3 mm to 0.02 mm to represent the compression process between the friction pairs under dip lubrication conditions.
Inlet: Velocity inlet.
Outlet: Standard atmospheric pressure.
Model Setup: Laminar flow and MRF (Multiple Reference Frame) models are used with a mesh grid.
Solution Method: The SIMPLE algorithm and first-order upwind scheme are employed for numerical simulation.
Residual Accuracy: Iterative calculations converge when the residual is reduced to 10−10.
3.3. Mesh Independence Test
The friction pair heat–flow coupling calculation model is named, and a fluid-structure interface is established between the fluid and solid. Periodic boundary conditions are applied to both sides of the model, as shown in Figure 3.
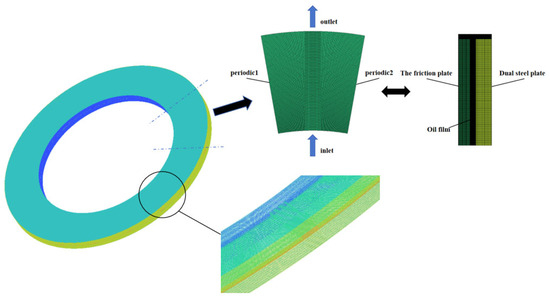
Figure 3.
Model naming diagram.
The mesh division is shown in Figure 4. Since the number of meshes has a significant impact on the entire calculation process during the simulation, it is essential to verify the rationality of the mesh. To find the appropriate mesh parameters, models with different mesh quantities were generated, including 350,000, 550,000, 1 million, 1.5 million, 2.2 million, and 2.5 million meshes, as listed in Table 3. The models were set up and calculated under the same parameter conditions, and the temperature values at different mesh quantities were analyzed.
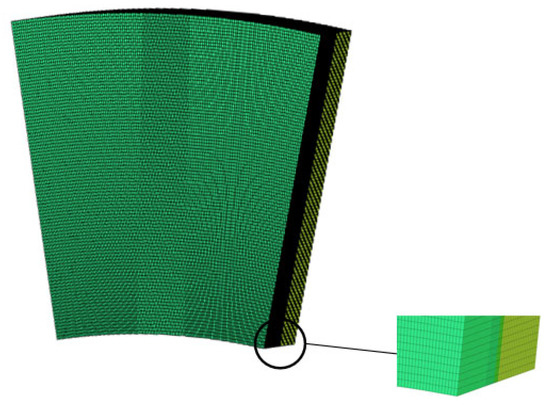
Figure 4.
Model mesh diagram.

Table 3.
Mesh division table.
As shown in Figure 5, with the change in the number of meshes, especially after the mesh quantity exceeds 1 million, the temperature variation is minimal. The temperature change for all mesh models is less than 0.1 K. Therefore, to improve computational efficiency, the simulation below will use the same mesh size as the model, with a mesh quantity of 1.5 × 10⁶.

Figure 5.
Maximum heat distribution corresponding to the mesh.
3.4. Simulation Results of Temperature Field
To meet the demands of variable operational conditions, improved friction plate structures are required to ensure stable and efficient performance. In this study, two representative groove configurations—radial and spiral oil grooves—were selected for transient flow field analysis. Based on the Fluent simulation platform and employing a dynamic mesh approach, the transient evolution of the flow field during the clutch engagement process was simulated, focusing on the compressive transition of the lubricating film during the engagement period (t = 0.5 s). The analysis investigates the velocity and pressure distributions of the lubricating oil under both groove structures, and further explores the resulting temperature field characteristics, aiming to clarify the influence of groove geometry on lubrication and heat transfer behavior.
3.4.1. Lubricating Oil Velocity Analysis
Transient simulations were conducted to investigate the flow characteristics of different groove designs. Figure 6 illustrates the velocity vector distributions of the cooling lubricating oil on both the friction plate and the corresponding steel plate for radial and spiral grooves at the minimum film clearance during engagement (t = 0.5 s).
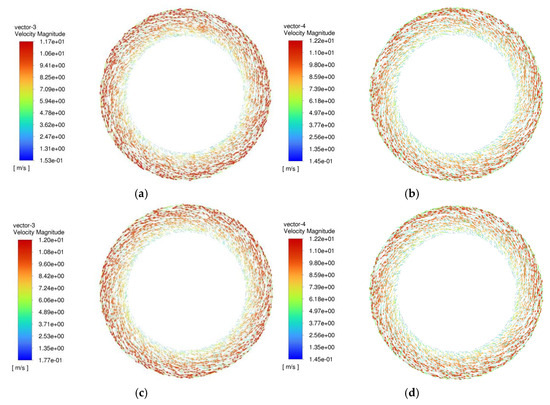
Figure 6.
Oil velocity distribution of spiral groove friction plate and mating steel plate at minimum clearance. (a) Velocity vectors on the friction plate with radial grooves at minimum clearance. (b) Velocity vectors on the steel plate corresponding to radial grooves at minimum clearance. (c) Velocity vectors on the friction plate with spiral grooves at minimum clearance. (d) Velocity vectors on the steel plate corresponding to spiral grooves at minimum clearance.
As shown in Figure 6, for the friction plate with radial grooves, the oil velocity increases progressively from the inner to the outer radius, reaching a maximum near the outer edge. During the engagement process, the rotational speed of the steel plate remains constant, yet the oil velocity on its surface also increases with time. This observation suggests that the friction plate’s rotational speed not only affects the oil flow on its own surface but also influences the flow behavior on the mating steel plate. The oil velocity within the entire friction pair is thus determined by the combined effects of both the friction plate and the steel plate.
Similarly, Figure 6 shows the velocity distribution for the spiral groove design. A comparable trend is observed, where oil velocity increases radially outward. However, the spiral groove induces higher overall flow velocities compared to the radial groove under identical conditions. This indicates that, during engagement, the spiral groove allows a larger volume of cooling lubricating oil to pass through the friction pair per unit time, potentially enhancing heat dissipation efficiency relative to the radial groove design.
3.4.2. Lubricating Oil Pressure Analysis
Transient simulations were also performed to analyze the pressure distribution within the friction pair for different groove geometries. Figure 7 presents the pressure contour plots on the friction plates with radial and spiral grooves at a clearance of 0.02 mm (t = 0.5 s).
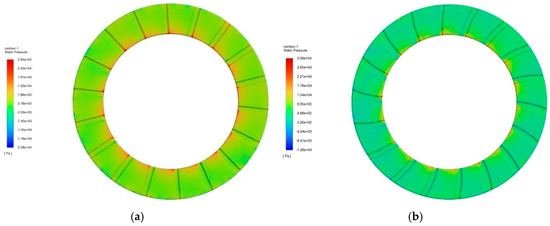
Figure 7.
Pressure distribution comparison of radial and spiral groove friction plates at minimum clearance. (a) Pressure distribution on the friction plate with radial grooves at minimum clearance. (b) Pressure distribution on the friction plate with spiral grooves at minimum clearance.
As shown in Figure 7, at t = 0.5 s, when the clutch engagement reaches the minimum film clearance, the high-speed rotation of the wet clutch induces vortex structures within the lubricating film. These vortices result in localized regions of reduced fluid pressure, even generating transient low-pressure zones near the groove edges.
A comparison of the two groove types reveals that the pressure distribution for the spiral groove design is more uniform than that of the radial groove. This suggests that spiral grooves facilitate a more even distribution of lubricating oil between the friction pairs, leading to improved lubrication effectiveness and potentially enhanced thermal stability during engagement.
3.4.3. Analysis of Temperature Field of Friction Pair with Radial and Spiral Oil Grooves
At a speed differential of 1000 r/min for the wet clutch, the temperature contour plots for the radial oil groove friction plate and mating steel plate are shown in Figure 8. The temperature contour plots for the helical oil groove friction plate and mating steel plate are shown in Figure 8.
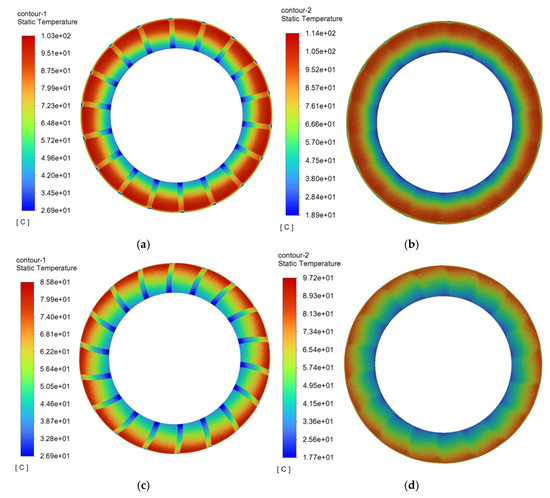
Figure 8.
Temperature contour plot of helical oil groove friction pair. (a) Radial oil groove friction plate temperature contour plot. (b) Radial oil groove mating steel plate temperature contour plot. (c) Helical oil groove friction plate temperature contour plot. (d) Helical oil groove mating steel plate temperature contour plot.
As shown in Figure 8a,c, the temperature of the radial oil groove friction plate exhibits a ring-like gradient distribution, gradually increasing from the inner diameter to the outer diameter, with the highest temperature concentrated in the outer edge region. The primary cause of this phenomenon is that the radius in the outer edge region is larger, resulting in higher linear velocity, which generates more frictional heat. Additionally, the cooling lubricating oil flows in from the inner edge, where the temperature is lower, and the convective heat transfer effect with the friction plate surface is significantly more effective than in the outer edge region, causing the temperature to increase with the radius. Furthermore, the oil groove area of the friction plate does not directly contact the mating steel plate during the engagement process, so no frictional heat is generated. This area also has a larger volume of cooling oil flow, maintaining the overall temperature at a lower level.
Figure 8b,d show the temperature distribution of the radial oil groove mating steel plate, which follows a similar trend to that of the friction plate, also exhibiting a ring-like gradient from the inner to the outer region. It should be noted that due to the difference in materials between the friction plate and the mating steel plate, the heat source distribution coefficient varies. The heat source distribution coefficient of the friction plate is smaller than that of the mating steel plate, so the temperature on the surface of the mating steel plate is generally higher than that of the friction plate during the engagement process.
From the temperature distribution of the spiral oil groove friction pair shown in Figure 8, it can be seen that the temperature distribution of both the friction plate and mating steel plate under the spiral oil groove structure also exhibits a ring-like gradient, with lower temperatures at the inner region and higher temperatures at the outer region. The overall trend is similar to that of the radial oil groove friction pair. However, the maximum temperature of the spiral oil groove friction plate is 85.8 °C, which is 17.2 °C lower than that of the radial oil groove friction plate; similarly, the maximum temperature of the spiral oil groove mating steel plate is 97.2 °C, which is 16.8 °C lower than that of the radial oil groove mating steel plate. This indicates that the spiral oil groove friction plate has better heat dissipation performance than the radial oil groove structure.
The superior heat dissipation effect of the spiral oil groove is primarily attributed to its higher lubricating oil flow rate, which forms a stronger forced convective heat transfer effect on the friction pair surface, significantly improving the heat removal efficiency. It is worth noting that the flow state of the oil in the friction pair is influenced by both the friction plate and mating steel plate structures. The optimization of the oil groove geometry not only affects the friction plate’s own thermal management ability but also has a significant impact on the thermal characteristics of the mating steel plate.
In summary, the friction plate with a spiral oil groove structure exhibits better thermal management capabilities during the engagement process of the wet clutch compared to the radial oil groove structure. This can effectively reduce the operating temperature of the friction pair, thereby alleviating heat-induced failure phenomena to some extent and improving the system’s operational stability and lifespan.
3.4.4. Analysis of Temperature Field of Friction Pair with Different Cross-Sectional Shapes of Oil Grooves
Under the operating conditions of frequent engagement in wet clutches, the friction pair must possess excellent heat dissipation performance to prevent thermal failure. According to related studies, the cross-sectional shape of the friction plate oil groove significantly impacts the temperature distribution during the engagement process. Currently, the rectangular oil groove cross-section is widely used in engineering applications. To explore the effect of different cross-sectional shapes on the thermal characteristics of the friction pair, this study designs four friction plate models with oil groove cross-sections: rectangular (Figure 9a), triangular (Figure 9b), trapezoidal (Figure 9c), and semicircular (Figure 9d). All the oil grooves are arranged in a spiral pattern, and the depth and cross-sectional area of the oil grooves in each model are kept the same to eliminate the interference of geometric dimensions on thermal performance [26].
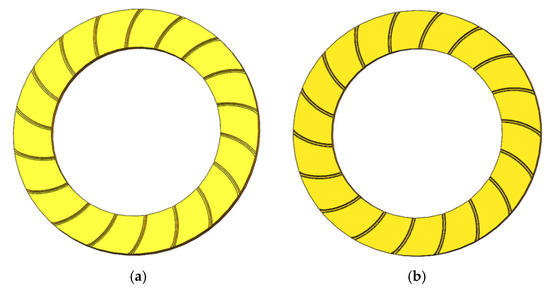

Figure 9.
Friction plates with different cross-sectional shapes. (a) Helical rectangular oil groove friction plate. (b) Helical triangular oil groove friction plate. (c) Spiral trapezoidal oil groove friction plate. (d) Spiral semicircular oil groove friction plate.
From the temperature contour maps of the friction pairs with different oil groove cross-sectional shapes shown in Figure 10, Figure 11, Figure 12 and Figure 13, it can be observed that although the surface temperature of the friction plate and the mating steel plate in each model exhibits a circular temperature gradient that increases from the inner to the outer radius, the highest temperature values vary between the models.
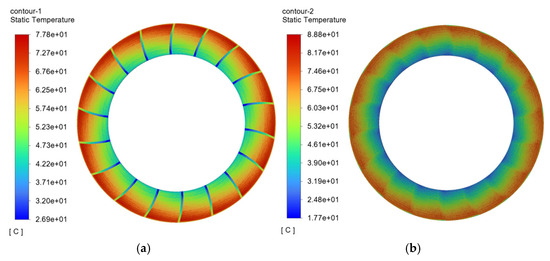
Figure 10.
Temperature contour map of the friction pair with spiral rectangular oil groove friction plate. (a) Temperature contour map of spiral rectangular oil groove friction plate. (b) Temperature contour map of mating steel plate.
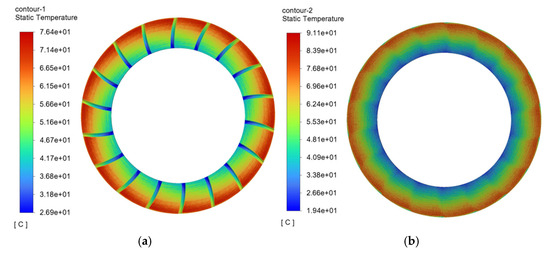
Figure 11.
Temperature contour map of the friction pair with spiral triangular oil groove friction plate. (a) Temperature contour map of spiral triangular oil groove friction plate. (b) Temperature contour map of mating steel plate.
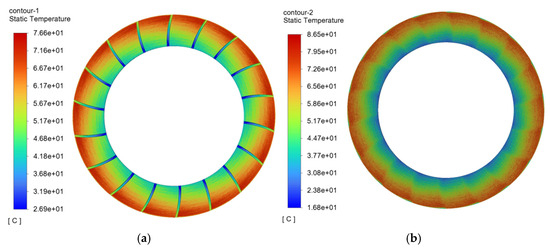
Figure 12.
Temperature contour map of the friction pair with spiral trapezoidal oil groove friction plate. (a) Temperature contour map of spiral trapezoidal oil groove friction plate. (b) Temperature contour map of mating steel plate.
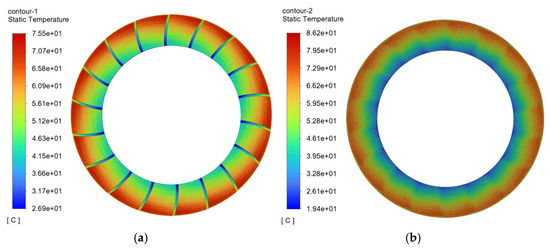
Figure 13.
Temperature contour map of the friction pair with spiral semicircular oil groove friction plate. (a) Temperature contour map of spiral semicircular oil groove friction plate. (b) Temperature contour map of mating steel plate.
Further comparative analysis of the highest temperature results shown in Figure 14 reveals that when the oil groove surface shape is spiral, the cross-sectional shape of the groove significantly affects the maximum temperature of the friction pair. Among the different shapes, the friction plate with a semicircular cross-sectional oil groove has the lowest maximum temperature of 75.5 °C, while the friction plate with a rectangular cross-sectional oil groove has the highest maximum temperature of 77.8 °C, with a temperature difference of 2.3 °C. Thus, it can be concluded that among the four cross-sectional shapes, the semicircular cross-sectional oil groove exhibits the best heat dissipation performance.
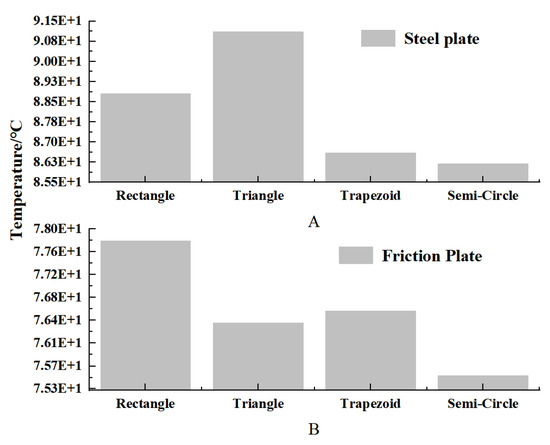
Figure 14.
Temperature comparison of friction pairs with different oil groove cross-sectional shapes. (A) Surface temperature of steel plate under different groove cross-sections; (B) Surface temperature of friction plates under different groove cross-sections.
Regarding the corresponding mating steel plate temperature, the mating steel plate corresponding to the semicircular oil groove friction plate also has the lowest maximum temperature of only 86.2 °C, while the mating steel plate corresponding to the triangular oil groove friction plate has the highest temperature of 91.1 °C, with a temperature difference of 4.9 °C, indicating that the cross-sectional shape of the oil groove has a more significant impact on the temperature of the mating steel plate.
A comprehensive analysis shows that the cross-sectional geometry of the oil groove not only determines the heat dissipation capability of the friction plate itself but also significantly affects the thermal response behavior of the mating steel plate. Based on the above analysis results, it is recommended to prioritize the use of semicircular cross-sectional oil grooves in the structural optimization design of wet clutch friction plates to improve the overall thermal management performance of the friction pair and reduce the risks of material performance degradation and thermal failure caused by heat accumulation.
4. Optimization Design of Friction Plate Oil Grooves Based on Response Surface Analysis
4.1. Response Surface Method Experimental Scheme
During the engagement process of a wet clutch, the friction pair undergoes several stages: the liquid friction stage, the mixed friction stage, and the rough contact friction stage. In the liquid friction stage, there is a gap between the friction plate and the mating steel plate, through which the lubricating oil flows. This stage is typically brief and transitions rapidly into mixed and boundary lubrication as the engagement proceeds. At this stage, a thin lubricating film temporarily bears the initial engagement pressure, and the entrained oil between the friction plate and the mating steel plate generates viscous torque before transitioning to mixed lubrication. When the oil groove structural parameters of the friction plate are altered, the load-bearing capacity of the oil film and the transmitted viscous torque will also change accordingly. In the mixed friction stage, different structural parameters of the friction plate’s oil groove affect the flow rate of lubricating oil in the groove, thereby influencing the cooling effect of the friction pair. By optimizing the structural parameters of the friction plate’s oil groove to reduce the maximum temperature of the friction plate during engagement, the occurrence of high-temperature-induced failures in the friction pair can be minimized [27].
Using the Box–Behnken Design (BBD) module in Design-Expert software version 12, response surface analysis was performed on the structural parameters of the spiral semicircular oil groove in the wet clutch friction plate. The parameters analyzed include the oil groove depth (as shown in Figure 15a), the inclination angle (as shown in Figure 15b), and the number of oil grooves. The analysis produced mathematical regression equations relating the highest temperature of the friction plate and the viscous torque to the structural parameters of the oil grooves. The objective was to minimize the highest temperature of the friction plate while ensuring adequate viscous torque transmission. The optimal values of the mathematical regression model were determined [28,29].
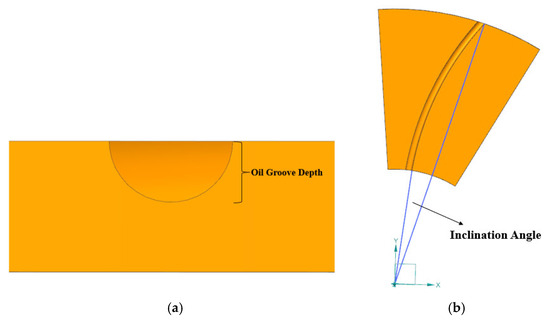
Figure 15.
Structural diagrams of oil groove parameters. (a) Schematic of oil groove depth. (b) Schematic of inclination angle.
4.2. Single Factor Analysis
Response surface methodology (RSM) is a statistical and mathematical optimization approach widely applied in engineering to explore the relationships between multiple design variables and performance responses, particularly in systems characterized by nonlinear interactions. In the context of wet clutch analysis, RSM provides an efficient framework to establish predictive models that link groove geometry parameters—such as depth, number, and inclination angle—to key performance indicators, including peak temperature and viscous torque during the transient lubricating film stage.
By integrating RSM with CFD simulation data, this study develops a regression-based model that not only captures the thermo–fluid coupling behavior of different groove configurations but also enables multi-objective optimization for identifying design solutions that balance thermal management and torque transmission performance. This methodological integration enhances computational efficiency while ensuring accuracy in the parametric analysis of complex coupled phenomena in wet clutches.
4.2.1. Effect of Friction Plate Oil Groove Depth on Temperature and Transmitted Viscous Torque
Under the condition of a spiral semicircular friction plate with an oil groove inclination angle of 4° and 18 grooves, the effect of oil groove depth on the maximum temperature and viscous torque of the friction plate is investigated. As shown in Figure 16, with the increase in oil groove depth, the maximum temperature of the friction plate continuously decreases, reducing by approximately 111 °C. The temperature decreases most rapidly in the depth range of 0.4–0.7 mm, while the rate of decrease gradually diminishes in the range of 0.7–1.0 mm. Although the temperature reduction is most significant in the 0.4–0.7 mm range, the maximum temperature of the friction plate is still relatively high in this range, which may lead to high-temperature failure of the friction pair. The viscous torque decreases with increasing oil groove depth, with a total reduction of approximately 1.9 N·m. When the groove depth increases from 0.9 mm to 1.0 mm, the change in torque is minimal. This is because the viscous torque between the friction pair decreases with increasing oil film thickness, and once the film thickness reaches a certain size, the viscous torque of the oil film no longer contributes to torque transmission. In summary, considering both temperature and torque variations, an optimal range for the oil groove depth of the friction plate is between 0.7 mm and 0.9 mm.
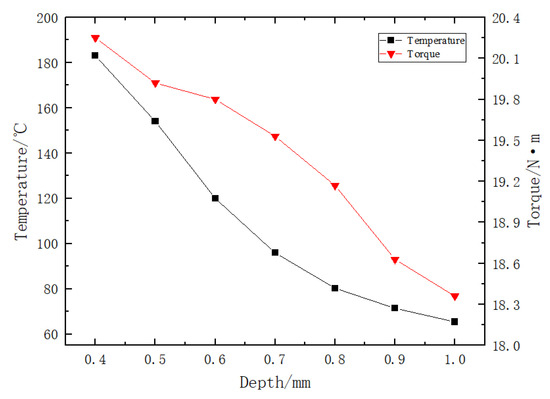
Figure 16.
Effect of oil groove depth on friction plate temperature and viscous torque transmission.
4.2.2. Effect of Friction Plate Oil Groove Number on Temperature and Transmitted Viscous Torque
Keeping the spiral semi-circular friction plate oil groove angle at 4°, and the depth at 0.7 mm, the effect of the number of oil grooves on the maximum temperature of the friction plate and the transmitted viscous torque was investigated. As shown in Figure 17, increasing the number of oil grooves from 10 to 24 resulted in a reduction of approximately 48 °C in the maximum temperature of the friction plate and a decrease of about 1.3 N·m in the transmitted torque. This is because a higher number of oil grooves reduces the contact friction area between the friction plate and the counter steel plate, thereby decreasing the frictional heat generated. Additionally, more cooling lubricating oil flows through the friction pair, carrying away more heat. Therefore, the number of oil grooves significantly affects the temperature of the friction plate. The increase in the number of oil grooves on the friction plate results in a larger area of oil film separation, which leads to a reduction in the transmitted viscous torque. When the number of oil grooves is less than 16, the maximum temperature of the friction plate exceeds 100 °C, which negatively impacts the service life of the wet clutch friction pair. Conversely, when the number of oil grooves exceeds 20, the rate of decrease in viscous torque increases, leading to a loss of excessive engagement torque and affecting the clutch’s transmission efficiency. Therefore, selecting a number of oil grooves between 16 and 20 is the most suitable range for optimization parameters. It should be noted that the calculated fluid shear torque is influenced by multiple factors, including friction plate size, oil groove geometry, lubrication regime, and engagement conditions.
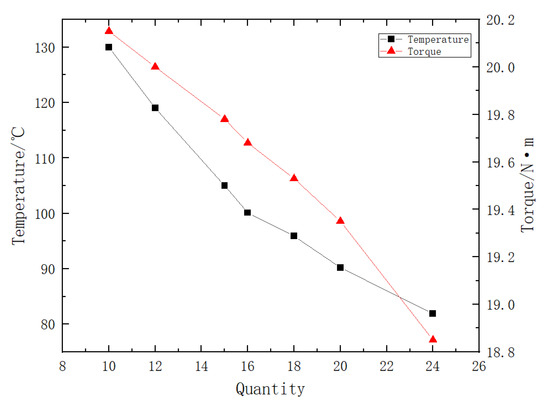
Figure 17.
Effect of oil groove number on friction plate temperature and transmitted viscous torque.
4.2.3. Effect of Friction Plate Oil Groove Inclination Angle on Temperature and Transmitted Viscous Torque
Maintaining a spiral semi-circular friction plate oil groove depth of 0.7 mm and a groove number of 18, the effect of the oil groove tilt angle on the maximum temperature of the friction plate and the transmitted viscous torque is studied. As shown in Figure 18, when the tilt angle of the friction plate oil groove increases from 2° to 9°, the maximum temperature of the friction plate decreases by approximately 17.7 °C. The temperature change is most significant when the tilt angle increases from 2° to 7°. This is because a larger tilt angle reduces the contact area between the friction plate and the counterpart steel plate, thus decreasing the frictional heat generated. Additionally, the increased inlet cross-sectional area of the oil groove allows more lubricant to flow through per unit time, which carries away more heat. When the tilt angle of the oil groove increases from 7° to 9°, the maximum temperature of the friction plate decreases more slowly, from 87.3 °C to 84.3 °C, with only a 3 °C drop, indicating minimal change. When the tilt angle of the oil groove is less than 3°, the maximum temperature of the friction plate exceeds 100 °C. Conversely, when the tilt angle exceeds 7°, the rate of temperature decrease becomes slower and the temperature change is not significant. Therefore, the optimal range for the tilt angle of the friction plate oil groove is 3–7°.

Figure 18.
The effect of the friction plate oil groove tilt angle on the friction plate temperature and transmitted viscous torque.
4.3. Optimization Experiment of Friction Plate Oil Groove Structure Based on Response Surface Method
4.3.1. Experimental Design
Based on the univariate analysis, the depth of the spiral semicircular friction plate oil grooves, the number of oil grooves, and the inclination angle of the oil grooves are significant factors affecting the maximum temperature of the friction plate. These are considered as the response factors in this study. The maximum temperature of the friction plate and the magnitude of the viscous torque transmitted by the oil film are taken as the response variables. The research goal is to optimize a single set of friction pair oil groove structure parameters to reduce the maximum temperature of the friction plate while ensuring a certain level of torque. This aims to maintain good operational performance of the clutch and provide design methods for the subsequent design of friction pairs in agricultural wet clutches. It will also offer a design basis for enhancing the working characteristics and reliability of wet clutches. Table 4 lists the structure parameters of the friction plate oil grooves and the experimental design levels.

Table 4.
Experimental response factors and levels.
4.3.2. Experimental Procedures and Results
The simulation results provide the maximum temperature of the friction plate and the transmitted viscous torque values. The experimental steps are as follows [30]:
- (1)
- Based on the selected response parameters for the oil groove structure in the experimental design, establish the corresponding temperature field model for the friction pair using UG (Unigraphics).
- (2)
- Use Fluent to complete the simulation according to the temperature field simulation steps outlined in Chapter 4 of this paper. Record the maximum temperature value of the friction plate and the transmitted viscous torque value.
- (3)
- Based on the 17 sets of data from the three-factor, three-level experiments designed using the Box–Behnken Design (BBD) method in Design-Expert software, As shown in Table 5, the lowest temperature recorded for the friction plate is 67.7 °C, which represents a reduction of approximately 31 °C compared to the highest temperature group. However, the corresponding torque transmitted by the cooling lubricating oil is only 18.6 N·m, which is not the optimal value for viscous torque transmission. Comparing the experimental data from Group 2 and Group 10, it is observed that the highest temperature of the friction plate in these two groups is similar, yet there is a significant difference in the transmitted viscous torque of the cooling lubricating oil. Additionally, comparing the data from Group 2 and Group 11, it is noted that despite the small difference in the transmitted viscous torque of the cooling lubricating oil, there is a temperature difference of approximately 7 °C in the highest temperature of the friction plate. Considering this situation, by optimizing the structural parameters of the spiral semicircular friction plate oil grooves, a set of oil groove parameters can be obtained that not only reduces the maximum temperature of the friction plate during clutch engagement but also maintains a certain level of transmitted viscous torque.

Table 5.
Experimental design and results.
Table 5.
Experimental design and results.
| Trial No. | A: Oil Groove Depth (mm) | B: Oil Groove Quantity | C: Inclination Angle (°) | Temperature (°C) | Viscous Torque (N·m) |
|---|---|---|---|---|---|
| 1 | 0.8 | 16 | 7 | 80.9 | 18.88 |
| 2 | 0.9 | 20 | 5 | 67.7 | 18.6 |
| 3 | 0.7 | 18 | 3 | 99.2 | 19.62 |
| 4 | 0.9 | 18 | 3 | 75.1 | 18.68 |
| 5 | 0.8 | 18 | 5 | 78.2 | 19.13 |
| 6 | 0.8 | 20 | 3 | 78.4 | 19.15 |
| 7 | 0.8 | 18 | 5 | 78.2 | 19.13 |
| 8 | 0.7 | 16 | 5 | 98.6 | 19.52 |
| 9 | 0.8 | 18 | 5 | 78.2 | 19.13 |
| 10 | 0.9 | 18 | 7 | 68.7 | 18.18 |
| 11 | 0.9 | 16 | 5 | 75.1 | 18.55 |
| 12 | 0.8 | 20 | 7 | 74.2 | 18.65 |
| 13 | 0.7 | 20 | 5 | 88.3 | 19.25 |
| 14 | 0.8 | 16 | 3 | 86.7 | 19.28 |
| 15 | 0.8 | 18 | 5 | 78.2 | 19.13 |
| 16 | 0.7 | 18 | 7 | 87.3 | 19.06 |
| 17 | 0.8 | 18 | 5 | 78.2 | 19.13 |
4.4. Analysis of Optimization Results of Friction Plate Oil Groove Structural Parameters Based on Response Surface Method
4.4.1. Regression Model and Variance Analysis of Friction Pair Engagement
Using Design-Expert to analyze the experimental results from Table 5, regression models can be obtained for the relationships between the oil groove depth A, oil groove quantity B, and inclination angle C with the maximum temperature of the friction plate Y1 and the transmitted viscous torque Y2. These regression models were validated through simulation experiments. The coefficients and significance of the regression models are presented in Table 6 [31].

Table 6.
Regression model coefficients and significance.
The mathematical regression prediction model for the maximum temperature of the friction plate is as follows:
Y1 = 590.43125 − 748.125∗A − 13.09375∗B − 11.56875∗C + 3.625∗AB + 6.875∗AC + 0.1∗BC + 337.
5∗A2 + 0.212500∗B2 + 0.25∗C2
The mathematical regression prediction model for the oil film transmitted viscous torque is as follows:
Y2 = 18.61562 + 8.525∗A − 0.1225∗B + 0.22375∗C + 0.4∗AB + 0.075∗AC − 0.00625∗BC − 12.75∗A2 − 0.005625∗B2 − 0.029375∗C2
According to Table 6, the regression model for the maximum temperature of the friction plate has an F-value of 99.12 and a p-value of <0.0001, indicating that the model is highly significant. The coefficient of determination R2 = 0.9922, which is close to 1, suggests that 99.22% of the data can be explained by the model. Additionally, the signal-to-noise ratio of 33.2513 indicates that the model is robust and less susceptible to environmental influences. According to the comparison analysis between the simulation test values and the predicted values from the regression model for the maximum temperature of the friction plate in Table 7, the prediction error is within 1%. This indicates that the mathematical regression model for the maximum temperature of the friction plate can accurately predict the maximum temperature within the response range. Similarly, for the response variable of the oil film’s transmitted viscous torque, the significance and error analysis of the regression model show that it has reached a highly significant level. According to the comparison between the simulation test values and the predicted values from the regression model for the oil film’s transmitted viscous torque in Table 8, the torque prediction error is within 0.5%. This indicates that the mathematical regression model for the oil film’s transmitted viscous torque can accurately predict the transmitted viscous torque within the response range.

Table 7.
Comparison of temperature test results.

Table 8.
Comparison of torque test results.
In summary, the regression models for the maximum temperature of the wet clutch friction plate and the oil film’s transmitted viscous torque can effectively analyze and predict the performance indicators of the clutch friction pair during engagement, as they vary with changes in the oil groove structural parameters.
4.4.2. Significance and Response Surface Analysis
Analysis of the significance results in Table 6 shows that the oil groove depth (A), number of oil grooves (B), and inclination angle (C) all have a highly significant impact on the maximum temperature of the friction plate. The oil groove depth (A) and inclination angle (C) have a highly significant impact on the transmitted viscous torque, while the number of oil grooves (B) has a relatively significant effect on the viscous torque. In terms of the impact on the maximum temperature of the friction plate, the factors are ranked as follows: oil groove depth (A) > number of oil grooves (B) > inclination angle (C). For the transmitted viscous torque, the ranking of the factors is: oil groove depth (A) > inclination angle (C) > number of oil grooves (B). Based on the regression models for the maximum temperature of the friction plate and the transmitted viscous torque, the steepness and contour density of the response surfaces for both models were analyzed. It was found that the interaction between oil groove depth (A) and oil groove number (B) has a significant impact on the transmitted viscous torque, as shown in Figure 19. From the significance results of the interaction effects shown in the table, it is evident that only the interaction between A and B (oil groove depth and oil groove number) has a p-value less than 0.05 for the transmitted viscous torque. The effects of other interactions are not significant, which is consistent with the results from the response surface analysis.
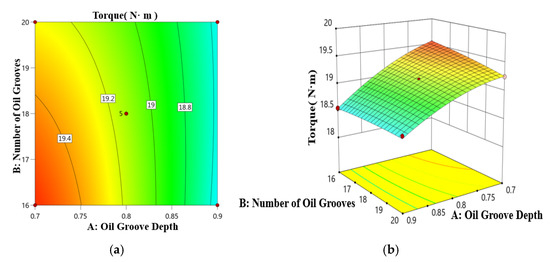
Figure 19.
Influence of slot depth and slot number on viscous torque transmission. (a) Contour plot. (b) Response surface plot.
4.5. Multi-Objective Optimization Based on Response Surface Method
To optimize the performance of the wet clutch friction plates, multi-objective optimization was conducted using the Design-Expert software based on the response surface methodology. By considering the slot depth (A), slot number (B), and inclination angle (C) of the slot structure parameters as constraints within the response range, the mathematical regression models for the maximum temperature of the friction plates and the viscous torque transmission were used to determine the optimal values within the response range. This approach aims to ensure a certain level of viscous torque transmission while reducing the maximum temperature of the friction plates.
In Table 9, the first group serves as a reference for comparison, while the second and third groups are the optimized ones. After optimization, the maximum temperature of the wet clutch friction plates decreased by approximately 12 °C, and the transmitted viscous torque decreased by only about 0.3 N·m. Therefore, through multi-objective optimization, the temperature of the friction pair was reduced while ensuring the torque transmission efficiency of the wet clutch, providing valuable insights for improving the performance design of wet clutches.

Table 9.
Optimized parameters and results.
5. Conclusions
(1) The analysis of temperature distribution shows that the temperature of both the friction plate and the mating steel plate increases radially from the inner diameter to the outer diameter, forming a ring-shaped gradient. Compared with the radial groove, the spiral groove reduces the maximum temperature of the friction plate by 17.2 °C. This improvement is not only a quantitative reduction but is mechanistically attributed to the enhanced lubricant circulation and stronger convective heat transfer induced by the spiral geometry, which suppresses local hot spots and improves the thermal stability of both components.
(2) Regarding the influence of oil groove cross-sectional shapes, four types of spiral grooves—rectangular, triangular, trapezoidal, and semicircular—were examined. Their maximum temperatures were 77.8 °C, 76.4 °C, 76.6 °C, and 75.5 °C, respectively. The semicircular cross-section demonstrates the most effective thermal management capability. This superiority originates from its smoother flow paths and reduced flow resistance, which promote more uniform oil distribution and more efficient heat removal.
(3) By combining CFD simulation with response surface methodology (RSM), this study systematically investigated the effects of groove depth, groove number, and inclination angle. Regression models linking these parameters to both peak temperature and viscous torque were established and validated, with prediction errors within 1% for temperature and 0.5% for torque. The optimal parameter set—groove depth of 0.89 mm, groove number of 19, and inclination angle of 5.28°—achieves a balanced improvement by reducing thermal load while preserving torque transmission, thereby extending the service reliability of the friction pair.
(4) The overall reduction in operating temperature achieved by optimized groove structures stems from their ability to organize lubricant flow and intensify convective cooling, which delays premature film rupture and mitigates wear. The RSM-based optimization framework further demonstrates its advantage by providing quantitatively validated guidance for structural design: the optimized grooves reduce the maximum temperature by approximately 12 °C while maintaining viscous torque above 18.5 N·m. This highlights the methodological value of RSM in enabling multi-objective, mechanism-oriented optimization of wet clutch friction pairs, ensuring both thermal management and torque stability.
Author Contributions
X.L.: Writing—original draft; L.S.: Data curation; Y.Z.: Formal analysis; X.Z.: Software. All authors have read and agreed to the published version of the manuscript.
Funding
This work was supported by the Natural Science Foundation of Hunan Province of China (2025JJ70310), the Research Foundation of Education Bureau of Hunan Province of China (23A0620), and the Postgraduate Research & Practice Innovation Program of Jiangsu Province (SJCX24_1779).
Data Availability Statement
The data that support the findings of this study are available from the corresponding author upon reasonable request.
Conflicts of Interest
The authors declare that they have no known competing financial interests or personal relationships that could have appeared to influence the work reported in this paper.
Nomenclature
| A | Groove depth, mm |
| B | Number of grooves, – |
| C | Groove inclination angle, ° |
| Cp | Specific heat capacity, J·kg−1·K−1 |
| de | Characteristic length, m |
| h | Lubricating film thickness, mm |
| k | Thermal conductivity of lubricant, W·m−1·K−1 |
| Kq | Heat partitioning ratio, – |
| Nu | Nusselt number, – |
| P | Outlet pressure, MPa |
| Pi | Contact pressure at point i, Pa |
| Pω | Contact length between groove and fluid, m |
| Pr | Prandtl number, – |
| q | Heat flux density, W·m−2 |
| qs, qf | Heat flux inputs from steel plate and friction plate, W·m−2 |
| r | Radial distance from disc center, m |
| r2 | Hydraulic diameter, m |
| Re | Reynolds number, – |
| R1, R2 | Inner and outer radii of friction disc, mm |
| T | Temperature, °C |
| t | Engagement time, s |
| v | Inlet velocity of lubricating oil, m·s−1 |
| Vmax | Maximum radial flow velocity, m·s−1 |
| Δω | Angular speed difference, rad·s−1 |
| Δω·r | Relative linear velocity, m·s−1 |
| ρ | Density, kg·m−3 |
| μ | Friction coefficient, – |
| u | Kinematic viscosity, Pa·s |
| ω | Angular velocity, rad·s−1 |
| λs, λf | Thermal conductivities of steel and friction material, W·m−1·K−1 |
References
- Ramesh, M.R.; Ravindra, K.A.; Ashok, B.; Kannan, C. Optimizing thermal performance of a dry rigid clutch by varying groove pattern and friction material. Mater. Today Proc. 2021, 46, 7459–7467. [Google Scholar] [CrossRef]
- Jen, T.-C.; Nemecek, D.J. Thermal analysis of a wet-disk clutch subjected to a constant energy engagement. Int. J. Heat Mass Transf. 2008, 51, 1757–1769. [Google Scholar] [CrossRef]
- Zhu, H. Research on the Friction Characteristics and Thermal Load Characteristics of Wet Clutches. Master’s Thesis, Zhejiang University, Hangzhou, China, 2012. [Google Scholar]
- Wang, H.; Zhang, X.; Zhang, J.; Ma, B. Simulation Study of Thermal Load of Wet Clutches. J. Beijing Inst. Technol. 2013, 33, 47–51. [Google Scholar] [CrossRef]
- Zhang, J.; Ding, P.; Li, C.; Song, Z. Thermal-structural Coupling Analysis of Friction Plates in Wet Clutches. J. Univ. Sci. Technol. Beijing 2013, 35, 1668–1673. [Google Scholar] [CrossRef]
- Cho, J.; Katopodes, N.; Kapas, N.; Fujii, Y. CFD Modeling of Squeeze Film Flow in Wet Clutch; SAE Technical Paper: Warrendale, PA, USA, 2011. [Google Scholar] [CrossRef]
- Zheng, Y.; Li, Y. The Effect of Oil Groove Spacing on Surface Temperature Rise and Stress in Friction Plates of Wet Clutches. Coal Mine Mach. 2019, 40, 85–87. [Google Scholar] [CrossRef]
- Lu, J. Temperature Field Analysis of Friction Pairs in Wet Clutches. Based on Finite Element Method Machine Design and Manufacturing 2016, 11, 166–170. [Google Scholar] [CrossRef]
- Xiao, B.; Wu, W.; Hu, J.; Yuan, S.; Hu, C. Fluid-Solid Coupled Heat Transfer Investigation of Wet Clutches; SAE Technical Paper: Warrendale, PA, USA, 2017. [Google Scholar] [CrossRef]
- Yan, M. Thermal-Structural Coupling Simulation Study and Optimization Design of Friction Pairs in Wet Multi-Plate Clutches. Master’s Thesis, Yanbian University, Yanbian, China, 2017. [Google Scholar]
- Ding, P. Thermal-Structural Coupling Simulation Study of Non-Homogeneous Friction Plates in Wet Clutches. Master’s Thesis, Central South University, Changsha, China, 2013. [Google Scholar]
- Leighton, M.; Davies, J.A.; Morris, N.; Rahnejat, H.; Trimmer, G. A combined numerical and experimental investigation of disengaged wet clutch system power loss. In Proceedings of the World Tribology Congress 2017, Beijing, China, 17–22 September 2017. [Google Scholar]
- Morris, S.A.; Morris, N.J.; Leighton, M. A Time Efficient Thermal and Hydrodynamic Model for Multi Disc Wet Clutches; SAE Technical Paper: Warrendale, PA, USA, 2022. [Google Scholar] [CrossRef]
- Marklund, P.; Sahlin, F.; Larsson, R. Modelling and simulation of thermal effects in wet clutches operating under boundary lubrication conditions. Proc. Inst. Mech. Eng. Part J J. Eng. Tribol. 2009, 223, 1129–1141. [Google Scholar] [CrossRef]
- Kaya, N.; Karen, I.; Öztürk, F. Re-design of a failed clutch fork using topology and shape optimisation by the response surface method. Mater. Des. 2010, 31, 3008–3014. [Google Scholar] [CrossRef]
- Liu, Z.; Zhou, J.; Feng, W.; Chen, Y. Modeling, analysis, and multi-objective optimization of cold extrusion process of clutch outer gear hub using response surface method and meta-heuristic approaches. Int. J. Adv. Manuf. Technol. 2021, 116, 229–239. [Google Scholar] [CrossRef]
- Dogan, O.; Karpat, F.; Yuce, C.; Kaya, N.; Yavuz, N.; Sen, H. A novel design procedure for tractor clutch fingers by using optimization and response surface methods. J. Mech. Sci. Technol. 2016, 30, 2615–2625. [Google Scholar] [CrossRef]
- Nyman, P.; Mäki, R.; Olsson, R.; Ganemi, B. Influence of surface topography on friction characteristics in wet clutch applications. Wear 2006, 261, 46–52. [Google Scholar] [CrossRef]
- Zhang, Z.; Shi, X.; Guo, D. Dynamic temperature rise mechanism and some controlling factors of wet clutch engagement. Math. Probl. Eng. 2016, 2016, 6530213. [Google Scholar] [CrossRef]
- Bilen, K.; Cetin, M.; Gul, H.; Balta, T. The investigation of groove geometry effect on heat transfer for internally grooved tubes. Appl. Therm. Eng. 2009, 29, 753–761. [Google Scholar] [CrossRef]
- Schneider, T.; Voelkel, K.; Pflaum, H.; Stahl, K. Friction Behavior of Pre-Damaged Wet-Running Multi-Plate Clutches in an Endurance Test. Lubricants 2020, 8, 68. [Google Scholar] [CrossRef]
- Zagrodzki, P.; Truncone, S.A. Generation of hot spots in a wet multidisk clutch during short-term engagement. Wear 2003, 254, 474–491. [Google Scholar] [CrossRef]
- Ivanović, V.; Herold, Z.; Deur, J.; Hancock, M.; Assadian, F. Experimental characterization of wet clutch friction behaviors including thermal dynamics. SAE Int. J. Engines 2009, 2, 1211–1220. Available online: https://www.jstor.org/stable/26308464 (accessed on 10 June 2025). [CrossRef]
- Payvar, P.; Transfer, M. Laminar heat transfer in the oil groove of a wet clutch. Int. J. Heat Mass Transf. 1991, 34, 1791–1798. [Google Scholar] [CrossRef]
- Liu, Y.-H.; Lo, Y.-H.; Li, X.-X.; Huh, M. Heat transfer and friction in a square channel with ribs and grooves. J. Thermophys. Heat Transf. 2016, 30, 144–151. [Google Scholar] [CrossRef]
- Yang, X.; Bao, H.; Zhang, C.; Tan, W.; Zhu, R. Influence of Groove Type on Friction Coefficient of Wet Friction Clutch Pair. Int. J. Automot. Technol. 2024, 25, 119–129. [Google Scholar] [CrossRef]
- Bao, H.; Zhang, C.; Hou, X.; Lu, F. Wear characteristics of different groove-shaped friction pairs of a friction clutch. Appl. Sci. 2020, 11, 284. [Google Scholar] [CrossRef]
- Wu, B.; Qin, D.; Hu, J.; Liu, Y. Experimental data mining research on factors influencing friction coefficient of wet clutch. J. Tribol. 2021, 143, 121802. [Google Scholar] [CrossRef]
- Soleimani, A.; Rohani, A.; Abbaspour-Fard, M.H. Optimizing cone clutch design for enhanced maneuverability in walking tractors using machine learning and finite element analysis. Int. J. Interact. Des. Manuf. 2025, 1–19. [Google Scholar] [CrossRef]
- Jang, J.Y.; Khonsari, M.M.; Maki, R. Three-dimensional thermohydrodynamic analysis of a wet clutch with consideration of grooved friction surfaces. J. Tribol. 2011, 133, 011703. [Google Scholar] [CrossRef]
- Ryu, J.S.; Sung, I.-H. Effect of angle and density of grooves between friction plate segments on drag torque in wet clutch of automatic transmission. J. Korean Soc. Tribol. Lubr. Eng. 2014, 30, 71–76. [Google Scholar] [CrossRef][Green Version]
Disclaimer/Publisher’s Note: The statements, opinions and data contained in all publications are solely those of the individual author(s) and contributor(s) and not of MDPI and/or the editor(s). MDPI and/or the editor(s) disclaim responsibility for any injury to people or property resulting from any ideas, methods, instructions or products referred to in the content. |
© 2025 by the authors. Licensee MDPI, Basel, Switzerland. This article is an open access article distributed under the terms and conditions of the Creative Commons Attribution (CC BY) license (https://creativecommons.org/licenses/by/4.0/).