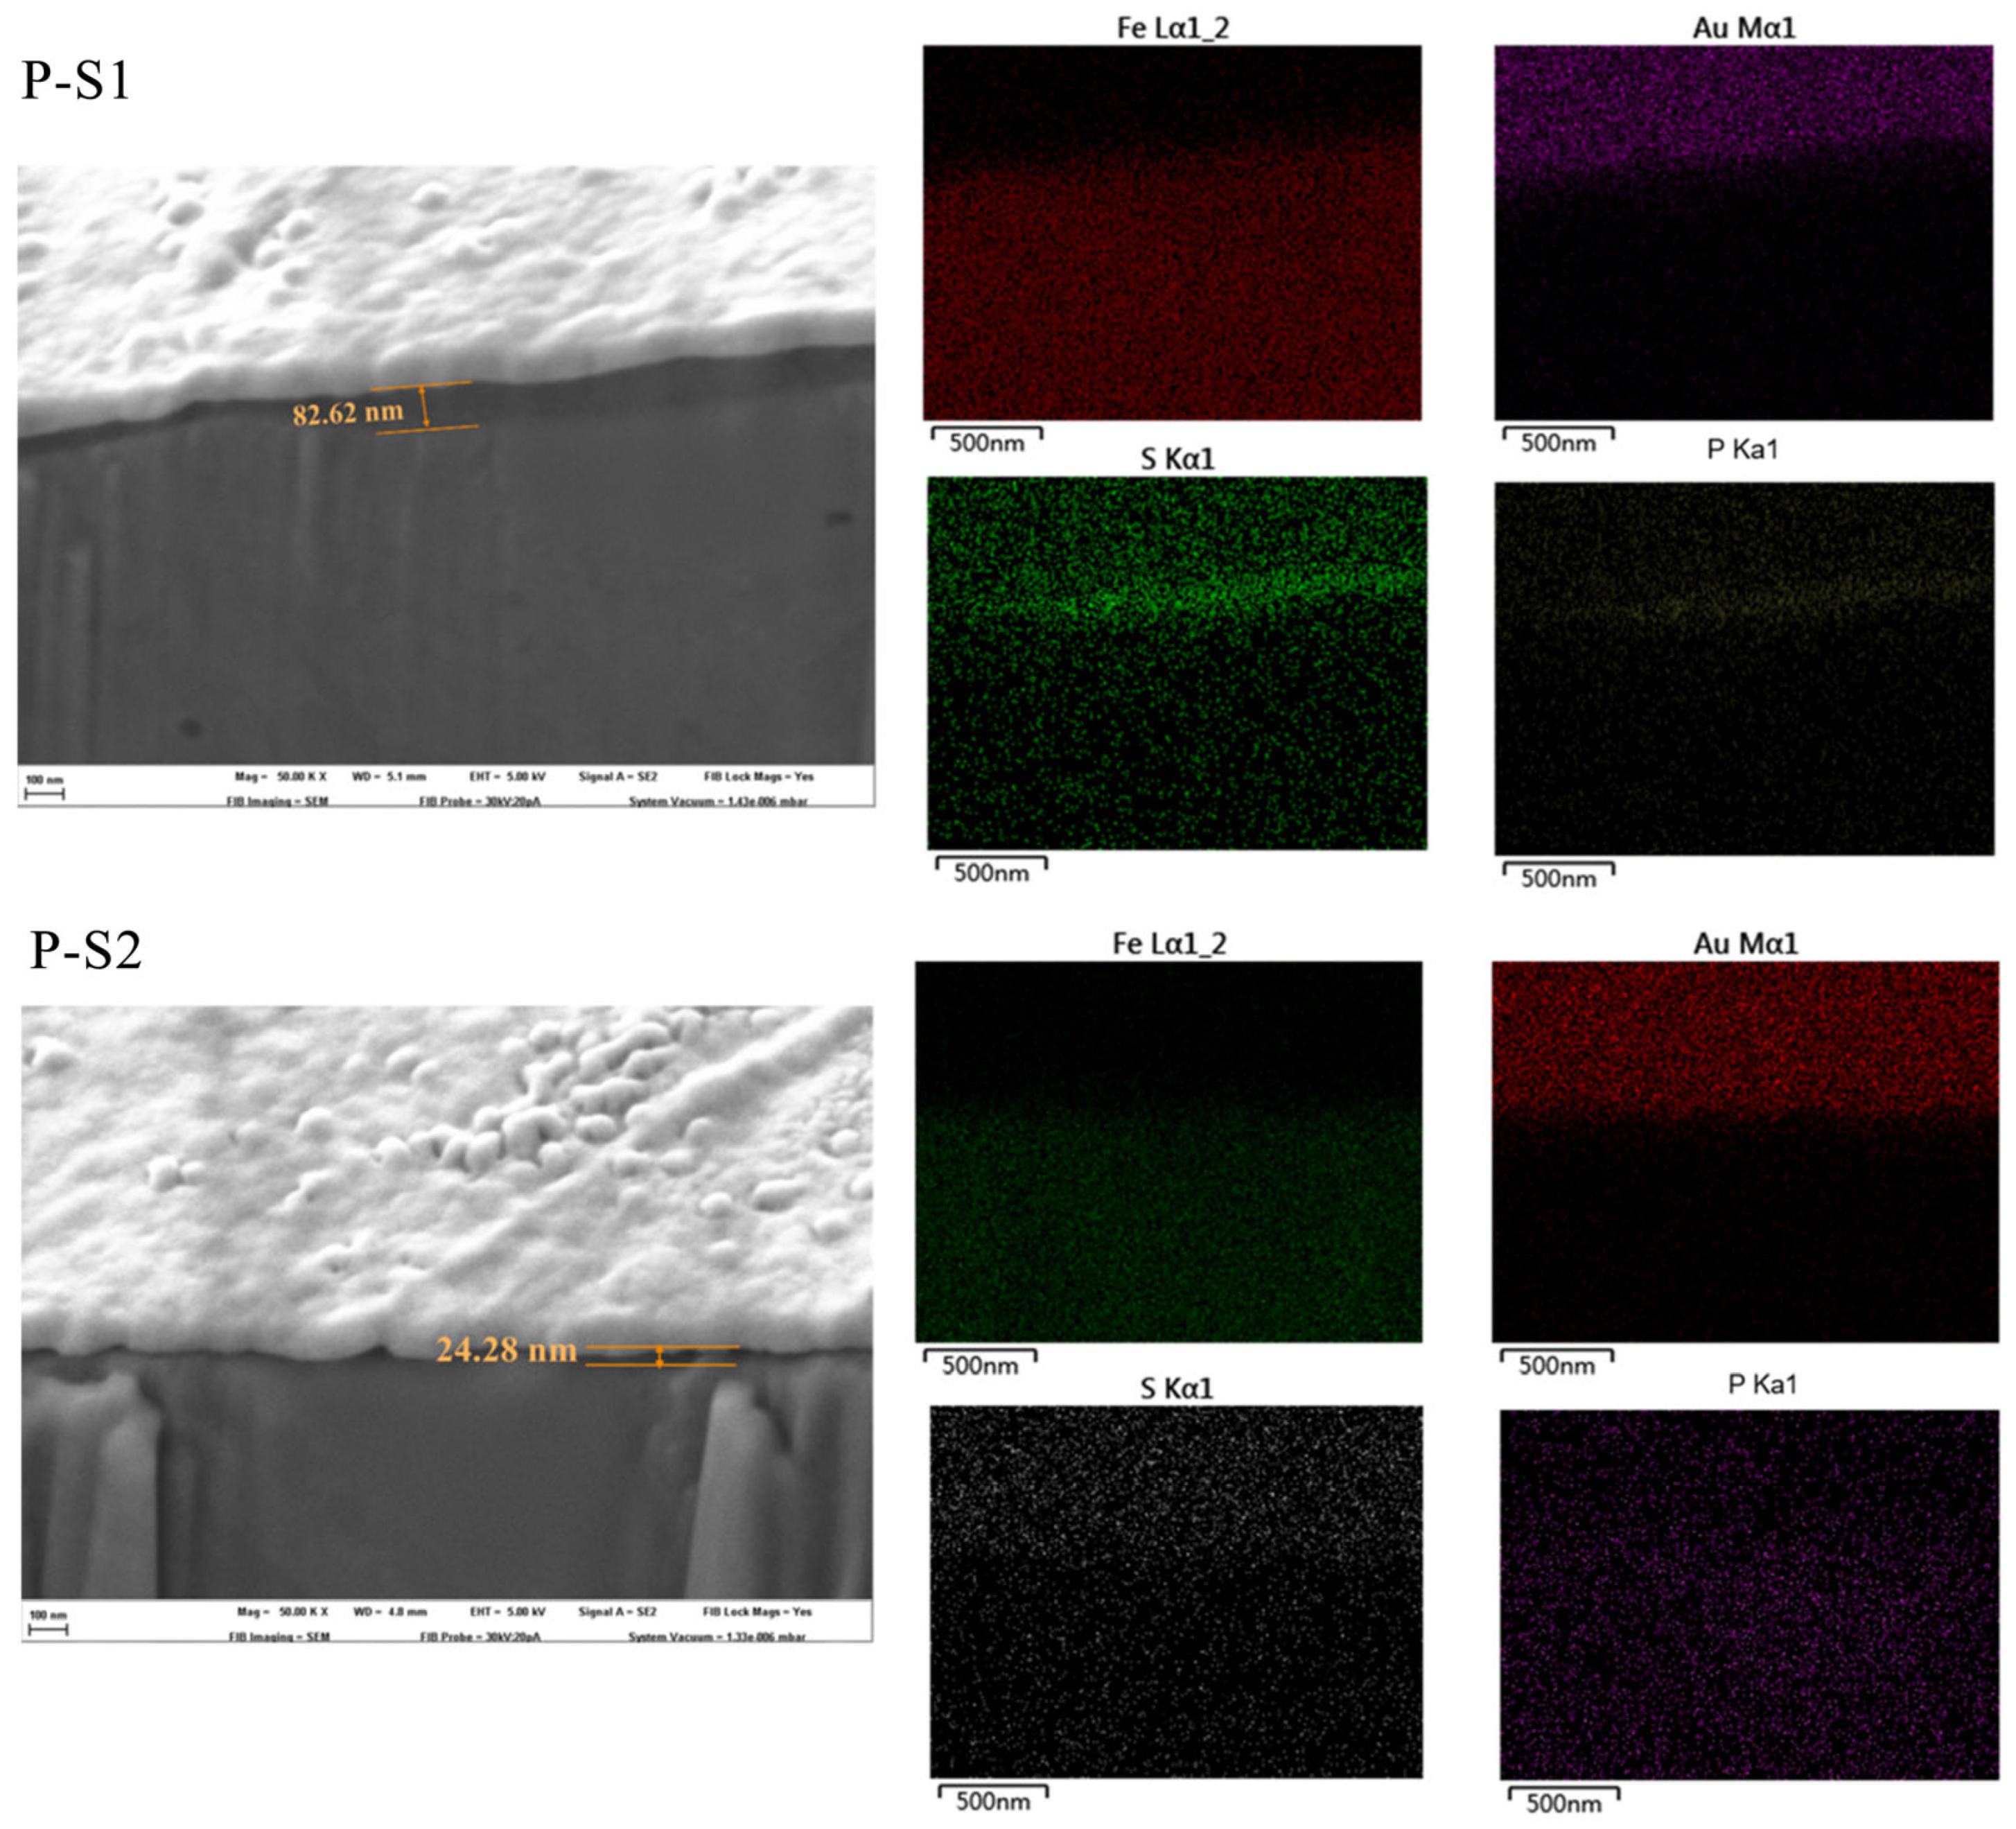
3.2.1. SEM with EDS of the Worn Surface
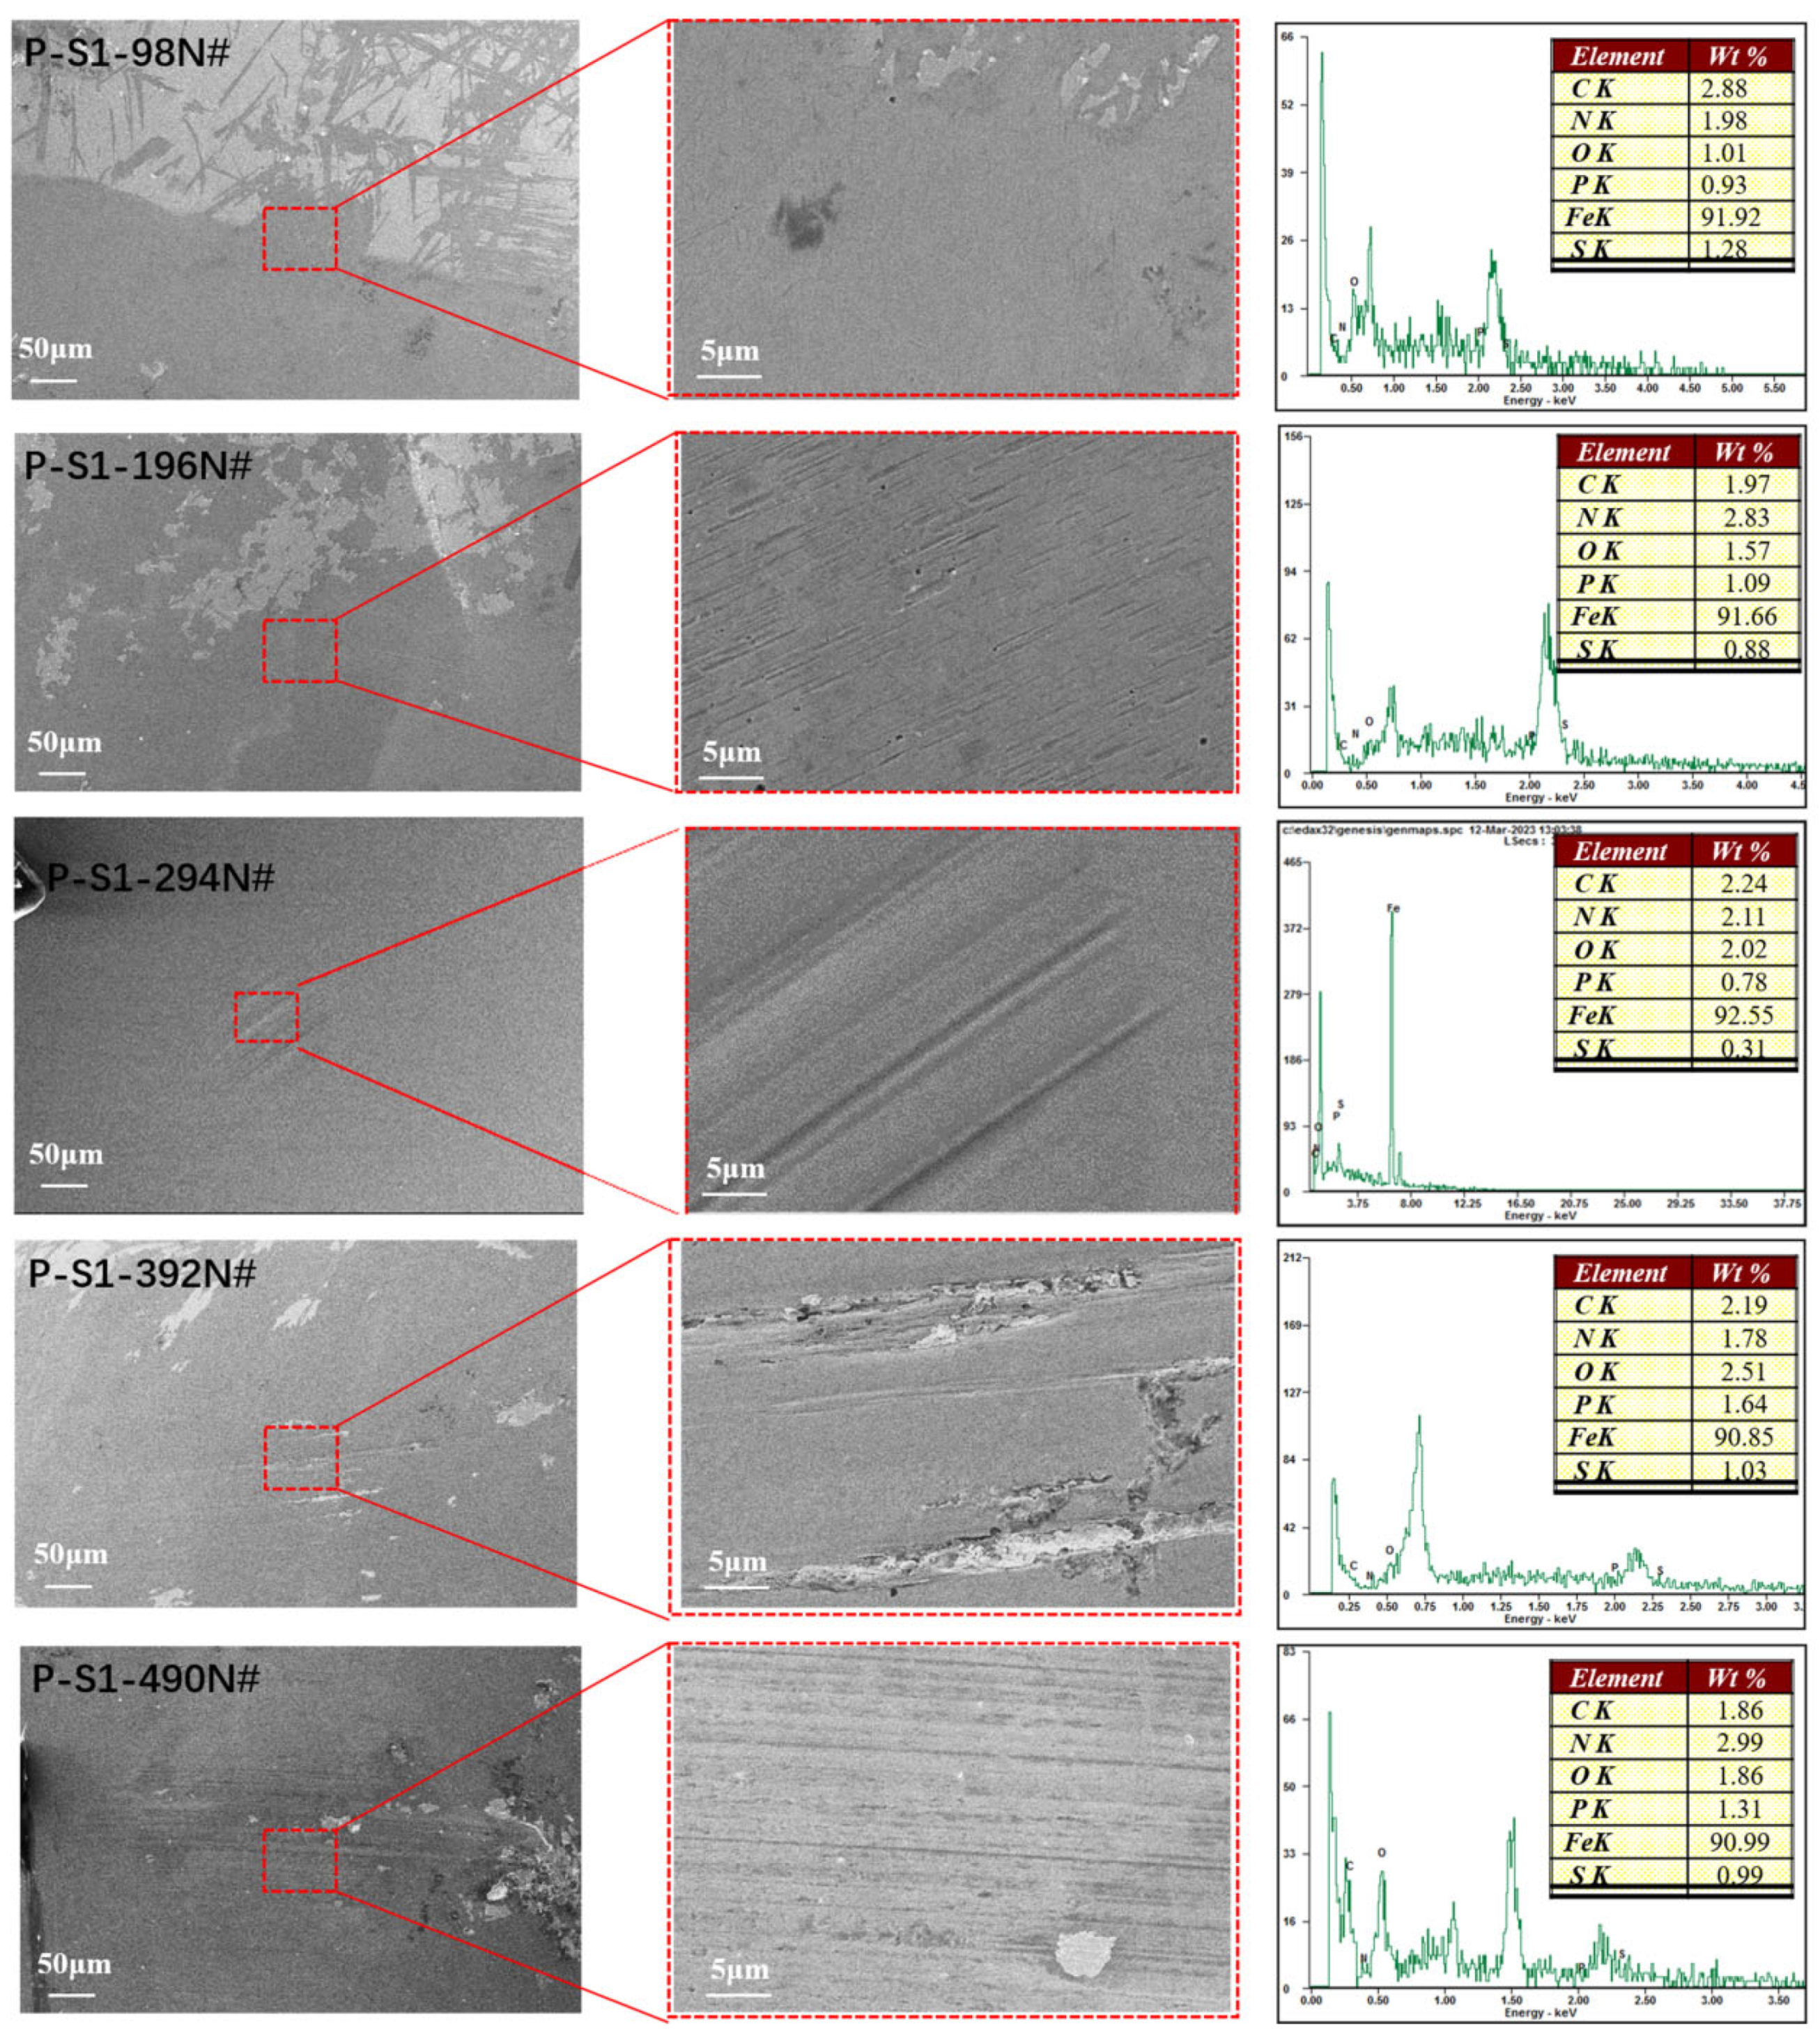
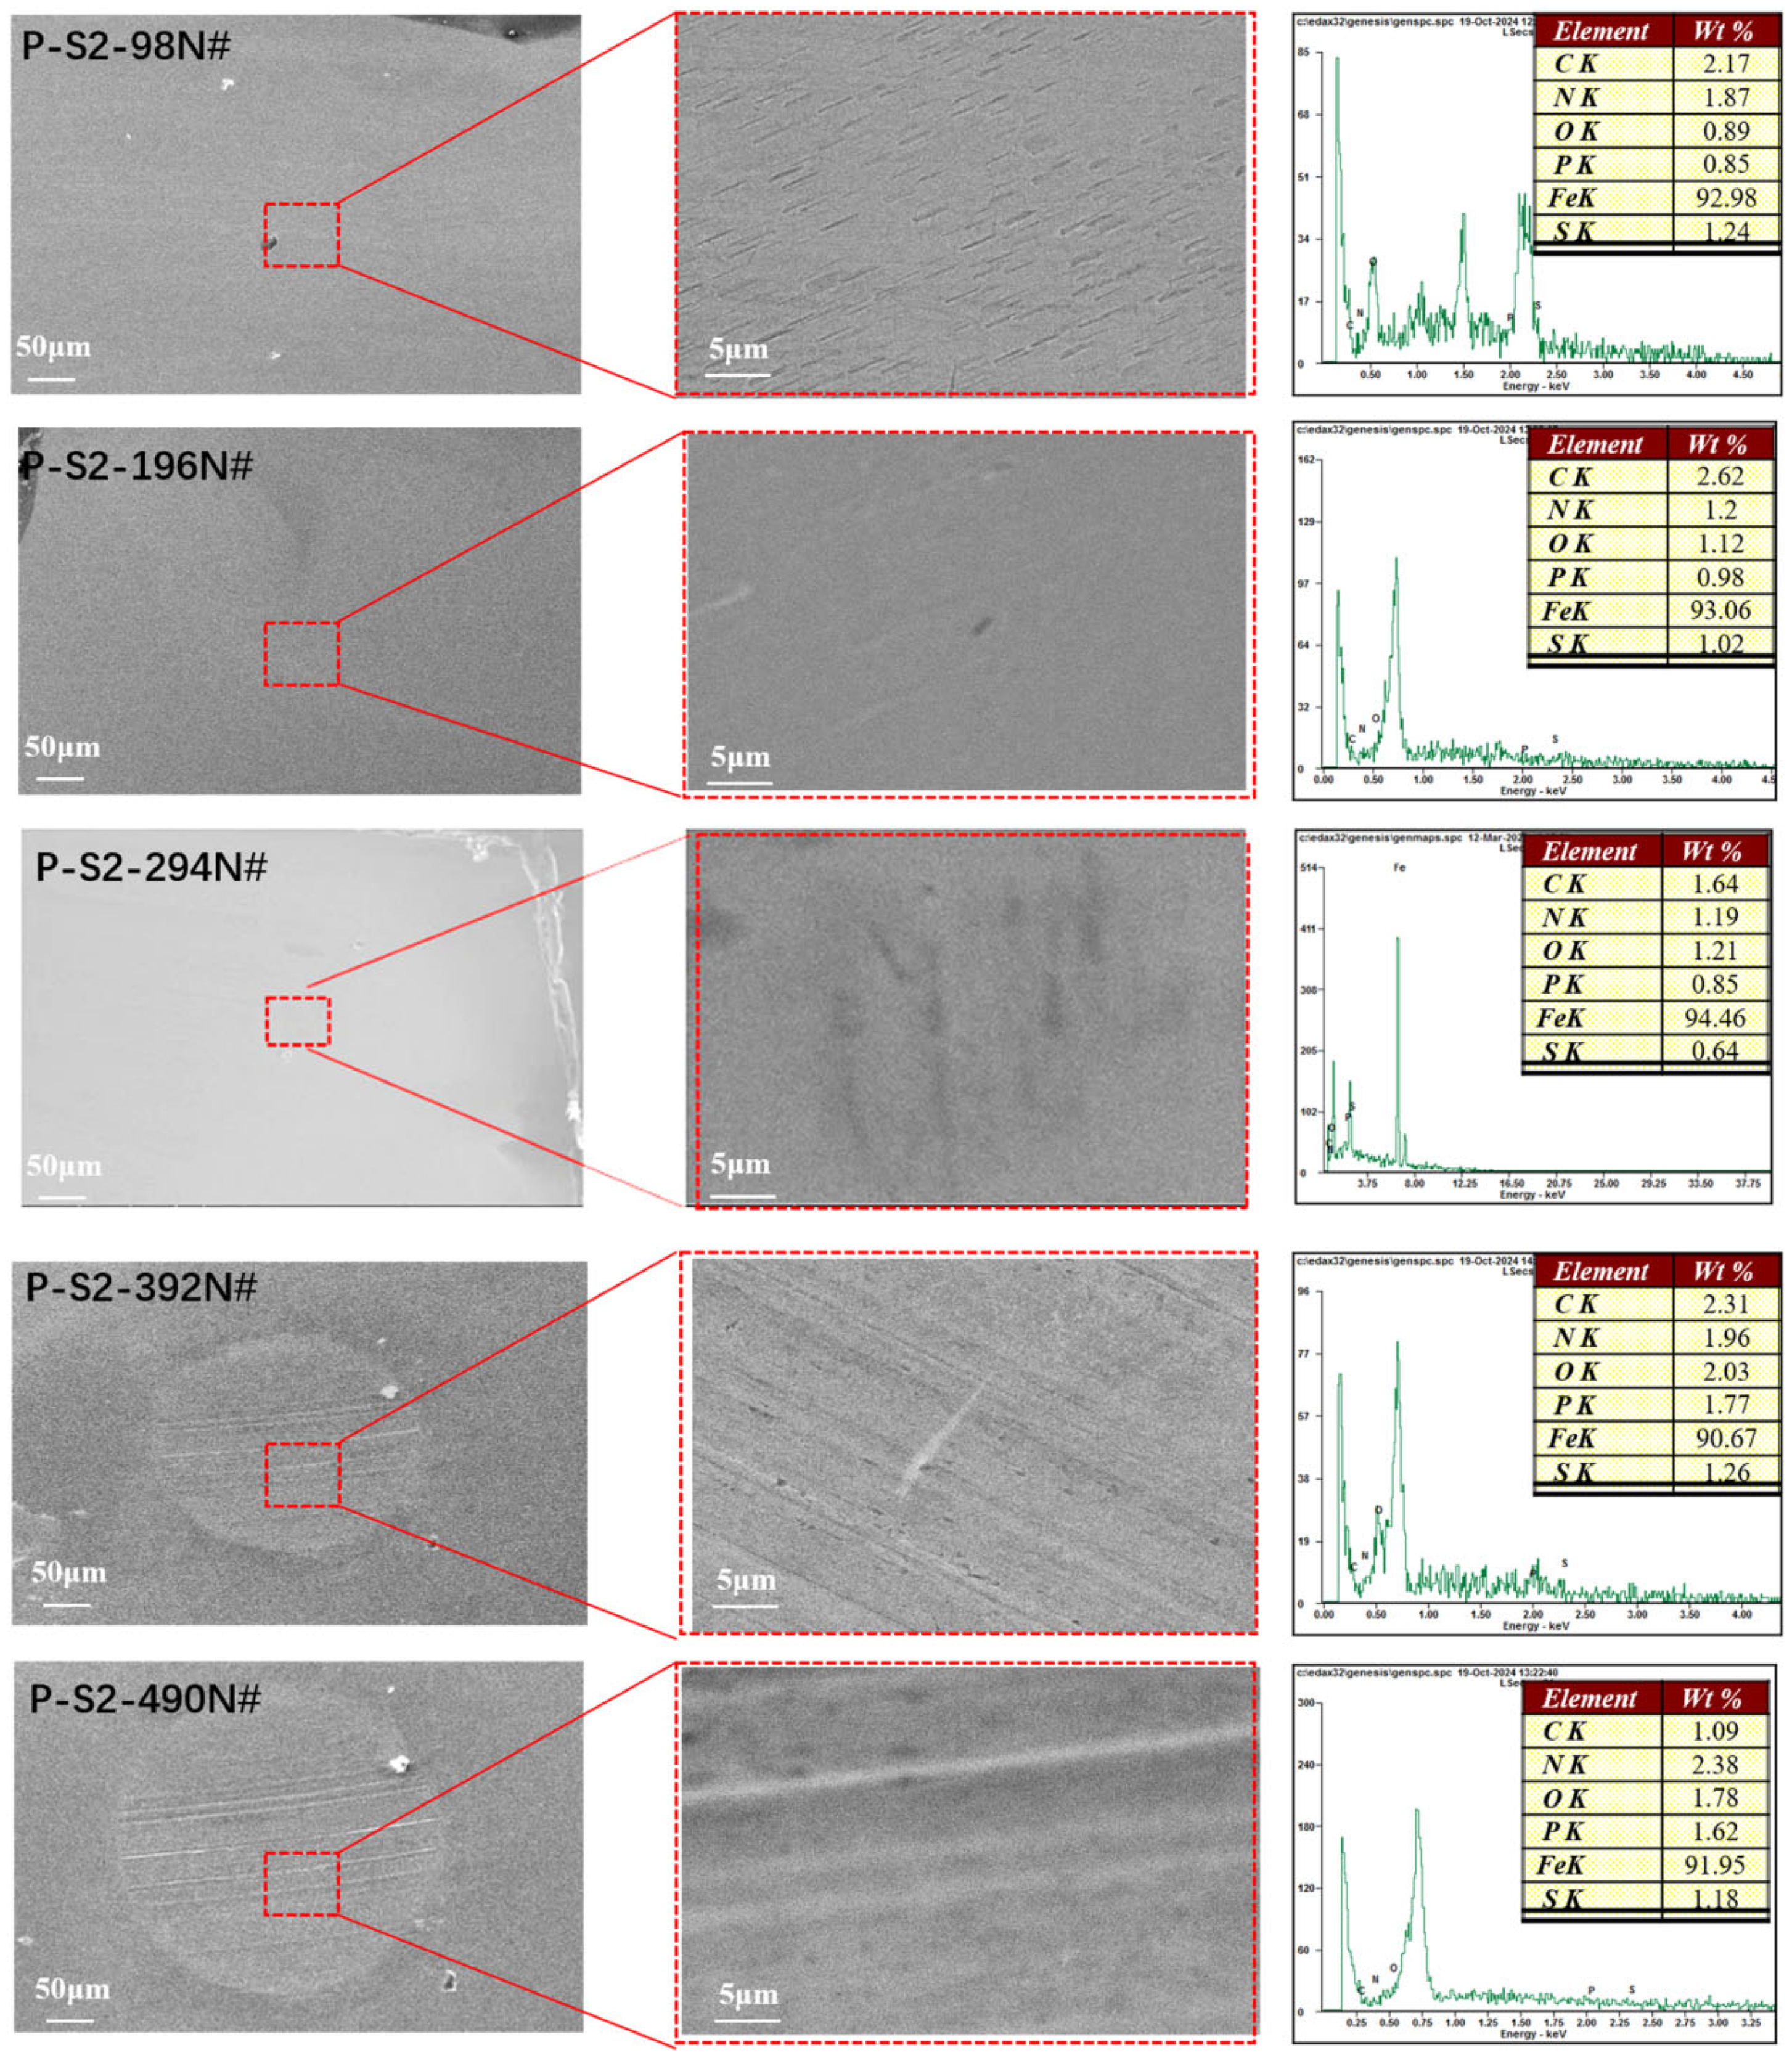
To elucidate the tribological mechanisms of phosphorus–sulfur additives, the microstructure and elemental distribution of the friction surfaces were analyzed using SEM. As shown in
Figure 3 and
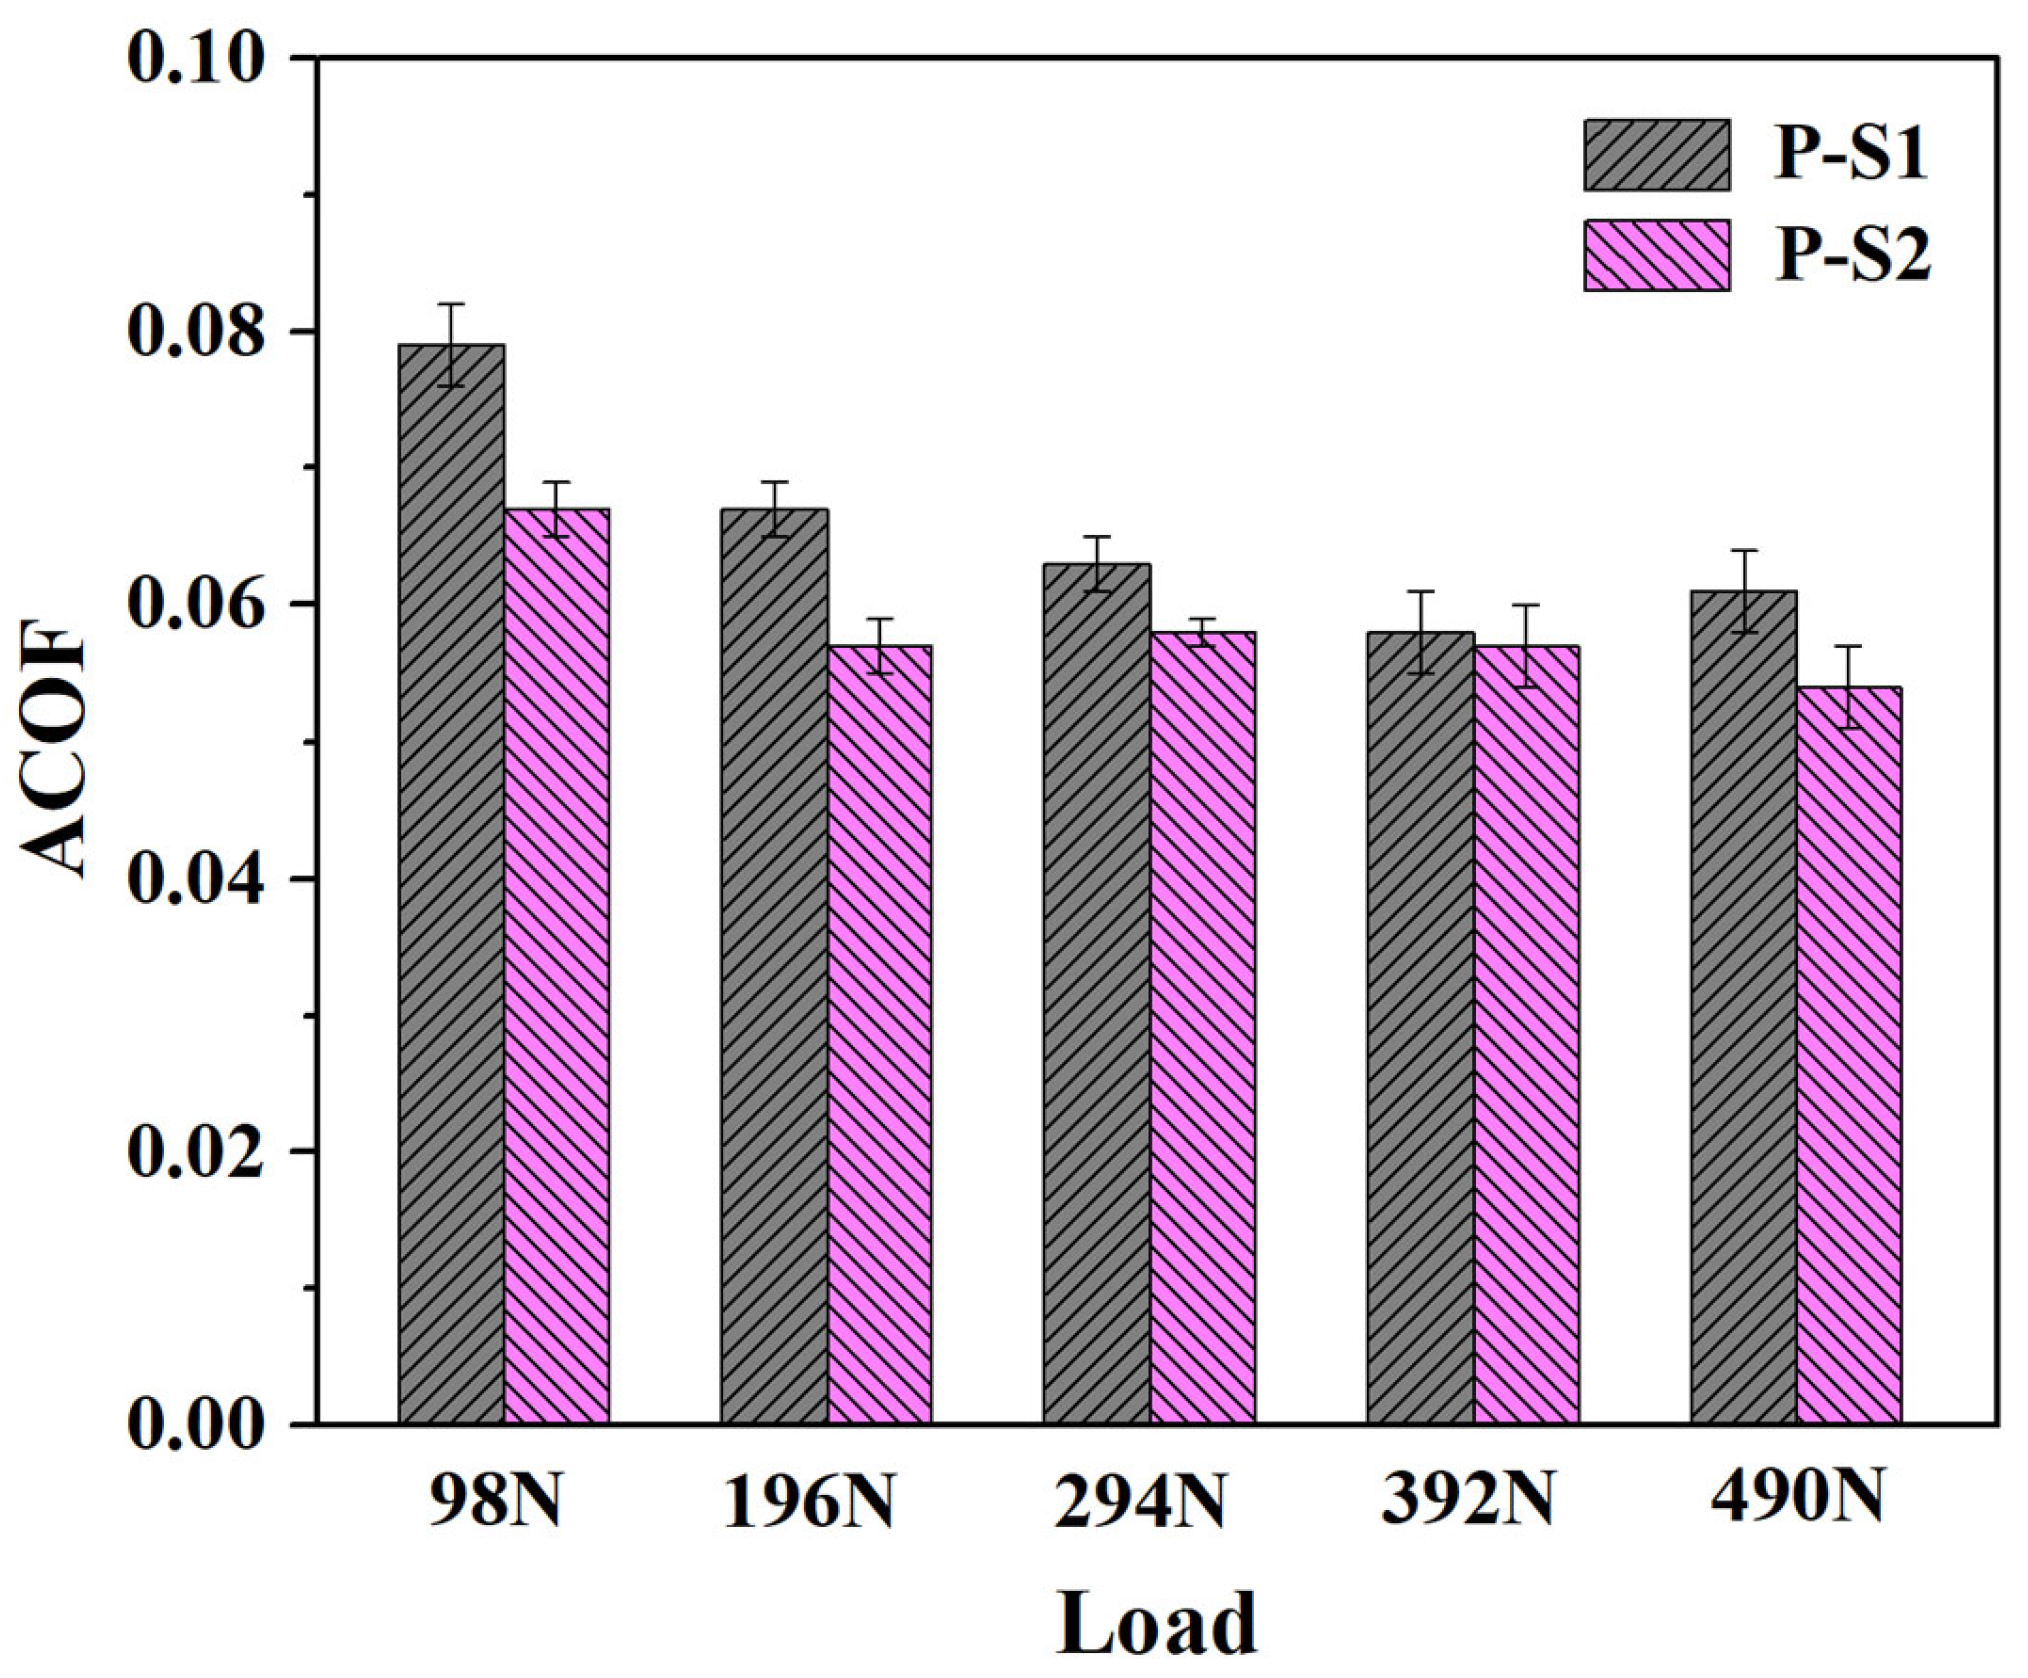
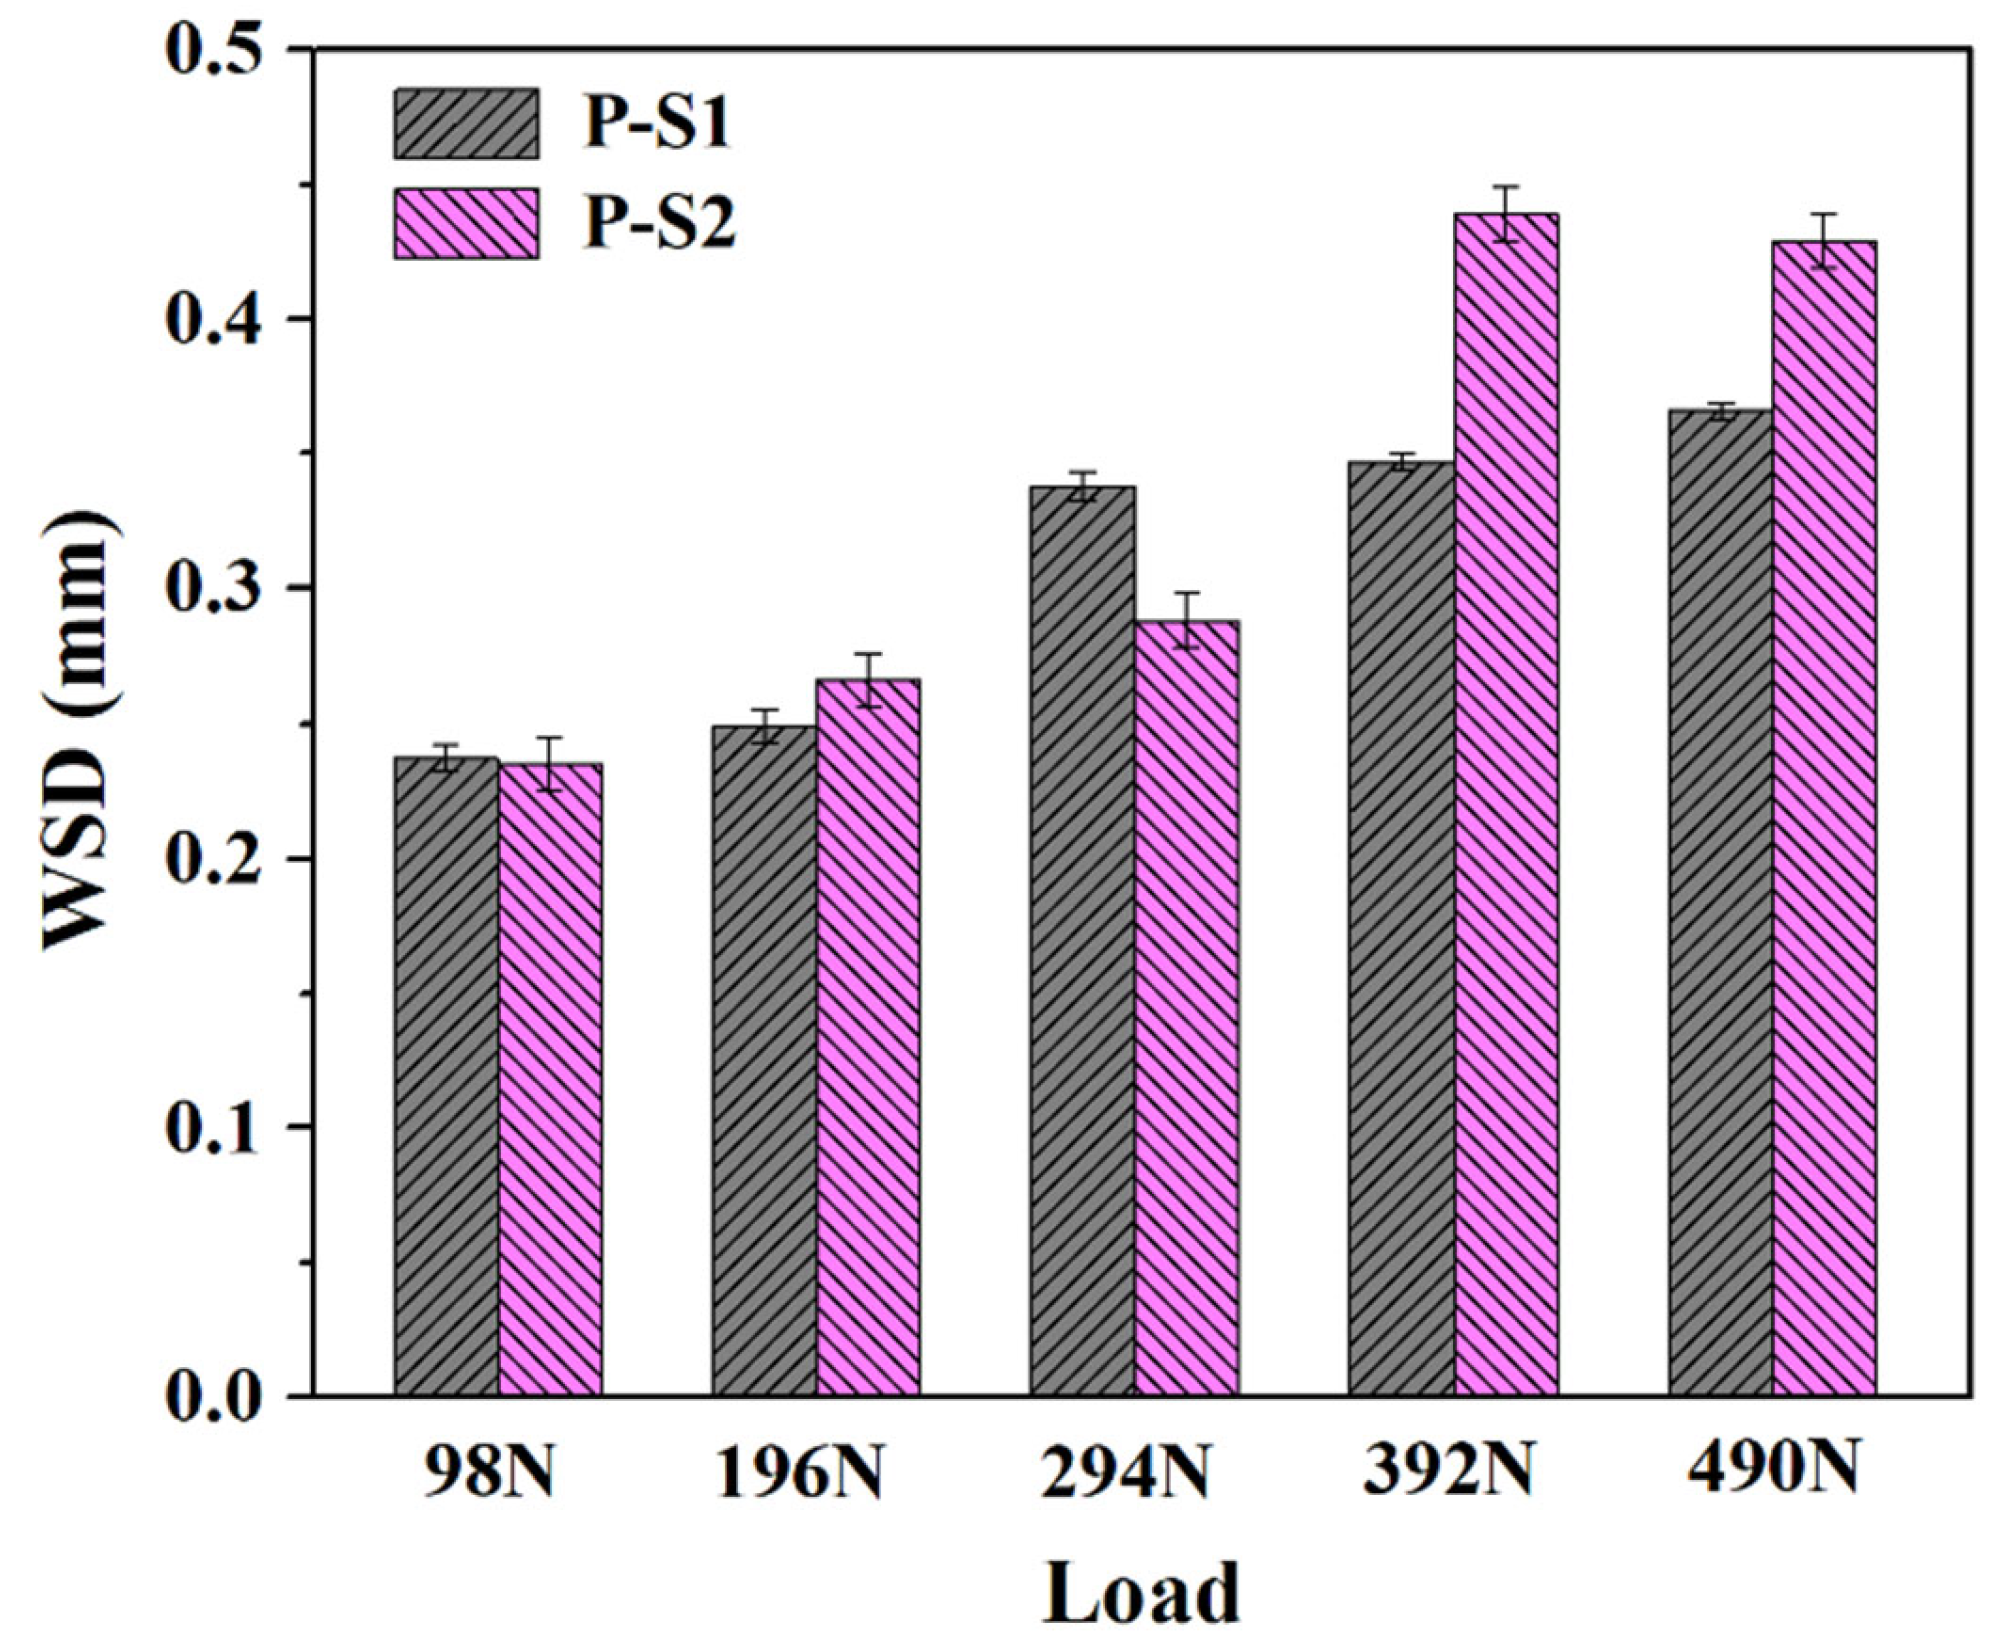
Figure 4, the plow grooves and flaking areas of the wear surfaces of both P-S1 and P-S2 become heavier with the increase in load, which is consistent with the tribological test results. It is worth noting that the worn surface of P-S1 exhibits deeper plow grooves than that of P-S2, especially under the applied loads of 294 N and 490 N, indicating the presence of heavier abrasive wear in P-S1 during the friction behavior. This is ascribed to the higher content of active sulfur in P-S1 (
Table 1).
The EDS spectra for C, P, S, N, O, and Fe on the wear surfaces, along with their elemental contents, are presented in
Figure 3. The ratios of O/P and O/S for the wear scars lubricated with P-S1 and P-S2 are depicted in
Table 3.
Phosphorus–oxygen and sulfur–oxygen compounds were detected on the wear surfaces of both samples, influencing their tribological properties. The significant changes in oxygen content could be attributed to the oxidation of the metal substrate surface due to the high local temperatures generated during the friction process or to the formation of tribochemical products with relatively high O/P and O/S ratios.
As shown in
Table 3, the O/P and O/S ratios in P-S1 were higher than those in P-S2, which aligned with the previously observed PB and PD values. This may be related to the adsorption and decomposition mechanisms of the additives under tribological heat conditions. The protective film formed may be prone to mechanical scratching due to insufficient strength, where tribochemical products play a crucial role in enhancing tribological performance. Based on the EDS analysis, it can be inferred that wear surfaces with higher O/P and O/S ratios exhibit improved tribological properties. The synergistic effect between phosphate amine salt and the sulfur additive likely contributes significantly to the enhancement of these properties.
The subsequent XPS, XANES, and FIB analyses are based on the four-ball wear scars under a load of 294 N.
3.2.2. XPS Analysis of Worn Surfaces
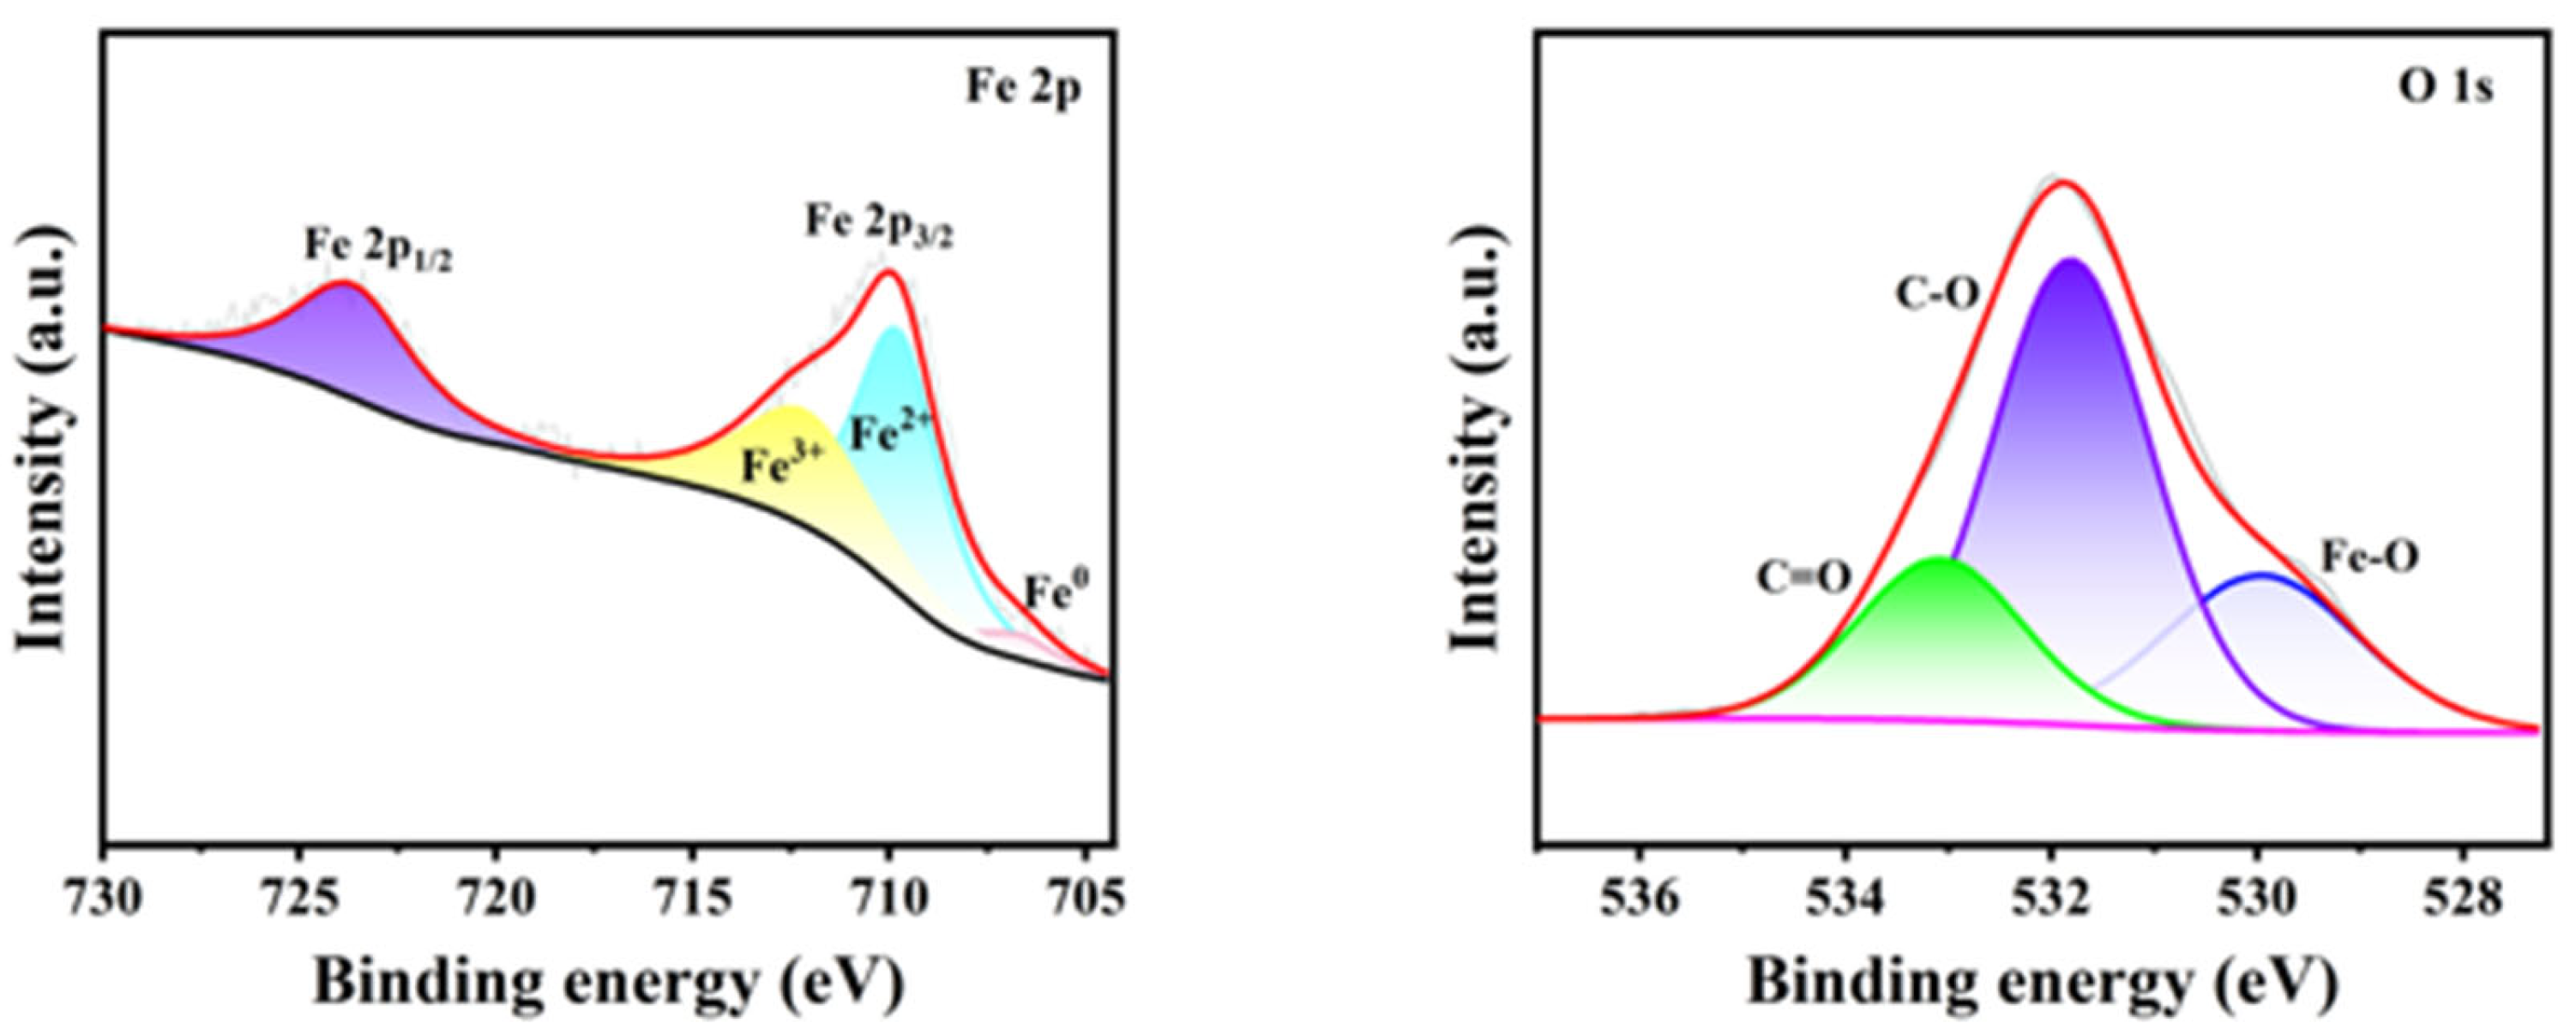
The worn surfaces of the steel balls lubricated with PETO were analyzed using X-ray photoelectron spectroscopy (XPS), and the XPS spectra were fitted to the curves shown in
Figure 5. The O
1s spectrum can be deconvoluted into three peaks at binding energies of 529.6 ± 0.1 eV, 531.8 ± 0.1 eV, and 533.2 ± 0.1 eV, which correspond to Fe-O, bridging oxygen (mainly C-O-C), and non-bridging oxygen or other oxygen-containing groups in the polycarbonate chain, respectively. These findings suggest that the tribochemical film may contain FeCO
3, FeO, and Fe
2O
3.
Figure 6a,b show the XPS spectra of P-S1 and P-S2. Peaks at 707.13 eV, 710.81 eV, 712.23 eV, and 724.44 eV correspond to different iron oxidation states. The presence of peaks at 531.11 eV for O
1s and 133.5 eV for P2p indicates the formation of phosphates and polyphosphates on the wear surfaces of the steel balls. The tribofilm likely contains FeO, Fe
2O
3, FePO
4, and mixed iron phosphates (Fe
n(PO
4)
m). Additionally, the peaks at 160–169 eV for S2p suggest the presence of FeSO
4, FeSO
3, FeS
2O
4, FeS
2, and FeS, indicating that the protective layer is formed through tribochemical reactions involving sulfur and phosphorus additives. This tribochemical layer further enhances the tribological properties of the additives.
3.2.3. Wear Surface XANES Analysis
In XANES (X-ray absorption near-edge structure) spectroscopy, FY (fluorescence yield) and TEY (total electron yield) represent two distinct signal detection modes, each embodying different signal collection methods and emphasizing different types of information. The FY mode, or fluorescence yield, involves analyzing by detecting the intensity of the fluorescent X-rays emitted by the sample after it absorbs X-rays. The advantage of the FY mode lies in its deep penetration depth into the sample, allowing it to detect information from deeper layers within the sample. The TEY mode, or total electron yield, involves analyzing by detecting the total number of electrons emitted by the sample after it absorbs X-rays. The advantage of the TEY mode is its high sensitivity to changes on the sample surface, making it suitable for studying the chemical composition, oxidation states, and chemical bonds of the sample surface. The FY mode and the TEY mode were both used in this paper to achieve a more comprehensive analysis of the sample.
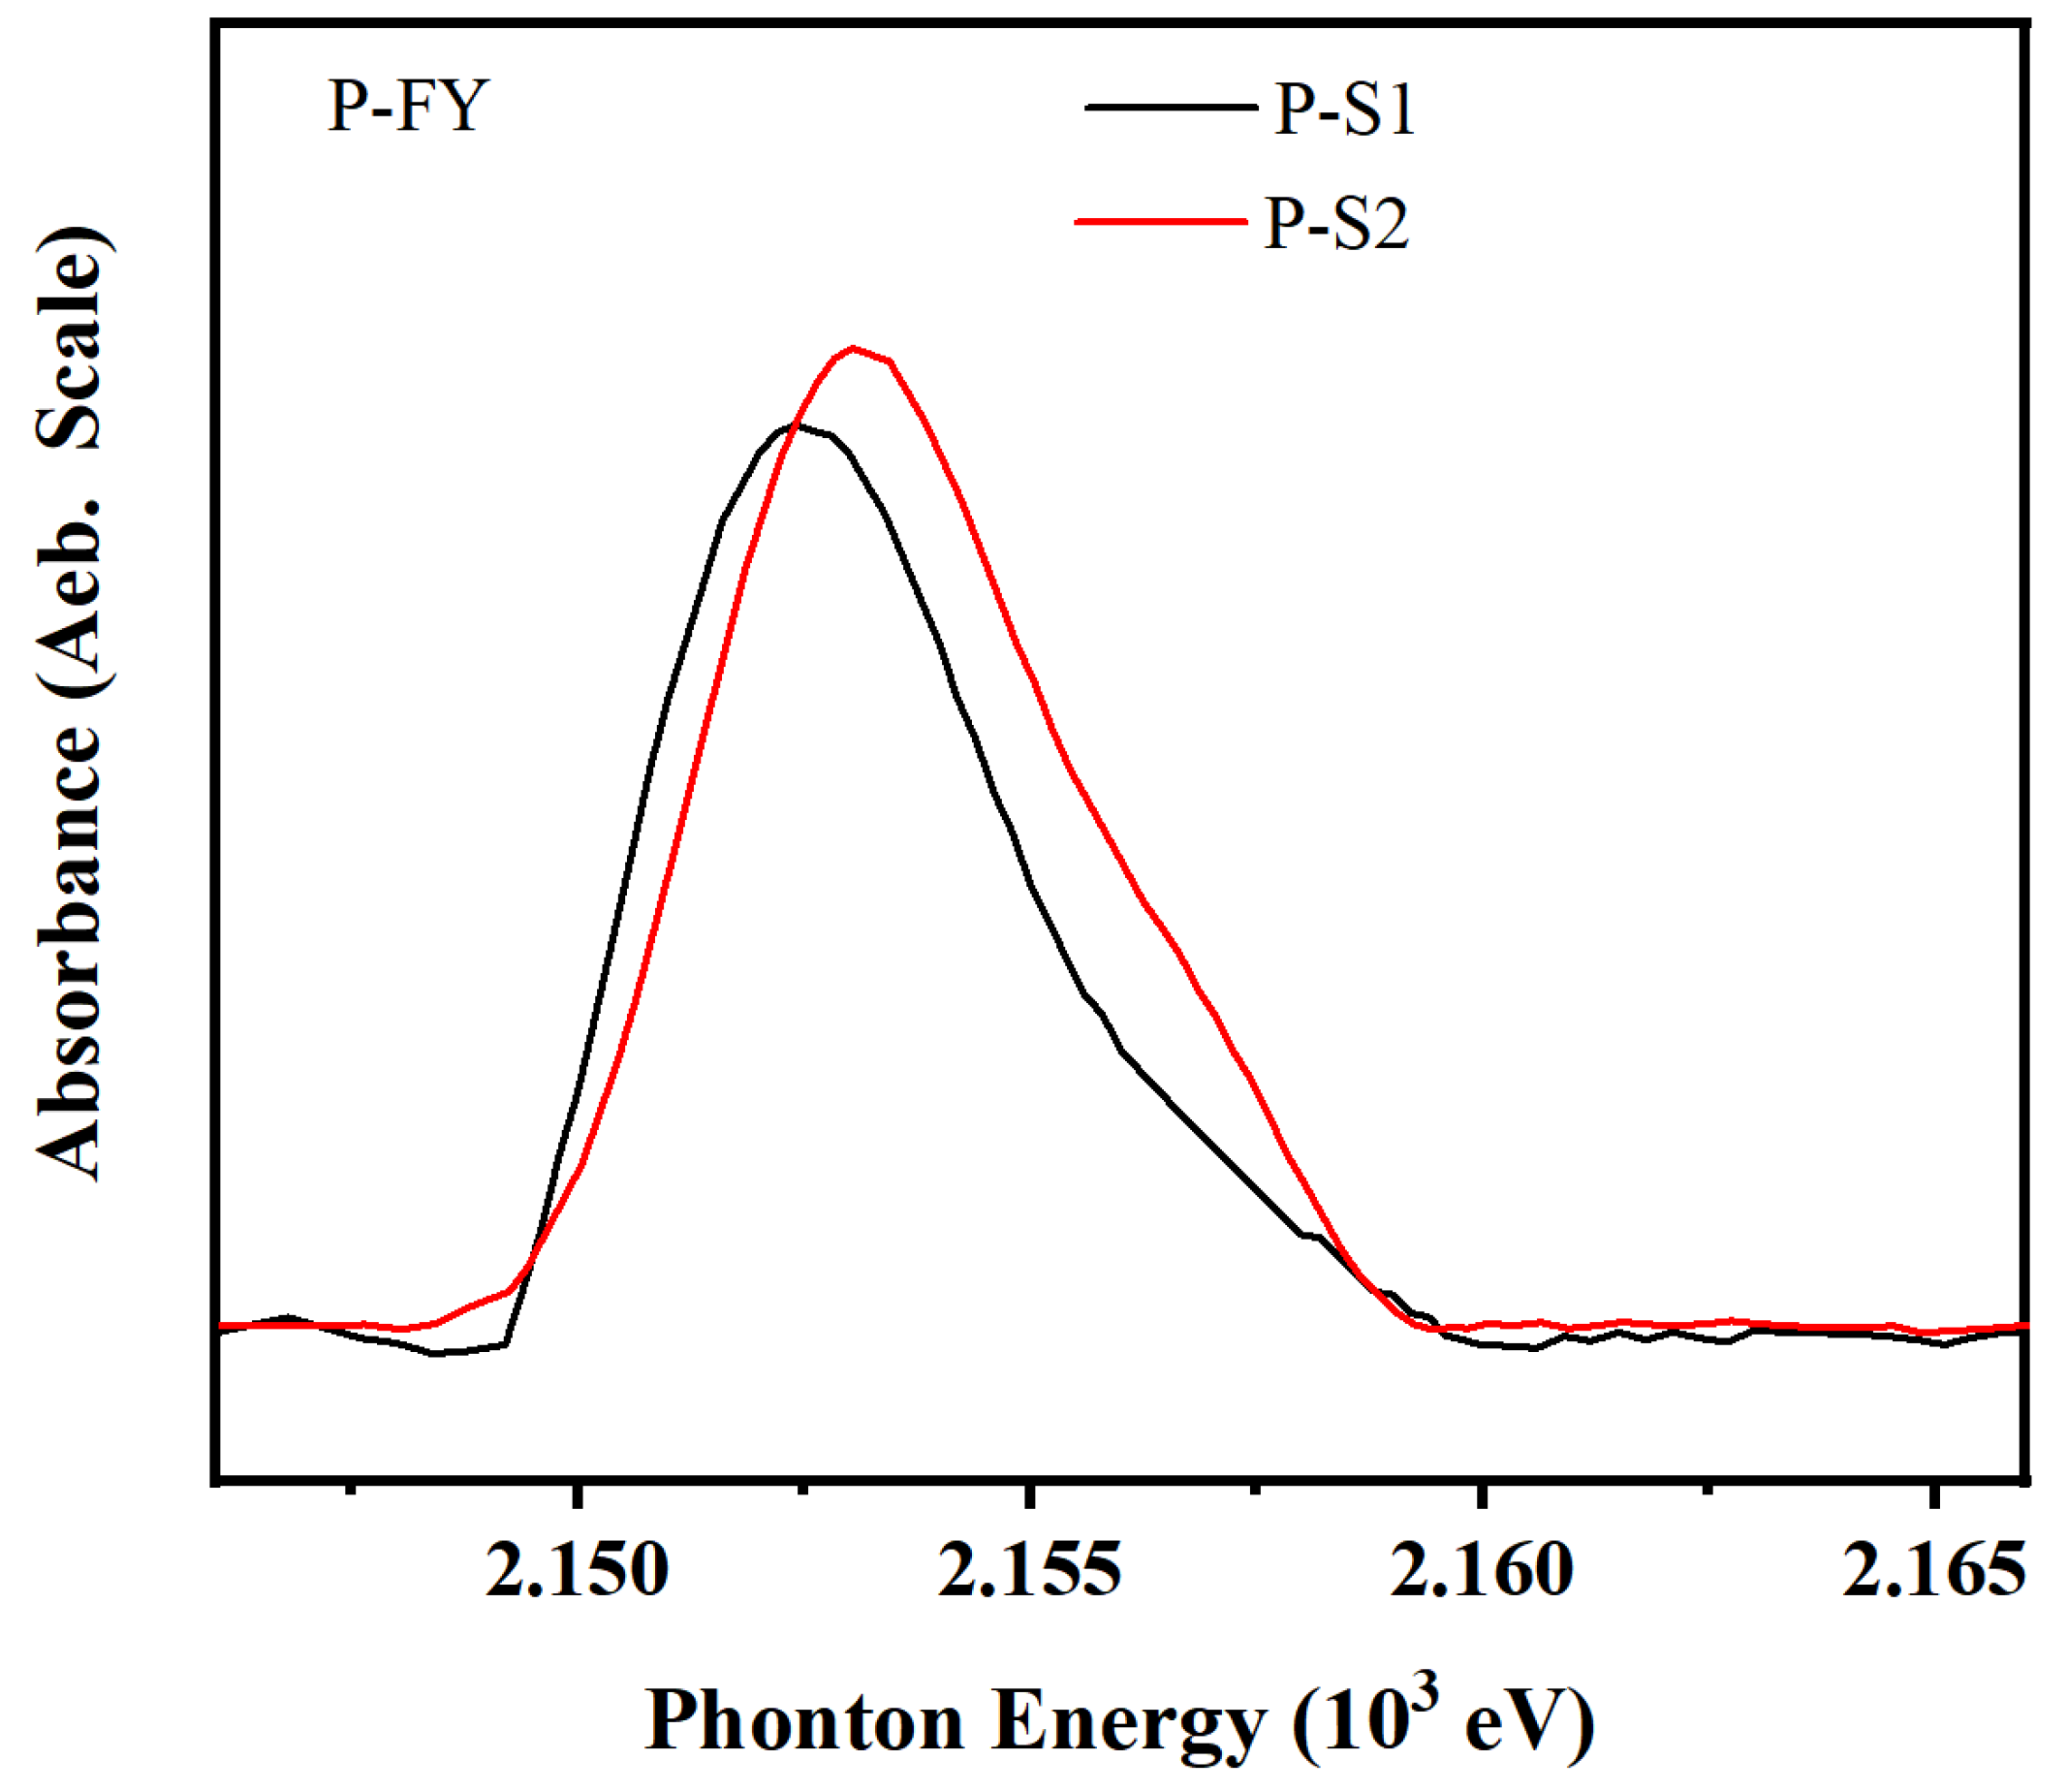
The K-edge XANES spectra of the model compounds are shown in
Figure S1, while the K-edge XANES spectra of phosphorus (P) in the FY mode (fluorescence yield mode) with different additives are presented in
Figure 6. The K-edge peak positions of phosphorus in the FY mode for various model compounds are listed in
Table 4. The characteristic peak for polyphosphate is observed between 2150 and 2160 eV, with higher phosphate polymerization shifting the peak position toward lower energy.
As shown in
Figure 7 and
Table 4, phosphate friction films were formed on the wear surfaces of both additives, consistent with the XPS results. The composition of the friction films formed by the two additives on the metal surface is not fundamentally different; however, the difference in tribological performance is attributed to variations in adsorption and reaction extent. Compared to the spectra of FePO
4 and Na
4P
2O
7, a high-intensity peak at 2152.5 eV was observed on the friction surface of P-S1, indicating the formation of a highly polymerized phosphate reaction film. In contrast, P-S2 formed strong peaks at 2153.8 eV, suggesting the formation of only oligomeric FePO
4 friction films. Therefore, the K-edge XANES absorption spectra of phosphorus in the FY mode for different additive samples reveal a higher amount of polyphosphate on the surface lubricated with P-S1.
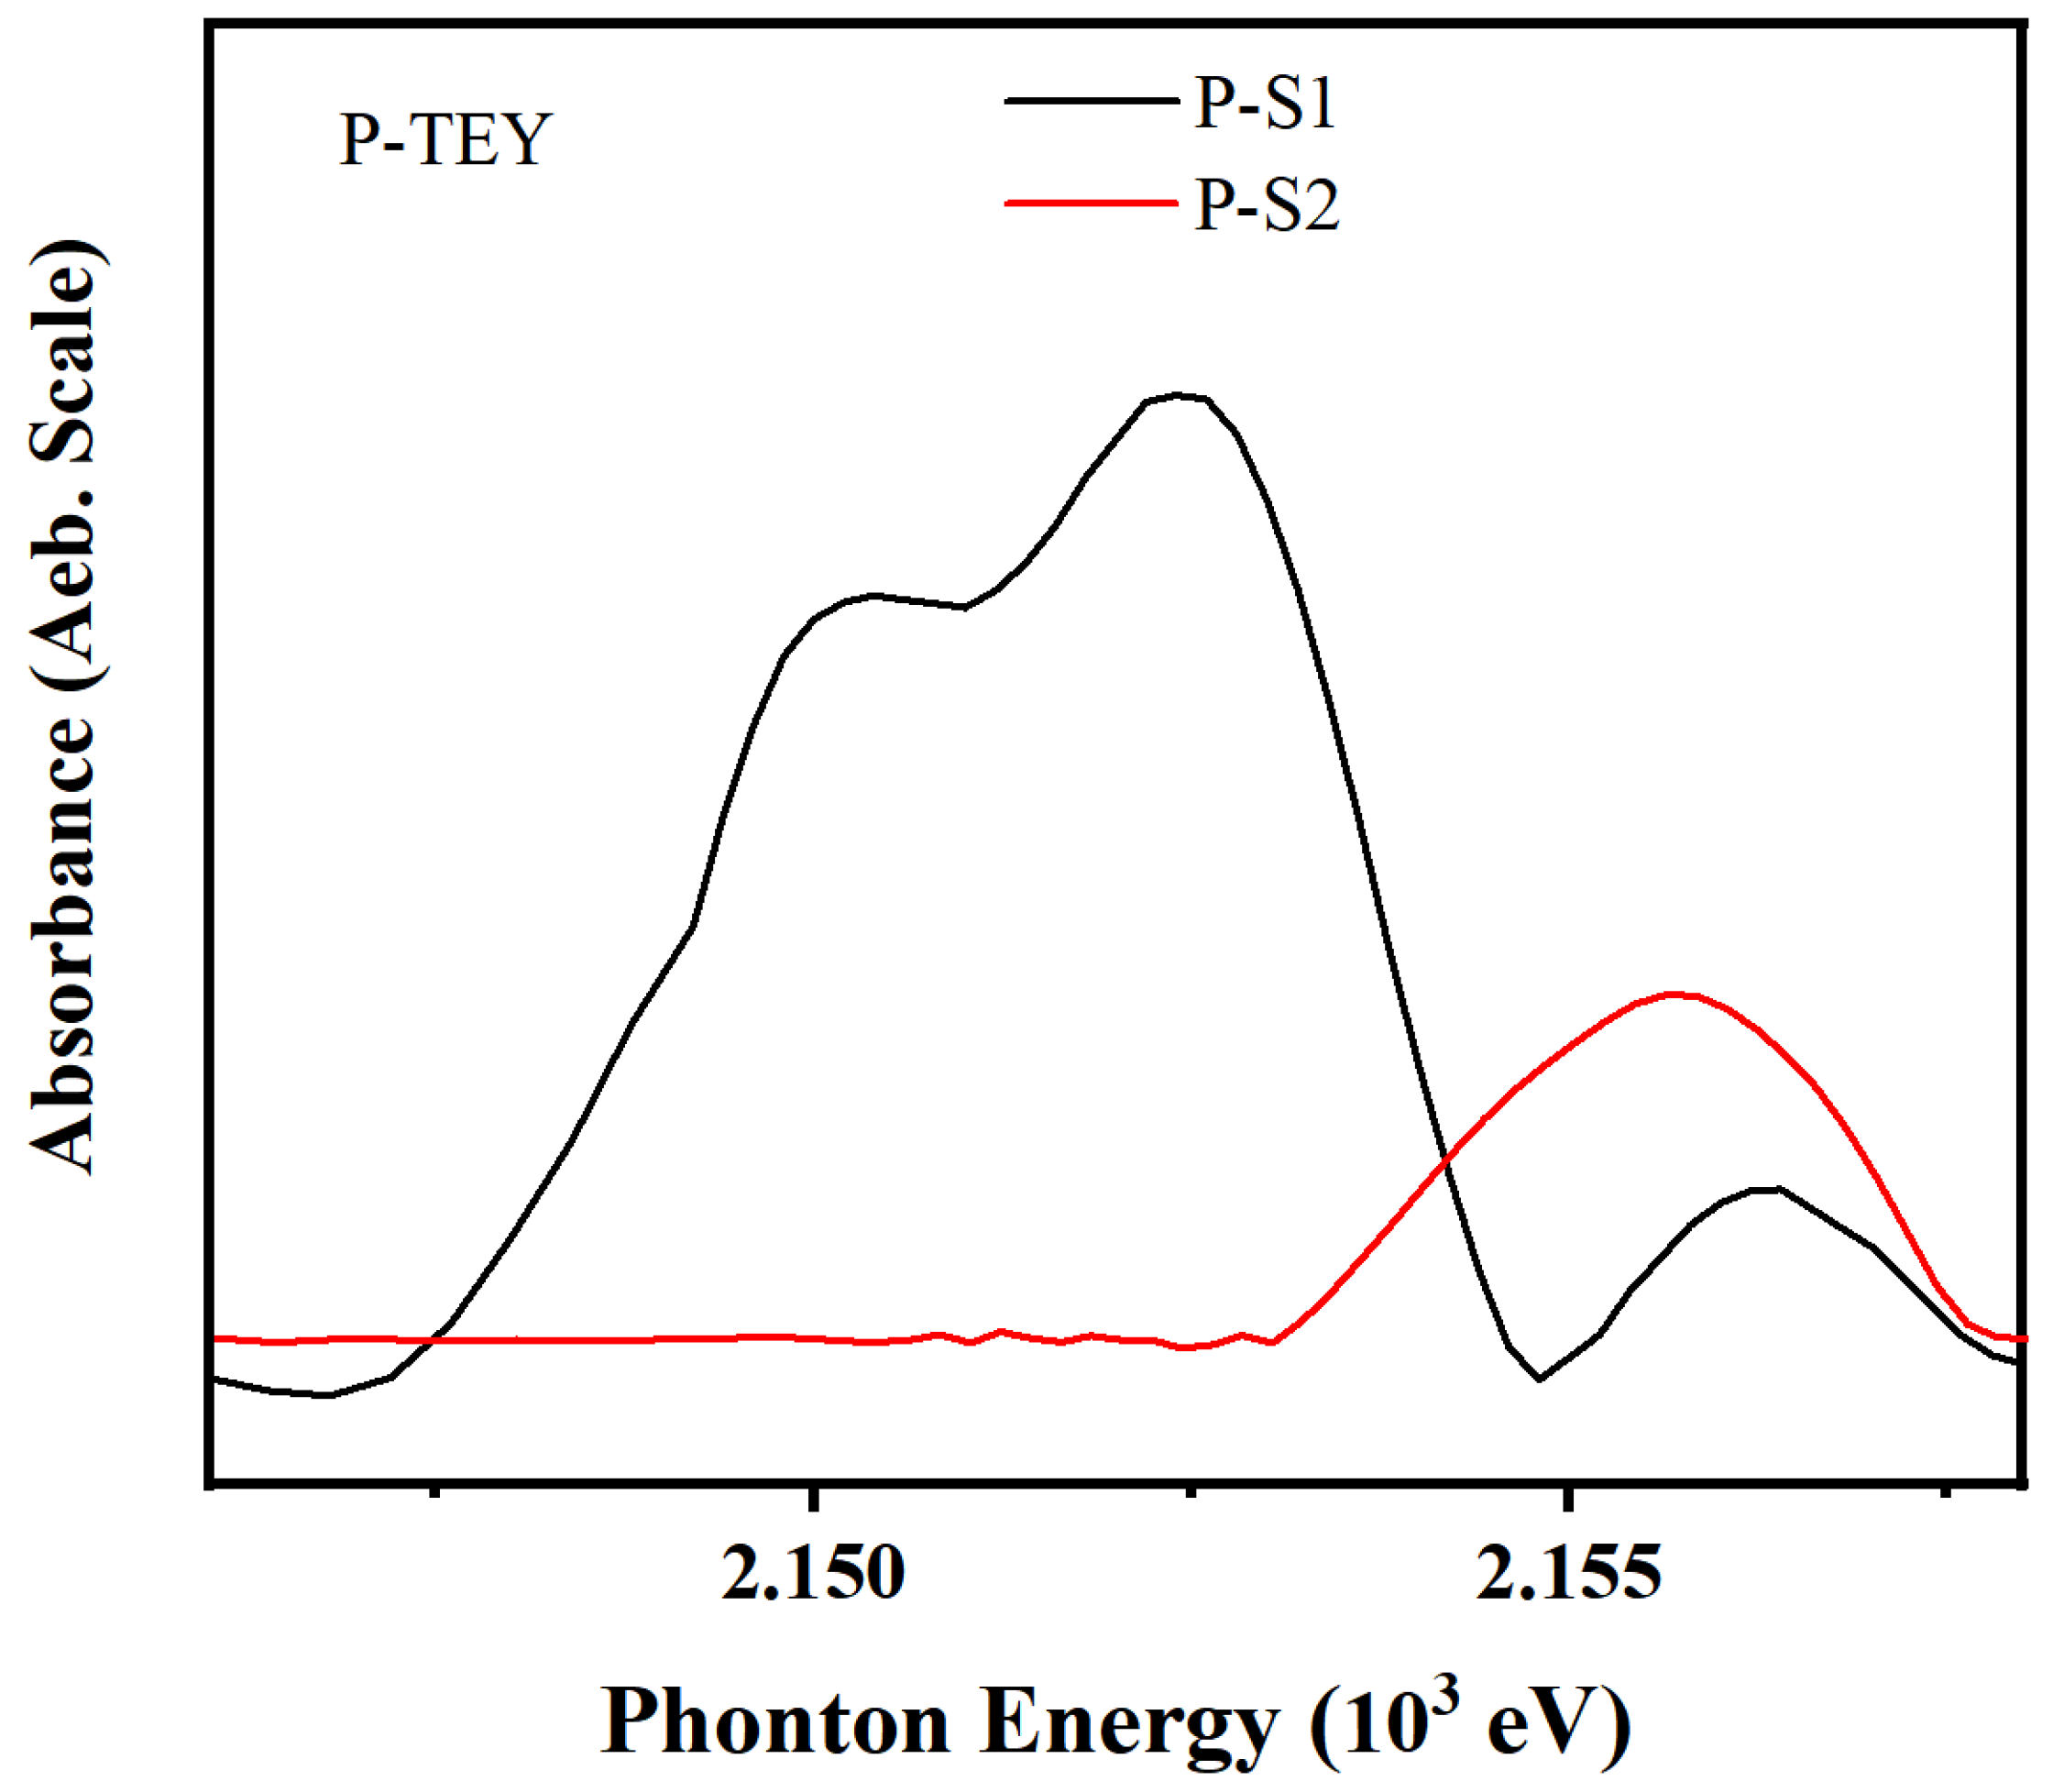
Figure 8 displays the K-edge XANES spectra of phosphorus in the TEY mode (total electron yield model) with different additives, with peak positions listed in
Table 5. Significant differences were observed in the content and degree of polymerization of polyphosphates formed by the two additives. For P-S1, high-intensity peaks were observed at both 2150.8 eV and 2152.5 eV, indicating the formation of a phosphate reaction film with both high polymerization and oligomeric FePO
4 on the surface. In contrast, P-S2 only showed strong peaks at 2155.2 eV, indicating the formation of oligomeric FePO
4 friction films with weak extreme pressure capabilities.
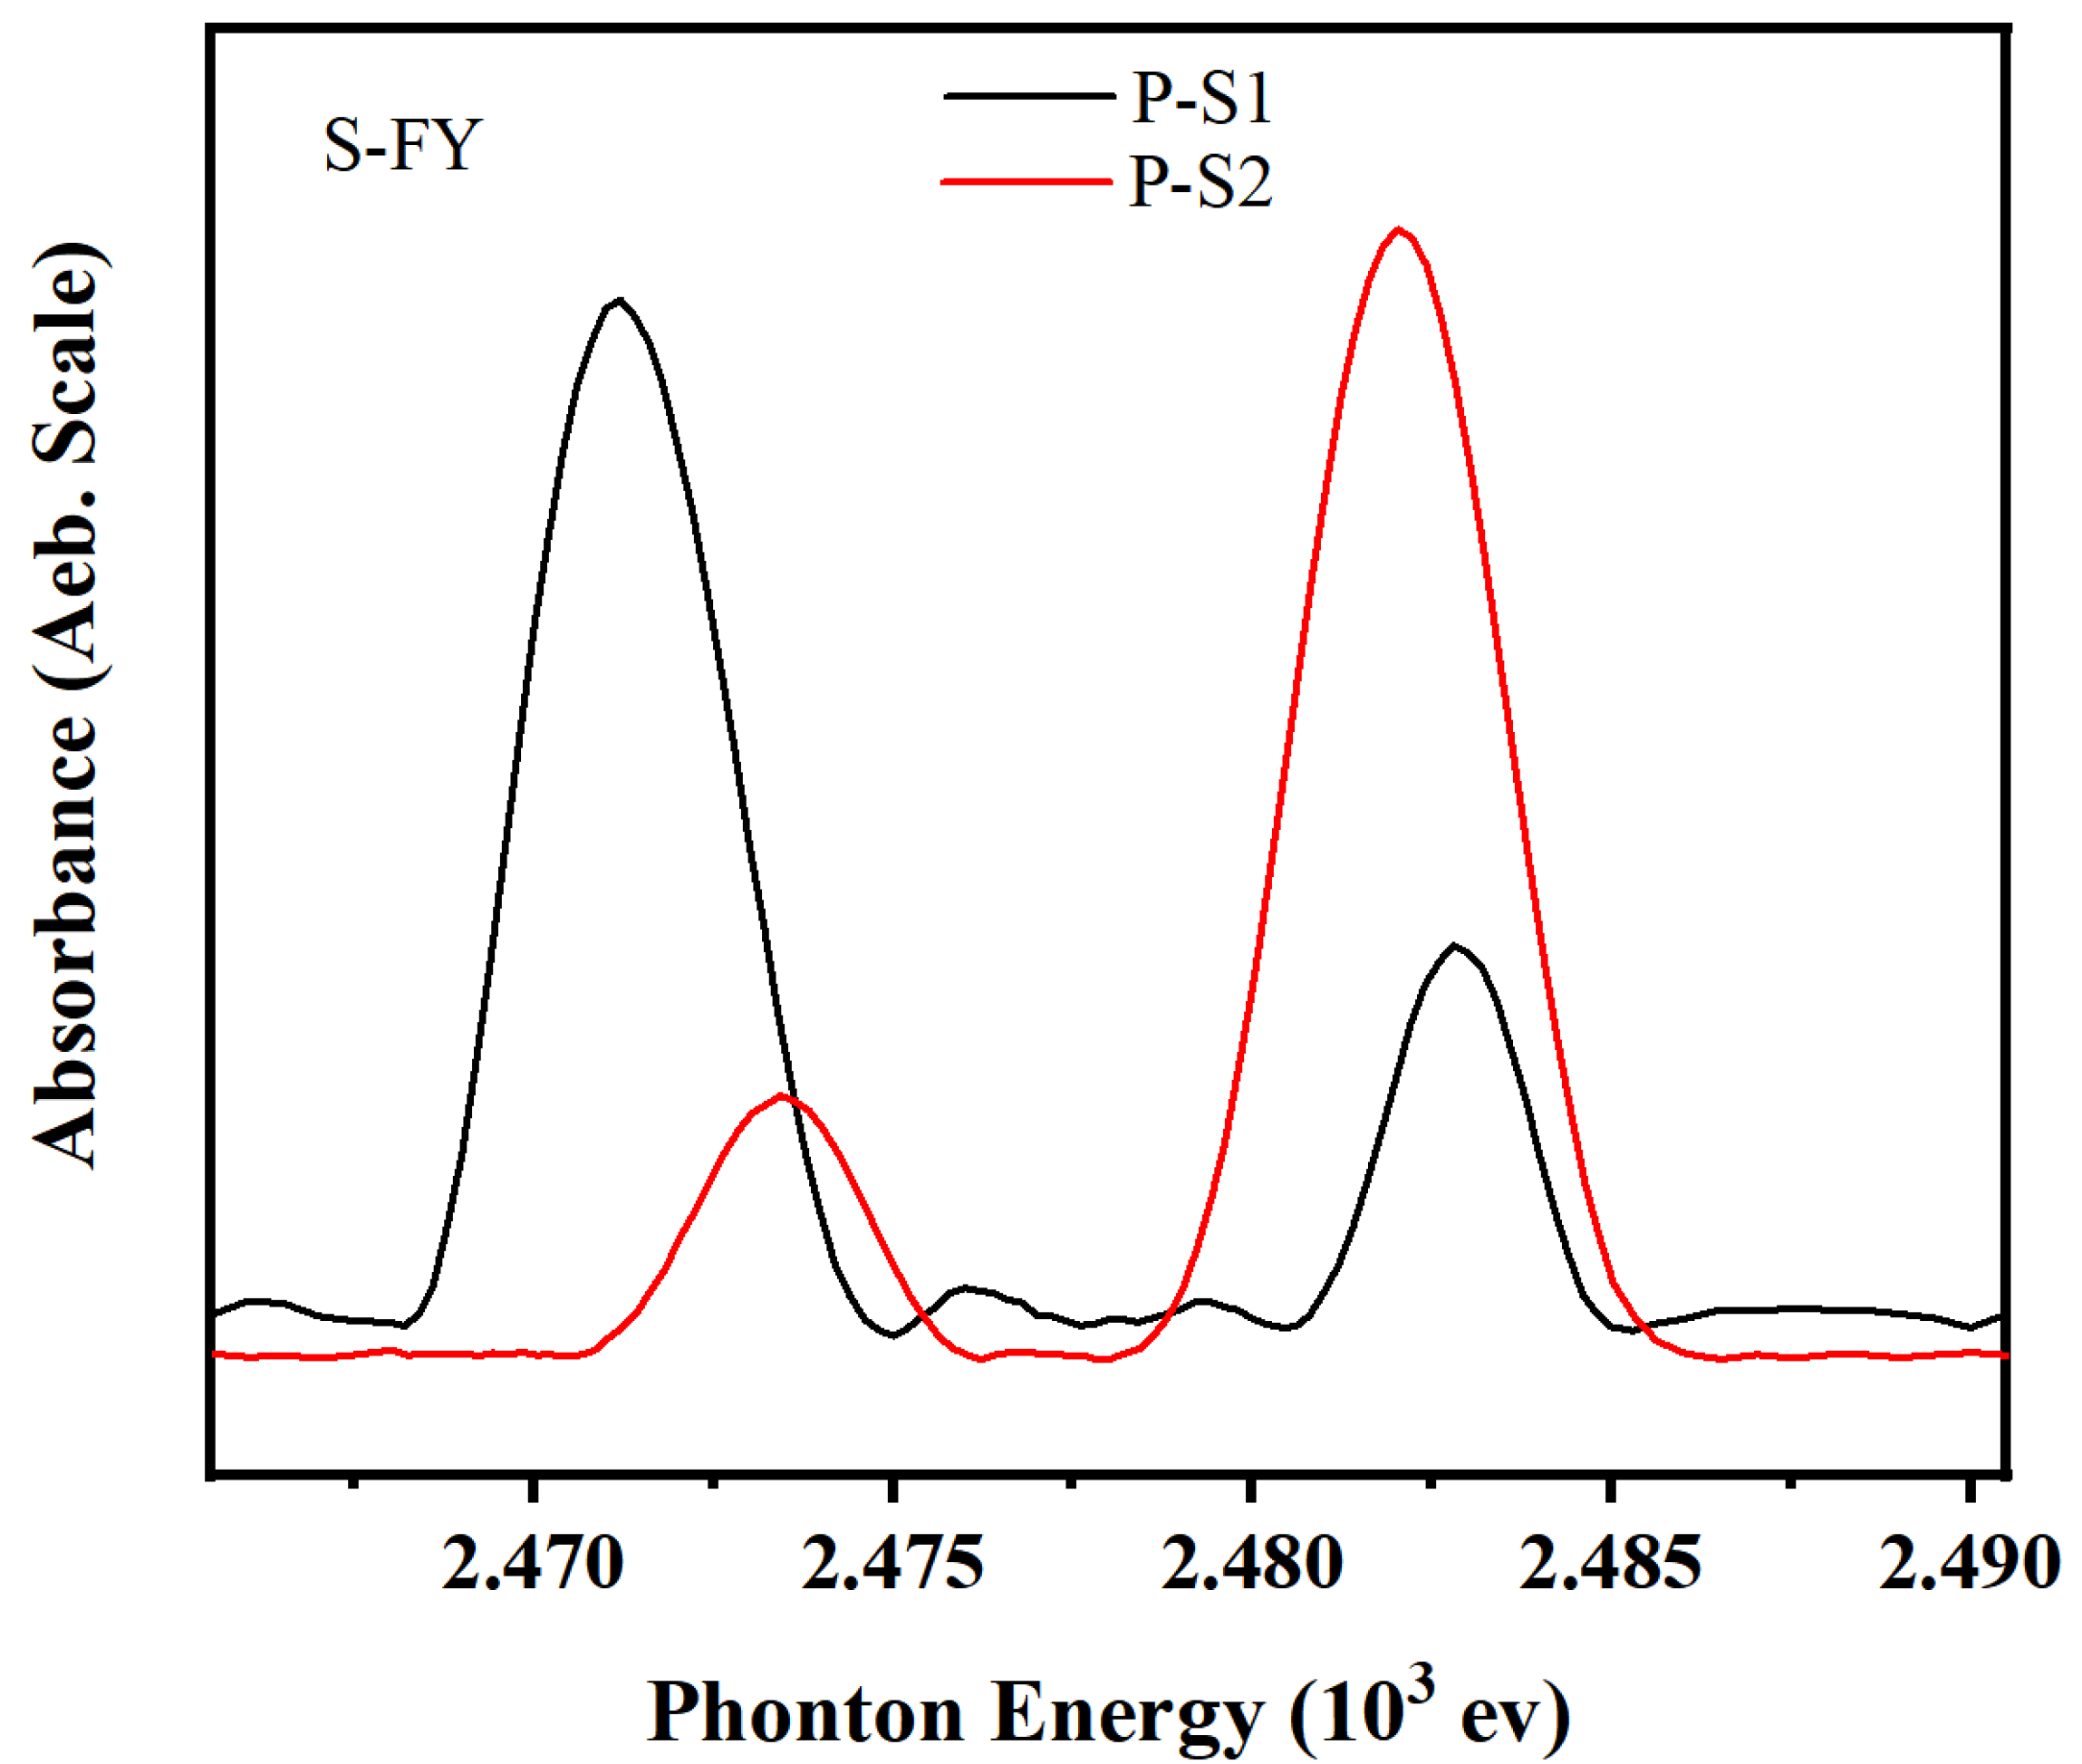
The K-edge XANES spectra of the model compounds (FeSO
4, FeS
2O
4, FeSO
3, FeS, and FeS
2) are shown in
Figure S2, with the FY mode spectra for sulfur (S) in different additives shown in
Figure 9. The K-edge peak positions for the FY mode spectra for sulfur in several model compounds are listed in
Table 6. For P-S1, four reaction compounds were identified in the friction film: FeS, FeS
2O
4, FeSO
3, and FeSO
4. In contrast, no FeS peak was observed in the P-S2 friction film. This indicates that the friction film near the metal surface mainly consists of sulfides, which contribute to an improved PB value. The increase in active sulfur content likely facilitates the formation of sulfides such as iron sulfide or ferrous sulfide near the metal surface.
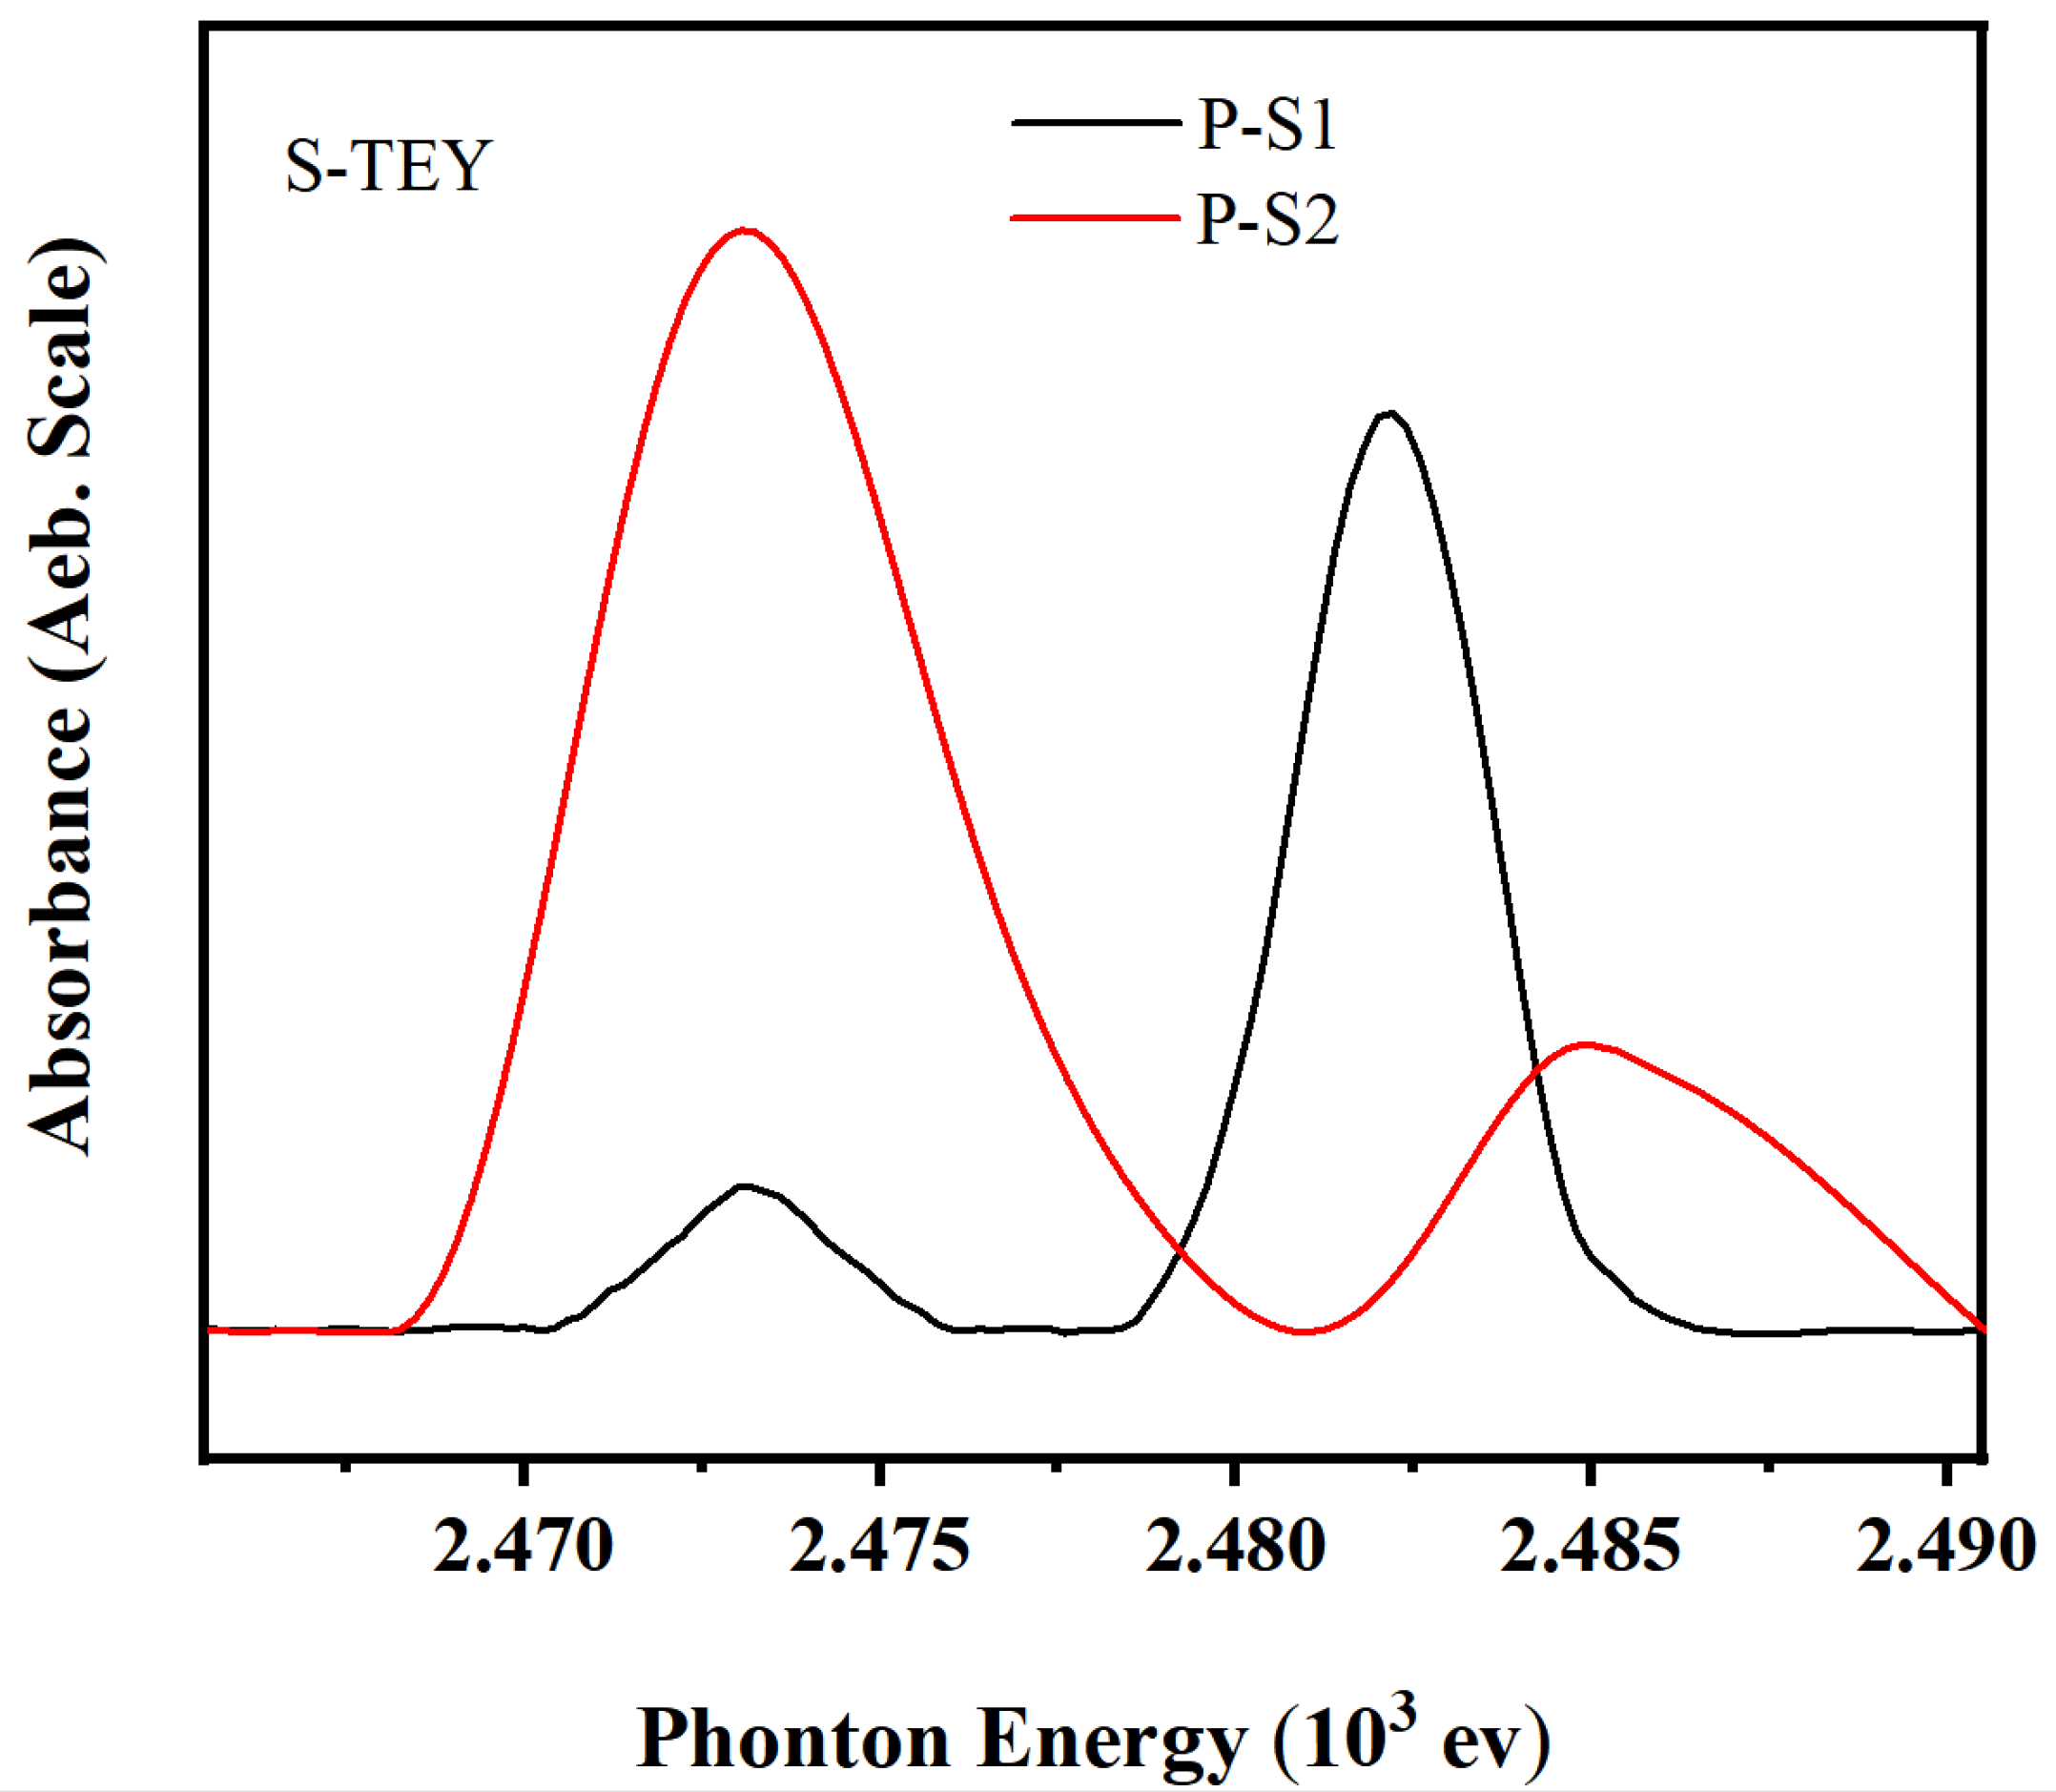
Figure 10 shows the K-edge XANES spectra of sulfur in the TEY mode with different additives, and the peak positions are listed in
Table 7. Both P-S1 and P-S2 friction films exhibited characteristic peaks of sulfides and sulfates, primarily FeS
2, FeS
2O
4, FeSO
3, and FeSO
4, which aligns with the XPS analysis. This indicates that the friction film farther from the metal surface mainly consists of oxysulfides.


