Article

Levitation Performance of Radial Film Riding Seals for Gas Turbine Engines

1
Virtual Engineering Research Center, Korea Institute of Machinery & Materials, Daejeon 34103, Republic of Korea
2
Strategy & Innovation Division, Doosan Enerbility, Seongnam-si 13557, Republic of Korea
*
Author to whom correspondence should be addressed.
Lubricants 2024, 12(12), 433; https://doi.org/10.3390/lubricants12120433
Submission received: 12 November 2024 / Revised: 29 November 2024 / Accepted: 3 December 2024 / Published: 5 December 2024
(This article belongs to the Special Issue Thermal Hydrodynamic Lubrication)

Abstract

:
Turbomachinery in gas turbines uses seals to control the leakage between regions of high and low pressure, consequently enhancing engine efficiency and performance. A film riding seal hybridizes the advantages of contact and non-contact seals, i.e., low leakage and low friction and wear. The literature focuses on the leakage performance of these seals; however, one of their fundamental characteristics, i.e., the gap between the rotor and seal surface, is scarcely presented. The seal pad levitates due to the deflection of the springs at its back under the influence of hydrodynamic forces. This study develops a test rig to measure the levitation of film riding seals. A high-speed motor rotates the rotor and gap sensors measure the levitation of the seal pads. Measurements are also compared with the predictions from a Reynolds equation-based theoretical model. Tests performed for the increasing rotor speed indicated that, initially, until a certain rotor speed, the pads adjust their position, then rub against the rotor until another rotor speed is reached, before finally starting levitating with further increased rotor speeds. Moreover, both the measured and predicted results show that pads levitated the most when located 90° clockwise from the positive horizontal axis (bottom of seal housing) compared to other circumferential positions.

1. Introduction

Enhancing engine efficiency and reducing harmful turbine emissions have always been the focus of research and development in the field of turbomachinery. Sealing in turbomachinery is believed to be one of the most cost-effective techniques in improving engine performance and efficiency [1]. These machine elements are estimated to achieve performance gains at four to five times cheaper costs compared to the upgradation of the compressor or turbine [2]. In the gas turbine engines, they are primarily used to prevent the gas from entering the bearing cavities, to regulate the cooling flow to various parts of the engine, and to prevent the working fluid flow recirculation between different stages. In addition to their primary duties, seals also contribute to the overall system rotordynamic stability.
Chupp et al. [3] published a detailed review of seals in the turbomachinery of gas and steam turbines. They focused on the effects of proper clearance control in the seals on the engine efficiency and component life. A change of 25.4 µm in the blade tip clearance results in a reduction in the specific fuel consumption of up to 0.1% and a drop of 1 °C in the temperature of the exhaust gas. Operating conditions including temperatures, pressure, rotor speeds and material properties significantly affect the performance of the seals and, consequently, the overall engine efficiency and rotordynamic behavior.
The authors of Ref. [3] discussed the environment and key sealing locations in gas and steam turbines along with the pros and cons of the different types of seals. One of the most common types of seal used in gas and steam turbines are labyrinth seals, which are low-cost and have a simple design offering either direction shaft rotation. However, due to the tighter clearances between the seal and the rotor required for effective leakage control, they are prone to rubs and consequent degradation in leakage control. In addition, labyrinth seals have the disadvantage of developing destabilizing cross-coupled stiffness coefficients. Researchers have demonstrated that the overall engine performance can be increased by up to 6% by replacing the labyrinth seals with more effective seals [4].
Another commonplace seal in turbomachinery is the brush seal, which has compliant bristles that can be designed with minimized clearance between the seal and the rotor, eventually having a better leakage performance compared to labyrinth seals [5]. The typical structure of the brush seals available commercially comprises a pack of dense metallic bristles like a brush sandwiched between a front plate at the high-pressure side (upstream) and a back plate at the low-pressure side (downstream). The compliant nature of the bristles gives brush seals the benefit of accommodating rotor excursions, particularly at startup and shut-down, by bending rather than buckling; however, they are prone to damage under large rotor eccentricities.
Film riding seals (FRSs) that are self-acting seals combine the best features of contact seals, i.e., lower leakage and non-contact seals, leading to lower friction and wear and consequently lower heat generation and power loss. These types of seals can be of two types, i.e., hydrostatic and hydrodynamic. Hydrostatic FRSs use externally pressurized fluid injected between the seal and the rotor surfaces to maintain a controlled film gap between them. A hydrodynamic FRS, on the other hand, relies on the rotor’s surface velocity for the generation of the film gap. The surface of the FRS’s pad is initially in contact with the rotor under static conditions and the rotor lifts off when it reaches a certain speed by virtue of the hydrodynamic pressure which is generated due to the combined effects of the rotor speed and the presence of the grooves on the surface of the seal pad. The back of the seal pad is welded to a spring whose other end is welded to the seal housing. These springs deflect due to the hydrodynamic forces on the seal pad making room for the rotor’s lift off and the consequent generation of the film thickness between the rotor and the seal surface.
The development of the FRS dates back to the early 1970s [4,6,7]. In Ref. [6], the authors tested the FRS under advanced engine operating conditions, demonstrating the best potential by significantly reducing the leakage flow rates compared to conventional seals. This study showed that, at a rotor speed of 43 krpm, the FRS operated with less leakage than the labyrinth seals and without any rubbing contact during the 150 h endurance test. As a follow-on to the tests in Ref. [6], the authors extended their research and tested FRSs under more severe conditions in [7]. The rotor speed was increased to 54.6 krpm and the endurance test time to 500 h. In addition, the tests were also conducted in a dusty environment. The FRS successfully completed the endurance tests with no wear during the first ten hours. Munson et al. [4,8] designed a FRS for preventing compressor discharge flow to the internal flow system of the gas turbine engines. Their designed hydrodynamic FRS with a clearance of less than 12 µm had excellent leakage performance compared to the projected performance of the brush and the labyrinth seals at various pressure differentials. Additionally, FRS leakage was insensitive to the increasing differential pressure. The authors concluded that the designed FRS would improve the overall engine efficiency by 1.5% or 0.5% compared to the labyrinth seal or brush seal, respectively. Steinetz et al. [9] analyzed various FRS design configurations and their effects on the overall performance of an aircraft turbine engine. Their study developed an analytical model of the entire secondary airflow system of the engine based on its cycles and the layout provided by several turbine analysis groups. The airflow distribution obtained from the developed model using the flow characteristics of various FRS design configurations was then used in the calculation of the component efficiencies and, later on, the overall engine performance using another program named mission. Replacing conventional seals with the FRS at only three locations improved the specific fuel consumption of the engine by 0.9% and the consequent operating costs by 0.89%.
Sayma et al. [10] carried out a computational fluid dynamics-based numerical investigation on the lift force and leakage performance of the FRS. The lift force decreased, whereas the leakage increased, with the increasing seal gap and pressure ratio. The analyzed FRS had spiral grooves over its surface.
The design of the grooves or lift pockets on the surface of the FRS contributes significantly to the generation of the hydrodynamic forces responsible for the pad deflection and consequent film thickness between the seal and rotor surfaces. Figure 1 shows two of the earliest designs of the FRS’s grooves from Ref. [11]. The spiral grooves direct the gas inwards, whereas in the Rayleigh pad design, the pockets centralize the gas to raise its pressure. A sealing dam at the inner diameter in both designs is used to restrict the flow leakage. The groove design evolved with time in pursuit of the optimum sealing performance. Tibos et al. [2] numerically analyzed the FRS with various types of grooves, namely wedge/tilted wedge, Rayleigh step, inclined, and herringbone grooves. FRS with the Rayleigh step groove was found to have the maximum combined hydrostatic and hydrodynamic load capacity. Jung et al. [12] recently reported on the experimental leakage performance of the FRS with seal pads with wedge-type grooves. The authors used both static and dynamic rigs to test the seal. The study also tested the labyrinth and brush seals of the equivalent dimensions on the same rigs and compared the performance with the FRS. The FRS demonstrated significantly lower leakage compared to the labyrinth and brush seals.
Other studies on the FRS include the work of Guardino et al. [13], which presented a numerical study on the effects of the surface roughness on the lift force and the film stiffness of the FRS with Rayleigh pads. Similarly, the study presented by Trivedi et al. [14] focused on the film stiffness capability of the hydrostatic FRS. Instead of the grooves, they used hydrostatic feed ports for the injection of the externally pressurized fluid. Bidkar et al. [15] performed a computational fluid dynamics analysis on the FRS with a spiral groove design for utility-scale supercritical carbon dioxide turboexpanders. The authors also developed a Reynolds equation-based model which overestimated the average pressure at high film thickness. The analyzed FRS is believed to eliminate 0.55–0.65% of the cycle efficiency loss associated with conventional labyrinth seals used as the shaft end seals. Recently, Bidkar et al. [16] advanced their study in Refs. [14,15] by analyzing a large-diameter hybrid FRS for supercritical carbon dioxide turbines. The hybrid FRS integrated the feed ports from Ref. [14] with the spiral groove design of Ref. [15] to combine the effects of the external pressurization of the fluid as well as the hydrodynamic pressure generated due to the rotor’s rotation. The hybrid design used piston rings as secondary seals to further reduce the leakage. The authors reported the average film thickness and the average temperature rise for small-, medium-, and large-size hybrid FRSs.

Research Objectives

Published research about the FRS mainly focused on its leakage performance. However, information about one of the fundamental characteristics of the FRS, i.e., the levitation of the pads and the consequent generation of the film thickness between the rotor and the seal surface, is scarce. This paper develops a test rig to explore the levitation of the pads of the hydrodynamic FRS with wedge-type grooves operating under a range of rotor speeds. In addition, this study investigates the effects of the circumferential location of the pads on their levitation. For the validation of the results, this study presents a comparison of the experimental results with a Reynolds equation-based theoretical model.

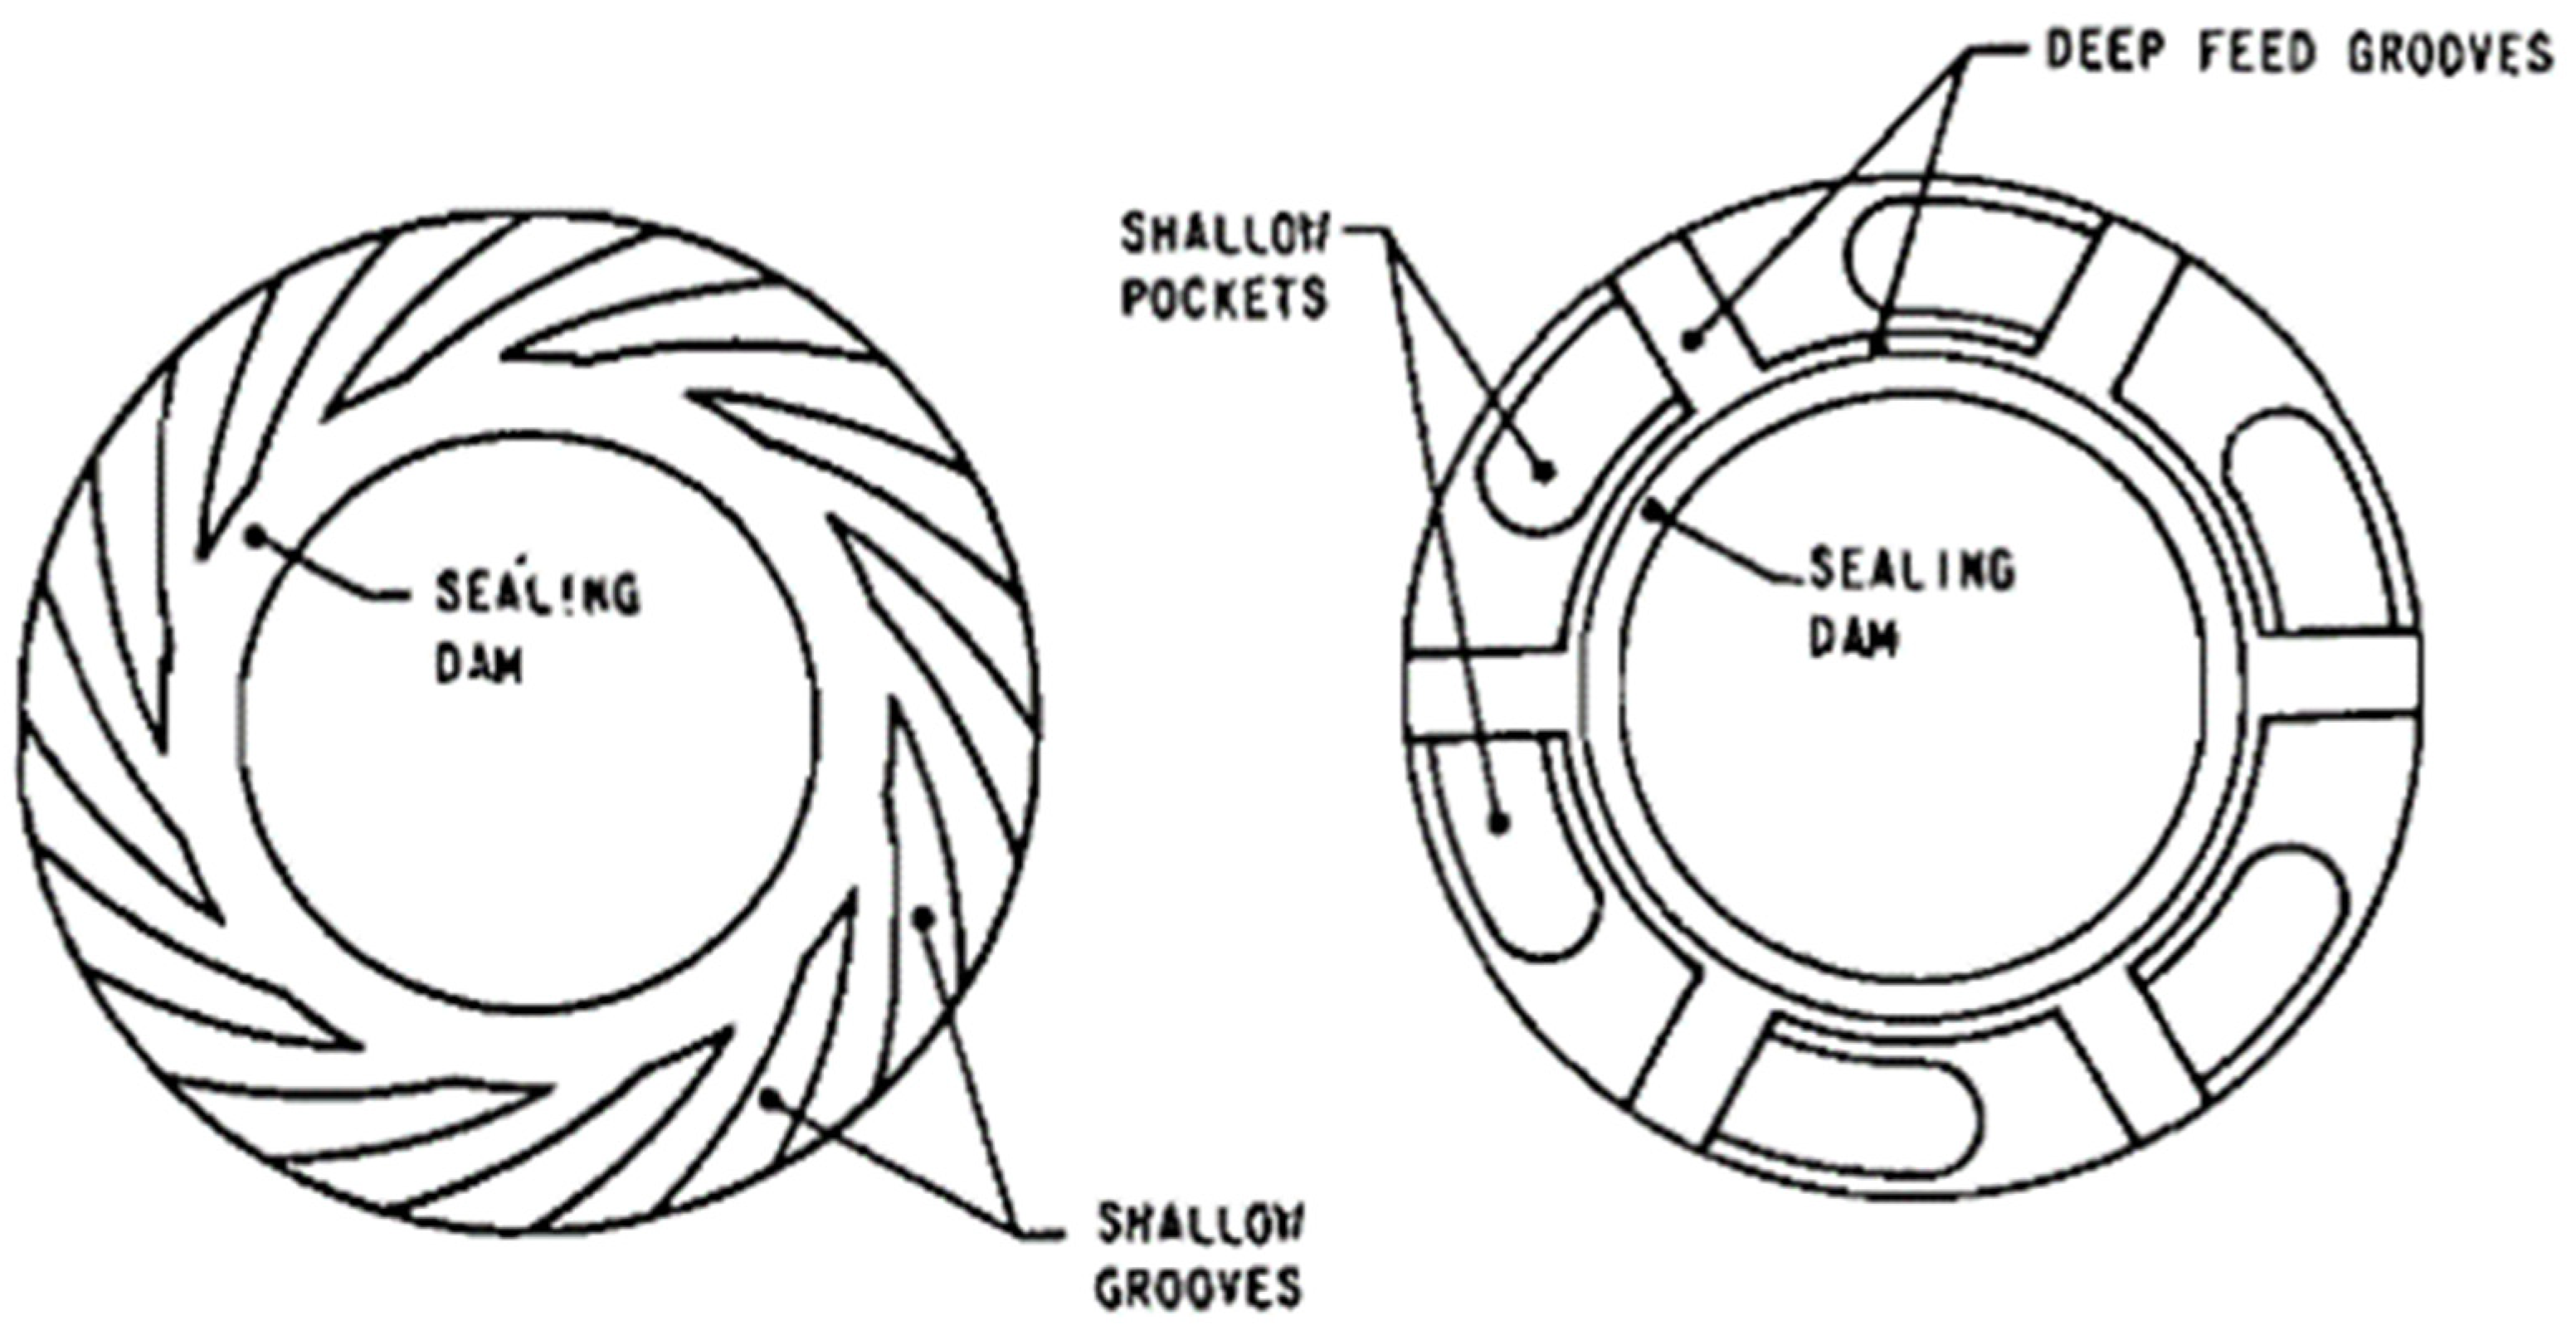
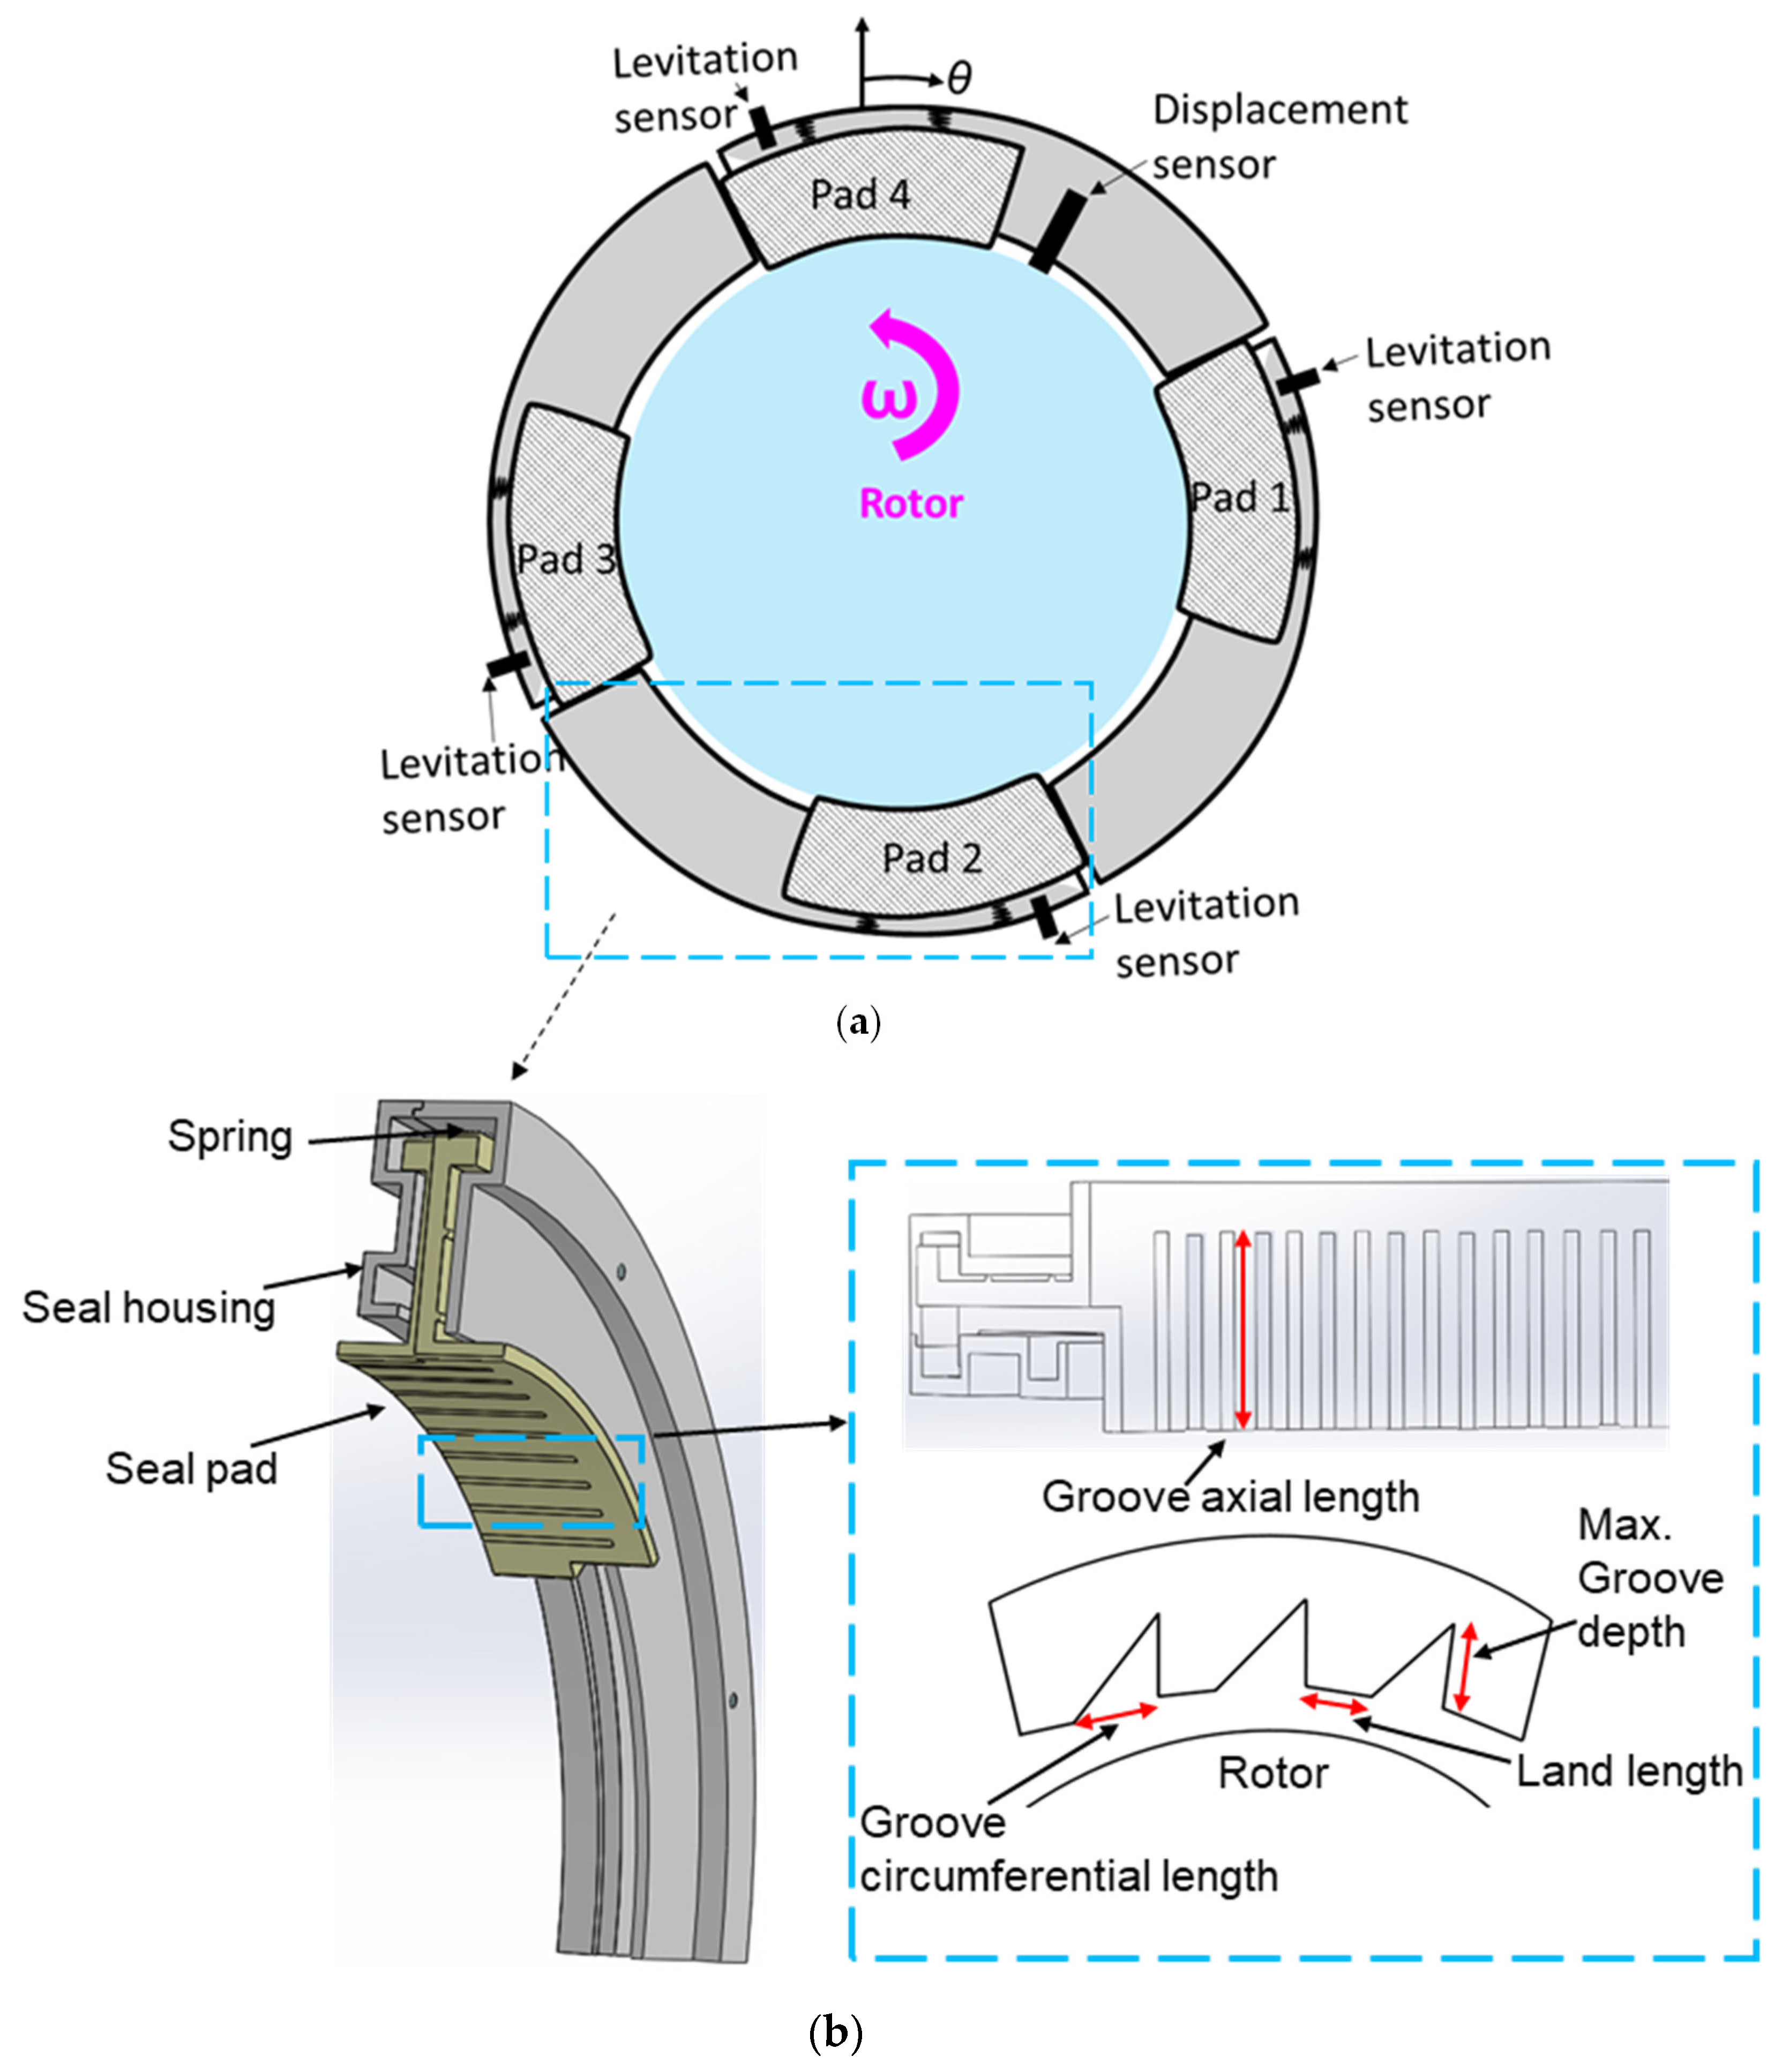
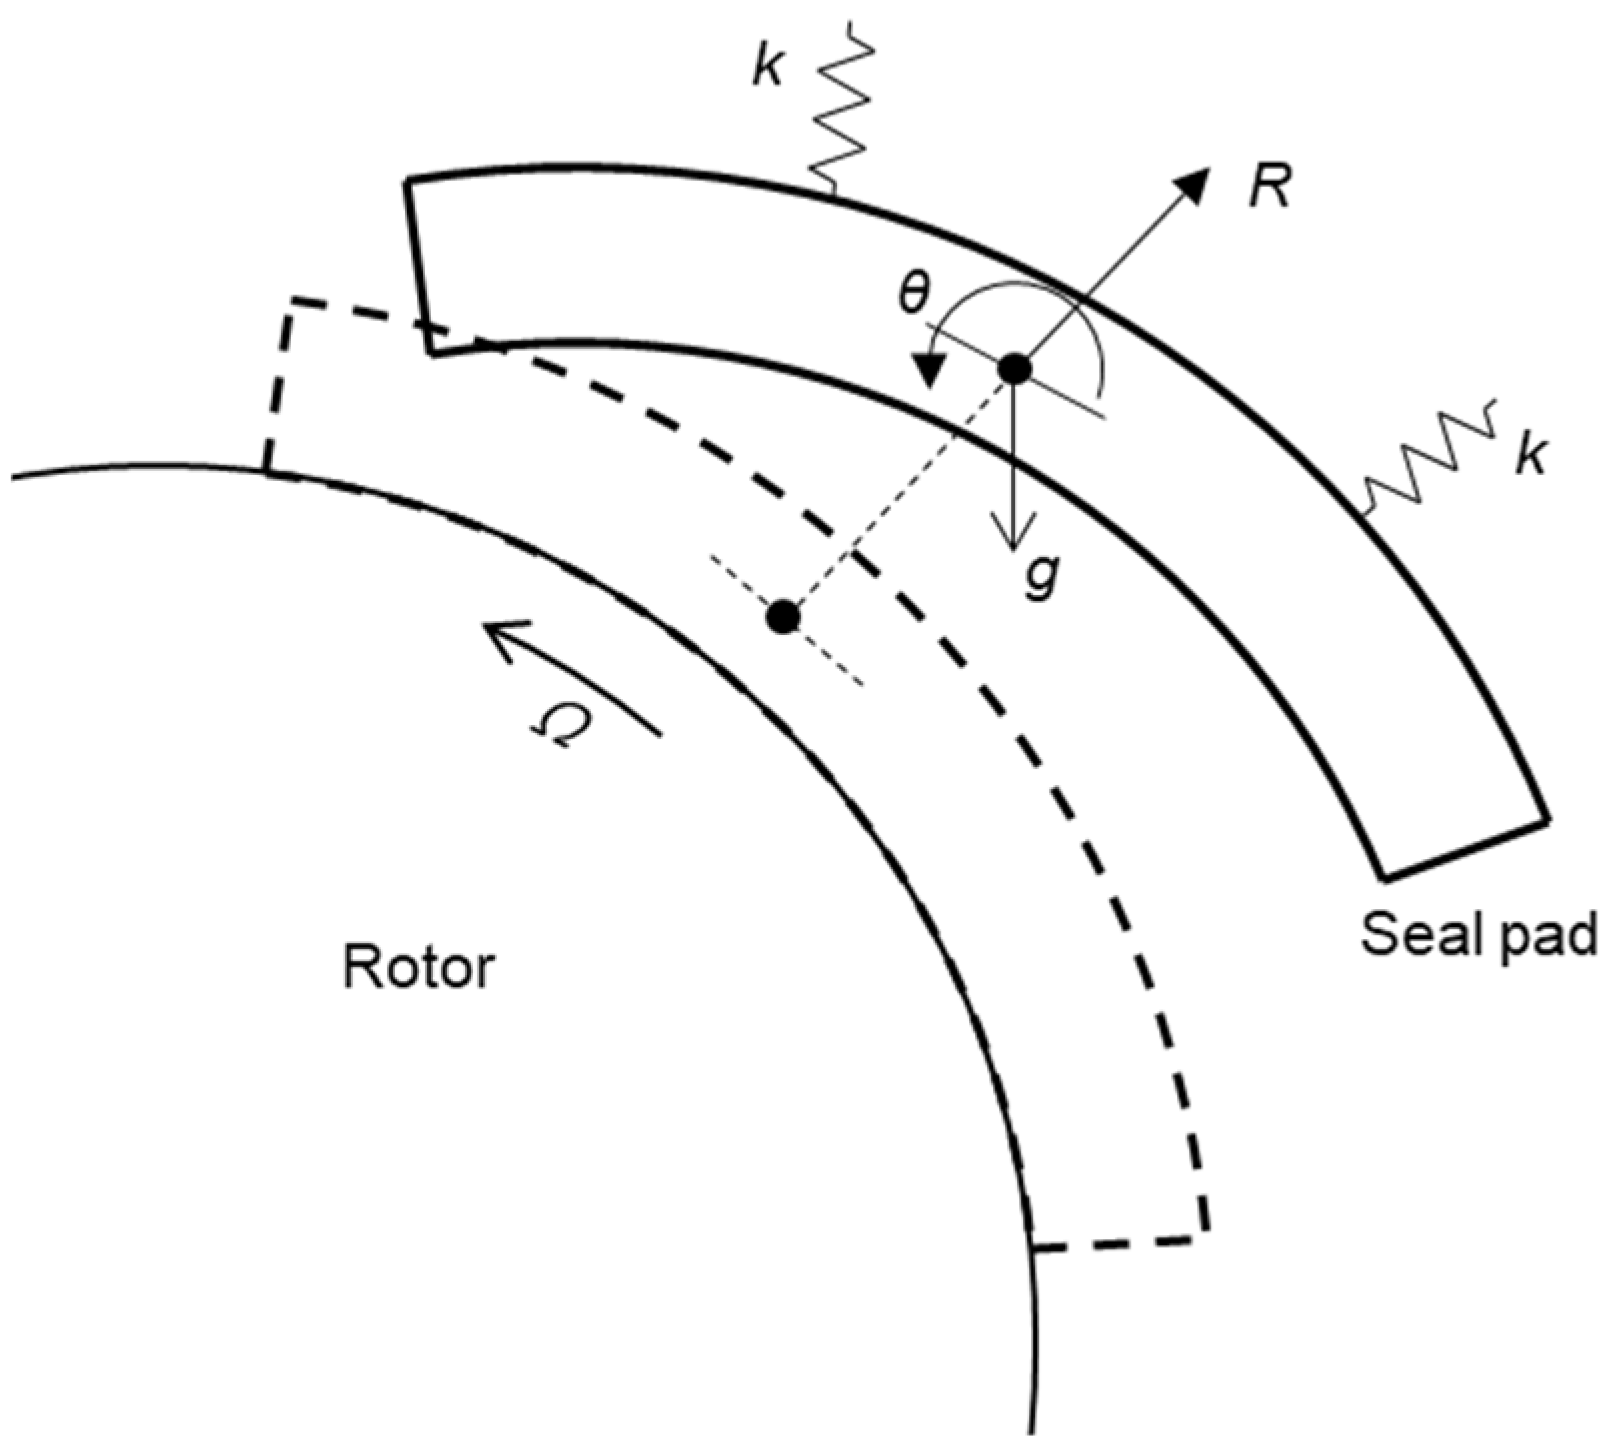
2. Description of FRS

Figure 2 shows (a) a schematic view of the FRS and (b) a single segment of the FRS with the nomenclature. FRS produces hydrodynamic forces by virtue of the grooves on its pads’ surface and the journal’s rotation, which compress the springs at the back of the seal pad and thus a film gap is generating between the rotating and non-rotating parts. As shown in the detailed view of the seal pad, the grooves of the FRS in this study are of the wedge type, the same as those in Ref. [12]. For testing purposes, the pads of each segment of the FRS are nomenclated in the clockwise direction relative to the displacement sensor which is assumed as the reference point. Currently, a set of four segments combines to make a complete seal. Although each segment of the tested seal design typically contains two pads, one pad is removed from each segment for the smooth testing procedures. The radial deflection of the springs due to the hydrodynamic forces away from the rotor’s surface quantifies the levitation of the pads. Note that the levitation is identical to the film thickness between the rotor and the seal pad.

3. Experimental Method for Estimation of FRS Pad Levitation

3.1. Description of the Test Rig

Figure 3 shows (a) a schematic of the test rig designed for testing the FRS and (b) a photograph of the test rig. A high-speed motor with a maximum speed limit of 42,000 rpm drives the rotor attached to it through the coupling on one end, whereas a disk is attached to the rotor at the other end. The test FRS encloses the disk. A couple of the angular contact ball bearings support the rotor at both ends. Note that the current study focuses on the levitation performance (film thickness) of the FRS and that the leakage performance is not covered. Four eddy current gap sensors installed 90 degrees apart at the back of each pad of the FRS measure the deflection of the respective pads. Another pair of gap sensors installed 90 degrees apart near the disk measures the rotor’s displacement. In addition, a non-contact laser sensor is used to measure the rotor speed which obtains the readings through a laser light reflection from the reflective tape attached to the coupling.
Table 1 shows the geometry parameters of the FRS and the operating conditions. The rotor diameter and the seal pad diameter are equal to 140 mm, whereas the axial length of the seal pad is equal to 13 mm.

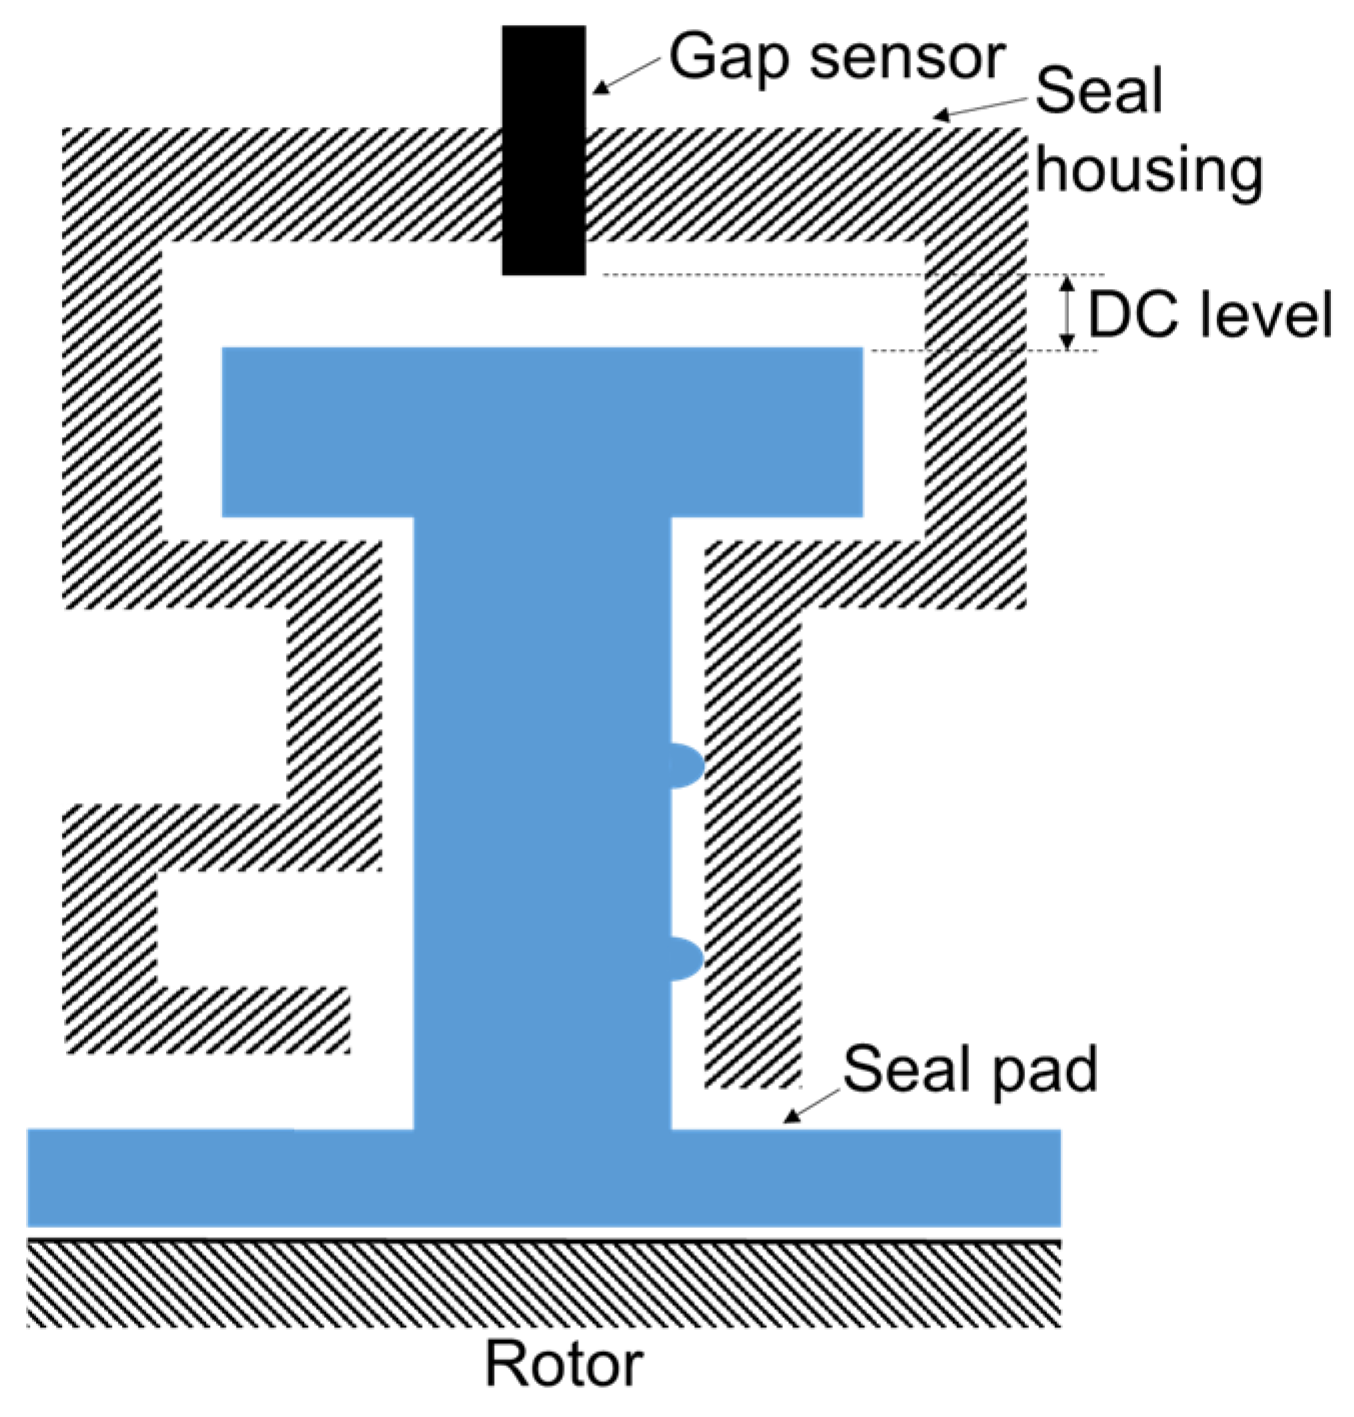
3.2. Measurements of Pad Levitation

Figure 4 shows the procedure for obtaining the levitation measurements of each pad. The rotor and seal pads are initially in contact with each other when the rotor is at rest. Once the rotor starts rotating, the combined effect of the rotor’s rotation and the grooves on the seal pads results in the generation of hydrodynamic pressure which pushes the seal pads radially towards their respective housings. Gap sensors installed at the back of each seal pad monitored these radial movements or the levitation of the seal pads. The converter converts the analog signals coming out of the gap sensors which are stored in digital form on a lab PC using a commercial software m+p SO analyzer revision 4.3. Note that the DC level of the time signal before and after the rotor’s rotation quantifies the levitation of the seal pads.

4. Results

Figure 5 shows the DC level of the time signal for (a) pad 1, (b) pad 2, (c) pad 3, and (d) pad 4. The DC level increases at first for all the pads with the increasing rotor speed, indicating the pad’s displacement towards the rotor. This may seem physically absurd, as the rotor diameter and seal diameter of curvature are the same; however, this is due to the springs at the back of the pads which might have deflected with different magnitudes after the initial installation. The pad’s displacement towards the rotor thus in fact indicates the adjustment of the springs’ deflections through the tilting motion of the pad rather than the actual radial displacement. The DC level remains unchanged for the next few higher rotor speeds and starts decreasing by further increasing the rotor speed, which indicates the pad moving away from the rotor or the occurrence of levitation phenomena. The levitation of the pad increases with increasing rotor speed due to the increased hydrodynamic pressure and forces. The rotor speed, after reaching 8 krpm, is decreased and the data are obtained again to check the repeatability of the tests. Pads 1 and 3 rendered nearly similar levitation magnitudes. Pad 2, which is located at the bottom, experienced the largest amount of levitation, as the hydrodynamic force and the gravitational force due to the pad’s mass act along the same direction. In contrast, pad 4, located opposite pad 2, has the smallest levitation due to the opposite direction of the hydrodynamic and weight forces.

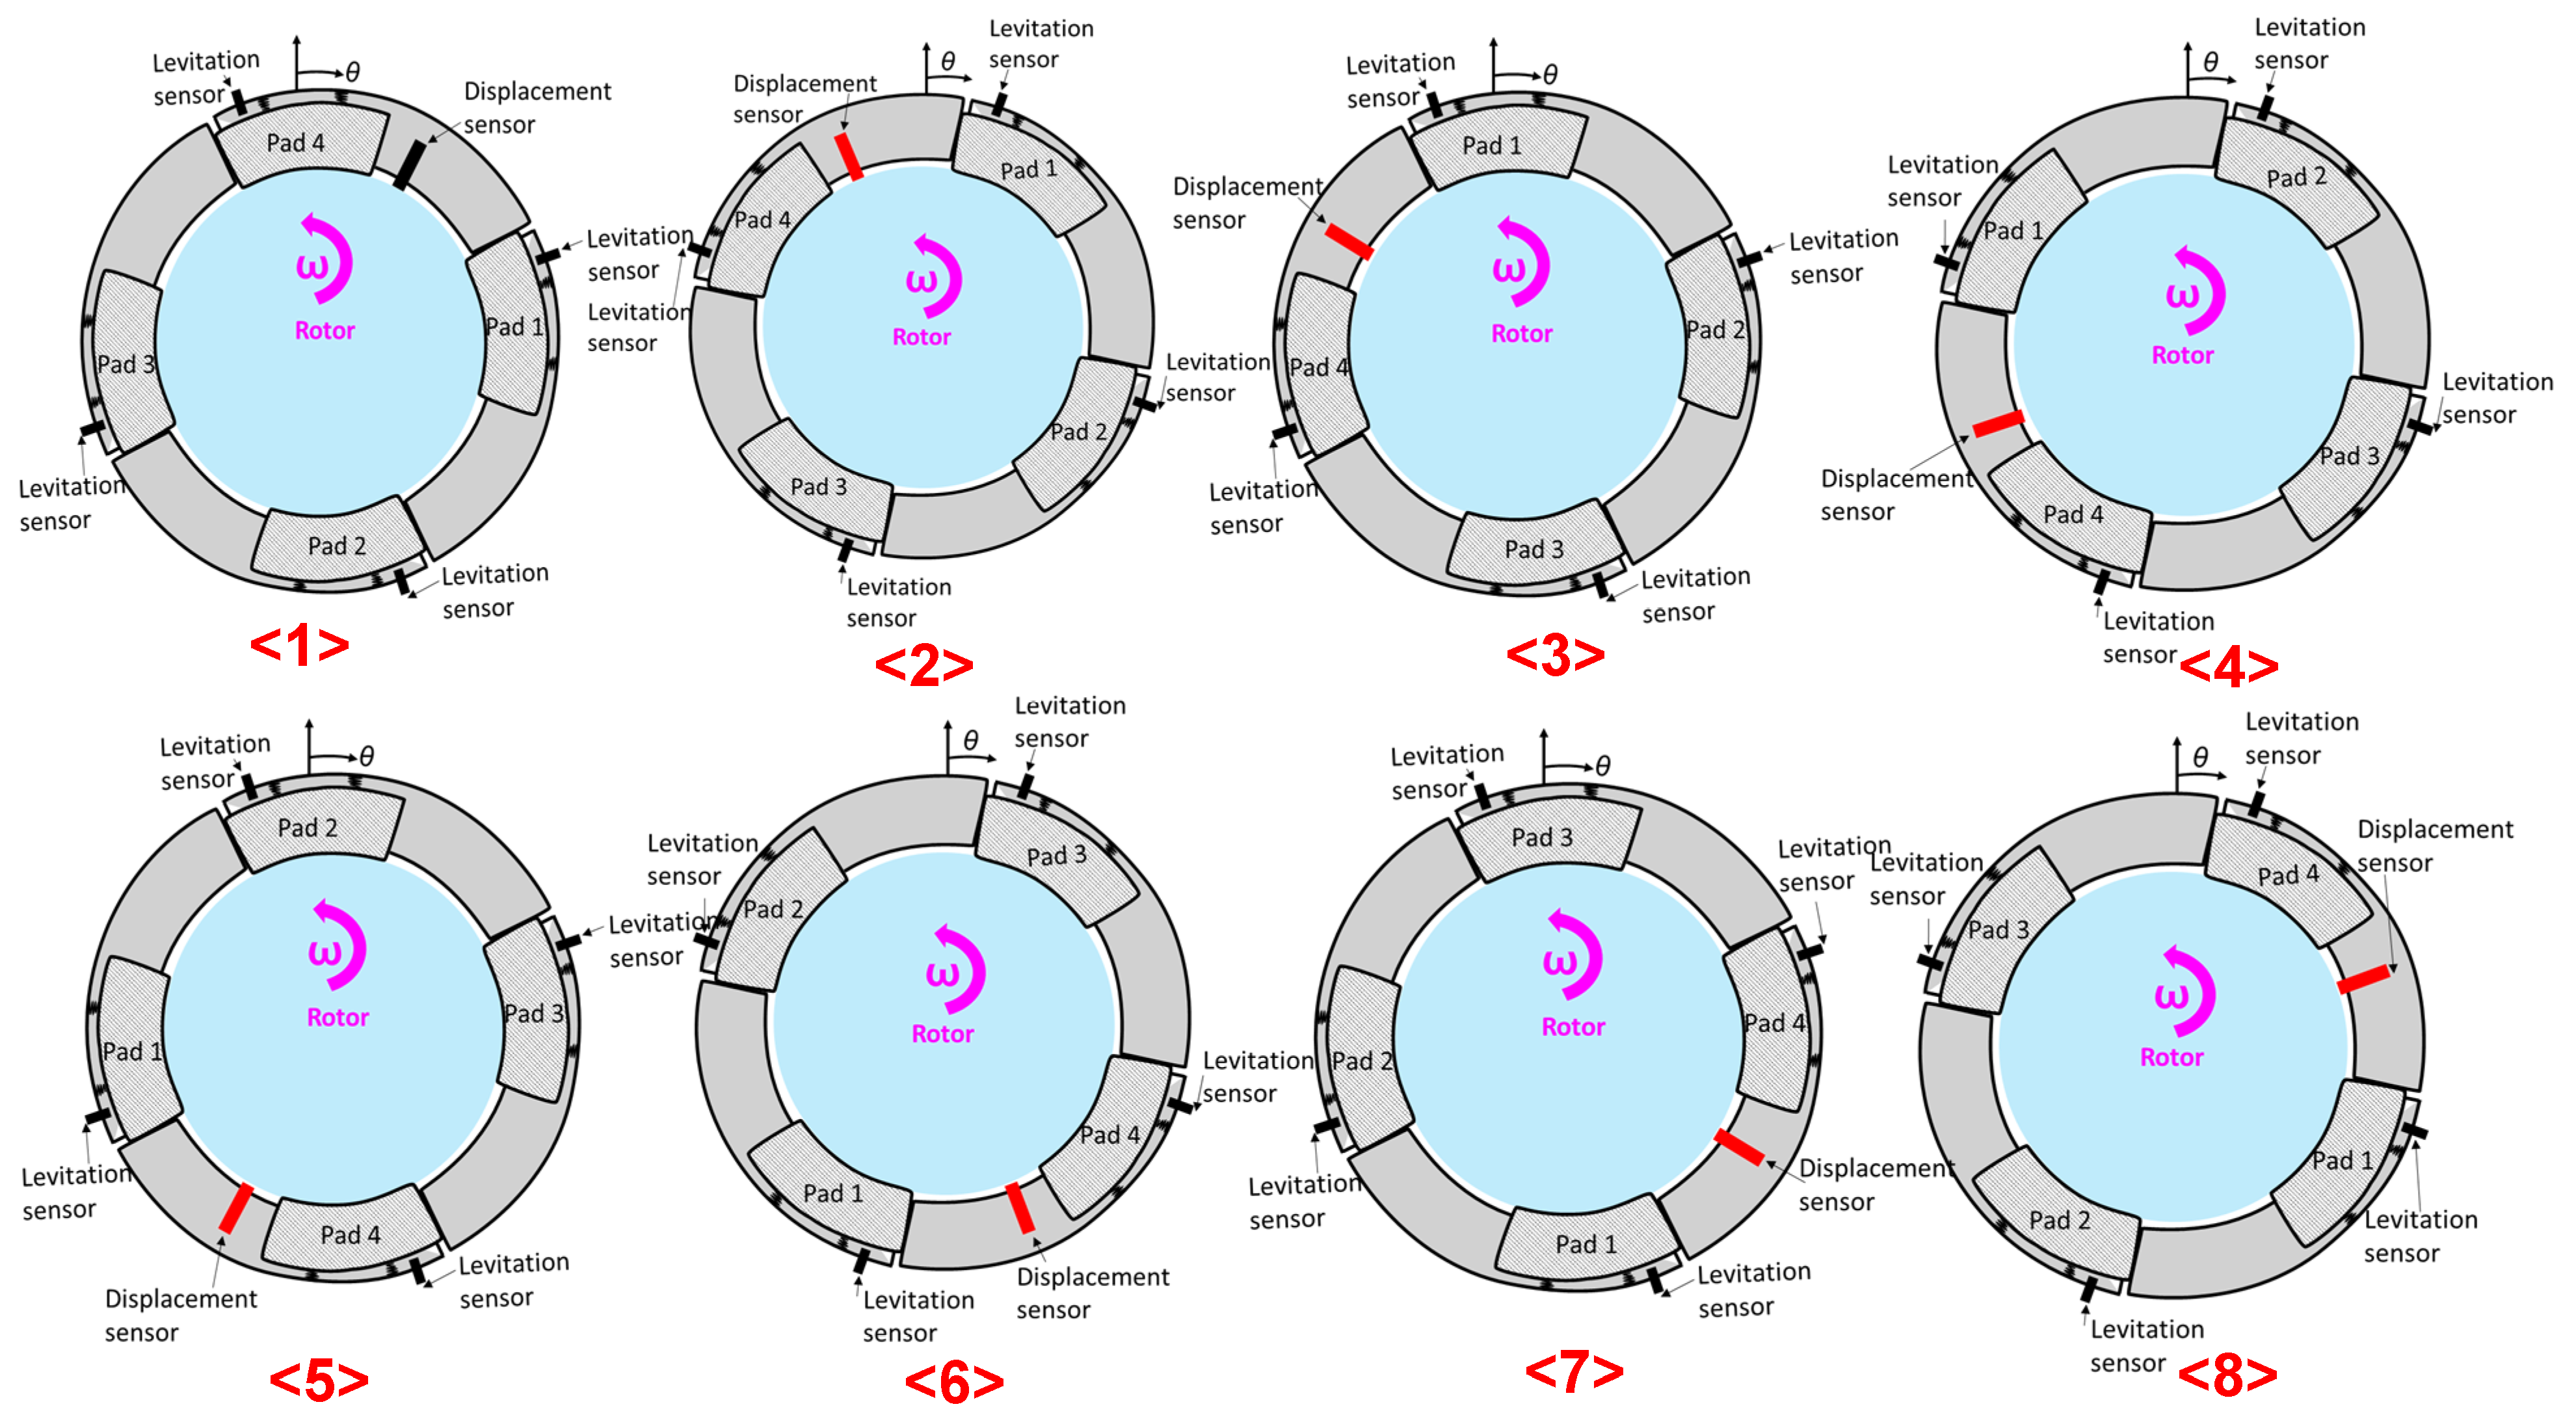
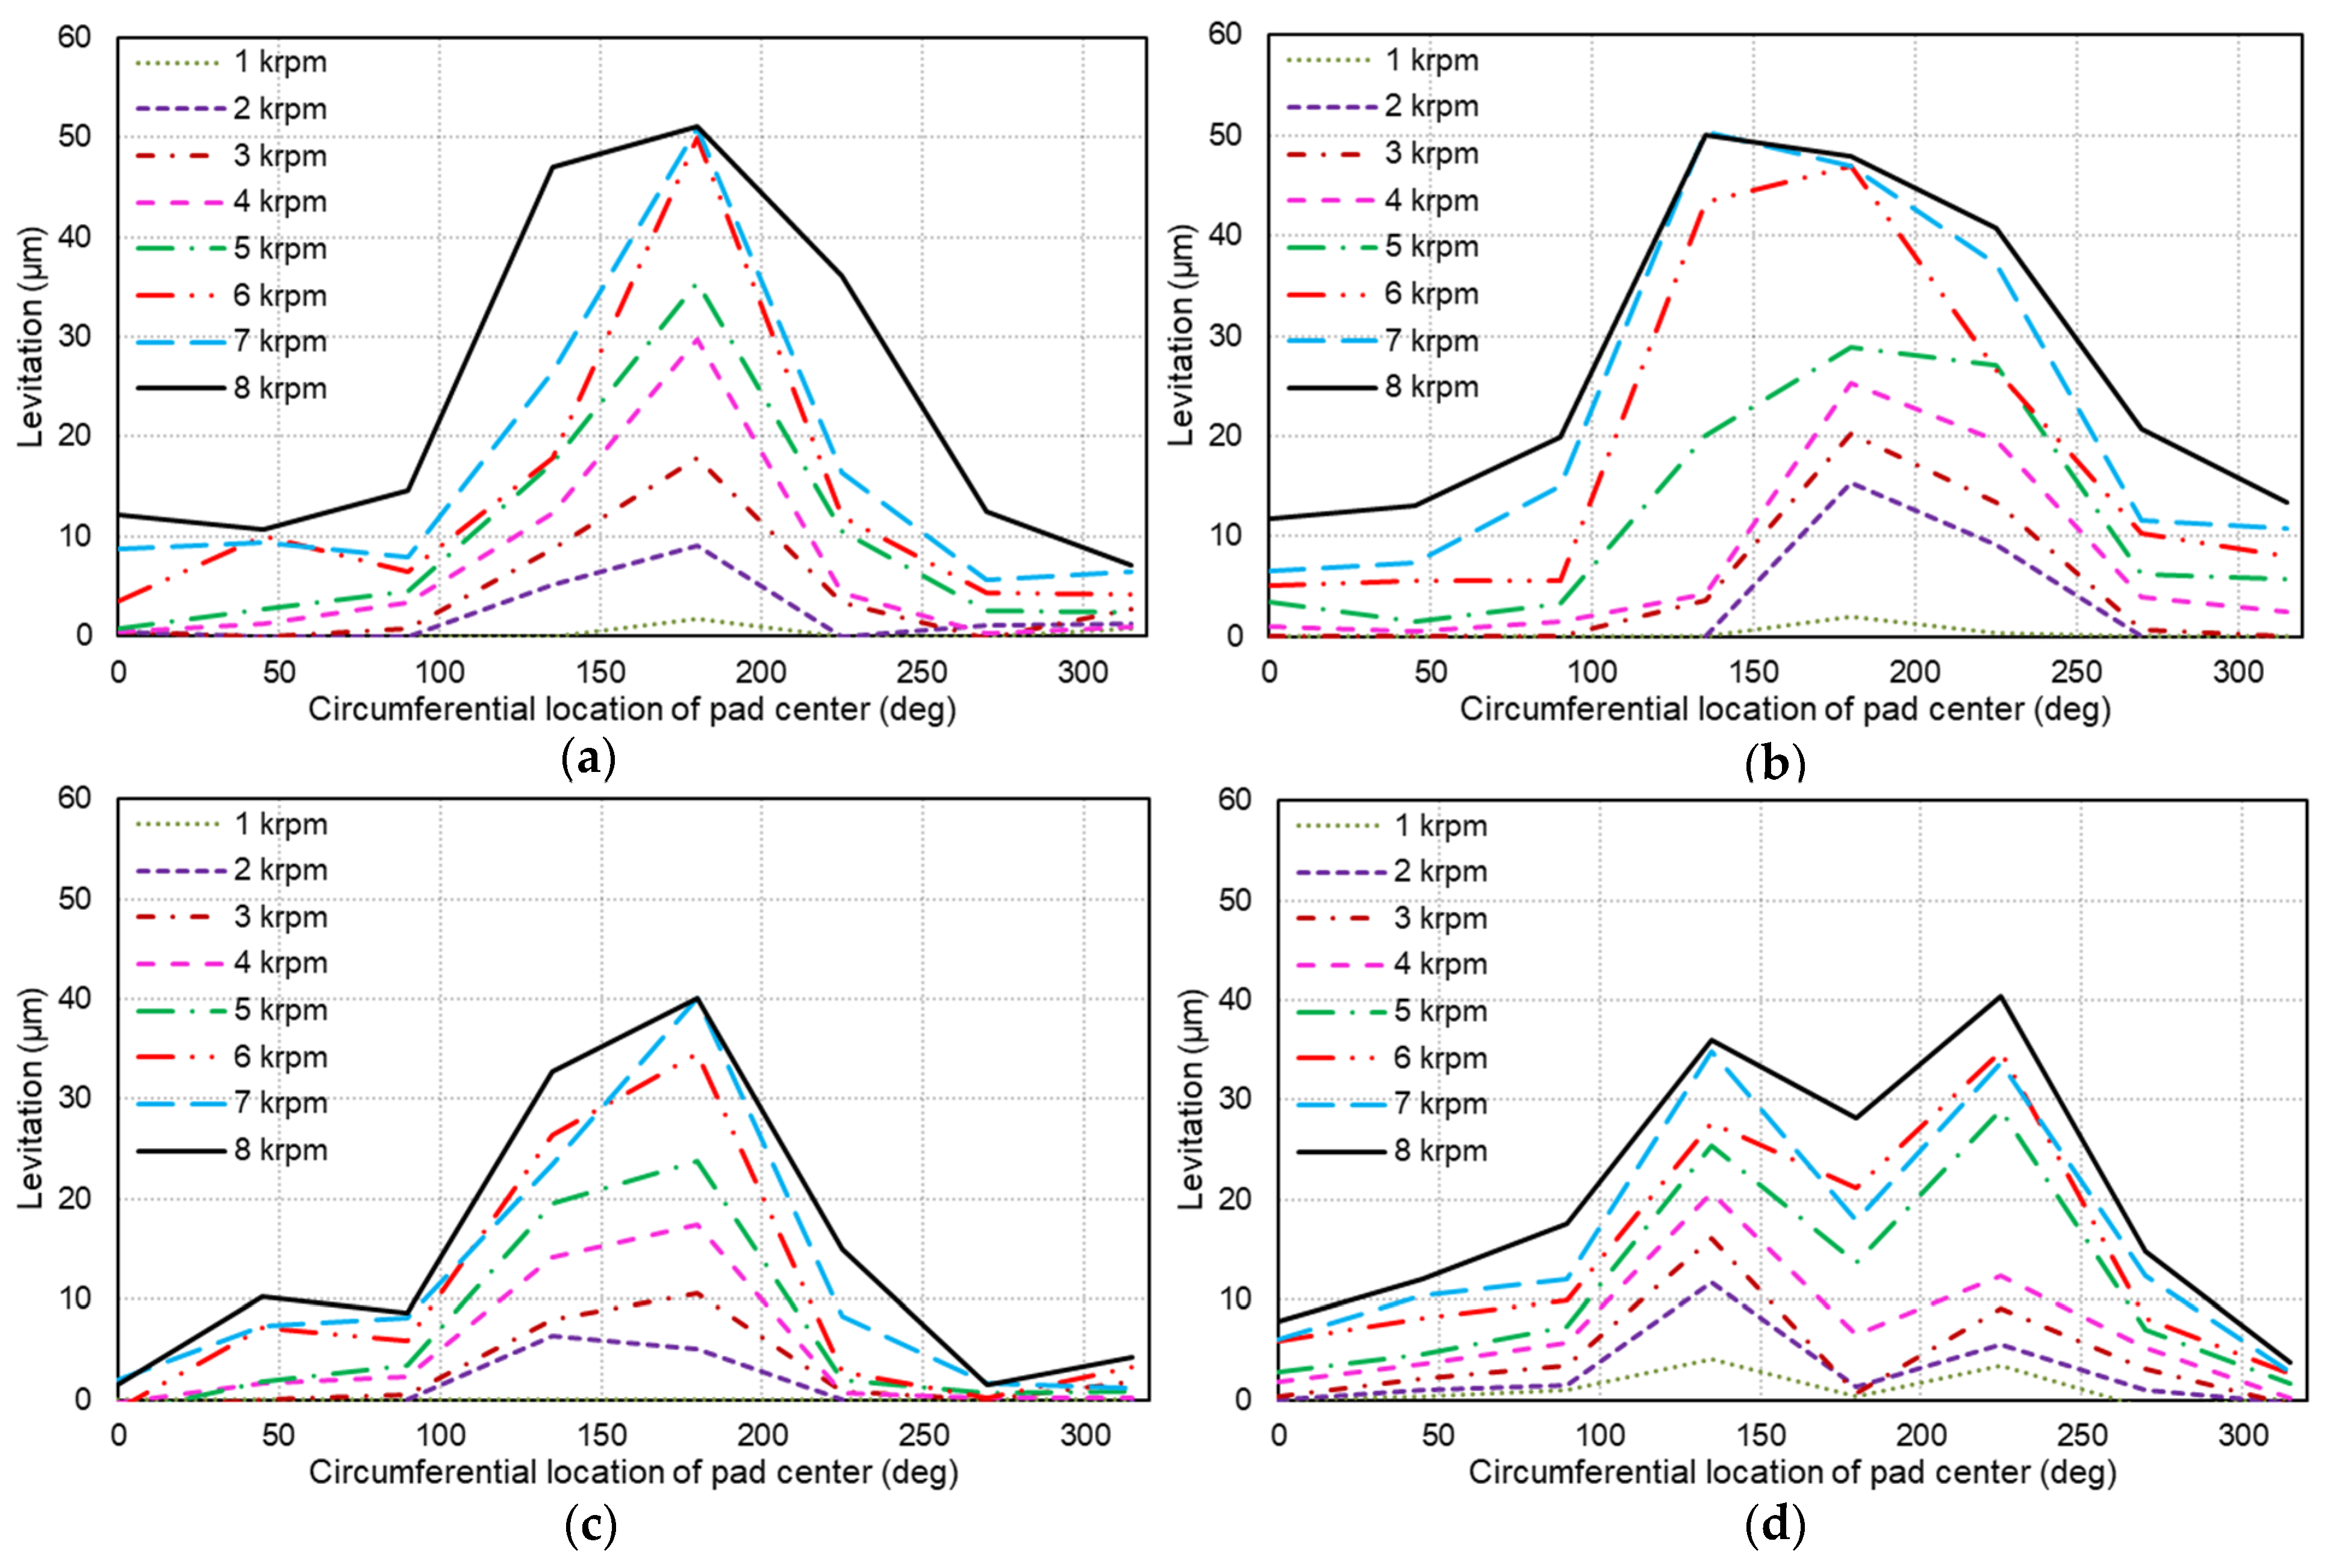
4.1. Pad Levitation vs. Circumferential Location

It can be observed from Figure 5 that the levitation of the seal pads or the consequent film thickness is a strong function of their circumferential locations. Therefore, a series of tests was performed to estimate the levitation of the pad at various circumferential locations. Figure 6 summarizes the configurations of the seal pads for the tests performed to investigate the circumferential location of the pads on their levitation performance. The measurements were taken at eight different configurations obtained by rotating the seal housing in the anticlockwise direction with an interval of 45° between 0° and 360°. Thus each pad levitation was measured with its center located at 0°, 45°, 90°, 135°, 180°, 225°, 270°, and 315°.
Figure 7 depicts the effects of the circumferential location of the seal pads on the levitation performance of (a) pad 1, (b) pad 2, (c) pad 3, and (d) pad 4 in terms of the DC level of the time signal. The DC level for all pads first increases until a certain rotor speed and then starts decreasing with further increases in the rotor speed. The rotor speed at which the DC level of each pad changes its behavior depends on the circumferential location of the pads. In addition, the DC level for all the seal pads drops the most when their location is between 135° and 225°, i.e., the bottom part of the seal housing, and vice versa for the locations of 0°, 45°, and 315°, i.e., the upper region of the housing.
Both Figure 5 and Figure 7 confirm that the DC level of the time signal (indicating levitation) of the seal pads follows a general trend against the varying rotor speeds, i.e., with increasing rotor speed, DC level increases at first, remains constant for some speeds, and then starts dropping with further increases is speed. Based on these results, the time signals associated with these particular trends were monitored and are given in Figure 8. During the first few rotor speeds, where the DC level of the time signal increases, the time signal mimics a sinusoidal curve along with the presence of some noise. For the next range of rotor speeds, where the DC level remains constant, the time signal loses its trough part, indicating the seal pads’ contact with the rotor. The time signal in the third range of the rotor speed shows a clear sinusoidal curve, indicating no contact between the rotor and the seal pad. With further increases in the rotor speed, huge noise can be observed in the time signal. The reason for the distorted time signal is due to the pad fluttering phenomena, which may occur due to the high rotor speeds in such machine elements [17].
Based on the behavior of the DC level and the time signals shown in Figure 8, the behavior of the seal pads can be divided into four phases as shown in Figure 9. A brief description of the four phases can be given as follows:
(1)
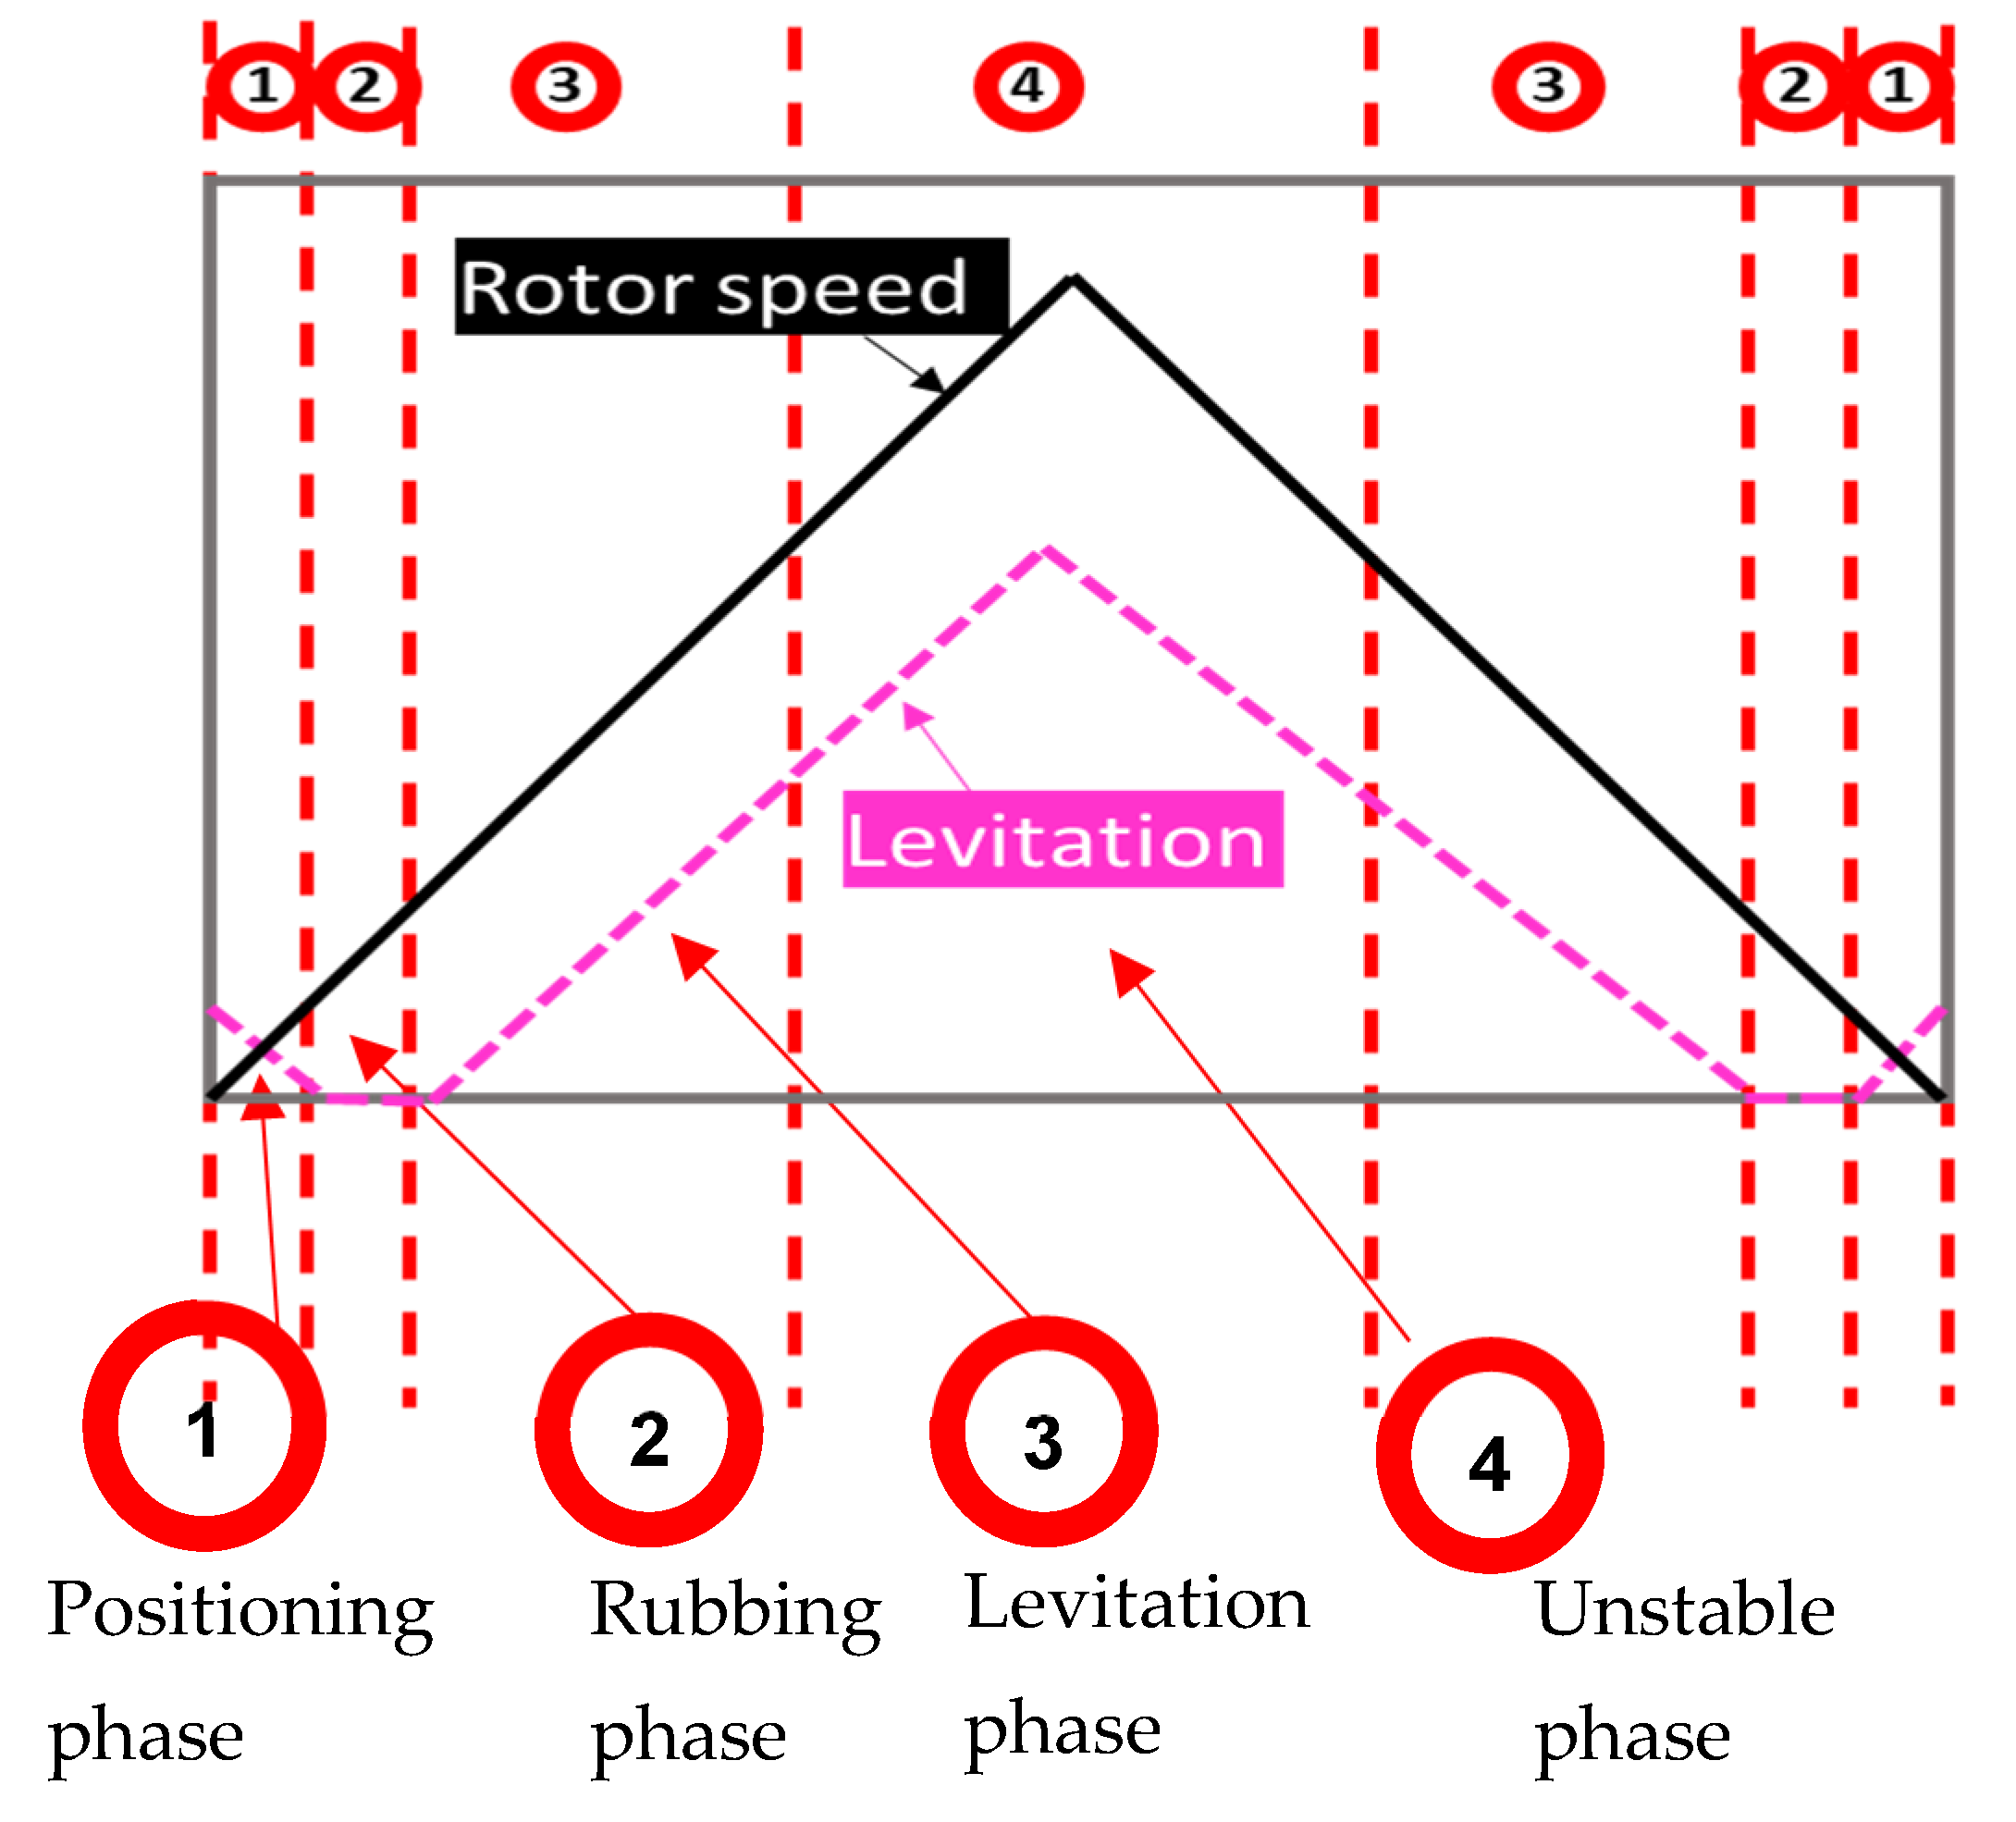
Positioning phase: A phase where the seal pad tries to find its position as, after assembling, the two springs at the back of the pad may become compressed or tensed or one of them may become compressed and the other tensed due to misalignment or any other reason. It thus takes time to adjust or find its original position where it should be in even contact with the rotor.
(2)
Rubbing phase: The seal pad’s displacement remains unchanged for a range of rotor speeds after it finds its real position, which is, in fact, even contact with the rotor disk. During this phase, the pad is in constant contact with the rotor as its displacement remains unchanged.
(3)
Levitation phase: FRS pads rub against the rotor disk until the pressure force becomes high enough to elevate the pad. True levitation starts at this point.
(4)
Unstable phase: With further increases in the rotor speed, a point comes where the time signal disrupts and noise can be observed, indicating the start of the unstable phase. The unstable phase lasts until the highest rotor speed. Although the time signal has noise, its DC level can still be observed, indicating pad levitation.
Note that the circumferential location of the seal pad significantly affects the onset and termination rotor speed of each phase, thus differing for each pad.
It can be observed from Figure 5, Figure 6, Figure 7, Figure 8 and Figure 9 that the actual levitation begins after the rotor speed reaches a certain value, which serves as a reference point for the calculation of the actual levitation. Note that the onset speed of the levitation differs for each pad. For instance, for the seal pads arranged as in configuration 1 in Figure 6, the onset speed of the levitation phase for pads 1, 2, 3, and 4 were, 3 krpm, 1 krpm, 4 krpm, and 3 krpm, respectively.
Figure 10 shows the magnitude of the levitation of (a) pad 1, (b) pad 2, (c) pad 3, and (d) pad 4 for increasing rotor speeds. Although the unstable phase has a distorted time signal, the levitation of the pad occurs in that region too and can be calculated by monitoring the DC level of the time signal from the gap sensors at the back of each pad. In general, the levitation increases with the circumferential angle of the pad’s center until it reaches its peak at 180°. It starts decreasing with further increases in the circumferential angle. The pads levitated the most due to the action of the gravitational (due to the mass of the pad) and levitation forces in the same direction when located in the bottom region of the seal housing, i.e., the circumferential angle range of 135°~225°. In contrast, the gravitational and levitation forces act opposite to each other when the seal pads are located in the upper region of the seal housing, i.e., the circumferential angles of the pad’s center equal 0°, 45°, and 315°, thus rendering the least levitation. Additionally, at the lowest rotor speed, i.e., 1 krpm, the pads only levitate when they are located in the lower region of the seal housing. Therefore, at the rotor speed of 1 krpm, levitation can be observed only when the angular positions of the centers of pads 1 and 2 are between 180° and 225°, and between 100° and 200° for pad 4. Pad 3 rendered nearly zero levitation, even when located in the bottom region of the seal housing.

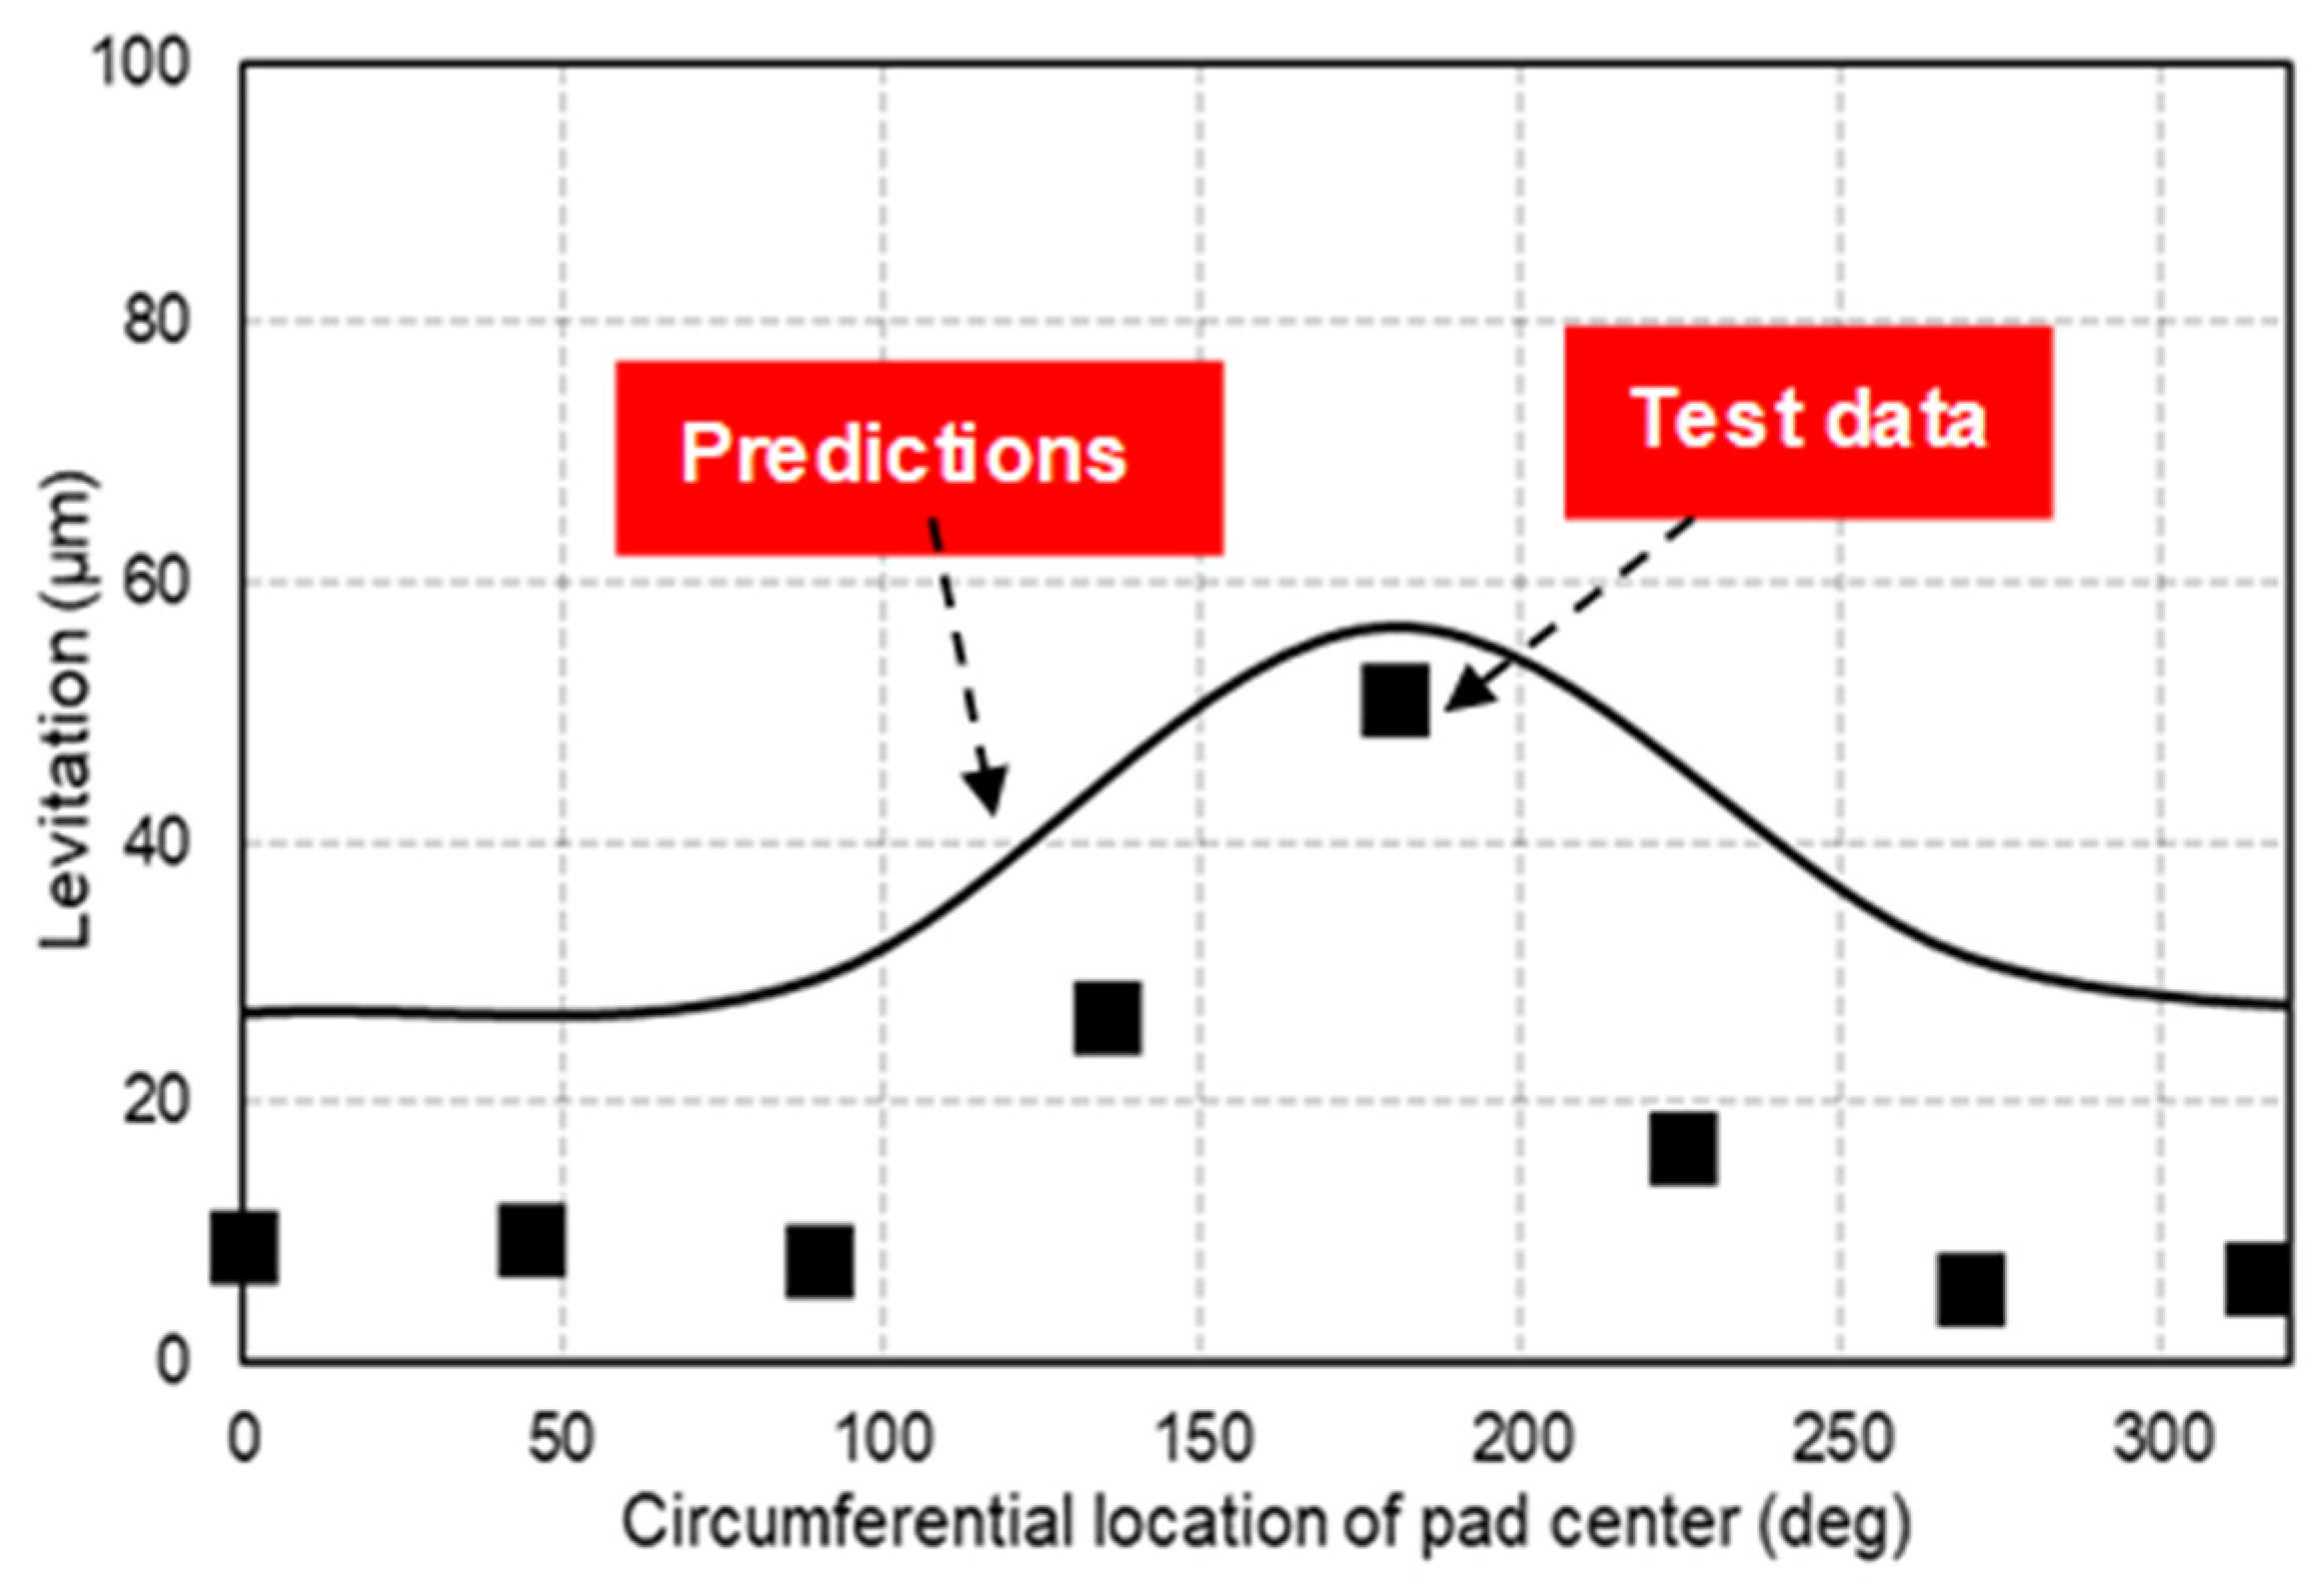
4.2. Test Data Compared with Theory

The experimental levitation of the pad is compared with theoretical model predictions. A Reynolds equation with isoviscous, isothermal, and ideal gas assumptions governs the pressure distribution on the surface of the seal pad.
x P h 3 P x + z P h 3 P z = 6 U μ P h x
where P, U, µ, x, and z are the pressure, journal surface speed, air viscosity, circumferential coordinate, and axial coordinate, respectively. h is the film thickness, which represents the clearance between the journal and the seal pad surfaces created as a result of the pad levitation. The atmospheric pressure at the edges of the seal pads is applied as the boundary condition shown in Figure 11.
The finite element method solves the Reynolds equation for the calculation of the pressure distribution which is integrated to give the hydrodynamic force acting on the surface of the seal pad. The hydrodynamic force pushing the seal pad in the radial direction is balanced with the spring force and the gravitational force due to the mass of the pad to calculate the film thickness. Figure 12 depicts the force balance of a single representative pad which has been deflected from its initial position, represented by the dotted lines, to a levitated position, represented by the solid lines.
For the theoretical model predictions, the geometries of the groove and the land areas of the seal pad were modeled according to the measured profile (using Surfcorder SE 3500 manufactured by Kosaka Lab, Tokyo, Japan) as shown in Figure 13. The height of the land and groove was been normalized by the former, whereas the circumferential length has been normalized by the summation of the groove and land lengths. One of the reasons for the fluctuations in the measured profile is the wear of the coating material over the seal surface due to the rotor’s rotation. Note that both the groove and the land heights have been averaged along the circumferential direction for a better extraction of the geometry data for the theoretical model.
Figure 14 compares the pad levitation plotted against the circumferential coordinate with the theoretical predictions at a rotor speed of 7 krpm. The theoretical predictions show a similar trend to those of the measurement data with the maximum levitation for the pads located at the bottom and vice versa for the pads located at the top. Additionally, the maximum levitation from theoretical predictions occurring at 180° differs by only 8% from the measured data. The discrepancies between theoretical and measured data, particularly for the pads located in the upper region, may be attributed to the manufacturing errors in the groove and land areas, as shown in Figure 13. Similarly, an advanced theoretical model which considers the real gas properties of the air will most likely bridge the gap between the two sets of data.

5. Conclusions

One of the core performance characteristics of the FRS is the film thickness between the rotor and the seal surfaces generated as a result of the seal pads’ levitation under the hydrodynamic forces. This study developed an experimental rig to estimate the levitation of the pads of the FRS. The experiments were performed at rotor speeds of up to 8 krpm. In addition, the study investigated the effects of the circumferential location of the seal pads inside the seal housing on their levitation performance. The following conclusions can be drawn from the investigations.
All of the seal pads followed a general trend with increasing rotor speeds and, along with the time signal, the behavior could be divided into four phases, namely the positioning phase, the rubbing phase, the levitation phase, and the unstable phase. The seal pad finds its original position during the initial speeds represented by the positioning phase. It rubs against the rotor surface and stops moving in the radial direction in the rubbing phase until a certain rotor speed and then starts moving radially opposite to the rotor with a clean time signal representing the levitation phase. The time signal becomes distorted at higher rotor speeds, indicating an unstable phase due to pad fluttering; however, the pad’s radial motion does not cease and increases with increasing rotor speed.
Seal pads rendered the highest levitation when their centers were located in the lower part of the seal housing and vice versa when they were located at the upper region. This behavior is attributed to the fact that, when located at the bottom side of the seal housing, the levitation and gravitational forces act along the same direction and vice versa in the upper region. Moreover, the Reynolds equation-based theoretical model predicted a maximum levitation in close agreement with the test data.

Author Contributions

Conceptualization, S.M.M. and Y.C.K.; methodology, S.M.M. and Y.C.K.; formal analysis, S.M.M. and Y.C.K.; investigation, S.M.M. and Y.C.K.; resources, Y.C.K.; data curation, S.M.M. and E.K.; writing—original draft preparation, S.M.M.; writing—review and editing, Y.C.K.; supervision, Y.C.K.; project administration, S.M.M., Y.C.K. and E.K.; funding acquisition, Y.C.K. All authors have read and agreed to the published version of the manuscript.

Funding

This research was funded by Korea Energy Technology Evaluation and Planning (KETEP) for the research project titled, “Localization of film riding type seal to improve the efficiency of the secondary air system for large gas turbines and technology development to strengthen supply chain capabilities” (grant no. 20224A10100010), and by the Korea Research Institute for defense Technology planning and advancement for the research project titled, “Design Technology of a Tailored Seal for Increasing Efficiency of Aviation Gas Turbines” (grant no. 21102E00006).

Data Availability Statement

The authors can provide the data presented in this paper on request via email.

Conflicts of Interest

Author Eojin Kim was employed by Strategy & Innovation Division, Doosan Enerbility. The remaining authors declare that the research was conducted in the absence of any commercial or financial relationships that could be construed as a potential conflict of interest.

References

  1. Black, H.F. Effects of Hydraulic Forces in Annular Pressure Seals on the Vibrations of Centrifugal Pump Rotors. J. Mech. Eng. Sci. 1969, 11, 206–213. [Google Scholar] [CrossRef]
  2. Tibos, S.M.; Teixeira, J.A.; Georgakis, C. Investigation of Effective Groove Types for a Film Riding Seal. J. Eng. Gas Turbines Power 2017, 139, 072503. [Google Scholar] [CrossRef]
  3. Chupp, R.E.; Hendricks, R.C.; Lattime, S.B.; Steinetz, B.M. Sealing in Turbomachinery. J. Propuls. Power 2006, 22, 313–349. [Google Scholar] [CrossRef]
  4. Munson, J.; Pecht, G. Development of Film Riding Face Seals for a Gas Turbine Engine. Tribol. Trans. 1992, 35, 65–70. [Google Scholar] [CrossRef]
  5. Andres, L.S.; Ashton, Z. Comparison of Leakage Performance in Three Types of Gas Annular Seals Operating at a High Temperature (300 °C). Tribol. Trans. 2010, 53, 463–471. [Google Scholar] [CrossRef]
  6. Lynwander, P. Development of Helicopter Engine Seals; NASA Lewis Research Center: Cleveland, OH, USA, 1973. [Google Scholar]
  7. Lynwander, P. Development of Self-Acting Seals for Helicopter Engines; NASA Lewis Research Center: Cleveland, OH, USA, 1975. [Google Scholar]
  8. John, H.M. Testing of a High Performance Compressor Discharge Seal. In Proceedings of the AIAA/SAE/ASME/ASEE 29th Joint Propulsion Conference and Exhibit, Monterey, CA, USA, 28–30 June 1993. [Google Scholar]
  9. Steinetz, B.M.; Hendricks, R.C.; Munson, J. Advanced Seal Technology Role in Meeting Next Generation. In Proceedings of the RTO AVT Symposium on “Design Principles and Methods for Aircraft Gas Turbine Engines”, Toulouse, France, 11–15 May 1998; pp. 1–13. [Google Scholar]
  10. Sayma, A.I.; Bréard, C.; Vahdati, M.; Imregun, M. Aeroelasticity Analysis of Air-Riding Seals for Aero-Engine Applications. J. Tribol. 2002, 124, 607–616. [Google Scholar] [CrossRef]
  11. Sedy, J. Improved Performance of Film-Riding Gas Seals through Enhancement of Hydrodynamic Effects. ASLE Trans. 1980, 23, 35–44. [Google Scholar] [CrossRef]
  12. Jung, J.W.; Hwang, S.H.; Kim, T.H.; Kim, E.; Ha, J.W. Leakage Measurements of Labyrinth Seal, Brush Seal, and Radial Film Riding Face Seal. KSFM J. Fluid Mach. 2023, 26, 29–37. [Google Scholar] [CrossRef]
  13. Guardino, C.; Chew, J.W.; Hills, N.J. Calculation of Surface Roughness Effects on Air-Riding Seals. In Proceedings of the ASME Turbo Expo 2002, Amsterdam, The Netherlands, 3–6 June 2002; Volume 126, pp. 75–82. [Google Scholar]
  14. Trivedi, D.; Bidkar, R.A.; Wolfe, C.; Zheng, X. Film-Stiffness Characterization for Supercritical CO2 Film-Riding Seals. Proc. ASME Turbo Expo 2018, 5B-2018, 1–10. [Google Scholar] [CrossRef]
  15. Bidkar, R.A.; Sevincer, E.; Wang, J.; Thatte, A.M.; Mann, A.; Peter, M.; Musgrove, G.; Allison, T.; Moore, J. Low-Leakage Shaft-End Seals for Utility-Scale Supercritical CO2 Turboexpanders. J. Eng. Gas Turbines Power 2017, 139, 022503. [Google Scholar] [CrossRef]
  16. Bidkar, R.A.; Kumar, U.; Trivedi, D.; Zhang, X.; Rambacher, C.; Rimpel, A.; Kerr, T.; Johnson, J. Development of Large-Diameter Hybrid Film-Riding Seals for sCO2 Turbines. Proc. ASME Turbo Expo 2024, 8, 1–11. [Google Scholar] [CrossRef]
  17. Yang, S.H.; Kim, C.; Lee, Y.B. Experimental Study on the Characteristics of Pad Fluttering in a Tilting Pad Journal Bearing. Tribol. Int. 2006, 39, 686–694. [Google Scholar] [CrossRef]
Figure 1. Schematic of the film riding face seal with spiral grooves and Rayleigh pad faces [11].
Lubricants 12 00433 g001
Figure 2. Schematic and nomenclated view of (a) FRS and (b) FRS segment (dimensions not to scale).
Lubricants 12 00433 g002
Figure 3. (a) Cross-sectional view of the test rig and (b) photograph of the test rig coupled with a motor.
Lubricants 12 00433 g003
Figure 4. Schematic of seal segment with the definition of DC level (dimensions not to scale).
Lubricants 12 00433 g004
Figure 5. DC level of time signal from displacement sensors vs. time for varying rotor speeds for (a) pad 1, (b) pad 2, (c) pad 3, and (d) pad 4.
Lubricants 12 00433 g005
Figure 6. Eight configurations of seal pads for estimating the effect of circumferential location on pad levitation.
Lubricants 12 00433 g006
Figure 7. DC level of time signal from displacement sensors vs. time for varying circumferential location of pads and rotor speeds for (a) pad 1, (b) pad 2, (c) pad 3, and (d) pad 4.
Lubricants 12 00433 g007
Figure 8. Time signal of the seal pad behavior in the (a) positioning phase, (b) rubbing phase, (c) levitation phase, and (d) unstable phase.
Lubricants 12 00433 g008
Figure 9. Depiction of seal pad behavior against varying rotor speed.
Lubricants 12 00433 g009
Figure 10. Levitation of (a) pad 1, (b) pad 2, (c) pad 3, and (d) pad 4 vs. circumferential location of pad center for varying rotor speeds.
Lubricants 12 00433 g010
Figure 11. Boundary conditions for the solution of Reynolds equation.
Lubricants 12 00433 g011
Figure 12. Depiction of force equilibrium in a seal pad.
Lubricants 12 00433 g012
Figure 13. Measured and theoretical profile of the seal pad groove and adjacent land.
Lubricants 12 00433 g013
Figure 14. Comparison between measured and predicted levitation vs. circumferential location of pad center. Rotor speed = 7 krpm.
Lubricants 12 00433 g014
Table 1. Geometry and operating conditions of the FRS.
Rotor Disk Diameter (mm)Seal Pad Diameter of Curvature (mm)Seal Pad Axial Length (mm)Groove Axial Length (mm)Groove Arc Length (mm)Rotor MaterialOperating ConditionsRotor Speed (krpm)
1401401310.41.22SteelRoom0–8
Disclaimer/Publisher’s Note: The statements, opinions and data contained in all publications are solely those of the individual author(s) and contributor(s) and not of MDPI and/or the editor(s). MDPI and/or the editor(s) disclaim responsibility for any injury to people or property resulting from any ideas, methods, instructions or products referred to in the content.

