Abstract
Lubricating greases enclose oil in porous structures of aggregated thickener particles. Their tendency to separate oil under static conditions is evaluated according to DIN 51817 or DIN ISO 22285 in tests of up to 168 h with the mass fraction of separated oil as result. With an analytical photo-centrifuge, separated oil mass fractions can be tracked in real time in the instrument operating temperature range from 4–60 °C. Due to the higher mechanical load compared to standard tests, the grease samples separate more and faster oil, significantly speeding up the analysis process. Fitting the measured data from both methods with the function wO = wO,∞ exp(−t/tc), the parameters maximum oil separation wO,∞ and characteristic time tc are obtained as measures of oil separation extent and rate. Both parameters help to compare the two methods and to interpret the oil separation characteristics of greases. Using four commercial greases of NLGI classes 0–2, the analytical photo-centrifuge measuring method is presented in detail and its results are discussed in reference to those of standard DIN 51817.
1. Introduction
Lubricating greases minimize friction between moving machine parts such as in motor vehicles, production machinery or wind turbines. Typical formulations are prepared with base oil, thickener, and additives. Alkaline or alkaline earth salts of fatty acids in the form of simple or complex metal soaps are still the most commonly used thickeners. They are not dissolved in base oils, but present there as semi-flexible thickener particles. The agglomeration of filamentous or spherical thickener particles, depending on the metal soap, leads to porous structures in greases in which oil is trapped (Figure 1) [1].
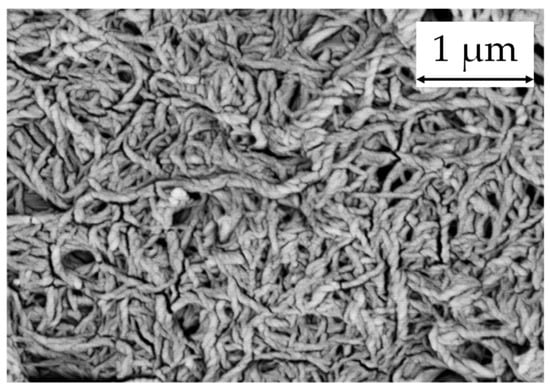
Figure 1.
A SEM image of a lubricating grease with 11% (w/w) Li-12-hydroxystearate in mineral oil reveals the porous structure of lubricating greases formed by the agglomeration of thickener particles [2].
The function of grease is to release oil when it is sheared or rolled under application conditions. Oil release from grease at the periphery of plain or roller bearings is the main mechanism for lubricating friction contacts [3]. If the oil release is insufficient, bearing damage will occur due to starvation [4,5].
Oil bleeding occurs not only during the application process, but also when greases are stored, e.g., in drums [6]. In such cases, bleeding results in greases with a high oil content in the upper part and greases with a low oil content in the lower part. It is difficult to achieve consistent lubrication quality when such inhomogeneous greases are supplied to the lubrication points of machinery or equipment via a central lubrication system. In order to avoid quality problems, standard tests according to DIN ISO 22285 [6] or DIN 51817 [7] are used to evaluate the oil release of greases under static conditions. These tests are carried out at temperatures between 40 °C and 120 °C and test times of 18 h (short-term test) or 168 h (long-term test). Test results are given as the mass fractions of oils separated from the greases.
In addition to these standard tests, in which a known quantity of grease is placed on a metal sieve and the amount of oil separated is collected and weighed, there are other test methods. These include methods where grease is placed on defined absorbent materials. The amount of oil released is either weighed [8,9] or determined optically [10,11] after a specified time. Typically, the focus of such studies is not on storage stability, but to investigate cause–effect relationships in the oil separation of greases as a function of their formulation [8,9,12] or grease ageing [10,11]. For this type of study, time-dependent measurements are a sound basis as they provide information on the ability and rate of oil separation. However, studies using the above methods are time consuming and labor intensive as the separated oil fractions have to be weighed or optically measured at regular intervals. Faster and less labor intensive are measurements with centrifuges using centrifuge tubes with sieves and oil collection caps. P. Baart et al. [13] and D. Goncalves et al. [14] have performed such measurements on a variety of NLGI 2 and 3 greases. Periodically stopping the centrifugation and weighing resulted in the evolution of the separated oil mass fraction over time. The results of such tests are often discussed on the basis of Darcy’s Law [10,11,13]. It describes the relationship between the pressure difference in a porous thickener structure and the velocity of oil flowing through that structure, which is directly proportional to the permeability of the porous thickener structure and indirectly proportional to the dynamic oil viscosity.
The effort and time required to obtain detailed information on the extent and rate of oil separation can be significantly reduced by using analytical photo centrifugation. Analytical photo-centrifuges have been used successfully for many years to determine the stability of emulsions and suspensions [15], the effectiveness of thickeners in dispersions [16], the consolidation of dispersions [17] or particle size distributions [18]. To our knowledge, measurements on lubricating greases have not yet been published. Using four commercial greases as examples, the paper presents a method of measuring oil separation using an analytical photo-centrifuge and discusses the results in comparison with DIN 51817 [7] to clarify whether this method reflects the oil separation tendency in the same way as DIN 51817 measurements.
2. Basic Principles of Oil Separation Measurements with an Analytical Centrifuge
The operating principle of an analytical photo-centrifuge is based on transmission measurements at constant time steps through flat, rectangular, transparent centrifuge cuvettes. Changes in the transparency of the sample are recorded with spatial and temporal resolution. They are output as a sequence of transmittance profiles [17] which provide information on the extent and rate of oil separation from grease samples under test conditions (temperature, rotor speed). Up to 12 samples can be tested simultaneously under identical conditions (temperature range: 4–60 °C; rotor speed range: 200 … 4000 rpm).
For oil separation measurements polyamide cuvettes with 10 mm optical path length are appropriate. The cuvettes can be filled with grease using syringes without creating bubbles or contaminating the optical windows. Uniform filling levels of cuvettes and smooth grease surfaces ensures reproducible measurements (Figure 2).
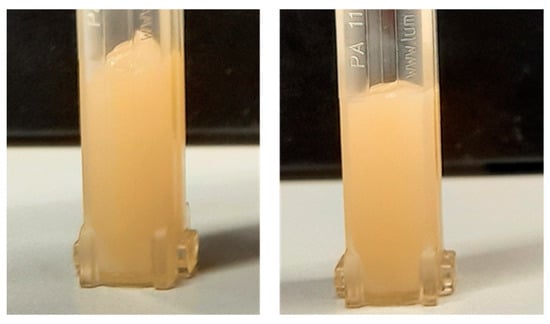
Figure 2.
Flat, rectangular polyamide cuvette with 10 mm optical path length, filled with grease. The grease surface is uneven after filling the cuvette (left). Gently tapping on a hard surface results in an almost even grease surface (right).
Figure 3 shows the changes in the transmission profiles during centrifugation of a cuvette filled with grease. Each transmission profile has its own time stamp so that the profiles can be tracked over time. In addition, the profiles are color coded, from red for the first profiles to green for the last profiles. This color coding helps to visually follow the separation process. During the separation process, the transmission increases at cuvette positions below the meniscus due to the transparent oil accumulating there, and the oil–grease interphase shifts towards the cuvette bottom.
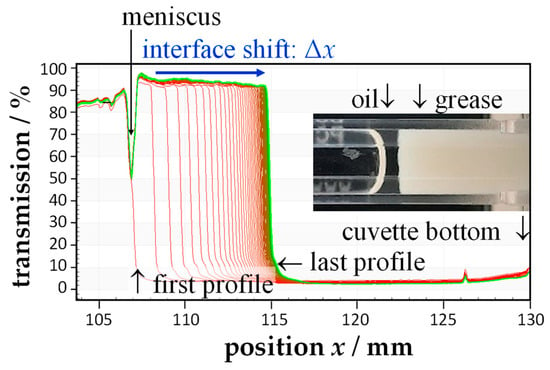
Figure 3.
Transmission profiles of a photo-centrifuge measurement tracking the oil separation of a lubricating grease. The transmission profiles are color coded; from red for the first profiles to green for the last profiles. The inset illustrates the accumulation of the separated oil on top of the grease. Inset and transmission profiles are from different sets of measurements.
Figure 4a schematically illustrates the oil–grease interphase shift during centrifugation. To calculate the mass fraction (wO) of separating oil, the position of the interphase (x) must be determined as a function of time for a fixed but selectable transmission threshold (front tracking). This results in a time curve of the interphase shift (Δx-t) as shown in Figure 4b (left).
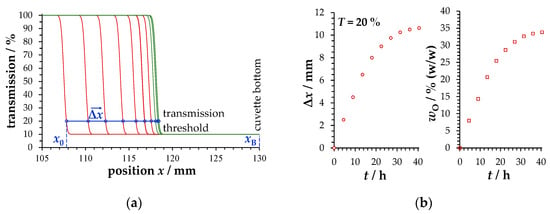
Figure 4.
(a) Schematic illustration of the transmission profiles of an oil-separating grease at constant time steps. The transmission profiles are color coded; from red for the first profiles to green for the last profiles. (b) Plotting the Δx-t data for the transmittance threshold of 20% gives the diagram on the (left) and the corresponding wO-t data gives the diagram on the (right).
The mass fraction () of separated oil (Figure 4b(right)) is a result of the volume () and density () of the separated oil relative to the grease initial weight (). The oil volume () in turn can be calculated using the interphase shift () and the ratio of interphase shift per volume (Δx/ΔV). The latter depends on both the cuvette type and the instrument. It will be referred to as the calibration constant b. Considering units of interphase shift (/mm), density of separated oil (/g cm−3), grease initial weight (/g) and calibration constant (b/mm cm−3) Equation (1) applies.
The change in density of the thickener-enriched grease accumulating at the bottom of the cuvettes can be calculated from the initial grease weight and the thickness of the grease zone (), which is converted into grease volume using the calibration constant b. Considering the units of interphase position (x/mm), respectively, the position of the cuvette bottom (/mm), grease initial weight (/g), calibration constant (b/mm cm−3) and oil density (/g cm−3), Equation (2) is valid.
3. Materials and Methods
3.1. Lubricating Greases
Product information for the commercial greases used in this publication is given in Table 1.

Table 1.
Product information on the lubricating greases K1–K4 regarding base oil type, kinematic viscosity of base oil () [19], density of grease (), dynamic viscosity of grease (), thickener type, cone penetration [20] and NLGI consistency number [21] taken from the corresponding technical data sheets. Abbreviations: sKW: synthetic hydrocarbons, MO: mineral oil.
The use of NLGI consistency numbers for lubricating greases is not very meaningful, as penetration values according to ISO 2137 [20] can only be assigned to nine NLGI consistency numbers [21]. Flow points based on rheological measurements in accordance with DIN 51810-2 [22] are a more meaningful basis for the assessment of the relative hardness of greases. A MCR301 rheometer from Anton Paar (Ostfildern-Scharnhausen, Nellingen, Germany) was used for the rheological measurements on greases K1–K4. They were carried out with a plate–plate measuring system (25 mm) at a gap distance of 1.00 mm and an angular frequency of 10 rad s−1 in oscillatory shear using shear stress-controlled amplitude sweep tests. Constant sample temperatures of 20 °C, 40 °C or 60 °C were maintained using Peltier temperature control units (P-PTD200 and H-PTD200). Figure 5a shows an example of an amplitude sweep test and Figure 5b shows the temperature dependence of the flow points of greases K1–K4.
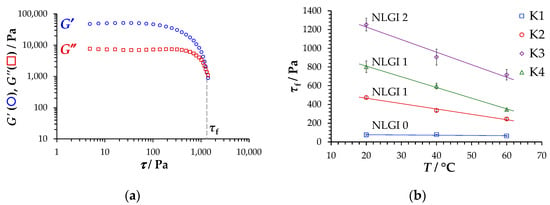
Figure 5.
(a) Amplitude sweep test with controlled shear stress according for the lubricating grease K3 (gap distance: 1.00 mm; temperature: 20 °C; angular frequency: 10 rad s−1; measurement geometry: PP25). (b) Flow points of the greases K1–K4 as a function of temperature. The mean values and the standard deviations of the triple measurements are shown (see Table A1).
3.2. Viscosities and Densities of Separated Oils
The viscosities of the separated oils were determined using an MCR 301 rheometer from Anton Paar (Ostfildern-Scharnhausen, Germany). Temperature-dependent rheological measurements were performed at a constant shear rate of 10 s−1 and a temperature heating and cooling rate of 1 K min−1 using a plate-cone measuring system (CP25) in steady shear. Peltier temperature control units were used for temperature control. Figure 6a shows the results.
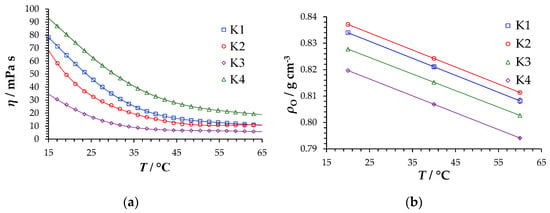
Figure 6.
Dynamic viscosities (a) and densities (b) of separated oils as a function of temperature. Mean values and standard deviations of fourfold density measurements are given in Table A2.
3.3. Oil Separation According to DIN51817 [7]
For the standard tests, approximately 30 g of greases K1–K4 were filled into cylindrical test cups with conical wire sieve bottoms. These were then placed in oil collecting receiver. Double tests were carried out at 40 °C and 60 °C using a 100 g additional weight. The separated oil quantities were collected after 24, 48, 72, 96 and 168 h, weighed and related to the initial grease weights , resulting in mass fractions of the separated oils /% (w/w). Please note that the short-term tests were carried out over 24 h, not 18 h as required by the DIN ISO 22285 and DIN 51817 standards.
3.4. Analytical Photo-Centrifuge Oil Separation
Triple oil separation measurements of the lubricating greases K1–K4 were carried out with the analytical photo-centrifuge LUMiSizer® from LUM GmbH (Berlin, Germany) for 42 h at a constant centrifugal speed of 4000 rpm and at temperatures of 20 °C, 40 °C and 60 °C. Polyamide cuvettes 10 mm long were filled bubble-free with syringes to cuvette positions in the range of 106 … 107 mm (Figure 3), corresponding to a mass of approximately 1.5 g. Since oil separation refers to the grease mass, all cuvettes were weighed before and after filling. The time interval between transmission measurements was 150 s and the transmission threshold for front tracking was 13%.
3.5. Calibration Constant b
The calibration constant b (Equation (1)) was determined experimentally by filling 10 mm cuvettes with different volumes of water and identifying the respective meniscus positions at 4000 rpm (Figure 3). By plotting these against corresponding volumes V, the calibration constant b was obtained as the slope of the best fit straight line (Figure 7a, b = −13.961 mm cm−3). Intercepts and slopes are constant in the temperature range of 20–60 °C (Figure 7b). The deviations from mean values were less than 0.04%.
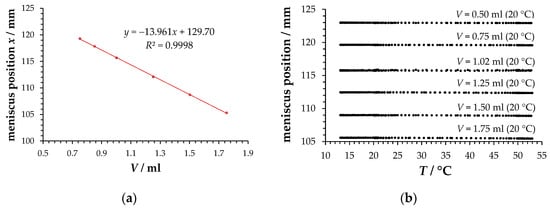
Figure 7.
(a) Correlation between meniscus position x and volume V (water/25 °C/4000 rpm). Mean values and standard deviations from quadruplicate measurements are shown. (b) Temperature dependence of the meniscus position determined using temperature ramps with heating and cooling rates of +1.8 and −0.9 K min−1. Mean values and deviations from duplicate determinations are shown.
4. Results and Discussions
4.1. Oil Separation According to DIN 51817 [7]
Figure 8 presents mass fractions of separated oil of the lubricating greases K1–K4 at 40 °C and 60 °C.
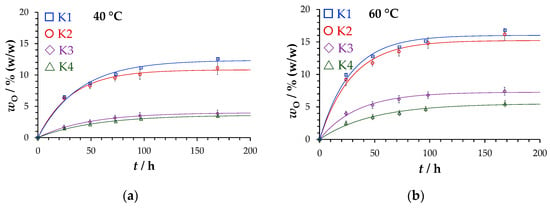
Figure 8.
Oil separation mass fractions () of greases K1–K4 according to DIN 51817 [7] at 40 °C (a) and 60 °C (b) after 24, 48, 72, 96 and 168 h. The fit function (Equation (5)), the mean values and the minimum and maximum values of the duplicate measurements are presented.
The differential Equation (4) describes the time dependence of oil separation processes in such a way that the oil separation rate is indirectly proportional to a characteristic time tc and directly proportional to the quantity of oil still to be separated (). Its integration gives Equation (5), where is the mass fraction of the separated oil, is the maximum oil separation, tc is the characteristic time and t is the test time.
Equations (4) and (5), respectively, include two parameters: maximum oil separation and characteristic time tc. The first parameter maximum oil separation is a limit value only valid for the applied measurement time, mechanical load and temperature. The second parameter corresponds to the time needed to reach 63.2% of the maximum oil separation . The characteristic time tc is an inverse rate constant, i.e., the smaller it is, the faster oil separates. Both parameters can be used to benchmark oil release properties of tested greases.
Table 2 gives an overview of both the parameters maximum oil separation and characteristic time tc. The maximum oil separation of the greases K1 and K2, respectively, are similar to K3 and K4. This is noteworthy because they are each thickened differently with Li- and Ca-soaps and differ significantly in their NLGI classes (Table 1) or flow points (Figure 5). The characteristic time tc of all lubricating greases decreases with rising temperature.

Table 2.
Overview of the mean values (triple measurements) of the parameters maximum oil separation () and characteristic time (tc). Both parameters were obtained by fitting oil separation data (-t) according to DIN 51817 [7] (Figure 8) using Equation (5).
4.2. Analytical Centrifuge Oil Separation
Figure 9 illustrates for the lubricating grease K1 the relationship between interphase shift Δx (Figure 9a) and the mass fraction of separated oil (Figure 9b) and grease density (Figure 9c). The mass fraction of separated oil is obtained by converting the data in Figure 9a with Equation (1) and the grease density by converting the data in Figure 9a with Equation (2).
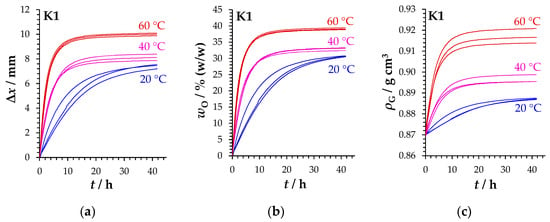
Figure 9.
Interphase shift Δx (a), mass fraction of separated oil (b) and density of thickener-enriched grease (c) versus time for grease K1 at 20 °C, 40 °C and 60 °C.
To verify the conversion of transmission profiles into mass fractions of separated oil, the quantities of oil separated after 42 h were carefully withdrawn with a syringe and the cuvettes reweighed. The comparison of the mass fractions calculated from transmission profiles () with those from the reweighing of the cuvettes () after withdrawing the free oil in a parity diagram (Figure 10a) reveals a significant correlation. The values obtained from the transmission profiles are on average 3.5% higher because the separated oil cannot be completely removed from the cuvettes with a syringe.
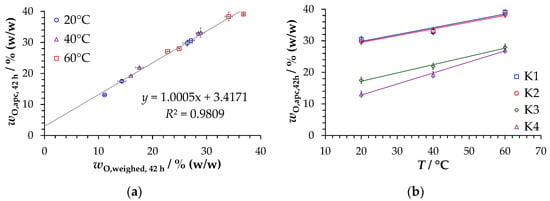
Figure 10.
(a) In a parity diagram, the oil separation values calculated from transmission profiles (wO,apc,42h) are plotted against the oil separation values determined by backweighing the aspirated cuvettes (wO,apc,42h). (b) Mass fractions of separated oil from transmission profiles (wO,apc,42h) versus temperature. Mean values and standard deviations of three measurements are shown.
Figure 10b illustrates the increasing oil separation after 42 h with increasing temperature. Just as in the tests according to DIN 51817, the oil separation quantities of the lubricating greases K1 and K2 or K3 and K4 are comparably high.
Fitting the 36 -t data sets (three measurements per temperature and per grease) using Equation (5) results in coefficients of determination R2 between 0.9958 and 0.9998. Figure 11a shows a comparison of fit functions (green) and measured curves for grease K1 as an example. In a parity plot (Figure 11b) the mass fractions of the separated oil () obtained from the fit functions for a test time of 42 h are plotted against the corresponding values from the transmission profiles (). The deviations of the data points from the correlation line are less than ±2%, confirming that Equation (5) adequately describes the -t measurement data.
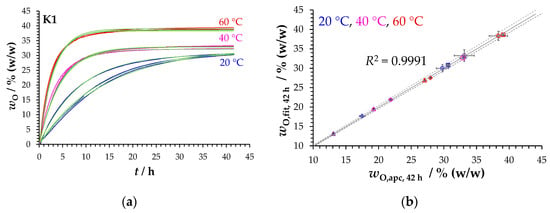
Figure 11.
(a) The fit functions (green/Equation (5)) and the corresponding measurement curves. (b) Plot of the mass fractions of the separated oil from fit functions (wO,fit,42h) against those from transmission profiles (wO,apc,42h). Mean values and standard deviations of triplicate measurements are presented. The dashed lines indicate a tolerance of ±2%.
Due to the match between measured and fitted curves, the parameters maximum oil separation and characteristic time tc can be used analyzing time profiles of oil separation (Figure 12).
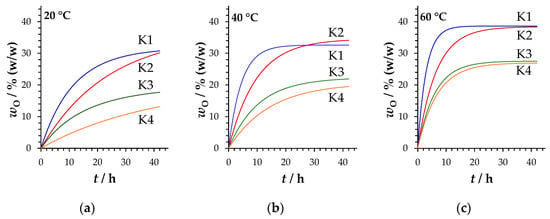
Figure 12.
The time profiles of the oil separations of greases K1–K4 calculated with the fitting parameters maximum oil separation and characteristic time tc (Table 3) for measurements at 20 °C (a), 40 °C (b) and 60 °C (c).
Table 3 presents the fitting parameters maximum oil separation and characteristic time tc versus temperature. Consistent with the DIN 51817 results (Table 2), the maximum oil separation rates of the lubricating greases K1 and K2 or K3 and K4 are similar, although they differ with respect to their thickener systems (Table 1) and flow points (Figure 5b). Moreover, in accordance with the results of DIN 51817, the oil separation rates increase or characteristic times tc decrease as the temperature increases.

Table 3.
Overview of the averaged fitting parameters maximum oil separation and characteristic time τ, which were obtained by fitting oil separation data, determined at 20 °C, 40 °C and 60 °C in the analytical photo-centrifuge (triple determination) for the lubricating greases K1–K4.
4.3. Method Comparison: Analytical Centrifuge versus DIN 51817 [7]
Figure 13 shows the mass fractions of the separated oil after 168 h according to DIN 51817 [7] (Figure 13a) and after 42 h in the analytical centrifuge (Figure 13b), respectively, compared to the corresponding flow points of the greases.
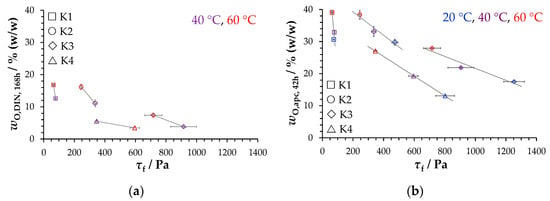
Figure 13.
Mass fractions of the separated oil according to DIN 51817 [7] after 168 h (a) and determined with an analytical photo-centrifuge after 42 h (b) of the lubricating greases K1–K4 plotted versus the corresponding flow points . Presented are mean values and standard deviations of triple () or double measurements ().
The results of both methods in Figure 13 clearly show higher mass fractions of separated oil at low flow points and lower mass fractions at high flow points. As the temperature increases, the greases become softer and their flow point decreases, respectively. As a result, the fraction of separated oil increases. To interpret these results the idea of a sponge-like structure of agglomerated thickener particles in which oil is embedded helps. The easier the sponge-like structure can be compressed by external forces and/or compacted by attractive particle–particle interactions, the more oil will be separated. This basic finding is understandable, even if no information is available on the physical factors that determine such temperature-dependent compression processes. Such kind of grease-specific physical factors include the volume concentration and structure of thickener particles and the structure of thickener particle network. The lack of information prevents the establishment of a correlation function of oil separation quantity versus flow point that is valid for the tested lubricating greases K1–K4 and both measurement methods.
When greases are loaded in a test apparatus according to DIN 51817 [7] with 100 g additional weight, they are exposed to a pressure of approximately 660 Pa [6]. In the analytical photo-centrifuge, at a rotational speed of 4000 rpm, the relative centrifugal acceleration (RCA) is 1878 times the acceleration of gravity at the level of 105 mm and 2325 times the acceleration of gravity at the bottom of the cuvette (position 130 mm). The resulting pressure difference of approximately 4 × 10⁵ Pa within grease samples is the reason why oil separation in an analytical centrifuge is faster and the amount of separated oil is larger. A comparison of the test times for identical separated oil mass fractions of both methods at 40 °C and 60 °C, listed in Table 4, reveals that the use of an analytical centrifuge reduces the test times from 24 h to less than 2.5 h and from 168 h to less than 4 h, respectively.

Table 4.
List of test times (tapc) required for greases K1–K4 to achieve identical oil separation quantities at 40 °C or 60 °C with an analytical photo-centrifuge (tapc) as according to DIN 51817 [7] after 24 h (), respectively, 168 h (). Presented are mean values (tapc) of triple measurements.
Figure 14a shows the ratio of the test times of the two methods (tapc, tDIN) for the same oil separation quantities () for the lubricant grease K1 as an example. The ratio of these times gives an acceleration factor AF (Equation (6)). In Figure 14b, no single acceleration factor AF can be identified for all greases and temperatures. Unsurprisingly, acceleration factor AF depends on both grease formulation and temperature.
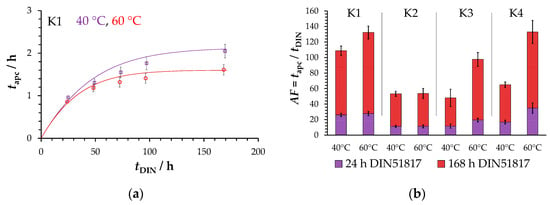
Figure 14.
(a) For the measuring times (tDIN) used in DIN 51817 [7] the test times (tapc) required for photo-centrifuge measurements are plotted on the y-axis for identical oil separations. (b) Chart of the acceleration factors AF for the greases K1–K4 at 40 °C and 60 °C. Mean values and standard deviations of triple measurements are presented.
Both measurement methods can be compared not only in terms of mass fractions of separated oil (Figure 13) and acceleration factors AF (Figure 14), respectively, but also in terms of the fit parameters maximum oil separation and characteristic time tc. Figure 15 gives an overview by plotting the maximum oil separation against temperature and the characteristic time tc in a logarithmic scale against inverse temperature. The characteristic time tc is plotted in this way because, according to its meaning, it is an inverse rate constant, for which the Arrhenius Equation (7) should apply, where T is the absolute temperature, R is the gas constant, A is the pre-exponential factor and Ea is the activation energy.
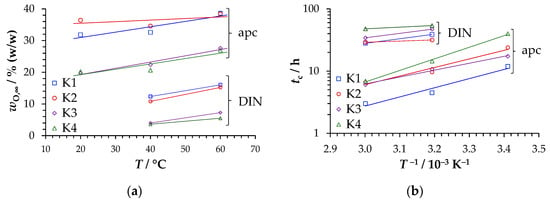
Figure 15.
Plots of the fit parameters maximum oil separation as a function of temperature (a) and characteristic time tc as a function of inverse temperature (b) for the DIN 51817 data [7] (DIN) and for the analytical centrifuge data (apc).
The parity plots in Figure 16 for maximum oil separation (Figure 16a) as well as characteristic time tc (Figure 16b) do not reveal simple correlations between the parameters of the two methods, valid for the greases and temperatures tested.
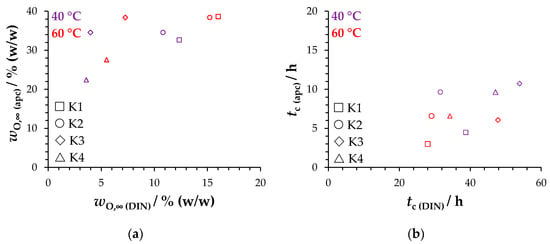
Figure 16.
Parity plots of the parameters maximum oil separation (a) and characteristic time tc (b) obtained from analytical photo-centrifuge (apc) data versus those obtained from DIN 51817 [7] data for the greases K1–K4 at 40 °C and 60 °C.
For the parameter maximum oil separation , regardless of the measurement method used, the following ranking applies: K1 ≈ K2 > K3 ≈ K4. As mentioned above, this is remarkable because K1 and K2, and K3 and K4, respectively, are differently thickened with Li- and Ca-soaps. They also differ significantly in their flow points (Figure 5). Using the idea of sponge-like thickening structures, the structures of the lubricating greases K1 and K2 can be compressed more than those of K3 and K4.
The order in which the characteristic time tc decreases correlates less with the order of viscosities or densities of the deposited oils (Figure 17a,b) than with the flow point of the greases (Figure 17c). Again, sticking to the idea of a sponge structure here as well, it seems that it is not the oil property but the deformability of the porous thickener particle structure under mechanical load that is decisive for the oil separation rate.
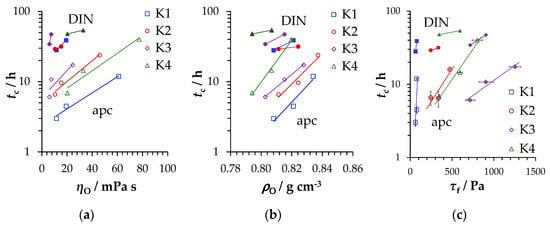
Figure 17.
Plots of the parameter characteristic time tc versus viscosity (a) and density (b) of separated oils or flow point (c) of greases obtained from analytical photo-centrifuge− (open symbols) and DIN 51817 (closed symbols) measurements for the greases K1–K4 at 20 °C (analytical photo-centrifuge measurements only), 40 °C and 60 °C.
5. Conclusions
The oil release capacity of lubricating greases under static conditions is usually evaluated according to DIN 51817 [7] in the temperature range 40 °C–120 °C. The standard method provides values for the mass fraction of oil separated after 18 h (short-term test) or after 168 h (long-term test). Analytical photo-centrifuges significantly shorten oil separation measurements in the instrument operating temperature range of 4 °C–60 °C. Using a high rotor speed of 4000 rpm, the relative centrifugal acceleration (RCA) is 1878 times the acceleration due to gravity at the cuvette position of 105 mm and 2325 times the acceleration due to gravity at the bottom of the cuvette (position 130 mm). The resulting pressures of 1878 bar and 2325 bar respectively lead to at least 10 times faster tests for 10 mm cuvettes in order to obtain identical mass fractions of separated oil. Although it is not yet possible to convert the oil separation values obtained with the analytical centrifuge into values according to DIN 51817 [7], the order of the greases tested in terms of oil separation is identical for both test methods.
An advantage of measurements using an analytical centrifuge does not only provide the significantly shorter test times, but also enables continuous recording of the separating oil fractions with a high number of recorded data. This makes it possible to analyse the separation properties of greases for the test conditions used. The time course of the oil separations can be fitted with an equation of the type wO = wO,∞ (1 − exp(−t/tc)). This differential equation describes the oil separation rate as indirectly proportional to a characteristic time tc and directly proportional to the mass fraction of the oil remaining to be separated (-). Fitting the oil separation data of the greases gives the parameters maximum oil separation and characteristic time tc. Both parameters can be used to benchmark oil release properties of greases. For the greases tested in this publication, the maximum oil separation increases and the characteristic time tc decreases with rising temperature (20–60 °C). Both parameters exhibit a weaker correlation with the properties of separated oils, such as viscosity or density, than with the flow point of the greases. Based on the idea that thickener particles form sponge-like structures, it appears that the deformability of the porous thickener structure, rather than the nature of the embedded oil, is the determining factor in the extent and rate of oil separation under static conditions. Further discussion, including of Darcy’s Law or thickener type or thickener concentration, is not useful here as detailed information on the formulations of the greases tested is not available.
Measurements with an analytical photo-centrifuge allow detailed investigations of oil separation extent and rate of lubricating greases under static conditions as a function of temperature (4 °C … 60 °C), load (200 … 4000 rpm), oil viscosity and thickener type and thickener concentration, respectively. Measurements on model greases with known formulations could thus provide a solid basis for future discussions on cause–effect relationships for oil separation of greases as a function of their formulation.
Funding
This research received no external funding.
Data Availability Statement
Not applicable.
Acknowledgments
Thanks go to S. Büttner. She carried out all the measurements presented here as part of her Master’s thesis “Determination of the oil release capacity of lubricating greases using an analytical centrifuge” at the Georg Simon Ohm University of Applied Sciences Nuremberg, Faculty of Applied Chemistry. Thanks also go to S. Dreyer and P. Weidinger of Brose Fahrzeugteile SE & Co. Kommanditgesellschaft, Coburg, for constructive discussions on the oil release behavior of lubricating greases.
Conflicts of Interest
The author declares no conflict of interest.
Appendix A

Table A1.
Mean values and standard deviations of the flow points of the lubricating greases K1–K4 determined in shear stress amplitude sweep test with controlled shear stress according to DIN 51818-2 [21] (triple measurements at ω = 10 rad s−1).
Table A1.
Mean values and standard deviations of the flow points of the lubricating greases K1–K4 determined in shear stress amplitude sweep test with controlled shear stress according to DIN 51818-2 [21] (triple measurements at ω = 10 rad s−1).
| T/°C | τf/Pa (K1) | τf/Pa (K2) | τf/Pa (K3) | τf/Pa (K4) |
|---|---|---|---|---|
| 20 | 75 ± 5 | 474 ± 20 | 1253 ± 68 | 803 ± 62 |
| 40 | 78 ± 3 | 336 ± 15 | 906 ± 85 | 596 ± 31 |
| 60 | 64 ± 6 | 245 ± 12 | 717 ± 56 | 346 ± 11 |

Table A2.
Mean values and standard deviations of the densities of centrifuged oils determined with a DMA 4500 density meter from Anton Paar (fivefold determinations). The temperature dependence of the density is described by the function ρO = a − bT.
Table A2.
Mean values and standard deviations of the densities of centrifuged oils determined with a DMA 4500 density meter from Anton Paar (fivefold determinations). The temperature dependence of the density is described by the function ρO = a − bT.
| ρO/g cm−3 | ρO = a − bT | |||
|---|---|---|---|---|
| 20 °C | 40 °C | 60 °C | ||
| K1 | 0.83398 ± 0.00034 | 0.82108 ± 0.00052 | 0.80818 ± 0.00109 | 0.8469 − 0.0006T |
| K2 | 0.83712 ± 0.00003 | 0.82423 ± 0.00009 | 0.81134 ± 0.00017 | 0.8500 − 0.0006T |
| K3 | 0.81966 ± 0.00003 | 0.80688 ± 0.00010 | 0.79410 ± 0.00025 | 0.8324 − 0.0006T |
| K4 | 0.82777 ± 0.00003 | 0.81523 ± 0.00004 | 0.80268 ± 0.00000 | 0.8403 − 0.0006T |
References
- Roman, C.; Valencia, C.; Franco, J.M. AFM and SEM Assessment of Lubricating Grease Microstructures: Influence of Sample Preparation Protocol, Frictional Working Conditions and Composition. Tribol. Lett. 2016, 63, 1–12. [Google Scholar] [CrossRef]
- Hodapp, A.; Conrad, A.; Hochstein, B.; Jacob, K.-H.; Willenbacher, N. Effect of Base Oil and Thickener on Texture and Flow of Lubricating Greases: Insights from Bulk Rheometry, Optical Microrheology and Electron Microscopy. Lubricants 2022, 10, 55. [Google Scholar] [CrossRef]
- Chatra, K.R.S.; Osara, J.A.; Lugt, P.M. Impact of grease churning on grease leakage, oil bleeding and grease rheology. Tribol. Int. 2022, 176, 107926. [Google Scholar] [CrossRef]
- Cann, P.M. Starvation and Reflow in a Grease-Lubricated Elastohydrodynamic Contact. Tribol. Trans. 1996, 39, 698–704. [Google Scholar] [CrossRef]
- Cyriac, F.; Lugt, P.M.; Bosman, R.M.; Venner, C.H. Impact of Water on EHL Film Thickness of Lubricating Greases in Rolling Point Contacts. Tribol. Lett. 2016, 61, 23. [Google Scholar] [CrossRef]
- DIN Deutsches Institut für Normung e.V. DIN ISO 22285; Petroleum Products and Lubricants—Determination of Oil Separation from Grease—Pressure Filtration Method. Beuth Verlag GmbH: Berlin, Germany, 2021. [Google Scholar] [CrossRef]
- DIN Deutsches Institut für Normung e.V. DIN 51817; Testing of Lubricants—Determination of Oil Separation from Greases Under Static Conditions. Beuth Verlag GmbH: Berlin, Germany, 2014. [Google Scholar] [CrossRef]
- Farrington, B.B.; Humphreys, R.L. Effect of pressure on lubricating greases. Ind. Eng. Chem. 1939, 31, 230–235. [Google Scholar] [CrossRef]
- Saatchi, A.; Shiller, P.J.; Eghtesadi, S.A.; Liu, T.; Doll, G.L. A fundamental study of oil release mechanism in soap and non-soap thickened greases. Tribol. Int. 2017, 110, 333–340. [Google Scholar] [CrossRef]
- Akchurin, A.; van den Ende, D.; Lugt, P.M. Modeling impact of grease mechanical ageing on bleed and permeability in rolling bearings. Tribol. Int. 2022, 170, 107507. [Google Scholar] [CrossRef]
- Hogenberk, F.; Osara, J.A.; van den Ende, D.; Lugt, P.M. On the evolution of oil-separation properties of lubricating greases under shear degradation. Tribol. Int. 2023, 179, 108154. [Google Scholar] [CrossRef]
- Dixena, R.; Sayanna, E.; Badoni, R. Recycled and Virgin HDPEs as bleed inhibitors and their rheological influences on lubricating greases thickened with PP and mPP. Lubricants 2014, 2, 237–248. [Google Scholar] [CrossRef]
- Baart, P.; van der Vorst, B.; Lugt, P.M.; van Ostayen, R.A.J. Oil-Bleeding Model for Lubricating Grease Based on Viscous Flow Through a Porous Microstructure. Tribol. Trans. 2010, 53, 340–348. [Google Scholar] [CrossRef]
- Goncalves, D.; Campos, A.; Graca, B.; Seabra, J. Formulation, Rheology and Thermal Aging of Polymer Greases. In Proceedings of the 6th International Conference on Mechanics and Materials in Design, Ponta Delgada, Portugal, 26–30 July 2015; p. 5752. [Google Scholar]
- Badolato, G.G.; Aguilar, F.; Schuchmann, H.P.; Sobisch, T.; Lerche, D. Evaluation of long term stability of model emulsions by multisample analytical centrifugation. In Surface and Interfacial Forces—From Fundamentals to Applications; Springer: Berlin/Heidelberg, Germany, 2008; pp. 66–73. [Google Scholar] [CrossRef]
- Sobisch, T.; Lerche, D. Thickener performance traced by multisample analytical centrifugation. Colloids Surf. A: Physicochem. Eng. Asp. 2008, 331, 114–118. [Google Scholar] [CrossRef]
- Lerche, D.; Sobisch, T. Consolidation of concentrated dispersions of nano- and microparticles determined by analytical centrifugation. Powder Technol. 2007, 174, 46–49. [Google Scholar] [CrossRef]
- Torsten, D.; Sobisch, T.; Lerche, D. Particle size distribution by space or time dependent extinction profiles obtained by analytical centrifugation. Part. Part. Syst. Charact. 2006, 23, 184–187. [Google Scholar] [CrossRef]
- DIN Deutsches Institut für Normung e.V. DIN 51562; Viscosimetry—Measurement of Kinematic Viscosity by Means of the Ubbelohde Viscometer—Part 1: Viscometer Specification and Measurement Procedure. Beuth Verlag GmbH: Berlin, Germany, 1999. [Google Scholar] [CrossRef]
- DIN Deutsches Institut für Normung e.V. DIN ISO 2137; Petroleum Products and Lubricants—Determination of Cone Penetration of Lubricating Greases and Petrolatum. Beuth Verlag GmbH: Berlin, Germany, 2016. [Google Scholar] [CrossRef]
- DIN Deutsches Institut für Normung e.V. DIN 51818; Lubricants; Consistency Classification of Lubricating Greases; NLGI grades. Beuth Verlag GmbH: Berlin, Germany, 1981. [Google Scholar] [CrossRef]
- DIN Deutsches Institut für Normung e.V. DIN 51810-2; Testing of Lubricants—Testing Rheological Properties of Lubricating Greases—Part 2: Determination of Flow Point Using an Oscillatory Rheometer with a Parallel-Plate Measuring System. Beuth Verlag GmbH: Berlin, Germany, 2017. [Google Scholar] [CrossRef]
Disclaimer/Publisher’s Note: The statements, opinions and data contained in all publications are solely those of the individual author(s) and contributor(s) and not of MDPI and/or the editor(s). MDPI and/or the editor(s) disclaim responsibility for any injury to people or property resulting from any ideas, methods, instructions or products referred to in the content. |
© 2023 by the author. Licensee MDPI, Basel, Switzerland. This article is an open access article distributed under the terms and conditions of the Creative Commons Attribution (CC BY) license (https://creativecommons.org/licenses/by/4.0/).