Article

X-ray and Gamma-ray Variability of NGC 1275

1
Department of High Energy Physics, Tata Institute of Fundamental Research, Homi Bhabha Road, Mumbai 400005, India
2
Discipline of Astronomy, Astrophysics and Space Engineering, Indian Institute of Technology Indore, Khandwa Road, Simrol, Indore 453552, India
3
Indian Institute of Science Education and Research Mohali, Knowledge City, Sector 81, SAS Nagar, Manauli 140306, India
4
Inter-University Centre for Astronomy and Astrophysics, Ganeshkhind, Pune 411 007, India
5
Department of Astronomy and Astrophysics, Tata Institute of Fundamental Research, Homi Bhabha Road, Mumbai 400005, India
6
Centre for Space Research, North-West University, Potchefstroom 2520, South Africa
7
Department of Physics and Astronomy, The University of Leicester, University Road, Leicester LE1 7RH, UK
*
Authors to whom correspondence should be addressed.
These authors contributed equally to this work.
Galaxies 2020, 8(3), 63; https://doi.org/10.3390/galaxies8030063
Submission received: 30 June 2020 / Revised: 21 August 2020 / Accepted: 24 August 2020 / Published: 28 August 2020
(This article belongs to the Special Issue X-Ray Flux and Spectral Variability of Blazars)

Abstract

:
Gamma-ray emission from the bright radio source 3C 84, associated with the Perseus cluster, is ascribed to the radio galaxy NGC 1275 residing at the centre of the cluster. Study of the correlated X-ray/gamma-ray emission from this active galaxy, and investigation of the possible disk-jet connection, are hampered because the X-ray emission, particularly in the soft X-ray band (2–10 keV), is overwhelmed by the cluster emission. Here we present a method to spectrally decouple the cluster and active galactic nucleus (AGN) emission in imaging X-ray detectors. We use three sets of simultaneous Niel Gehrels Swift XRT and NuStar data. These observations were made during the period 2015 November to 2017 February, when a huge increase in the gamma-ray emission was observed. We find that the gamma-ray emission shows a very high degree of variability (40%–50%) on time scales of 1–10 days, whereas the hard X-ray emission, associated with the AGN, shows a low variability (∼15%–30%), on various time scales in the range of 0.01–60 days.

1. Introduction

NGC 1275 is a radio galaxy located at the centre of the Perseus cluster. This galaxy harbours an active galactic nucleus (AGN), and it is classified as a Fanaroff–Riley I radio galaxy based on radio morphology. This is one of the closest AGNs at a redshift of 0.01756 [1]. This object is also known as a bright radio source, 3C 84, showing an extended jet in the VLBI images [2]. VLBI observations, carried out in 2007, revealed the appearance of a new core component, and the radio flux was found to increase by a factor of three since 2006 [3,4]. The optical emission from the nucleus was found to be variable and strongly polarized from 3% to 6% [5,6,7]. This implies a significant contribution from the putative relativistic jet to optical continuum [8]. In this source, the viewing angle of jet is not as small as those in blazars, and thus the enhancement of the jet core emission due to the beaming effect is not significant. Hence, this is an ideal source to study the jet phenomenon at a larger off-axis angle, which can be useful to understand the radiation mechanism and the structure of the jet.
In the X-ray regime, the study of this AGN and its jet activity is hampered by the overwhelming cluster emission. XMM-Newton and Chandra observations, however, have resolved the nuclear emission spatially. Based on an XMM-Newton observation in 2001, the X-ray spectrum of the nucleus was reported to be represented by a powerlaw with a photon index of 1.65 and a flux of (1.43 ± 0.29) × 10 11 erg cm 2 s 1 in the 0.5–8 keV band [9]. The Chandra spectrum of the nuclear region, from the observations carried out in August 2002, was consistent with a photon index of 1.6 ± 0.1 and a flux of 6.1 × 10 12 erg cm 2 s 1 [10]. Swift-BAT observations though could not resolve the nucleus spatially, excess hard X-ray emission was inferred over and above the thermal emission with a photon index of 1.7 ± 0.3 and a flux of 10 11 erg cm 2 s 1 (15–55 keV) [11]. More recently, NuSTAR data in hard X-ray band were analysed by [12]. They studied the power-law component which dominates above 20 keV.
NGC 1275 is the brightest radio galaxy detected with Fermi-LAT, and it was found that the gamma-ray emission from this object had increased with time compared to the CGRO era [13]. CGRO gave 2 σ upper limit on flux of 3.72 × 10 8 ph cm 2 s 1 above 100 MeV, whereas Fermi-LAT detected flux of around 1 × 10 7 ph cm 2 s 1 above 100 MeV. The Fermi-LAT observation also showed variability in the flux on a weekly time scale. The MAGIC telescope had detected Very High Energy (VHE) gamma-rays above 100 GeV from this source with 6.6 σ significance [14].
High energy and VHE gamma-ray instruments including Fermi-LAT, AGILE, MAGIC and VERITAS reported a huge increase in the gamma-ray flux from this source in 2017 January. The MAGIC telescope detected VHE gamma-ray flux of about 1.5 times the flux from the Crab nebula above 100 GeV on the night between 31 December 2016 and 1 January 2017 [15]. This flux was about 60 times larger than the low state flux of the source reported during two observational campaigns between October 2009 and February 2010 and August 2010 and February 2011 by [16]. On January 2–3, MAGIC observed a flux level of about 70% Crab Units (CU). VERITAS also reported the detection of an enhanced gamma-ray activity from the source on January 2 with a flux of (2.03 ± 0.11) × 10 10 erg cm 2 s 1 (65% CU) above 170 GeV [17]. AGILE detected a flux of (3.0 ± 1.2) × 10 6 ph cm 2 s 1 above 100 MeV, about a factor of 12 larger than the most significant flux reported in 1AGLR Catalogue [18,19].
The relation between the X-ray and GeV gamma-ray emission and the origin of X-rays from NGC 1275 nucleus are not well understood. For example, [7] reported that the Suzaku/XIS monitoring observations of NGC 1275 during 2006–2011 showed no clear variability compared to the factor of three gamma-ray variability seen during the same period. This indicates that the emission in the X-ray band is not dominated by the jet emission. Whereas, in more recent work, [20] reported correlation for the long-term variability between X-ray data from Suzaku and gamma-ray data from Fermi-LAT. Further, long term monitoring observations using non-imaging X-ray detectors have contributions from the cluster, nuclear region and the jet. Hence, a careful investigation of the relative contributions from each of these regions is necessary. In this paper we report the results of our investigation of this source using the XRT-NuSTAR observations which were made in the period of 2015–2017, when a long term gamma-ray flare was observed.
The paper is structured as follows. The details of observations and the analysis procedure are given in Section 2. Segregation of contribution from Perseus cluster and AGN is discussed in Section 3. This is followed by X-ray and gamma-ray variability in Section 4. Finally, discussion and conclusions are given in Section 5 and Section 6.

2. Observation Details and Analysis

2.1. Fermi-LAT

The X-ray observations are made during the gamma-ray high state as seen by the Large Area Telescope (LAT) onboard the Fermi spacecraft [21], covering the energy range of 100 MeV–300 GeV. To investigate the relation between the X-ray emission and the gamma-ray emission, we have analysed the data from Fermi-LAT using the Science Tools version v10r0p5. User contributed Enrico package (https://github.com/gammapy/enrico/) [22] was used for the analysis. The events were extracted from a circular region of interest (ROI) of 20 radius centred on the source. Zenith angle cut of 90 was applied to filter the background gamma-rays from Earth’s limb. Spectral analysis was carried out using the isotropic emission model (iso_P8R2_SOURCE_V6_v06.txt) and the Galactic diffuse emission component model (gll_iem_v06.fit) with post launch instrument response function (P8R2_SOURCE_V6) and using unbinned likelihood analysis. The sources lying within the ROI of 12 radius around the location of NGC 1275 from the 3FGL catalog were included in the model XML file. In the likelihood fit, both spectral and normalization parameters of the sources within 3 around the source were left free to vary while keeping the parameters for all other sources fixed at their catalog values. The source spectrum was modelled with a log-parabola. Light curve of NGC 1275 with 10-day binning was generated. We have analysed three X-ray datasets obtained during the roughly 16 months period from 2015 November to 2017 February. These include three datasets from XRT-NuSTAR archives. All these datasets correspond to the high state of Fermi-LAT as seen from the 10 days binned light curve in 0.1–300 GeV band shown in Figure 1, spanning nine years from 2008 August to 2017 August. The NuStar observation periods are marked with vertical dashed lines in red. Details of XRT-NuSTAR observations are given in Table 1.

2.2. Swift-XRT

The X-ray Telescope (XRT) onboard Neil Gehrels Swift observatory [23] is a grazing incidence Wolter I telescope with a CCD at the focus. It covers the energy range of 0.2–10 keV. The XRT data were processed using XRTDAS software package (v 3.3.0) distributed under HEASoft (v 6.21). The task, xrtpipeline (v 0.13.3) was used to clean and calibrate event files. The task, xrtproducts (v 0.4.2) was used to generate light curves and spectra. Standard grade selection of 0–12 and 0–2 were used respectively for the photon counting (PC) and the windowed timing (WT) modes. A circular region around the source position was used to extract the source light curve and the spectrum. Details of regions chosen are given in Section 3. For extracting background light curve and spectrum, a region in the shape of a polygon, away from the source position, was used. Spectral channels were grouped using grppha to ensure at least 20 counts per bin. ARFs for extended source were used. Since most of the X-ray counts were from the extended emission and as in the present work, simultaneous fit for XRT-NuSTAR data is attempted, pile-up correction was not applied to Swift-XRT data. Pile-up normally seen in X-ray CCDs results in flux loss and wrong estimates of photon energies leading to erroneous estimate of spectral shape.

2.3. NuSTAR

Nuclear Spectroscopic Telescope Array— NuSTAR [24], is a hard X-ray focusing telescope covering the energy range of 3–78 keV. The NuSTAR data were processed using NuSTARDAS software package (v 1.7.1) distributed under HEASoft (v 6.21). The tasks nupipeline (v 0.4.6) and nuproducts (v 0.3.0) were used for extracting light curves and spectra and also to generate the response files. Data from both the modules, Focal Plane Module A (FPMA) and Focal Plane Module B (FPMB) were analysed. A circular region centred on the source location was used to extract source light curve and spectrum. A polygon region away from the source was used as the background region. Spectral channels were grouped to ensure at least 20 counts per bin using grppha.

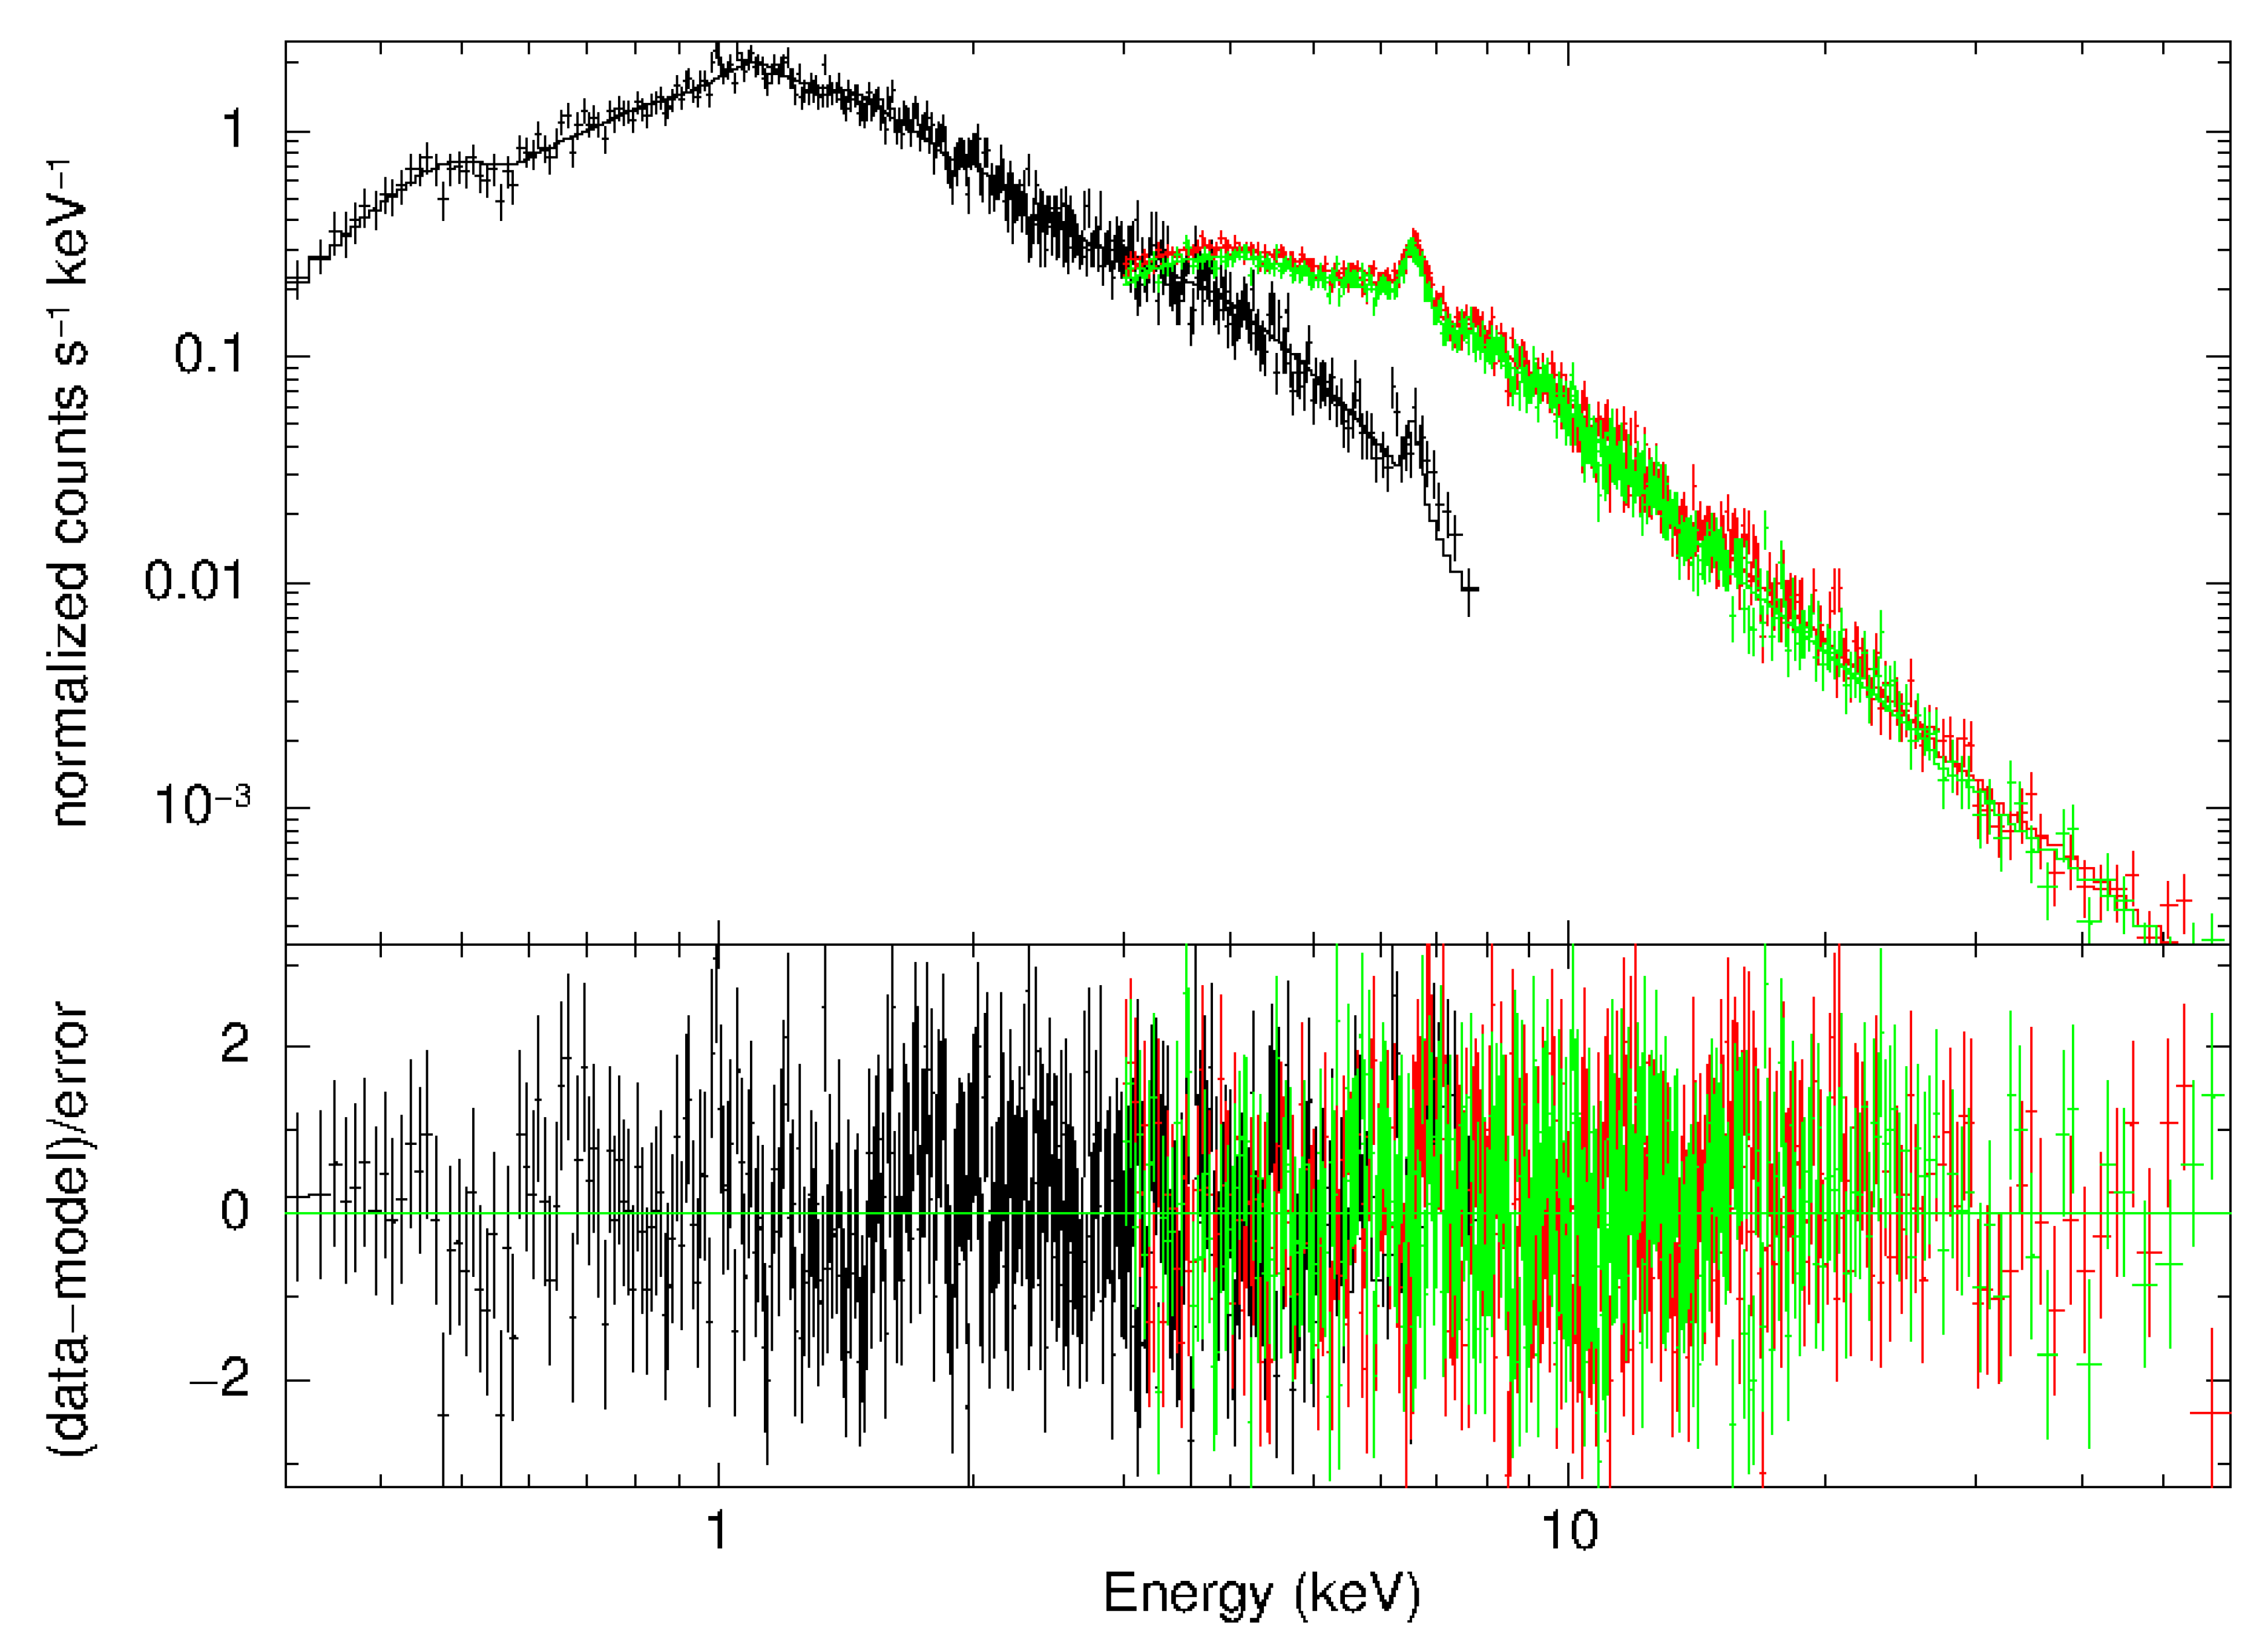
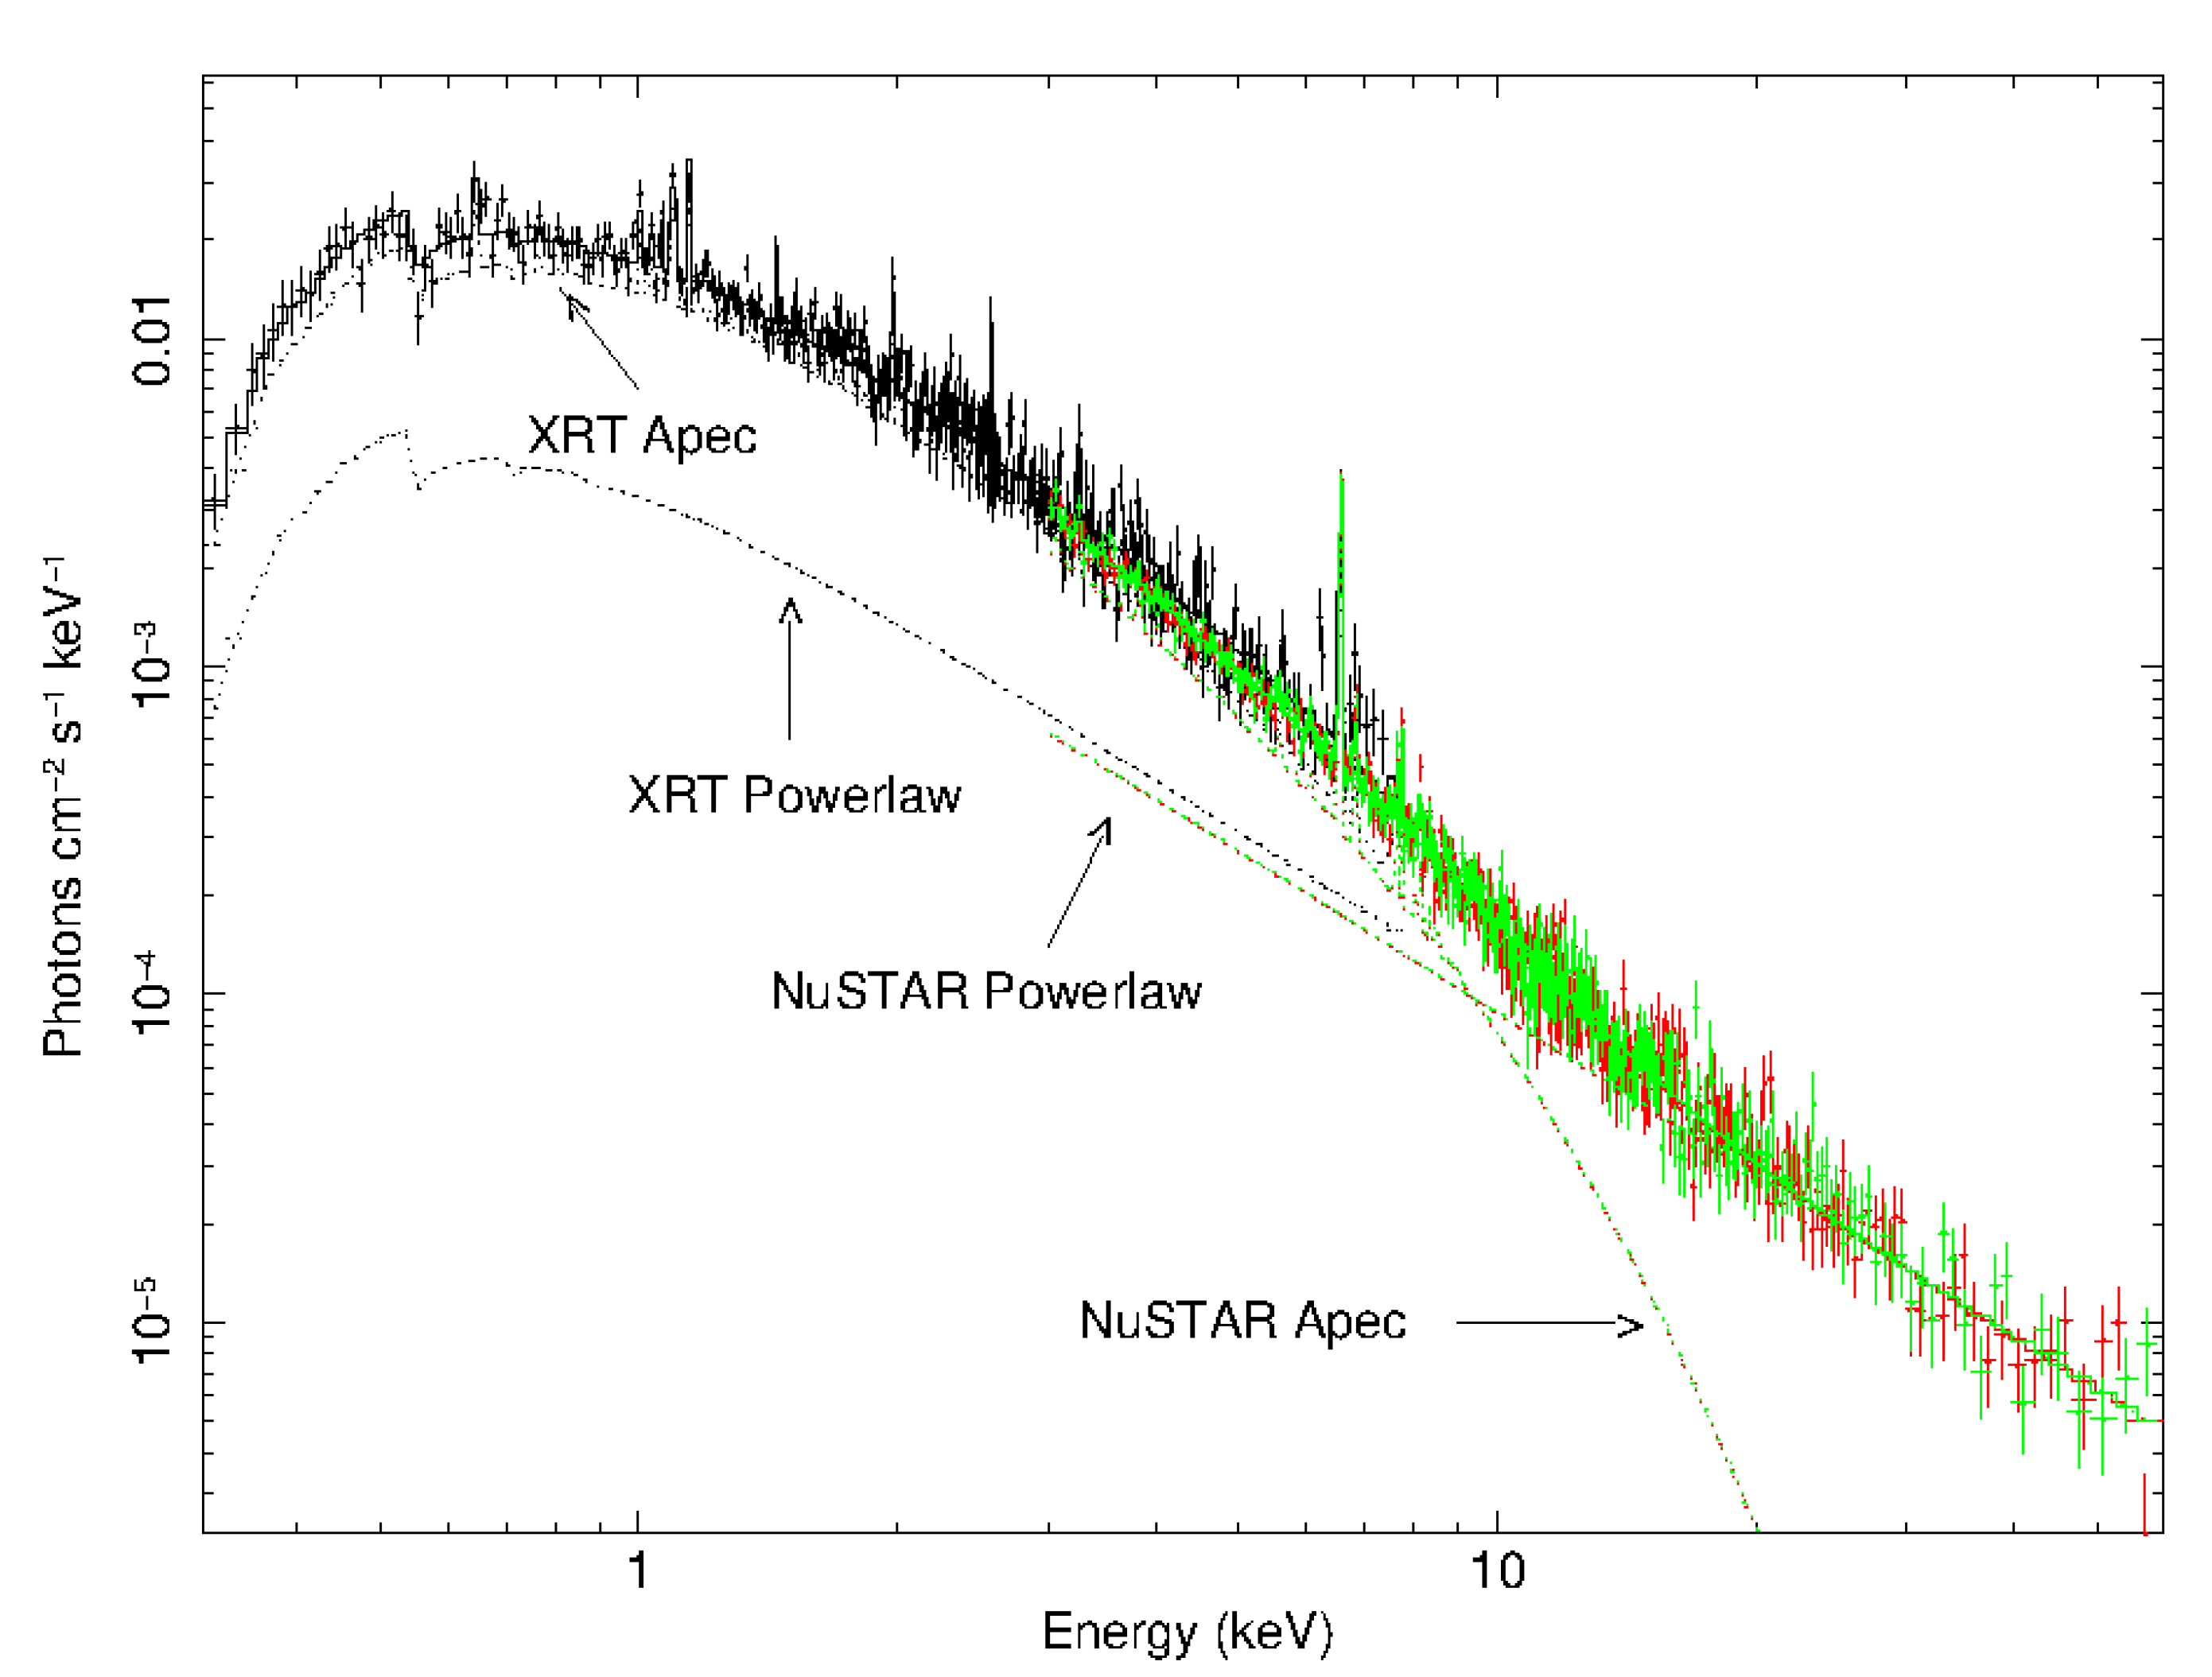
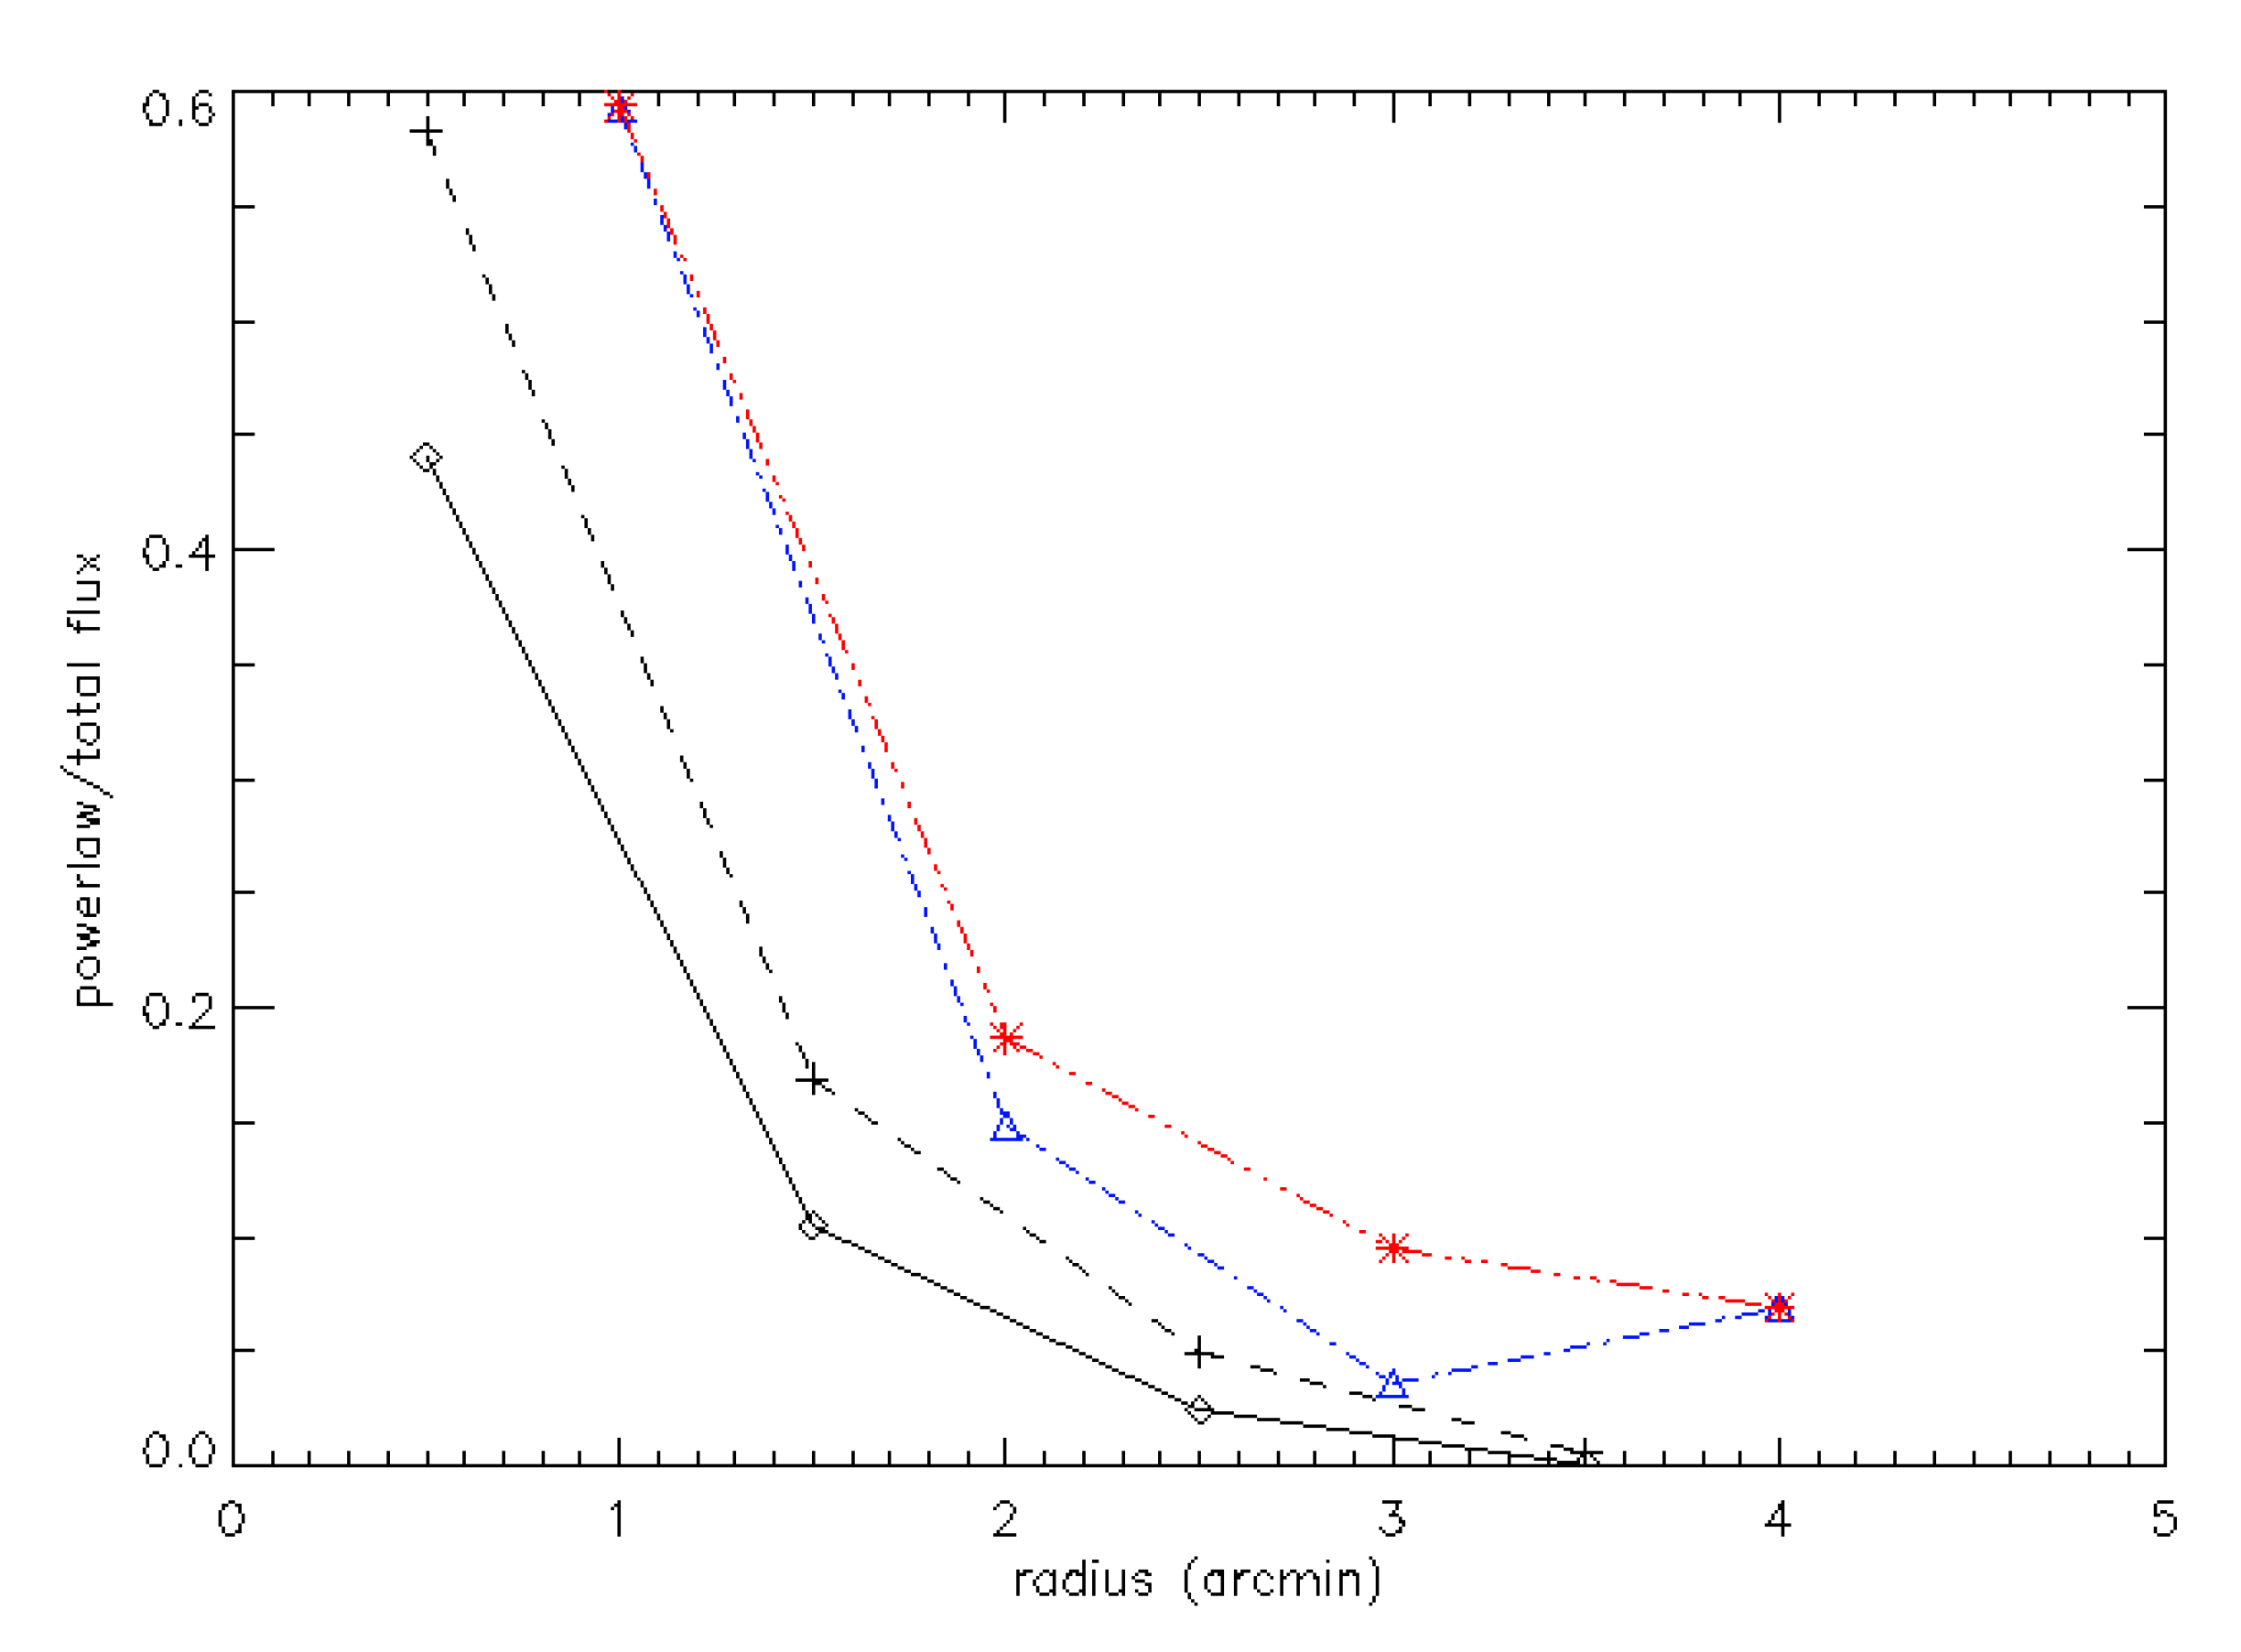
3. Spatial and Spectral Segregation of Cluster and AGN Contributions

NGC 1275 is located at the centre of the Perseus cluster. In order to study the X-ray emission from the AGN, it is necessary to separate out the cluster and AGN contributions. For this purpose, as AGN contribution is known to vary with time, simultaneous XRT and NuSTAR observations were used. These data were analysed using the standard analysis procedure.
Simultaneous spectral fits were carried out to the XRT and the NuSTAR data covering the energy ranges of 0.3–8 keV and 3–70 keV, respectively. Emission from Perseus cluster was modelled using the model ’apec’. This model generates emission spectrum from collisionally-ionized diffuse gas calculated from the AtomDB atomic database. X-ray emission is created in collisions of hot electrons with astrophysically abundant elements and ions. Abundance model based on ’aspl’ table as given by Asplund et al. [25] based on chemical composition of the Sun was used. The relative abundance parameter was allowed to vary and redshift of 0.01756 was used. Emission from AGN was modelled using a powerlaw. Line of sight absorption was modelled with tbabs. A similar spectral model was used by [26] to model the large scale temperature structure of the Perseus cluster using Suzaku data and later by [12] to model NuSTAR data. In the present work, a much wider energy range obtained by combining XRT and NuSTAR data is used.
Spectral fits were carried out for various annular regions around the location of NGC 1275, using XRT and NuSTAR data separately as well as combining them. Figure 2 shows the spectral fit to XRT-NuSTAR data from the observations carried out on 3 November 2015. Circular region with radius of 1’ centred on the location of the source was used to extract source spectrum. It should be noted that pile-up correction has not been applied to Swift-XRT data. Pile-up can affect the flux estimates for this particular region for the data collected in PC mode on 3 November 2015. Unfolded spectrum is shown in Figure 3. It can be seen that apec contributes mainly at lower energies (<20 keV), whereas powerlaw contribution extends to hard X-rays. In addition, cluster is an extended source, whereas AGN is a point source. Therefore, it is necessary to study spatial distribution of spectral components as well. Hence, in order to investigate this further, spectral fits were carried out for annular regions with inner and outer radii of 0’–1’,1’–2’,..., 8’–9’ for XRT and 0’–1’, 1’–2’,2’–3’, 3’–4’ for the NuSTAR and XRT-NuSTAR combined data, due to smaller field of view of NuSTAR compared to XRT. Initially spectral fit was carried out combining spectra from various annular regions of NuSTAR data. These spectral files were fitted over the energy range of 3–70 keV with a model consisting of constant*(apec+powerlaw), tying powerlaw indices of all the files together and allowing other parameters to vary. In this model ’constant’ accounts for relative normalisation between various instruments. Best fit powerlaw spectral indices were found to be 1.64 ± 0.07, 1.77 ± 0.07 and 1.86 ± 0.06 respectively for 3 November 2015, 1 February 2017 and 4 February 2017 data.
While fitting the data from individual annular regions for XRT, NuSTAR and XRT-NuSTAR combined data, powerlaw indices were frozen to the values mentioned above. For observations carried out on 3 November 2015, XRT data was recorded in PC mode and it was possible to carry out analysis in annular regions for XRT as well as XRT-NuSTAR combined data, in addition to NuSTAR data. Whereas both the XRT observations carried out in February 2017 correspond to WT mode and hence it was not possible to analyse XRT data in various annular regions. The spectral fits reveal an increase in cluster temperature with distance from the centre as shown in Figure 4, for all the three data sets. As seen from XRT observations carried out on 3 November 2015, temperature increases from around 3.7 keV at core with the rate of about 0.6 keV/arcminute away from the core. Similar study has been carried out in the past by various researchers using data from ASCA [27], Chandra [28], XMM-Newton [9] and more recently Suzaku [26]. Trend of increasing temperature with distance from the core has been seen by them. Our results are consistent with those reported by Nishino et al. [26].
In addition, we find that the relative contribution of powerlaw decreases rapidly at larger distances as shown in Figure 5. Energy ranges used for estimating flux values are 0.3–70 keV for XRT-NuSTAR combined fit and 3–70 keV for NuSTAR alone. In Table 2, the flux estimates from cluster and AGN, as modelled by apec and powerlaw, are listed for various annular regions, for all the three data sets. From the table, it is clear that the relative contribution from powerlaw decreases rapidly at larger distances from the source location. For circular region with radius of 1’, at energies above 19 keV, contribution to total flux from apec is less than 10%. At larger distances, powerlaw dominates at higher energies. It is important to identify powerlaw component originating from AGN to study its variability.
The best fit spectral parameters for combined XRT-NuSTAR data for observations carried out on 3 November 2015, 1 February 2017 and 4 February 2017 are listed in Table 3. Source counts were extracted using circular region with radius of 1’ centred on the location of the source. In all these cases, common spectral parameters were used and a constant factor multiplying the model was allowed to vary for between XRT and NuSTAR FPMA and FPMB. It should be noted that typical durations for NuSTAR observations are about 20 ks or more whereas they are in the range of 1500–6000 s for XRT. Hence, observations are not strictly simultaneous. This accounts for the variation in constant factor between observations. In addition, the spectral parameters obtained here are consistent with the ones reported by [12] using NuSTAR data alone for 1 February 2017 and 4 February 2017.

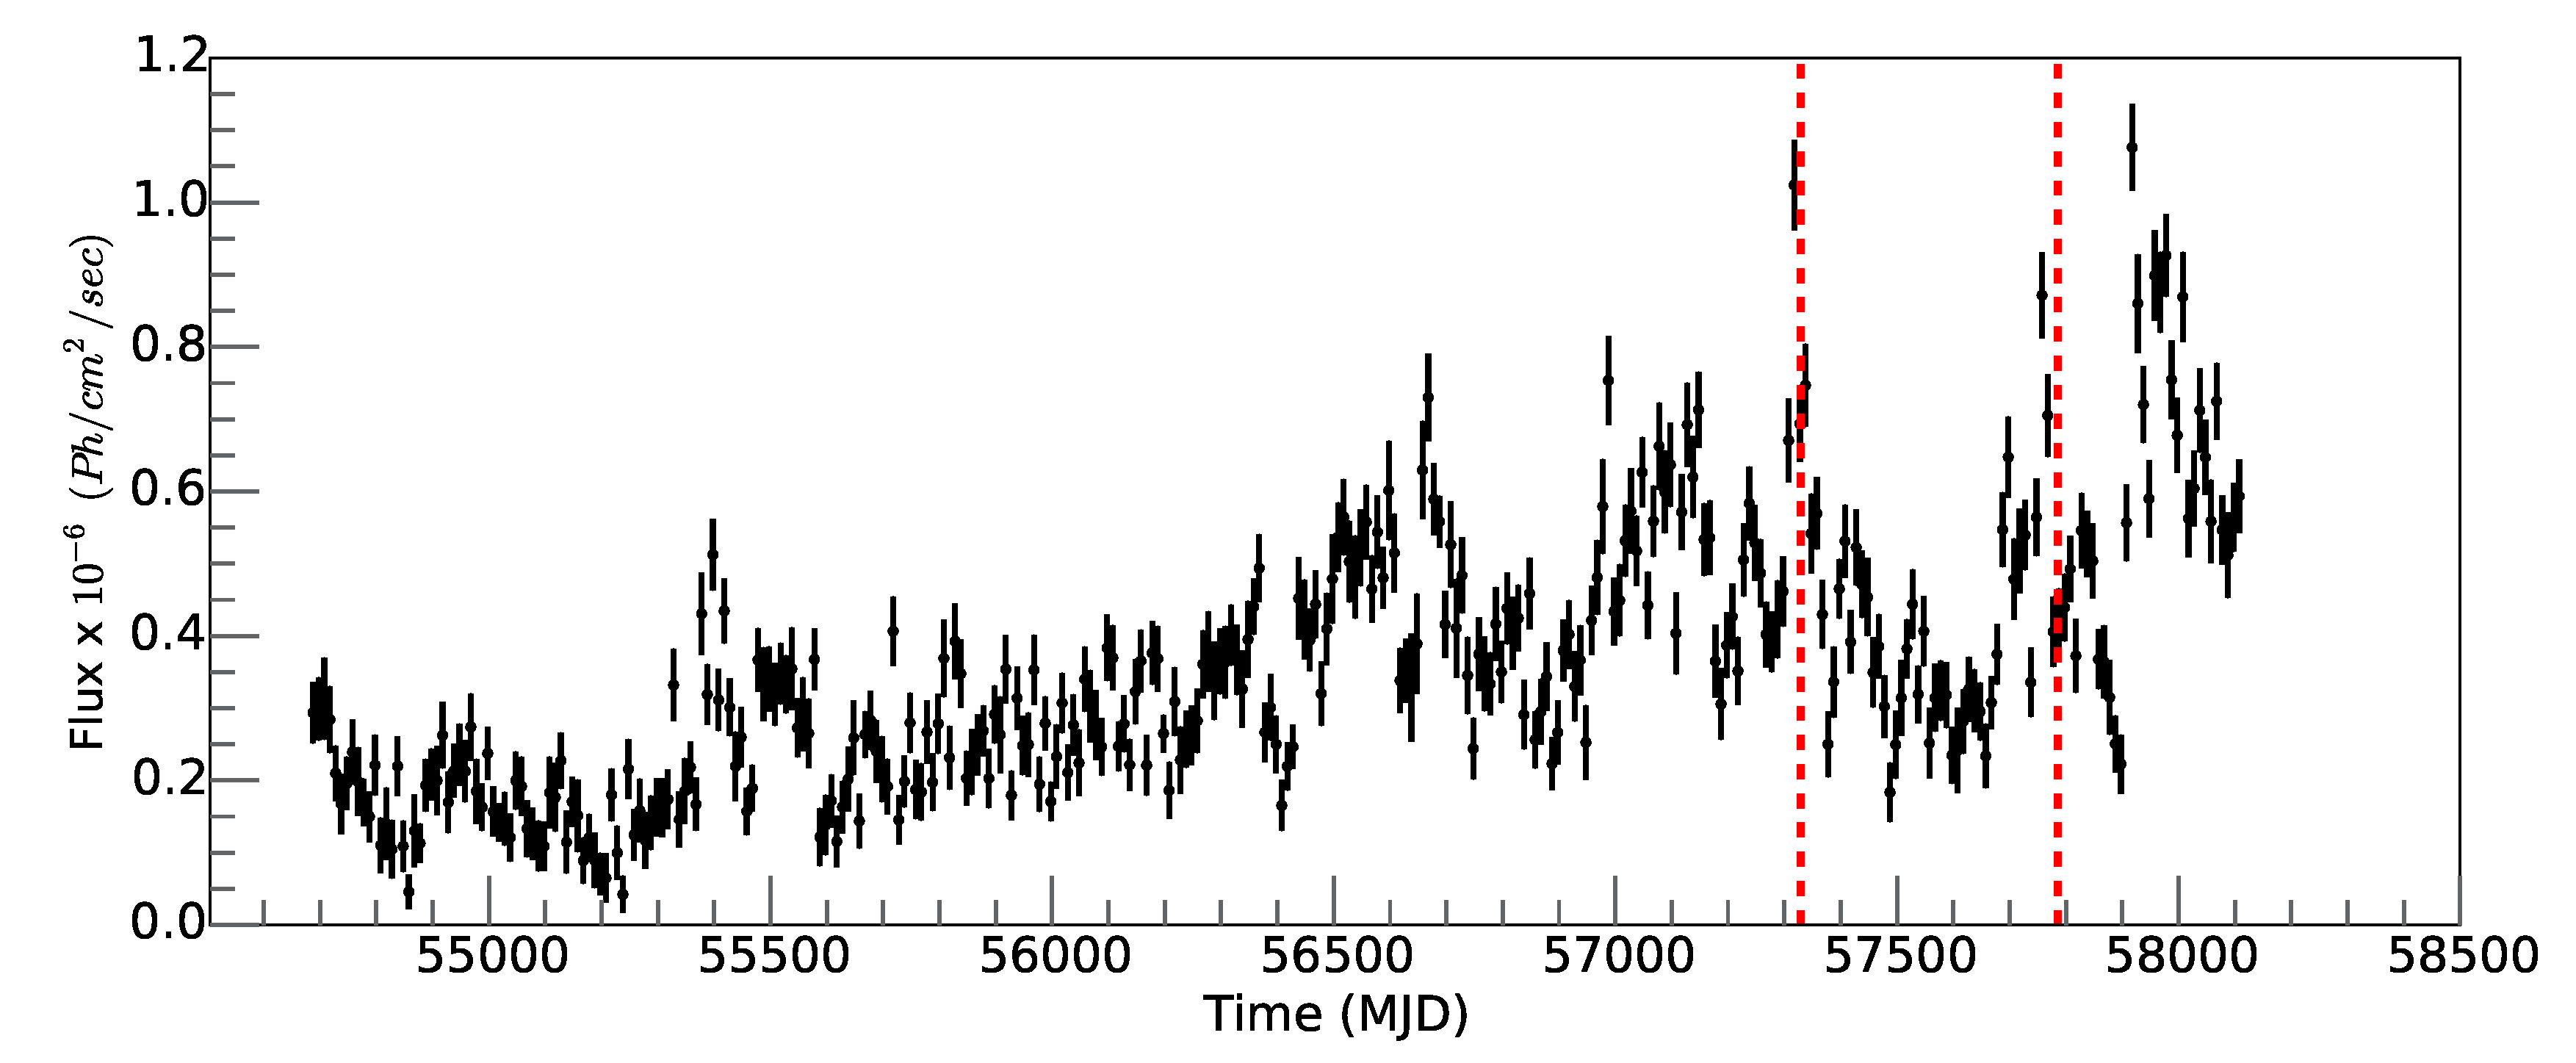
4. X-ray and Gamma-ray Variability

Hard X-ray light curves are generated using NuSTAR data. Considering the conclusion from the previous section, for NuSTAR, light curves are generated using circular source extraction region of radius 1’ and over the energy range of 20–60 keV, to optimise the AGN contribution. Figure 6 shows the background subtracted light curves binned over 1000 s for observations carried out on 3 November 2015, 1 and 4 February 2017, respectively in three panels. For background subtraction, count rates were normalised considering the ratio of effective areas for the source and the background regions. The light curve bins with fractional exposure below 50% were excluded in order to ensure good sampling while plotting these light curves.
Using these light curves, the variability strength is estimated on a 1000 s time scale. The fractional variability amplitude F v a r is given by
F v a r = S 2 σ i 2 ¯ x ¯ 2
where S 2 is the sample variance, x ¯ is the mean rate and σ i 2 ¯ is average variance from measurements for data with N samples [29,30].
The error on F v a r is then
e r r ( F v a r ) = 1 2 N S 2 x ¯ 2 F v a r
This method is used to estimate variability in red noise light curves typically seen in AGNs. Variability strength is given as 100 × F _ v a r %. The values of variability strengths for NuSTAR data are listed in Table 5 along with the results from variability study of data from other X-ray and gamma-ray missions. Hard X-ray variability strength on 1000 s time scale is estimated to be 15.6 ± 7.0% for NuSTAR observations carried out on 1 February 2017, whereas upper limits of 17.4% and 25.1%, respectively were estimated for observations carried out on 3 November 2015 and 4 February 2017.
The hard X-ray spectra were studied for these observations. In the case of NuSTAR observations, two types of spectral fits were performed, only fit with powerlaw over the energy range of 20–60 keV as apec contribution is less than 10% of the total flux above 20 keV) and fit with combination of apec and powerlaw for NuSTAR data over the energy range of 3–70 keV. In both the cases, flux values over the energy ranges 20–60 keV are listed in Table 4 along with the powerlaw spectral indices.
High energy γ -ray spectra from Fermi-LAT over the energy range of 0.1–300 GeV were extracted over six days interval around the epochs for X-ray observations. These spectra are fitted with a logparabola model. Best fit α parameter and 0.1–300 GeV flux values are listed in Table 4. SEDs are shown in Figure 7. Variability strength is estimated using ten days binned light curve shown in Figure 1 and also one day binned light curves as shown in Figure 8 and results are given in Table 5. Variability strength of 52.9 ± 2.2% is seen on the time scale of ten days. On one day time scale, a similar variability strength is seen.

5. Discussion and Conclusions

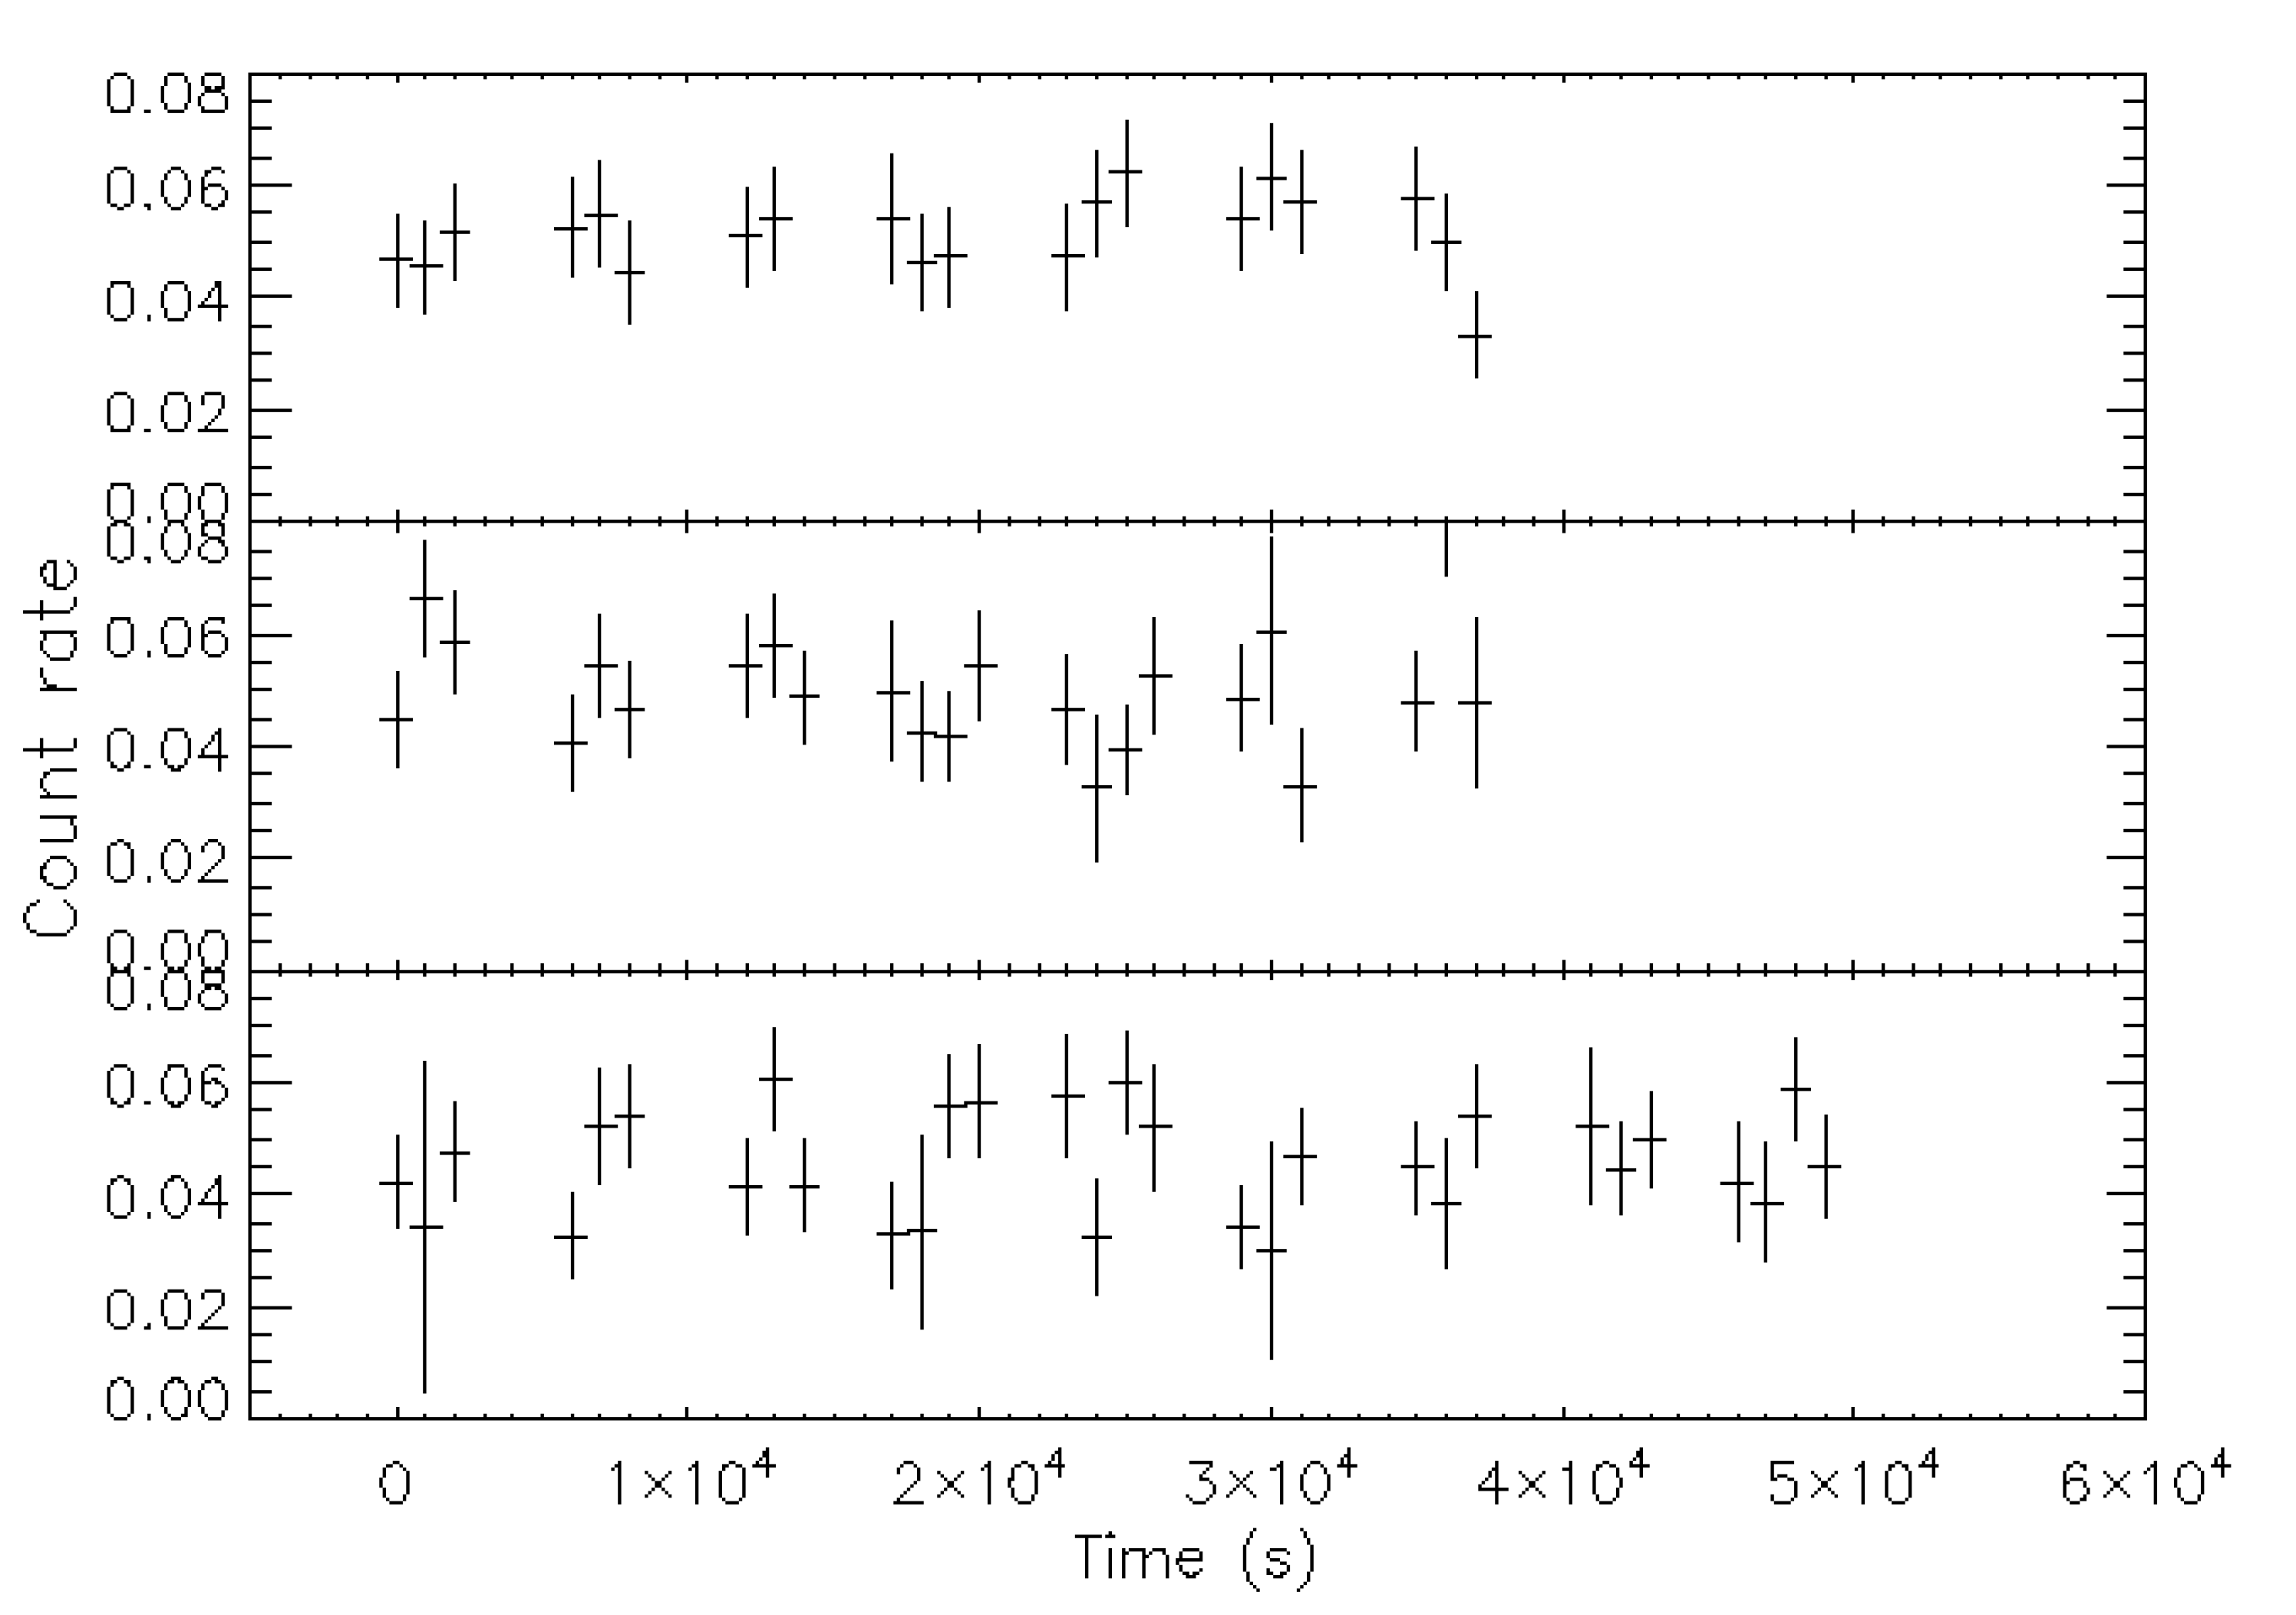
5.1. X-ray Variability on Various Time Scales

We have studied archival data from various X-ray satellites to study the variability on various time scales. Variability on time scales of a day to month is estimated using data from various instruments in soft and hard X-ray bands employing method given in Section 4. Light curves were obtained from various web-sites. These include light curves from All Sky Monitor (ASM) onboard Rossi X-ray Timing Explorer (RXTE) covering the energy range of 1.2–15 keV (https://www.isdc.unige.ch/heavens/), the Monitor of All-sky X-ray Image (MAXI) over 2–20 keV (http://maxi.riken.jp/top/slist.html), Burst Alert Telescope (BAT) onboard Neil Gehrels Swift observatory covering 15–50 keV (https://swift.gsfc.nasa.gov/results/transients/BAT_detected.html) and Integral Soft Gamma-Ray Imager (ISGRI) onboard INTErnational Gamma-Ray Astrophysics Laboratory (INTEGRAL) satellite covering the range of 17.3–80.0 keV (https://www.isdc.unige.ch/heavens/). For each of these, available datasets covering a period of several years were used. Results from the variability study are given in Table 5. While binning data over 30 or 60 days bins, appropriate selection criteria were considered to ensure good statistics in every bin. All these are large FoV instruments and their count rates have contribution from both thermal and non-thermal components. Ratio of non-thermal to total flux listed in Table 5 as powerlaw fraction was estimated using best fit parameters for XRT- NuSTAR combined fit for observations carried out on 3 November 2015. On 30 days’ time scale, variability seen in soft X-ray band by ASM and MAXI is less than that seen by BAT and INTEGRAL covering hard X-ray band. In the soft X-ray band, thermal contribution from cluster dominates the non-thermal contribution from AGN, resulting in a reduction in the variability. Variability strength of 4.6 ± 0.4% seen in ASM on 30 days time scale is consistent with the previous work based on shorter data stretch of 12.5 years [29]. In the present work, the entire data stretch of 16 years is used. Variability of 25.2 ± 3.5% seen in BAT on 30 days time scale is inconsistent with the upper limit of 14% reported by [31] based on one year of data. A possible reason for the discrepancy could be the longer data stretch used by us.
As the variability study presented here has been carried out for a variety of instruments, time scales used for study are different. For survey instruments typically 1–60 days times scales are used. Whereas in the case of pointed observations with NuSTAR, as typical observation duration is of the order of 20 ks and there are only few observations, variability could be studied only on a time scale of 1000 s. Results given for one day time scale for all missions (except for NuSTAR, where it is not available and Swift-BAT, giving an upper limit due to poor statistics) indicate systematic increase in variability from soft to hard X-rays and then gamma-rays as AGN component starts dominating over steady cluster component.

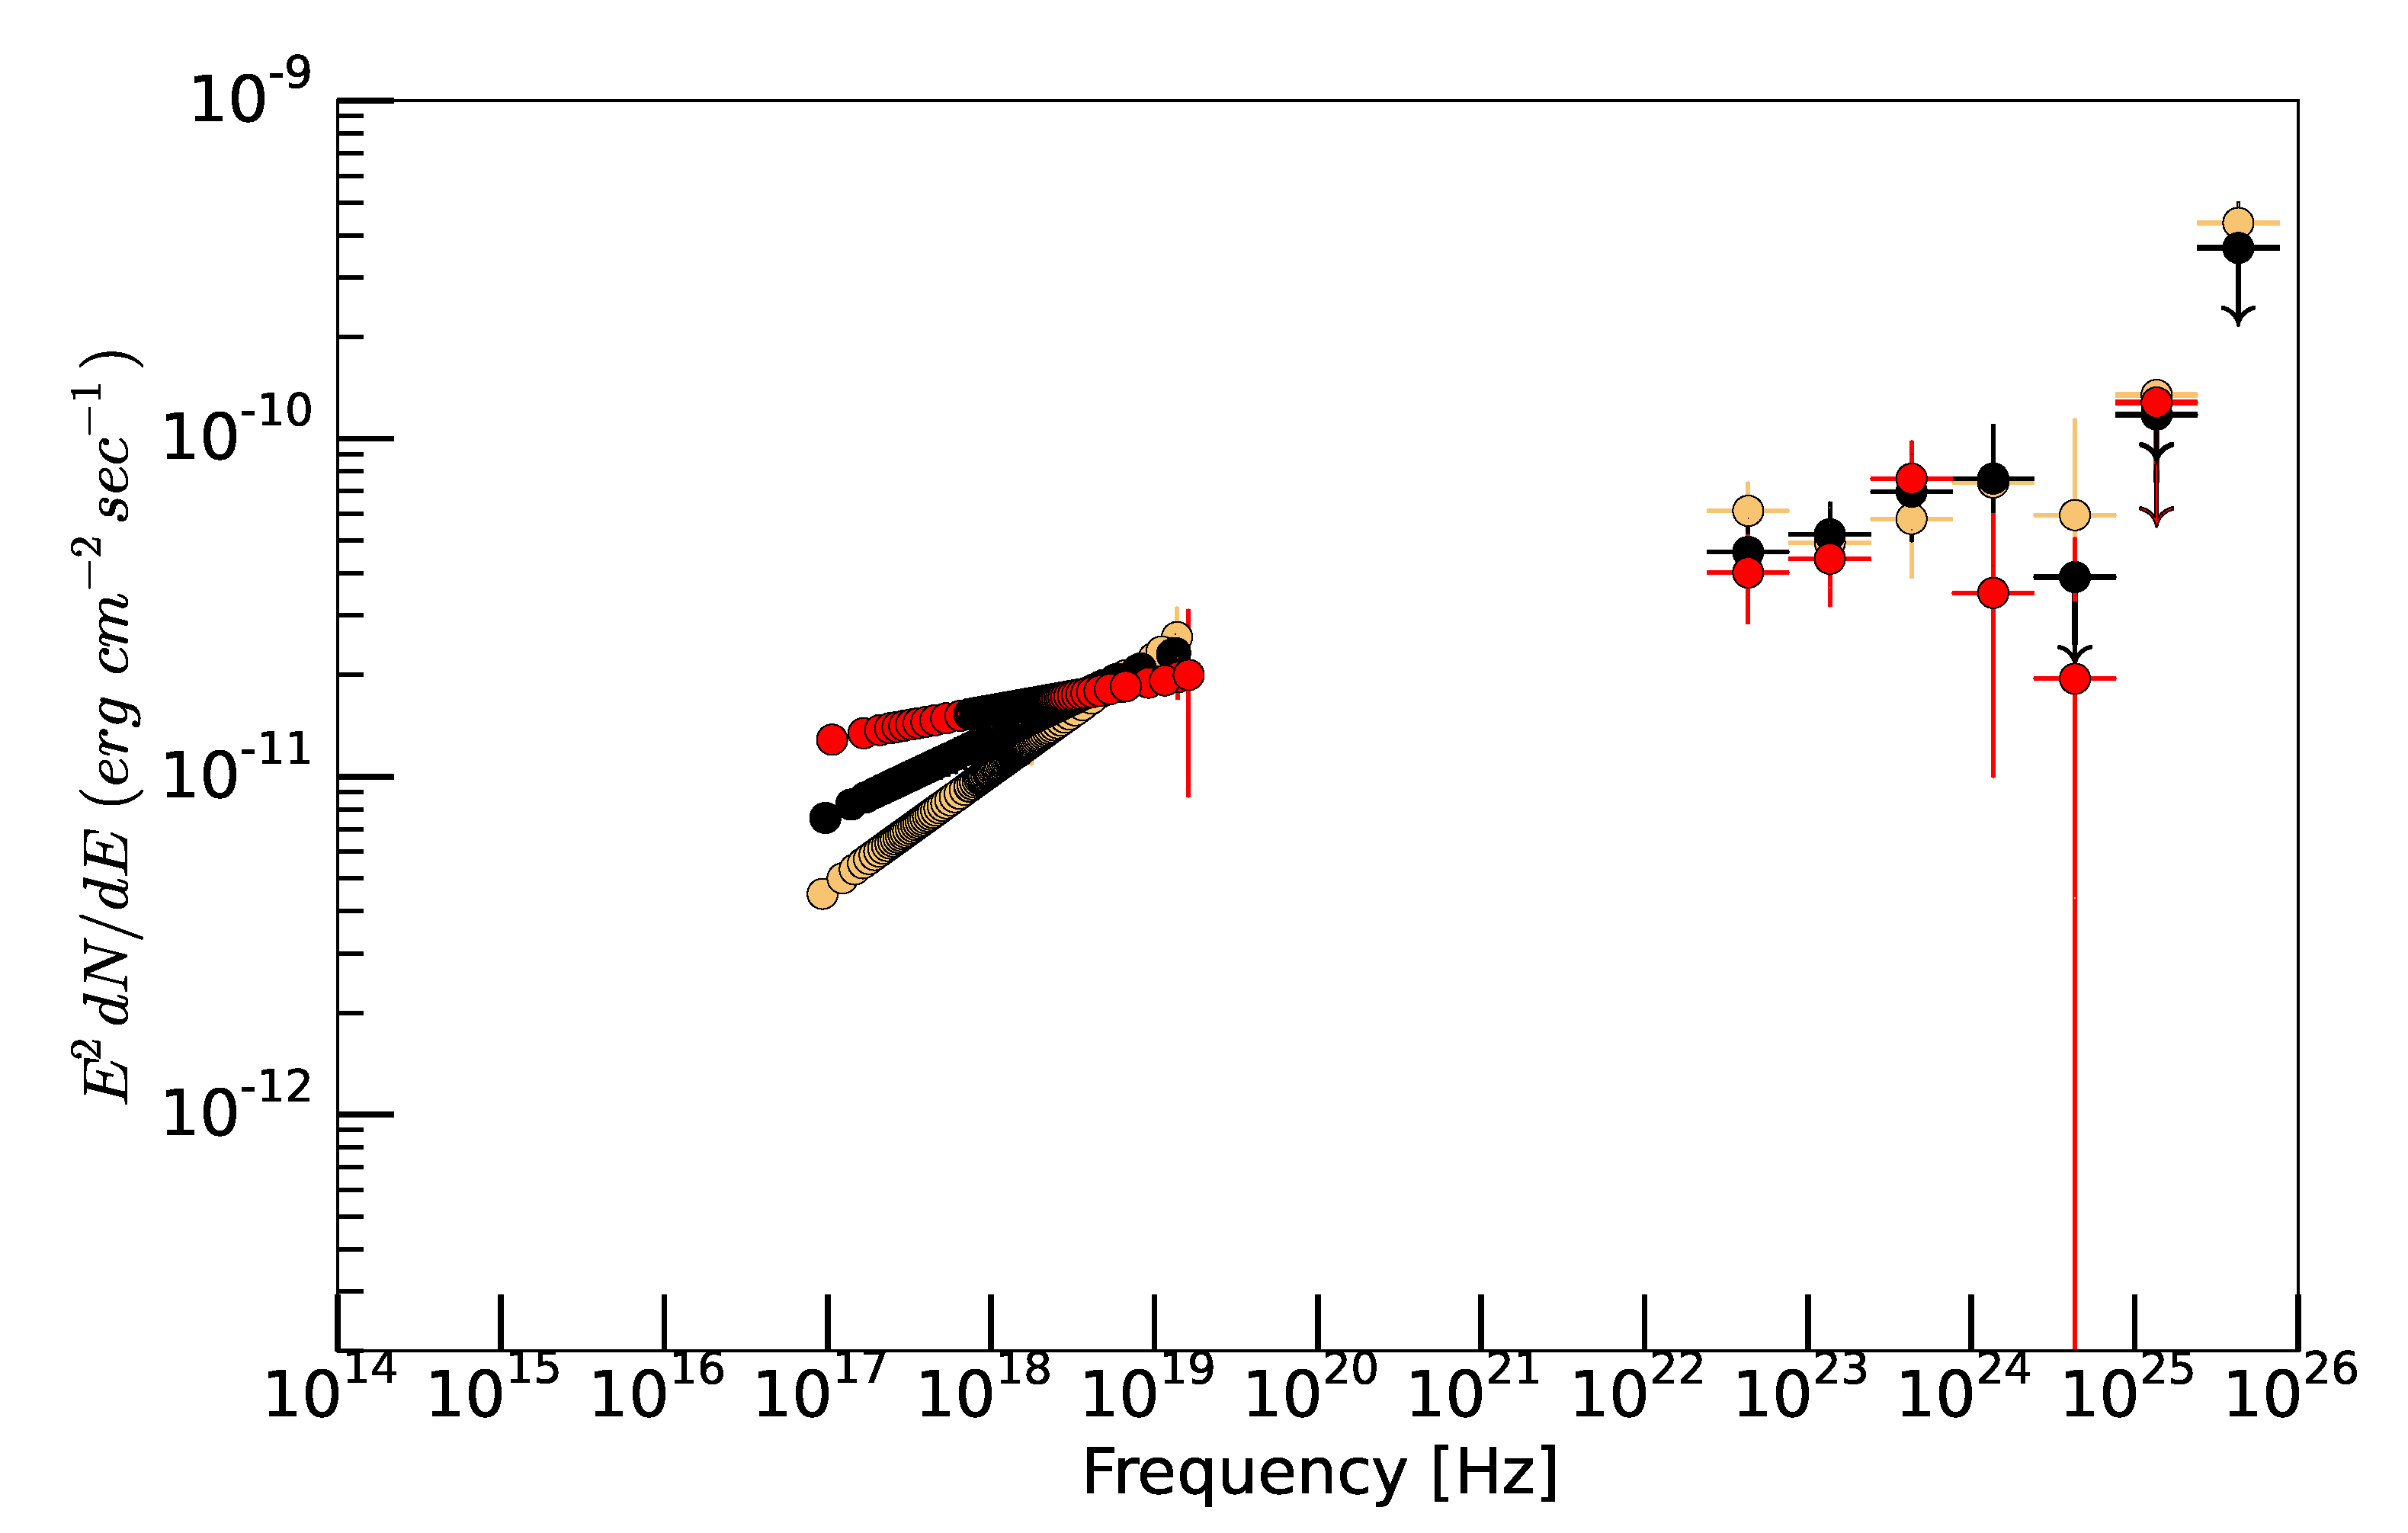
5.2. Spectral Shape and Multiwaveband SED

X-ray spectra from XRT-NuSTAR obtained on three occasions have been fitted with a combination of apec and powerlaw along with the line of sight absorption. Powerlaw indices are found to be 1.65 ± 0.06, 1.77 ± 0.06 and 1.91 ± 0.05 for observations carried out in 2015 November, 1 February 2017 and 4 February 2017, respectively. The spectrum seems to have softened between these observations. Powerlaw indices obtained here are consistent with the values of 1.52 ± 0.08 (25 February 2016), 1.75 ± 0.12 (30 December 2016) and 1.77 ± 0.17 (1 January 2017) reported by [32] based on XRT data alone. Rani et al. [12] have reported powerlaw indices of 1.85 + 0.12 0.14 and 1.90 + 0.11 0.13 based on NuSTAR data alone for 1 February 2017 and 4 February 2017 respectively. Figure 7 shows the multiwaveband SED for the three observations by XRT-NuSTAR along with the quasi-simultaneous spectral measurements from Fermi-LAT. Here X-ray SED corresponds to power-law component of the fit carried out with tbabs(apec+powerlaw) model to XRT-NuSTAR data. During all three occasions, X-ray and gamma-ray data appears to cover second peak of SED, normally attributed to inverse Comptonization of low energy photons with energetic electrons. There are a few wide band SEDs of NGC 1275 presented in the literature. First one is from [32] reporting SEDs on three occasions using XRT and Fermi-LAT data. Here, X-ray and gamma-ray spectra cover the second peak of SED. Another SED is from [33] covering a wide band from radio to very high energy (VHE) gamma-rays. During one of the epochs corresponding to quiescent state, the X-ray spectrum from Chandra covering the energy range of 0.5–9.5 keV has been used and it is found to correspond to the region in the first peak of SED attributed to Synchrotron emission from energetic electrons. Photon index of Chandra data is 2.11 ± 0.16 and this spectrum is located very close to the valley between the two peaks. In XRT-NuSTAR fitting carried out by us, we also attempted to use spectral shapes like broken powerlaw in order to see whether 0.3–70 keV XRT-NuSTAR spectrum covers two sides of the valley. We found the spectrum to be consistent with a single powerlaw with the value of the index below 2.0 indicating that it is located in the rising portion of the second peak. A possible reason could be the shift in SED between quiescent state when Chandra’s observation was carried out and flare state when observations presented in this paper were carried out.

5.3. Spectral Evolution

Brighter when the harder trend is prevalent in blazars but softening in the spectrum with the increase of the flux hints that external photon field may also play a role in the emission, and particles may cool by radiation through external Compton mechanism. The XRT-NuSTAR observations do not show a clear trend between flux and spectrum in the present observations. On the contrary, Fermi-LAT has demonstrated a hint of softer when brighter trend, as shown from Table 3. Moreover, Fermi-LAT spectra was also found to be curved during a few high activity states, as shown in Table 3. The curved spectra and hint of softer when brighter trends suggest that the external photon field may also contribute to emission. The softer when brighter trend may originate if hard X-ray photons and gamma-ray photons originate through external Compton from photons of BLR and torus. The TeV emission from NGC 1275 poses strong constraints on the location of the emission zone if the presence of BLR is confirmed. We believe that the variability of radio galaxy NGC 1275 at X-ray and gamma-ray flux is due to direct particle injection from the jet’s base.

6. Conclusions

The variability study of the X-ray emission from the NGC 1275 is not as straightforward as the soft X-ray band (2–10 keV) is overwhelmed by the cluster emission. Here we have presented a method to spectrally decouple the cluster and AGN emission using imaging X-ray detectors. Our results show that the hard X-ray emission, associated with the AGN, shows a low variability (∼15–30%) on different time scales from 0.01–60 days. On the contrary, the gamma-ray emission shows a high degree of variability (40–50%) on time scales of 1–10 days. NGC 1275 had shown an hour scale variability a few times in the past [32], suggesting that nonthermal emission might have been originated very close to the black hole in the jet. Generally, it is believed that if the particles are accelerated through shocks in the blazar jets showing a harder when brighter trend through the SSC process. However, NGC 1275 does not show significantly harder for the brighter trend in our observations of interest. So this behaviour is not aligned with the well known harder when brighter trends observed in the blazars. This may indicate that emission is originated in the strong cooling regime. There is a possibility that the external photon field, such as either BLR or torus, may also contribute to the emission process. However, this result should require more study and observations. The X-ray and γ -ray emissions might have originated through the SSC process, and particles are injected from the base of the jet in the NGC 1275. The present study was carried out for the flare state. In the future, it can be extended to the quiescent state to get insight into X-ray and γ -ray emissions from the central object.

Author Contributions

V.C. and A.S. conceived the idea, analysed the multiwavelength data, carried out timing and spectral analyses and wrote the initial manuscript. All co-authors contributed to the paper with involvement at various stages. All authors reviewed, discussed and commented on the present results and the manuscript. All authors have read and agreed to the published version of the manuscript.

Funding

This research received no external funding.

Acknowledgments

This research has made use of the data and software obtained from NASA’s High Energy Astrophysics Science Archive Research Center (HEASARC), a service of Goddard Space Flight Center and the Smithsonian Astrophysical Observatory. Also the usage of XRT Data Analysis Software (XRTDAS) developed under the responsibility of the ASI Science Data Center (ASDC), Italy and the NuSTAR Data Analysis Software (NuSTARDAS) jointly developed by the ASI Science Data Center (ASDC), Italy and California Institute of Technology (Caltech), USA, is gratefully acknowledged. Enrico, a community developed Python package to simplify Fermi-LAT analysis has been used. MAXI data provided by RIKEN, JAXA and the MAXI team and INTEGRAL as well as RXTE-ASM data from INTEGRAL Science Data Centre (ISDC) was used. V.C. and A.S. thank A.R. Rao for his valuable suggestions, which improved the manuscript significantly. We also thank the anonymous reviewers for their suggestions and comments, which helped us to improve the manuscript significantly.

Conflicts of Interest

The authors declare no conflict of interest.

References

  1. Falco, E.E.; Kurtz, M.J.; Geller, M.J.; Huchra, J.P.; Peters, J.; Berlind, P.; Mink, D.J.; Tokarz, S.P.; Elwell, B. The Updated Zwicky Catalog (UZC). Publ. Astron. Soc. Pac. 1999, 111, 438–452. [Google Scholar] [CrossRef] [Green Version]
  2. Vermeulen, R.C.; Readhead, A.C.S.; Backer, D.C. Discovery of a nuclear counterjet in NGC 1275: A new way to probe the parsec-scale environment. Astrophys. J. 1994, 430, L41–L44. [Google Scholar] [CrossRef]
  3. Nagai, H.; Suzuki, K.; Asada, K.; Kino, M.; Kameno, S.; Doi, A.; Inoue, M.; Kataoka, J.; Bach, U.; Hirota, T.; et al. VLBI Monitoring of 3C 84 (NGC 1275) in Early Phase of the 2005 Outburst. PASJ 2010, 62, L11–L15. [Google Scholar] [CrossRef] [Green Version]
  4. Nagai, H.; Orienti, M.; Kino, M.; Suzuki, K.; Giovannini, G.; Doi, A.; Asada, K.; Giroletti, M.; Kataoka, J.; D’Ammando, F.; et al. VLBI and single-dish monitoring of 3C 84 for the period 2009–2011. Mon. Not. R. Astron. Soc. Lett. 2012, 423, L122–L126. [Google Scholar] [CrossRef] [Green Version]
  5. Martin, P.G.; Thompson, I.B.; Maza, J.; Angel, J.R.P. The polarization of Seyfert galaxies. Astrophys. J. 1983, 266, 470–478. [Google Scholar] [CrossRef]
  6. Punsly, B.; Marziani, P.; Bennert, V.N.; Nagai, H.; Gurwell, M.A. Revealing the Broad Line Region of NGC 1275: The Relationship to Jet Power. Astrophys. J. 2018, 869, 2. [Google Scholar] [CrossRef] [Green Version]
  7. Yamazaki, S.; Fukazawa, Y.; Sasada, M.; Itoh, R.; Nishino, S.; Takahashi, H.; Takaki, K.; Kawabata, K.S.; Yoshida, M.; Uemura, M. X-ray and Optical Monitoring of a Gamma-Ray-Emitting Radio Galaxy, NGC 1275. Publ. Astron. Soc. Jpn. 2013, 65, 30. [Google Scholar] [CrossRef]
  8. Angel, J.R.P.; Stockman, H.S. Optical and infrared polarization of active extragalactic objects. Annu. Rev. Astron. Astrophys. 1980, 18, 321–361. [Google Scholar] [CrossRef]
  9. Churazov, E.; Forman, W.; Jones, C.; Böhringer, H. XMM-Newton Observations of the Perseus Cluster. I. The Temperature and Surface Brightness Structure. Astrophys. J. 2003, 590, 225–237. [Google Scholar] [CrossRef] [Green Version]
  10. Balmaverde, B.; Capetti, A.; Grandi, P. The Chandra view of the 3C/FR I sample of low luminosity radio-galaxies. Astron. Astrophys. 2006, 451, 35–44. [Google Scholar] [CrossRef]
  11. Ajello, M.; Rebusco, P.; Cappelluti, N.; Reimer, O.; Böhringer, H.; Greiner, J.; Gehrels, N.; Tueller, J.; Moretti, A. Galaxy Clusters in the Swift/Burst Alert Telescope Era: Hard X-rays in the Intracluster Medium. Astrophys. J. 2009, 690, 367–388. [Google Scholar] [CrossRef]
  12. Rani, B.; Madejski, G.M.; Mushotzky, R.F.; Reynolds, C.; Hodgson, J.A. NuStar View of the Central Region of the Perseus Cluster. Astrophys. J. Lett. 2018, 866, L13. [Google Scholar] [CrossRef] [Green Version]
  13. Abdo, A.A.; Ackermann, M.; Ajello, M.; Asano, K.; Baldini, L.; Ballet, J.; Barbiellini, G.; Bastieri, D.; Baughman, B.M.; Bechtol, K.; et al. Fermi Discovery of Gamma-ray Emission from NGC 1275. Astrophys. J. 2009, 699, 31–39. [Google Scholar] [CrossRef]
  14. Aleksić, J.; Alvarez, E.A.; Antonelli, L.A.; Antoranz, P.; Asensio, M.; Backes, M.; De Almeida, U.B.; Barrio, J.A.; Bastieri, D.; González, J.B.; et al. Detection of very-high energy γ-ray emission from NGC 1275 by the MAGIC telescopes. Astron. Astrophys. 2012, 539, L2. [Google Scholar] [CrossRef]
  15. Mirzoyan, R. MAGIC detection of a giant flaring activity from NGC 1275 at very-high-energy gamma rays. ATel 2017, 9929, 1. [Google Scholar]
  16. Aleksić, J.; Ansoldi, S.; Antonelli, L.A.; Antoranz, P.; Babic, A.; Bangale, P.; De Almeida, U.B.; Barrio, J.A.; González, J.B.; Bednarek, W.; et al. Contemporaneous observations of the radio galaxy NGC 1275 from radio to very high energy γ-rays. Astron. Astrophys. 2014, 564, A5. [Google Scholar] [CrossRef] [Green Version]
  17. Mukherjee, R.; VERITAS Collaboration. VERITAS detection of the radio galaxy NGC 1275 with elevated very-high-energy gamma-ray emission. ATel 2017, 9931. [Google Scholar]
  18. Verrecchia, F.; Pittori, C.; Chen, A.W.; Bulgarelli, A.; Tavani, M.; Lucarelli, F.; Giommi, P.; Vercellone, S.; Pellizzoni, A.; Giuliani, A.; et al. An updated list of AGILE bright γ-ray sources and their variability in pointing mode. Astron. Astrophys. 2013, 558, A137. [Google Scholar] [CrossRef] [Green Version]
  19. Lucarelli, F.; Pittori, C.; Verrecchia, F.; Vercellone, S.; Bulgarelli, A.; Tavani, M.; Munar-Adrover, P.; Minervini, G.; Piano, G.; Ursi, A.; et al. AGILE confirmation of enhanced gamma-ray activity from NGC 1275. ATel 2017, 9934. [Google Scholar]
  20. Fukazawa, Y.; Shiki, K.; Tanaka, Y.; Itoh, R.; Takahashi, H.; Imazato, F.; D’Ammando, F.; Ojha, R.; Nagai, H. X-ray and GeV Gamma-Ray Variability of the Radio Galaxy NGC 1275. Astrophys. J. 2018, 855, 93. [Google Scholar] [CrossRef]
  21. Atwood, W.B.; Abdo, A.A.; Ackermann, M.; Althouse, W.; Anderson, B.; Axelsson, M.; Baldini, L.; Ballet, J.; Band, D.L.; Barbiellini, G.; et al. The Large Area Telescope on the Fermi Gamma-Ray Space Telescope Mission. Astrophys. J. 2009, 697, 1071–1102. [Google Scholar] [CrossRef] [Green Version]
  22. Sanchez, D.A.; Deil, C. Enrico: A Python package to simplify Fermi-LAT analysis. arXiv 2013, arXiv:1307.4534S. [Google Scholar]
  23. Burrows, D.N.; Hill, J.E.; Nousek, J.A.; Kennea, J.A.; Wells, A.; Osborne, J.P.; Abbey, A.F.; Beardmore, A.; Mukerjee, K.; Short, A.D.T.; et al. The Swift X-ray Telescope. Space Sci. Rev. 2005, 120, 165–195. [Google Scholar] [CrossRef]
  24. Harrison, F.A.; Craig, W.W.; Christensen, F.E.; Hailey, C.J.; Zhang, W.W.; Boggs, S.E.; Stern, D.; Cook, W.R.; Forster, K.; Giommi, P.; et al. The Nuclear Spectroscopic Telescope Array (NuSTAR) High-energy X-ray Mission. Astrophys. J. 2013, 770, 103. [Google Scholar] [CrossRef] [Green Version]
  25. Asplund, M.; Grevesse, N.; Sauval, A.J.; Scott, P. The Chemical Composition of the Sun. Annu. Rev. Astron. Astrophys. 2009, 47, 481–522. [Google Scholar] [CrossRef] [Green Version]
  26. Nishino, S.; Fukazawa, Y.; Hayashi, K.; Nakazawa, K.; Tanaka, T. Study of the Large-Scale Temperature Structure of the Perseus Cluster with Suzaku. Publ. Astron. Soc. Jpn. 2010, 62, 9–18. [Google Scholar] [CrossRef] [Green Version]
  27. Ezawa, H.; Yamasaki, N.Y.; Ohashi, T.; Fukazawa, Y.; Hirayama, M.; Honda, H.; Kamae, T.; Kikuchi, K.I.; Shibata, R. ASCA Observations of the Temperature Structure and Metal Distribution in the Perseus Cluster of Galaxies. Publ. Astron. Soc. Jpn. 2001, 53, 595–604. [Google Scholar] [CrossRef]
  28. Schmidt, R.W.; Fabian, A.C.; Sanders, J.S. Chandra temperature and metallicity maps of the Perseus cluster core. Mon. Not. R. Astron. Soc. 2002, 337, 71–78. [Google Scholar] [CrossRef] [Green Version]
  29. Chitnis, V.R.; Pendharkar, J.K.; Bose, D.; Agrawal, V.K.; Rao, A.R.; Misra, R. X-ray Variability of Active Galactic Nuclei in the Soft and Hard X-ray Bands. Astrophys. J. 2009, 698, 1207–1220. [Google Scholar] [CrossRef]
  30. Vaughan, S.; Edelson, R.; Warwick, R.S.; Uttley, P. On characterizing the variability properties of X-ray light curves from active galaxies. Mon. Not. R. Astron. Soc. 2003, 345, 1271–1284. [Google Scholar] [CrossRef]
  31. Beckmann, V.; Barthelmy, S.D.; Courvoisier, T.J.L.; Gehrels, N.; Soldi, S.; Tueller, J.; Wendt, G. Hard X-ray variability of active galactic nuclei. Astron. Astrophys. 2007, 475, 827–835. [Google Scholar] [CrossRef] [Green Version]
  32. Baghmanyan, V.; Gasparyan, S.; Sahakyan, N. Rapid Gamma-Ray Variability of NGC 1275. Astrophys. J. 2017, 848, 111. [Google Scholar] [CrossRef] [Green Version]
  33. Tanada, K.; Kataoka, J.; Arimoto, M.; Akita, M.; Cheung, C.C.; Digel, S.W.; Fukazawa, Y. The Origins of the Gamma-Ray Flux Variations of NGC 1275 Based on Eight Years of Fermi-LAT Observations. Astrophys. J. 2018, 860, 74. [Google Scholar] [CrossRef] [Green Version]
Figure 1. Fermi LAT 10-day binned light curve in the energy range 0.1–300 GeV covering nine years of data (2008 August–2017 August). Epochs for observations carried out with NuSTAR are marked by vertical dashed red lines.These observations are carried out on 3 November 2015, 1 February 2017 and 4 February 2017.
Galaxies 08 00063 g001
Figure 2. Top panel: XRT and NuSTAR data, from circular region with radius 1’ centred on the location of the source, fitted with tbabs(apec + powerlaw) for data from 3 November 2015 observations. Bottom panel: residuals in terms of sigmas. In both the panels, red and green datasets correspond to NuSTAR FPMA and FPMB, respectively.
Galaxies 08 00063 g002
Figure 3. XRT and NuSTAR unfolded data and model for the 3 November 2015 observations. Apec and powerlaw contributions for XRT and NuSTAR are marked. XRT data and model are shown in black, NuSTAR FPMA in red and NuSTAR FPMB in green color. Shift between model components for XRT and NuSTAR is due to relative normalization introduced to account for cross-calibration between XRT and NuSTAR. Apec contributes significantly at energies below 20 keV. Powerlaw dominates at higher energies.
Galaxies 08 00063 g003
Figure 4. Cluster temperature as a function of average radius of annular region for spectral fit with tbabs(apec+powerlaw). Results obtained from fitting only XRT (marked by diamonds), NuSTAR (triangles) and combined XRT-NuSTAR spectrum (asterisks) are shown for data collected on 3 November 2015. Results from NuSTAR fit for 2017 February 1 and 4 data are shown in blue and red colours, respectively.
Galaxies 08 00063 g004
Figure 5. Fractional powerlaw flux as a function of average radius of annular region for XRT-NuSTAR combined fit for 3 November 2015 data (marked by diamonds and connected with black continuous line), only NuSTAR data for 3 November 2015 (marked by plus sign and connected with dashed black line), only NuSTAR data for 1 February 2017 (marked by triangle and connected with dash-dotted blue line) and only NuSTAR data for 4 February 2017 (marked by asterisk and connected by dash-three dotted red line).
Galaxies 08 00063 g005
Figure 6. NuSTAR light curves for the energy range 20–60 keV from data collected in 3 November 2015 (top panel), 1 February 2017 (middle panel) and 4 February 2017 (bottom panel). Light curves are binned over 1000 s.
Galaxies 08 00063 g006
Figure 7. X-ray and Fermi-LAT SEDs for epochs covering XRT-NuSTAR observations in 3 November 2015 (yellow), 1 February 2017 (black), 4 February 2017 (red). Downward arrows shown with some of the Fermi-LAT points indicate upper limits.
Galaxies 08 00063 g007
Figure 8. One day binned Fermi-LAT light curve in the energy range of 0.1–300 GeV during 1 November 2015–22 April 2016 (top panel) and 28 December 2016–15 February 2017 (bottom panel).
Galaxies 08 00063 g008
Table 1. Log of X-ray observations of NGC1275. PC: photon counting, WT: widowed timing mode.
Data SetInstrumentObservation ModeObservation Date and TimeMJDObservation Duration (s)
1XRTPCStart: 2015-11-03 03:59:5957,329.166415
End: 2015-11-03 09:14:5557,329.39
NuSTARScienceStart: 2015-11-03 03:21:0857,329.1419,874
End: 2015-11-03 14:21:0857,329.60
4XRTWTStart: 2017-02-01 18:04:5157,785.751657
End: 2017-02-01 18:32:5657,785.77
NuSTARScienceStart: 2017-02-01 13:56:0957,785.5822,366
End: 2017-02-02 02:31:0957,786.10
5XRTWTStart: 2017-02-04 17:51:3357,788.741580
End: 2017-02-04 19:25:5657,788.81
NuSTARScienceStart: 2017-02-04 04:06:0357,788.1728,168
End: 2017-02-04 19:31:0957,788.81
Table 2. Relative contribution to flux from the Perseus cluster and AGN for XRT-NuSTAR combined fit. XRT-NuSTAR combined fit is carried out for 3 November 2015 data whereas for 2017 February observations, only NuSTAR data are used.
RegionApecApec FluxPowerlaw FluxEnergy where ApecEnergy where Apec
kT@ 10 keV@ 10keVFlux = Powerlawflux = 10% Powerlaw
FluxFlux
(keV)(ph/cm 2 /s/keV)(ph/cm 2 /s/keV)(keV)(keV)
3 November 2015
0’–1’3.91 ± 0.067.56 × 10 5 8.71 × 10 5 9.519.3
1’–2’4.12 ± 0.041.48 × 10 4 2.30 × 10 5 18.328.2
2’–3’4.64 ± 0.061.56 × 10 4 4.37 × 10 6 28.140.0
3’–4’5.00 ± 0.051.38 × 10 4 5.66 × 10 8 54.066.8
1 February 2017
0’–1’3.98 ± 0.087.81 × 10 5 9.83 × 10 5 8.919.5
1’–2’4.24 ± 0.051.57 × 10 4 2.25 × 10 5 19.329.7
2’–3’4.61 ± 0.061.60 × 10 4 4.49 × 10 6 28.740.6
3’–4’5.13 ± 0.111.41 × 10 4 7.38 × 10 6 27.340.1
4 February 2017
0’–1’4.14 ± 0.077.80 × 10 5 9.97 × 10 5 8.719.9
1’–2’4.10 ± 0.041.44 × 10 4 2.92 × 10 5 17.828.3
2’–3’4.52 ± 0.051.53 × 10 4 1.31 × 10 5 23.134.8
3’–4’5.09 ± 0.081.39 × 10 4 7.66 × 10 6 27.440.3
Table 3. Parameters from broad-band spectral fits to the active galactic nucleus (AGN) and cluster data with model constant*tbabs(apec + powerlaw) for XRT-NuSTAR for circular region with radius 1’ around the source. Model parameters were tied and relative normalization was used between XRT and NuSTAR given by the parameter ’constant’.
Observation Date2015 November 31 February 20174 February 2017
constant (for XRT)1.152.271.83
constant (for NuSTAR)1.01.01.0
TBabs (N H in 10 22 cm 2 )0.17 ± 0.010.15 ± 0.0100.18 ± 0.01
Apec kT (keV)3.90 ± 0.083.93 ± 0.084.01 ± 0.08
Apec abundance0.51 ± 0.030.54 ± 0.030.55 ± 0.04
Apec norm(6.7 ± 0.2) × 10 2 (6.7 ± 0.3) × 10 2 (5.9 ± 0.3) × 10 2
powerlaw index1.65 ± 0.061.77 ± 0.061.91 ± 0.05
powerlaw norm(4.0 ± 0.8) × 10 3 (5.9 ± 1.2) × 10 3 (8.7 ± 1.5) × 10 3
Reduced χ 2 /dof1.04/10671.02/11001.05/1052
Table 4. Hard X-ray and gamma-ray spectral measurements from NuSTAR and Fermi-LAT, respectively.
Observation PeriodNuSTAR Energy Range (keV)ModelHard X-ray Powerlaw IndexHard X-ray flux 20–60 keV (erg cm 2  s 1 )Fermi-LAT Logparabola α Fermi-LAT Logparabola β Fermi-LAT 0.1–300 GeV Flux (ph cm 2 s 1 )
3 November 201520–60po only1.97 ± 0.102.32 × 10 11 2.01 ± 0.100.003 ± 0.045.8 × 10 7
3–70apec+po1.64 ± 0.072.43 × 10 11 - -
1 February 201720–60po only1.92 ± 0.112.35 × 10 11 1.86 ± 0.110.08 ± 0.044.9 × 10 7
3–70apec+po1.75 ± 0.072.37 × 10 11 - -
4 February 201720–60po only2.17 ± 0.102.04 × 10 11 1.82 ± 0.140.09 ± 0.064.1 × 10 7
3–70apec+po1.83 ± 0.032.15 × 10 11 - -
Table 5. X-ray and gamma-ray variability on various time scales.
InstrumentEnergy Range Used (keV)Poowerlawi Flux FractionObservation Duration (MJD)Time Scale (Days)No. of PointsVariability Strength (%)
RXTE-ASM1.5–120.2850,087–55,9241419317.8 ± 0.5
50,087–55,924301634.6 ± 0.4
MAXI2–200.36355,058–58,0931181215.8 ± 0.6
55,058–58,08830764.0 ± 0.6
Swift-BAT15–500.95753,414–58,00313924<318
53,414–57,9993013125.2 ± 3.5
53,414–58,004606620.0 ± 3.3
NuSTAR20–600.98857,329.14–57,329.600.0120<17.4
57,785.58–57,786.100.012515.6 ± 7.0
57,788.17–57,788.810.0130<25.1
INTEGRAL-ISGRI17.3–800.98352,701–57,30519130.7 ± 6.5
52,701–57,321302727.0 ± 5.8
Fermi-LAT0.1–300 GeV 57,327–57,500117440.9 ± 4.7
57,750–57,79915050.3 ± 8.2
54,687–58,1071034352.9 ± 2.3

