Article

Surface Brightness Plateau in S4G Galaxies

1
Independent Researcher, London NW8, UK
2
Independent Researcher, Glenview, IL 60025, USA
*
Author to whom correspondence should be addressed.
Galaxies 2020, 8(2), 48; https://doi.org/10.3390/galaxies8020048
Submission received: 7 May 2020 / Revised: 29 May 2020 / Accepted: 3 June 2020 / Published: 6 June 2020

Abstract

:
Using 3.6-μm data from 2112 galaxies, we show that, contrary to widely held expectations of a continuous steep decline, radial surface brightness profiles of galaxies tend to flatten and form extended plateaus beyond 27–28 magAB/arcsec2. This phenomenon could be explained by the presence of extended stellar populations dominated by low-mass stars in galactic outskirts. The flattening of radial brightness profiles questions the artificial exponential extrapolations of brightness data and the automatic assumption that light always declines considerably faster than mass density, presenting an empirical challenge for the dark matter hypothesis.

1. Introduction

It is widely expected that, luminosity declines faster than mass density in galaxies as one moves from the center towards the periphery. This assumption served as one of the roots of the idea of non-baryonic dark matter and remains a cornerstone of the popularity of the dark matter paradigm [1,2,3,4,5].
The assumption that light continues to decline exponentially at the galactic periphery at a constantly steep rate is implicitly reflected in regularly made artificial extensions of galactic surface brightness profiles beyond empirical observation radii (e.g., for mass-luminosity analysis of galaxies). In some cases, steeply declining artificial profiles override and replace photometric data. Examples of surface brightness profile extrapolations are shown in Figure 1.
In a recent paper [7], we suggested that the assumption of continually steep radial light decline might be unwarranted. Our assertion was based on a statistical study of 214 galaxies which demonstrated that the sample average 3.6 μm surface brightness profile flattens after r ≈ 1.1 R271.
In this work, we tested the hypothesis of surface brightness plateau using a much wider galaxy sample. We found that the hypothesis stands. Here, we briefly describe our data and process, present our results, and discuss their relevance.

2. Data and Method

The Spitzer Survey of Stellar Structure in Galaxies (S4G) [8,9,10,11] is one of the largest surveys of galactic light data, including high-resolution mid-infrared (3.6 μm, 4.5 μm) surface brightness profiles for 2352 galaxies2. Spitzer IRAC channel 1 passband centered on 3.6 μm wavelength is regarded as one of the optimal filters for detecting starlight. In this paper, we focused on 3.6 μm to ensure compatibility with our previous work. Analysis of galactic light in 4.5 μm and other filters shall be done separately.
We used the entire set of S4G “1f × 2a” aperture-corrected profiles (3.6 μm, 2 arcsec resolution, fixed ellipticity) excluding only those where surface brightness data falls short of the 27 magAB/arcsec2 threshold. The final sample represents a set of 2112 galaxies with a wide range of morphologies, inclinations (see Figure 2), and other physical properties which were compiled with the use of online galactic databases such as HyperLeda3 and NASA Extragalactic Database (NED)4.
Profiles were converted from magAB/arcsec2 to L,3.6/pc2 (3.6 μm passband solar luminosities per parsec squared) using 10 0.4 ( m 3.6 M , 3.6 21.572 ) conversion formula, where m 3.6 is the apparent surface brightness in magAB/arcsec2, M , 3.6 is the solar absolute AB magnitude adopted at 6.066 magAB as per baryons.org5, and the exact value of −21.752 constant equals 5 + 5 × log10 (1 arcsec).
The following data cleaning procedures were applied. We blank-masked all unresolved S4G datapoints (flagged “INDEF” in source files) and the mid-points of implausible 3-datapoint segments where the central point represents an up-spike > ×4 (or a down-spikes < ×0.25) vs. both surrounding L⊙,3.6/pc2 values. The resulting gaps were then filled with local 2-datapoint exponential fit interpolations. To further reduce peripheral noise, we computed rolling standard deviation starting from the middle of each surface brightness profile to identify the first radial point at with volatility exceeds 0.2, and then applied an outward rolling mean average smoothing from the identified radius, with the smoothing box size set at 10% of the datapoint count.
Inclination correction was applied to all galaxies except ellipticals (Hubble type T ≤ −4). Viewing angles under 70° were compensated with straightforward cos(i) correction, whilst for higher inclinations, the correction factor was set as the ratio of true total luminosity (based on the outermost total magnitude and heliocentric distance) and of apparent surface brightness integrated over an area of a circle with a radius equal to the semimajor axis of the apparent galactic oval.
Considering that all profiles are of different length (in terms of arcsec radii r) and correspond to galaxies of different physical sizes, we used R27 as the common denominator for representing radial distances in r/R27 units, to enable comparison and aggregation of individual galaxy profiles. R27 marks the area within which Spitzer IRAC Channel 1 sensitivity stays relatively high and is a useful common basis for aggregating radial profiles of different galaxies.
Figure 3 shows individual inclination-corrected surface brightness profiles (in L⊙,3.6/pc2) of 2112 S4G galaxies superimposed and plotted against radii in r/R27 units.
We then produced a composite surface profile for 2112 galaxies using radial bin averaging. All individual profiles were cut into radial bins of 0.1 R27 width and all data points falling within each bin were averaged to a single value (in physical L/pc2 units then converted to magAB/arcsec2). We then estimated the rate of decline at different segments of the composite profile and compared the findings with previous measurements.

3. Results

As shown in Figure 4a, the composite profile of 2112 galaxies forms a flat plateau beyond an inflection point at r ≈ 1.2 R27. Light declines steeply until the inflection point, with a linear gradient of ≈ +7.3 magAB/arcsec2 per Δr = 1 R27 radial interval. Beyond the inflection point, the gradient shrinks to a mere 0.2. Using a “hockey stick” geometrical metaphor, a steep “shaft” is followed by a flat “blade”.
This pattern agrees well, along both axes, with our previously reported finding of a surface brightness plateau in the Spitzer 3.6 μm surface brightness profile aggregated for a sample of 214 galaxies (see Figure 4a).
To make sure the plateau is not a statistical effect of some galaxies having shorter profiles (see Figure 4b) and not participating in the “blade” segment of the composite profile, we carved out 193 galaxies with individual surface brightness profiles reaching at least to r ≈ 1.6 R27. The average profile for this group of galaxies, also shown in Figure 4a, closely tracks the full sample profile.

4. Discussion

The results presented above are consistent with our earlier findings based on 214 galaxies [7], despite the difference in datasets. The galaxy sample analyzed in this paper is over 10 times the size of the previous study, which rules out the possibility that the earlier reported pattern was an idiosyncratic feature of a smaller sample. The flattening is visible and is confirmed numerically by a significant drop in the profile gradient (from 7.3 to 0.2 magAB/arcsec2 per Δr = 1 R27 radial interval). Instead of the widely anticipated continually steep decline, we see a “hockey stick” with distinctive “blade” starting to form beyond r ≈ R27 and reaching a plateau after r = 1.2 R27.
The finding presented earlier and confirmed here is important in the context of dark matter analysis on galactic scales, especially in studies comparing the distribution of galactic mass against the distribution of light. The composite surface mass density profile for a sample of 214 galaxies presented in our earlier study [7] shows a gradient of decline comparable, beyond r ≈ R27, with that of 3.6 μm luminosity, calling for a corresponding plateau in mass-luminosity (M/L) ratios.
The empirical finding is thus problematic for the analytical practice of simply extrapolating exponential profiles of inner parts of galactic disks and suggests that the assumption of a consistent steep radial decline of brightness in galaxies beyond R27 is unwarranted (as it leads to overestimated M/L ratios in outer galactic regions). This poses a problem for the non-baryonic dark matter hypothesis since the effect of the plateau is that it significantly narrows the gap between surface brightness and mass density distributions in the galactic outskirts.
This flattening also lends additional support to our hypothesis of radially declining stellar mass gradient in galaxies, suggesting that high-mass stars tend to be concentrated in denser central areas of galaxies whilst the periphery is dominated by low-mass stars. There is indeed growing evidence of top-heavy stellar mass function in the center of our Galaxy [12,13], and dim extended stellar disks in many galaxies [14,15,16,17].
We conclude with a word of caution. Considering that 27 magAB/arcsec2 is at the cusp of Spitzer telescope capability, findings presented here must be considered tentative and require further testing. Similar checks should be done in multiple passbands using higher-resolution equipment.

Author Contributions

Both authors were equally involved in all aspects of this article from conceptualization and methodology to analysis and writing. All authors have read and agreed to the published version of the manuscript.

Funding

This research received no external funding.

Conflicts of Interest

The authors declare no conflict of interest.

References

  1. Read, J.I.; Gilmore, G. Mass loss from dwarf spheroidal galaxies: The origins of shallow dark matter cores and exponential surface brightness profiles. Mon. Notices R. Astron. Soc. J. 2005, 356, 107–124. [Google Scholar] [CrossRef] [Green Version]
  2. Kranz, T.; Slyz, A.; Rix, H.W. Dark matter within high surface brightness spiral galaxies. Astrophys. J. 2003, 586, 143–151. [Google Scholar] [CrossRef] [Green Version]
  3. Kassin, S.A.; de Jong, R.S.; Pogge, R.W. Dark and Baryonic Matter in Bright Spiral Galaxies. I. Near-Infrared and Optical Broadband Surface Photometry of 30 Galaxies. Astrophys. J. Suppl. Ser. 2006, 162, 80–96. [Google Scholar] [CrossRef] [Green Version]
  4. Dutton, A.A. On the origin of exponential galaxy discs. Mon. Notices R. Astron. Soc. J. 2009, 396, 121–140. [Google Scholar] [CrossRef] [Green Version]
  5. Tamm, A.; Tenjes, P. Structure of visible and dark matter components in spiral galaxies at redshifts z = 0.5–0.9. Astron. Astrophys. 2005, 433, 31–41. [Google Scholar] [CrossRef]
  6. Lelli, F.; McGaugh, S.S.; Schombert, J.M. SPARC: Mass models for 175 disk galaxies with Spitzer photometry and accurate rotation curves. Astron. J. 2016, 152, 157. [Google Scholar] [CrossRef] [Green Version]
  7. Sipols, A.; Pavlovich, A. Dark matter dogma: A study of 214 galaxies. Galaxies 2020, 8, 36. [Google Scholar] [CrossRef]
  8. Querejeta, M.; Meidt, S.E.; Schinnerer, E.; Cisternas, M.; Muñoz-Mateos, J.C.; Sheth, K.; Knapen, J.; Van de Ven, G.; Norris, M.; Peletier, R.; et al. The Spitzer Survey of Stellar Structure in Galaxies (S4G): Precise stellar mass distributions from automated dust correction at 3.6 μm. Astrophys. J. Suppl. Ser. 2015, 219, 5. [Google Scholar] [CrossRef] [Green Version]
  9. Salo, H.; Laurikainen, E.; Laine, J.; Comerón, S.; Gadotti, D.; Buta, R.; Sheth, K.; Zaritsky, D.; Ho, L.; Knapen, J.; et al. The Spitzer Survey of Stellar Structure in Galaxies (S4G): Multi-component decomposition strategies and data release. Astrophys. J. Suppl. Ser. 2015, 219, 4. [Google Scholar] [CrossRef] [Green Version]
  10. Muñoz-Mateos, J.C.; Sheth, K.; Regan, M.; Kim, T.; Laine, J.; Erroz- Ferrer, S.; Gil de Paz, A.; Comeron, S.; Hinz, J.; Laurikainen, E.; et al. The Spitzer Survey of stellar structure in galaxies (S4G): Stellar masses, sizes, and radial profiles for 2352 nearby galaxies. Astrophys. J. Suppl. Ser. 2015, 219, 3. [Google Scholar] [CrossRef] [Green Version]
  11. Buta, R.J.; Sheth, K.; Athanassoula, E.; Bosma, A.; Knapen, J.H.; Laurikainen, E.; Salo, H.; Elmegreen, D.; Ho, L.C.; Zaritsky, D.; et al. A classical morphological analysis of galaxies in the Spitzer survey of stellar structure in galaxies (S4G). Astrophys. J. Suppl. Ser. 2015, 217, 32. [Google Scholar] [CrossRef] [Green Version]
  12. Bartko, H.; Martins, F.; Trippe, S.; Fritz, T.K.; Genzel, R.; Ott, T.; Eisenhauer, F.; Gillessen, S.; Paumard, T.; Alexander, T.; et al. An extremely top-heavy IMF in the galactic center stellar disks. Astrophys. J. 2009, 708, 1. [Google Scholar]
  13. Maness, H.; Martins, F.; Trippe, S.; Genzel, R.; Graham, J.R.; Sheehy, C.; Salaris, M.; Gillessen, S.; Alexander, T.; Paumard, T.; et al. Evidence for a long-standing top-heavy initial mass function in the central parsec of the galaxy. Astrophys. J. 2007, 669, 1024. [Google Scholar] [CrossRef] [Green Version]
  14. Bland-Hawthorn, J.; Vlajić, M.; Freeman, K.C.; Draine, B.T. NGC 300: An extremely faint, outer stellar disk observed to 10 scale lengths. Astrophys. J. 2005, 629, 239. [Google Scholar] [CrossRef]
  15. Ferguson, A.M.; Irwin, M.J.; Ibata, R.A.; Lewis, G.F.; Tanvir, N.R. Evidence for stellar substructure in the halo and outer disk of M31. Astron. J. 2002, 124, 1452. [Google Scholar] [CrossRef] [Green Version]
  16. McConnachie, A.W.; Chapman, S.C.; Ibata, R.A.; Ferguson, A.M.N.; Irwin, M.J.; Lewis, G.F.; Tanvir, N.R.; Martin, N. The stellar halo and outer disk of M33. Astrophys. J. Lett. 2006, 647, L25. [Google Scholar] [CrossRef] [Green Version]
  17. Martinez-Delgado, D.; Pohlen, M.; Gabany, R.J.; Majewski, S.R.; Penarrubia, J.; Palma, C. Discovery of a giant stellar tidal stream around the disk galaxy NGC 4013. Astrophys. J. 2009, 692, 955. [Google Scholar] [CrossRef]
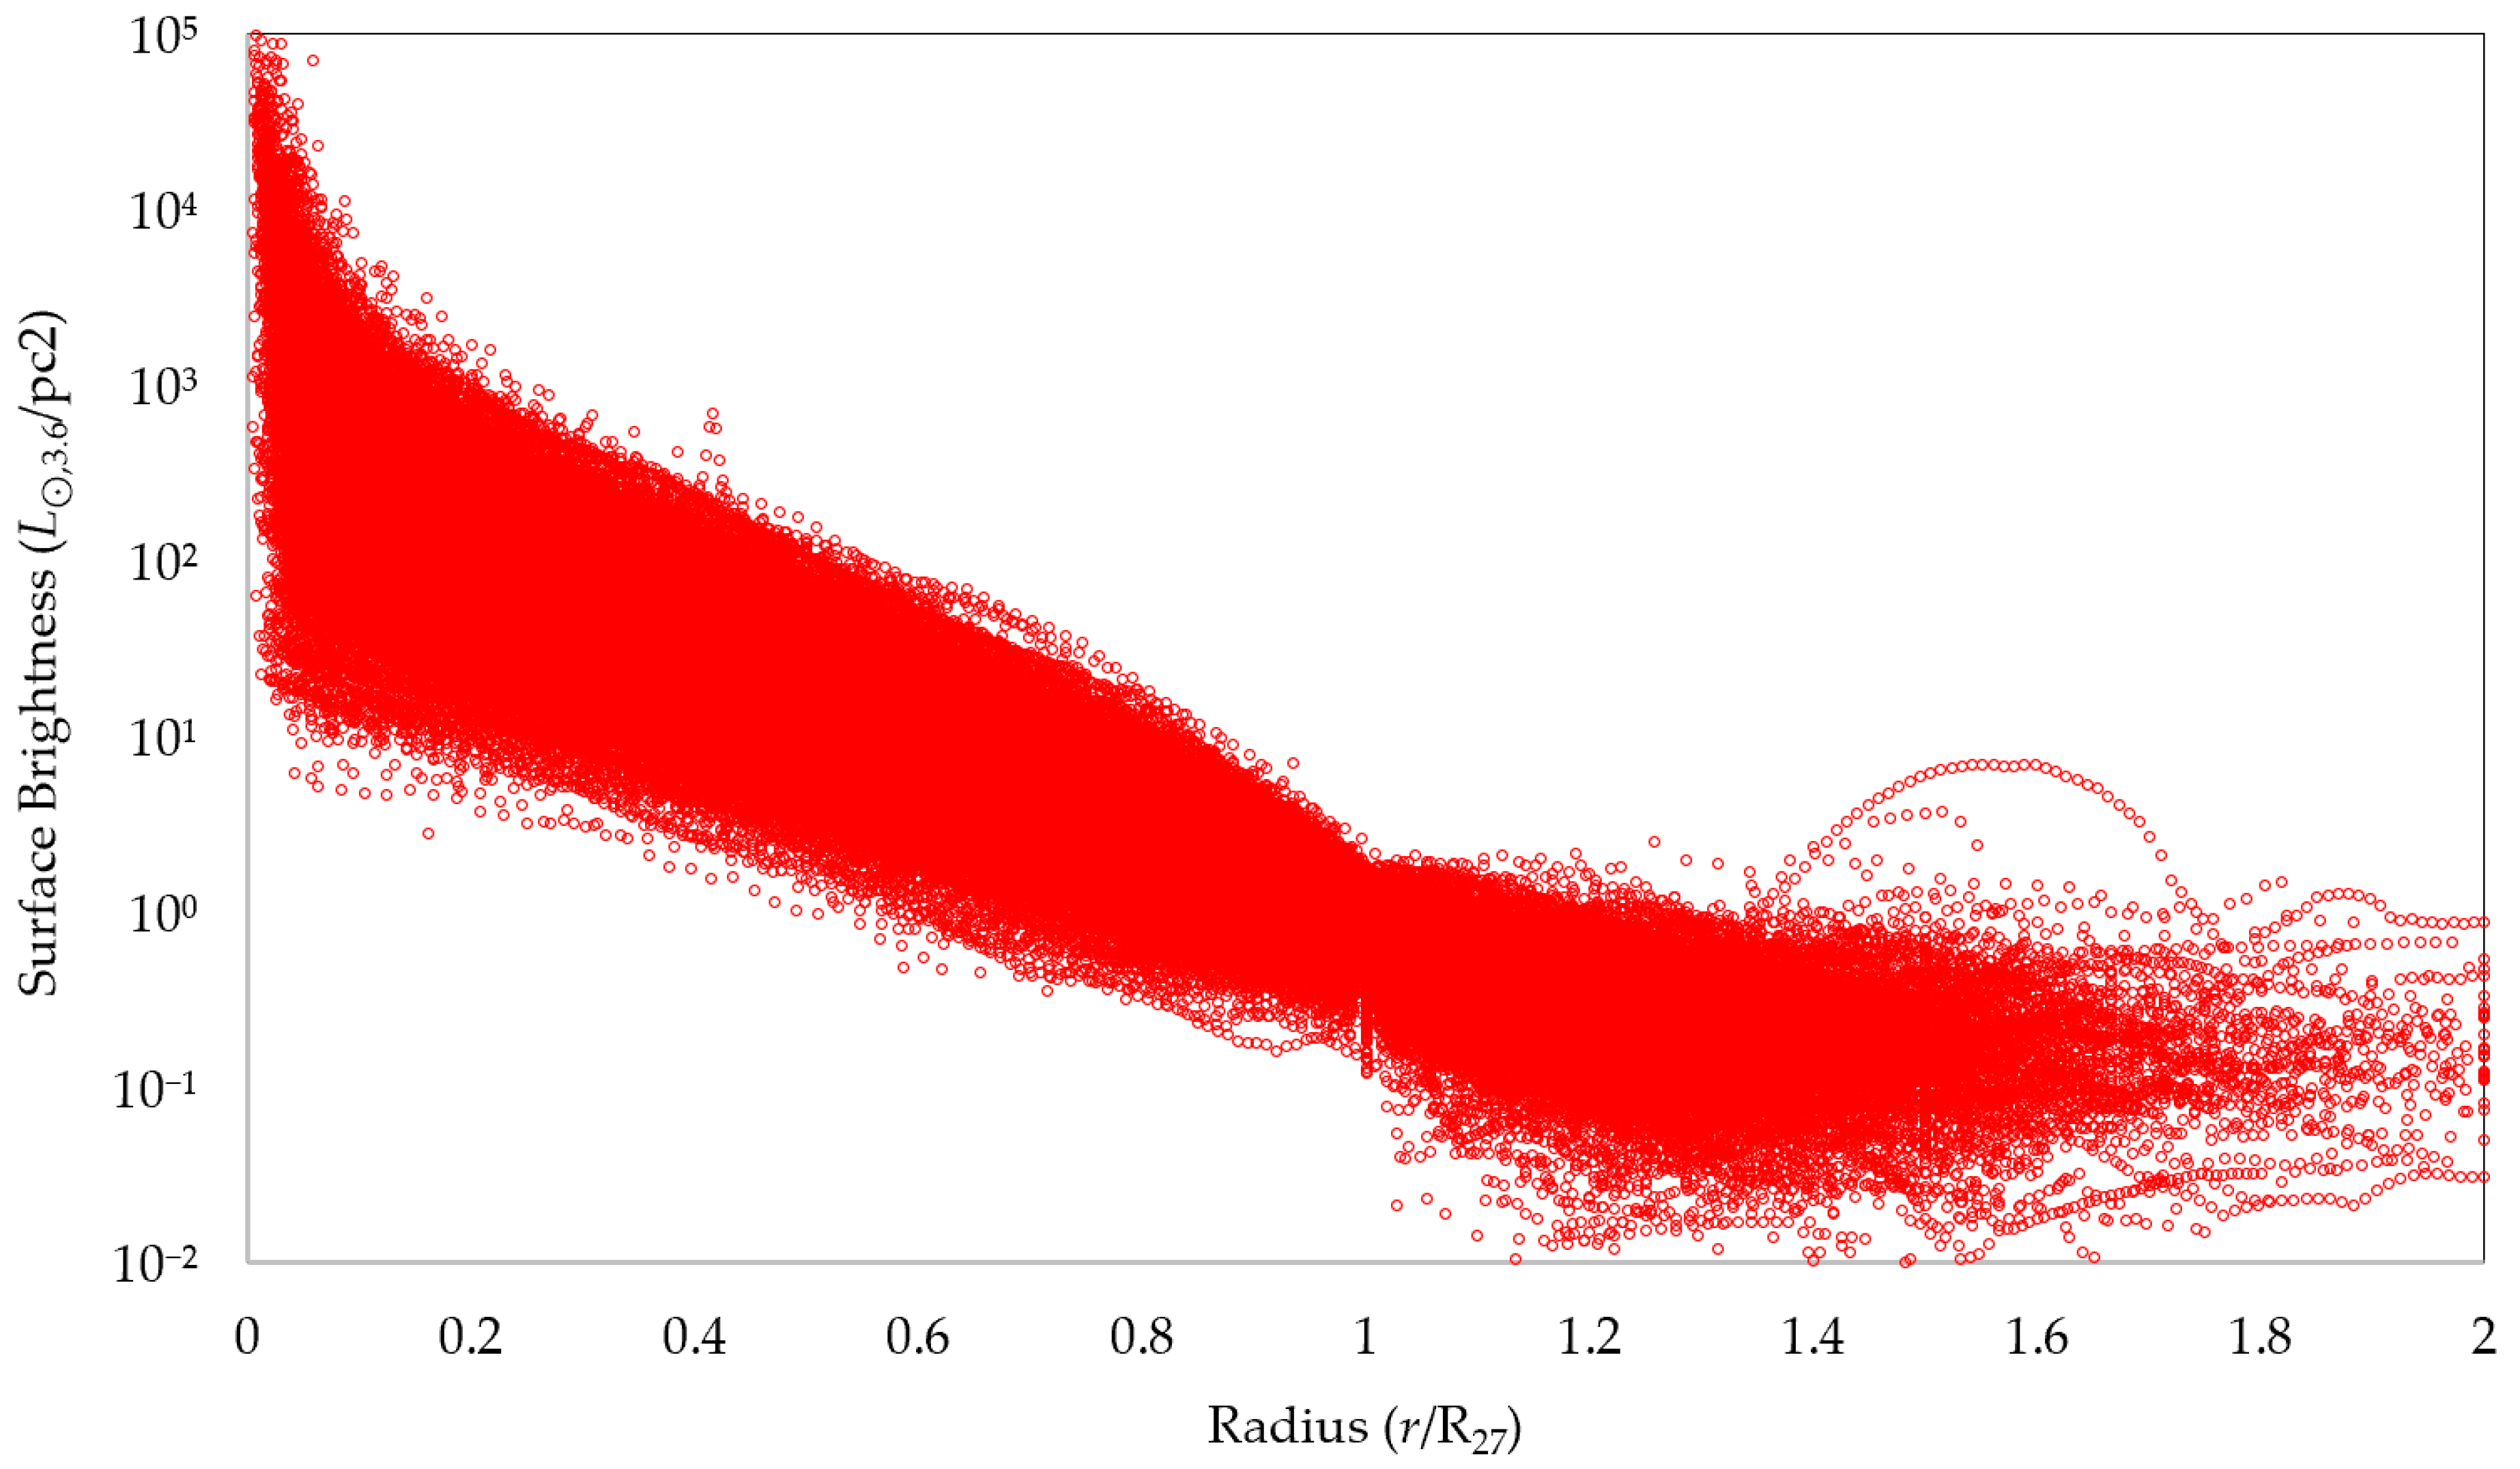
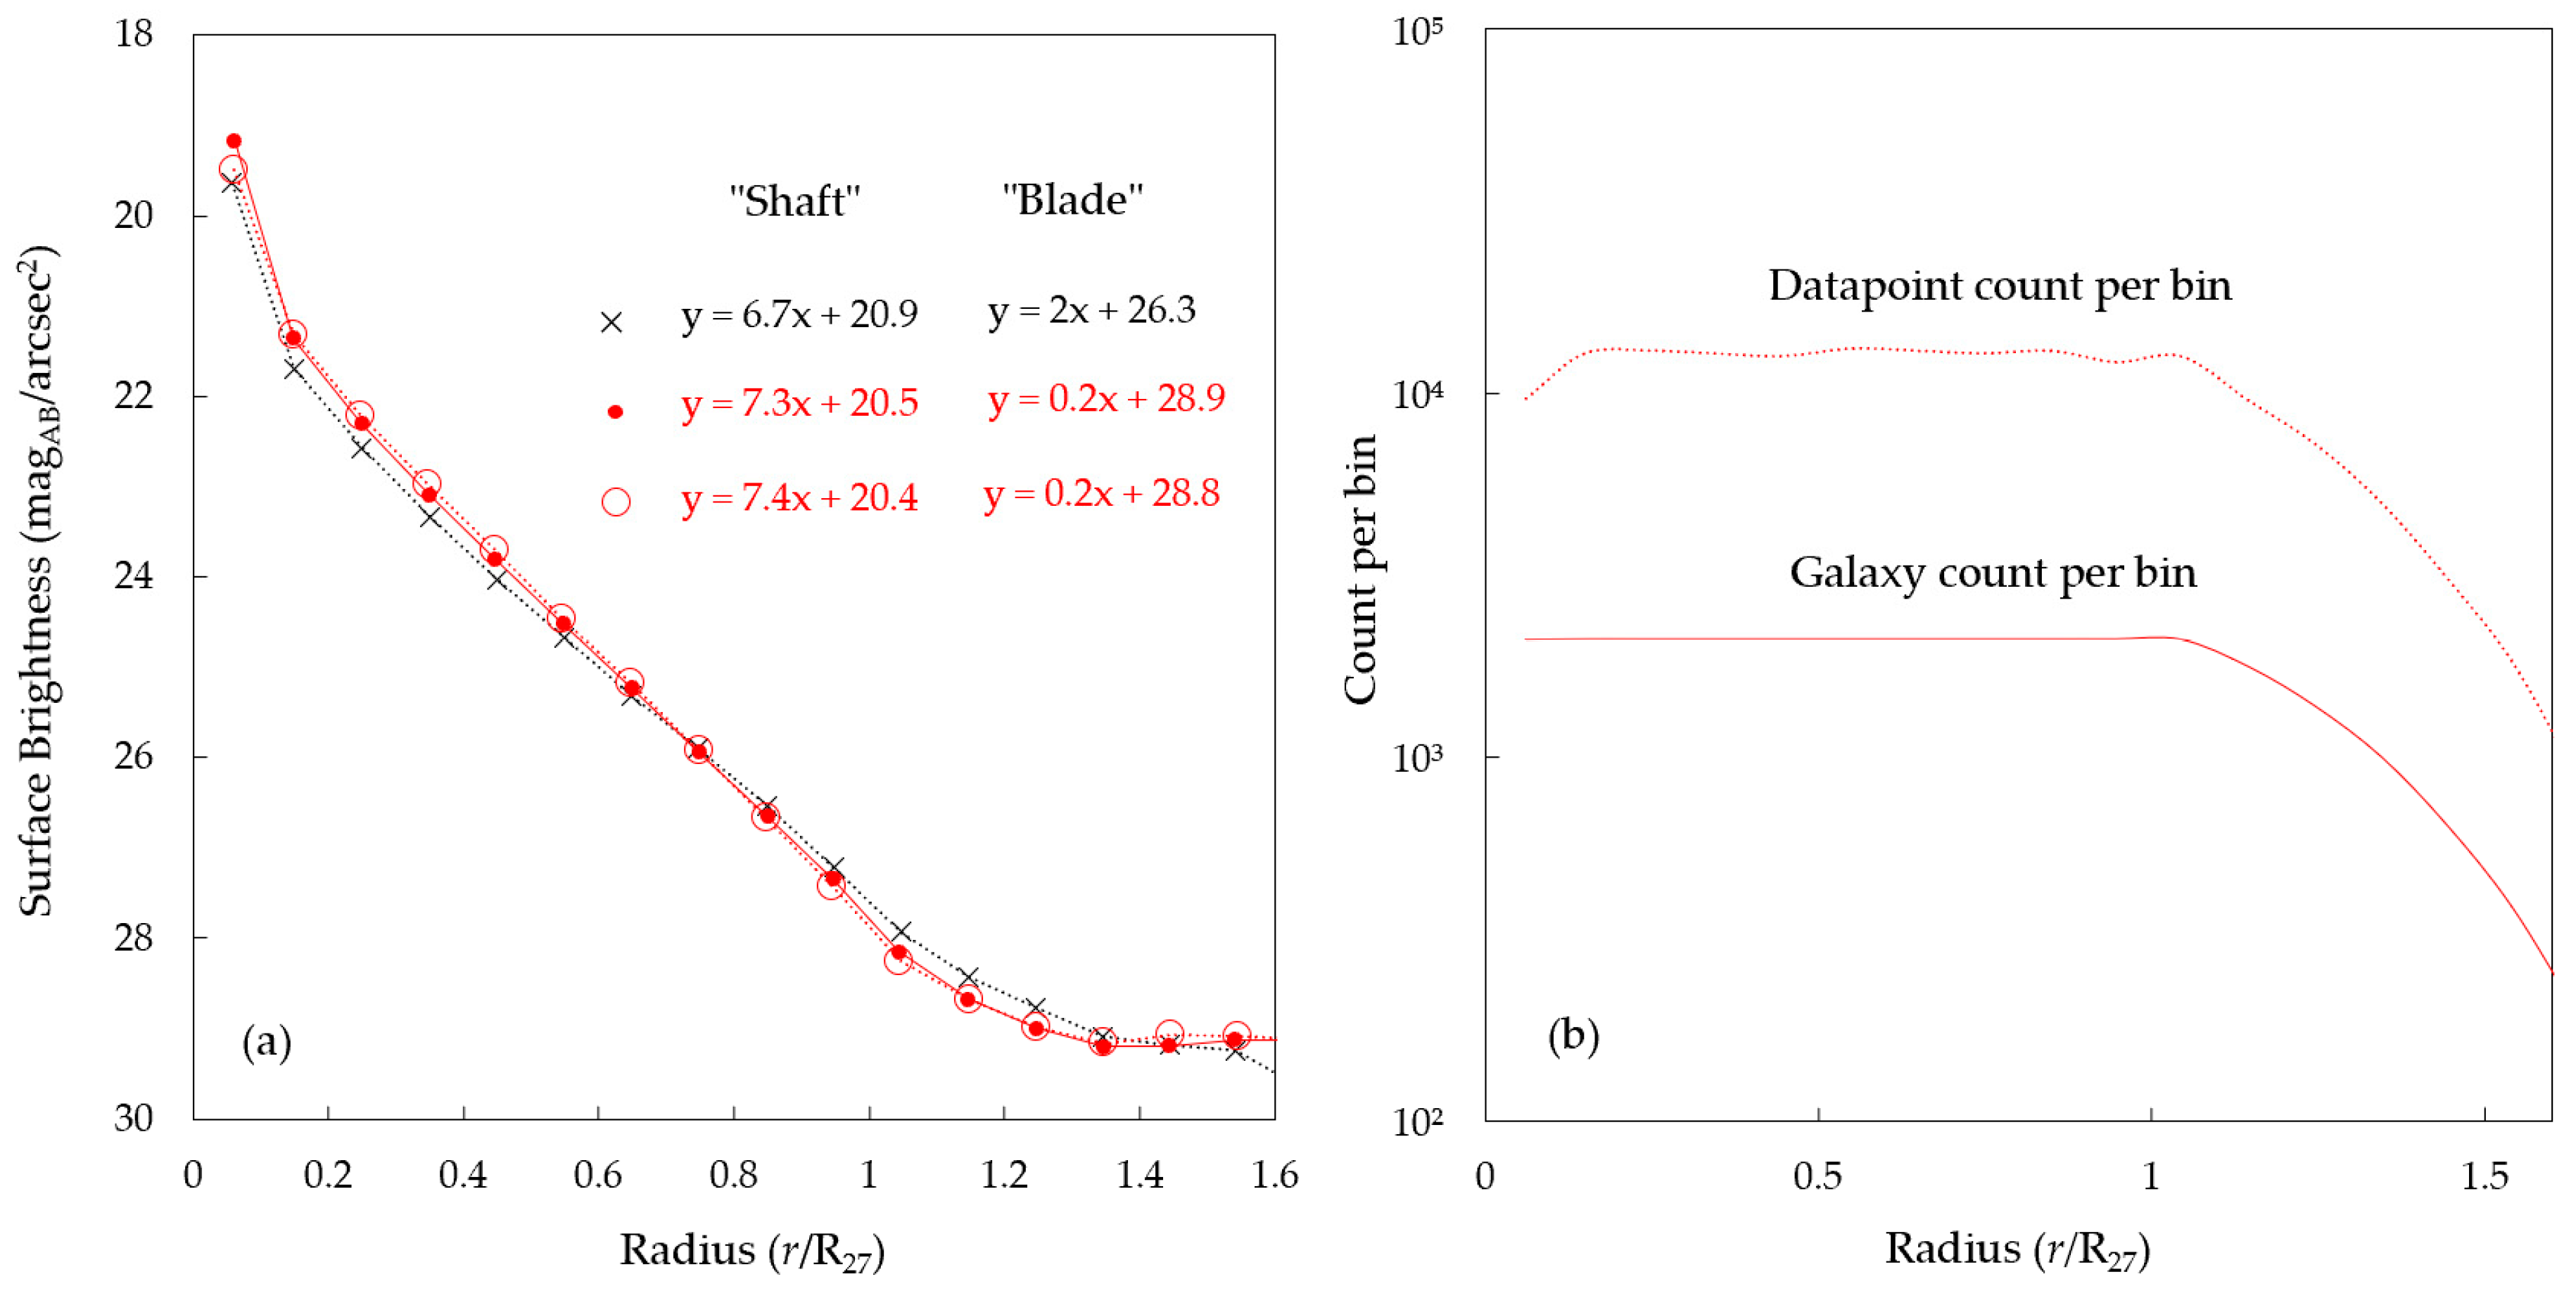
1
R27 is a galactocentric radius at which 3.6 μm surface brightness, as detected by Spitzer IRAC channel 1, first reaches or crosses the level of 27 magAB/arcsec2.
2
3
4
5
Figure 1. Illustrative examples of extended surface brightness profiles in SPARC [6] dataset: NGC667 (a) and UGC03205 (b). Black dashed curves represent inclination-corrected photometric profiles. Solid red curves represent final surface brightness profiles with extrapolations. The Y-Axis is surface brightness in solar luminosities per pc2. The X-Axis is a galactocentric radius in kpc.
Galaxies 08 00048 g001
Figure 2. Red lines represent frequency distribution of basic properties of the sample of 2112 galaxies: (a) Y-Axis represents the number of galaxies; X-Axis represents morphology as specified by Hubble scale. (b) Y-Axis represents the number of galaxies; X-Axis represents the inclination of galactic disk in degrees.
Galaxies 08 00048 g002
Figure 3. Visualization of the sample comprised of 2112 surface brightness profiles of galaxies in Spitzer 3.6 μm passband. The Y-Axis is inclination-corrected surface brightness in physical units (L⊙,3.6/pc2). The X-Axis shows galactocentric radii in multiples of R27. The red dots represent superimposed radial surface brightness profiles of S4G galaxies.
Galaxies 08 00048 g003
Figure 4. Illustration of composite inclination-corrected, bin-averaged surface brightness profiles for three different samples, each resembling a “hockey stick” shape with distinctive steep “shaft” and flat “blade” segments. (a) Y-Axis represents the surface brightness scale in magAB/arcsec2 units. The X-Axis represents a galactocentric radius in multiples of R27. Red solid line with solid circles represents the full sample of 2112 galaxies; the red dotted line with open circles represents a sub-sample of 193 galaxies each of which with light data till 1.6 R27; the black dotted line with crosses represents a sample of 214 galaxies, partially based on S4G and presented in a previous study. Equations for best-fit linear approximations show a significant drop in the rate of decline after r ≈ 1.2 R27 for each of the three groups of galaxies. (b) The statistical basis for the full sample profile is shown in panel (a): red dotted line represents the number of data points falling within each radial bin; the red solid line represents the number of galaxies with data falling within each radial bin.
Galaxies 08 00048 g004

