Review

Debated Models for Galactic Rotation Curves: A Review and Mathematical Assessment

by
Anne M. Hofmeister
* and
Robert E. Criss
Department of Earth and Planetary Science, Washington University, St. Louis, MO 63130, USA
*
Author to whom correspondence should be addressed.
Galaxies 2020, 8(2), 47; https://doi.org/10.3390/galaxies8020047
Submission received: 25 April 2020 / Revised: 26 May 2020 / Accepted: 27 May 2020 / Published: 1 June 2020

Abstract

:
Proposed explanations of galactic rotation curves (RC = tangential velocity vs. equatorial radius, determined from Doppler measurements) involve dramatically different assumptions. A dominant, original camp invoked huge amounts of unknown, non-baryonic dark matter (NBDM) in surrounding haloes to reconcile RC simulated using their Newtonian orbital models (NOMs) for billions of stars in spiral galaxies with the familiar Keplerian orbital patterns of the few, tiny planets in our Solar System. A competing minority proposed that hypothetical, non-relativistic, non-Newtonian forces govern the internal motions of galaxies. More than 40 years of controversy has followed. Other smaller groups, unsatisfied by explanations rooted in unknown matter or undocumented forces, have variously employed force summations, spin models, or relativistic adaptations to explain galactic rotation curves. Some small groups have pursued inverse models and found no need for NBDM. The successes, failures, and underlying assumptions of the above models are reviewed in this paper, focusing on their mathematical underpinnings. We also show that extractions of RC from Doppler measurements need revising to account for the effect of galaxy shape on flux-velocity profiles and for the possible presence of a secondary spin axis. The latter is indicated by complex Doppler shift patterns. Our findings, combined with independent evidence such as hadron collider experiments failing to produce non-baryonic matter, suggest that a paradigm shift is unfolding.

1. Introduction and Background

Motions of stars, planets, and other matter in space have been scrutinized for centuries. Diverse observations involve visible light, due to our intrinsic human capabilities and to photons in this spectral region being easy to quantify, e.g., with photomultiplier tubes. In the past century, the question has repeatedly arisen as to whether material not observable with visible light exists and affects remotely observed motions. The phrase Dark Matter (DM) originated circa 1900 with Poincare’s discussion of a lecture by Kelvin. In the 1930′s, Zwicky called on ordinary baryonic material not luminous in the visible, to explain motions of galaxies in the Coma Cluster. In the decades shortly thereafter, the problem was viewed as a mass discrepancy (see [1]).
The historical definition of DM changed greatly following Rubin and Ford’s [2] discovery that rotation curves (RC = tangential velocity v as a function of equatorial radius r) of Andromeda do not exhibit the familiar (Keplerian) orbital patterns of planets in our Solar System. Many subsequent papers provided similar data and centered on explaining the distributions of mass that could simulate the measured RC profiles. Most researchers accepted the Solar System analogy as valid, despite the recognized fact that the motions of our rather tiny planets are essentially independent of each other, so that the reduced 2-body problem holds. In contrast, galaxies have billions of stars that interact and occupy any given orbital radius (a many body problem), effectively constituting a continuous density distribution. This improper Solar System analogy led to the view that spherical haloes of DM surround spiral galaxies [3]. Because astronomers of this era were using the radio region of the electromagnetic (EM) spectrum to probe H atoms in galaxies, it was clear that the proposed massive haloes could not be ordinary matter. Consequently, haloes inferred from simulations of RC were alleged to consist of non-baryonic dark matter (NBDM), a hypothetical, ad hoc substance that does not interact with light.
Inference of NBDM haloes was immediately contested by an eminent astronomer. G. Burbidge pointed out in 1975 that considering the orbits of dwarf satellite galaxies gave a reasonably mass for the Milky Way galaxy [4]. He stated, “there is no unambiguous dynamical evidence which demonstrates that galaxies have very massive haloes”. Burbidge [4] further pointed out that certain assumptions underlie the formulation then used for the dynamical mass, which is also Min:
M dyn = k r v 2 orbit G   where   k   ~ 1
where G is the gravitational constant, and k obtained during fitting is near unity. Importantly, k = 1 describes the reduced 2-body orbital problem, but not systems with a graded mass distribution.
In 1983 the majority approach, henceforth referred to as NOMs (Newtonian Orbital Models), was challenged by Milgrom [5]. In its simplest form, MOdified Newtonian Dynamics (MOND) recapitulates Equation (1), but assumes that the variable k differs significantly from unity because of a deviation in Newton’s law. Although the majority of astronomers have followed the approach of Rubin, Faber, and others, MOND has garnered significant support from the astronomical community, as demonstrated by a 2015 special issue of the Canadian Journal of Physics [6].
Milgrom’s model continues to draw support primarily because NBDM haloes have not been detected (Section 1.1). However, independent evidence for the proposed force modification, which is unrelated to general relativity, has not been found to our knowledge. Relativistic models for galactic rotation also exist, but involve fewer researchers (e.g., [7]), perhaps due to computational difficulties.
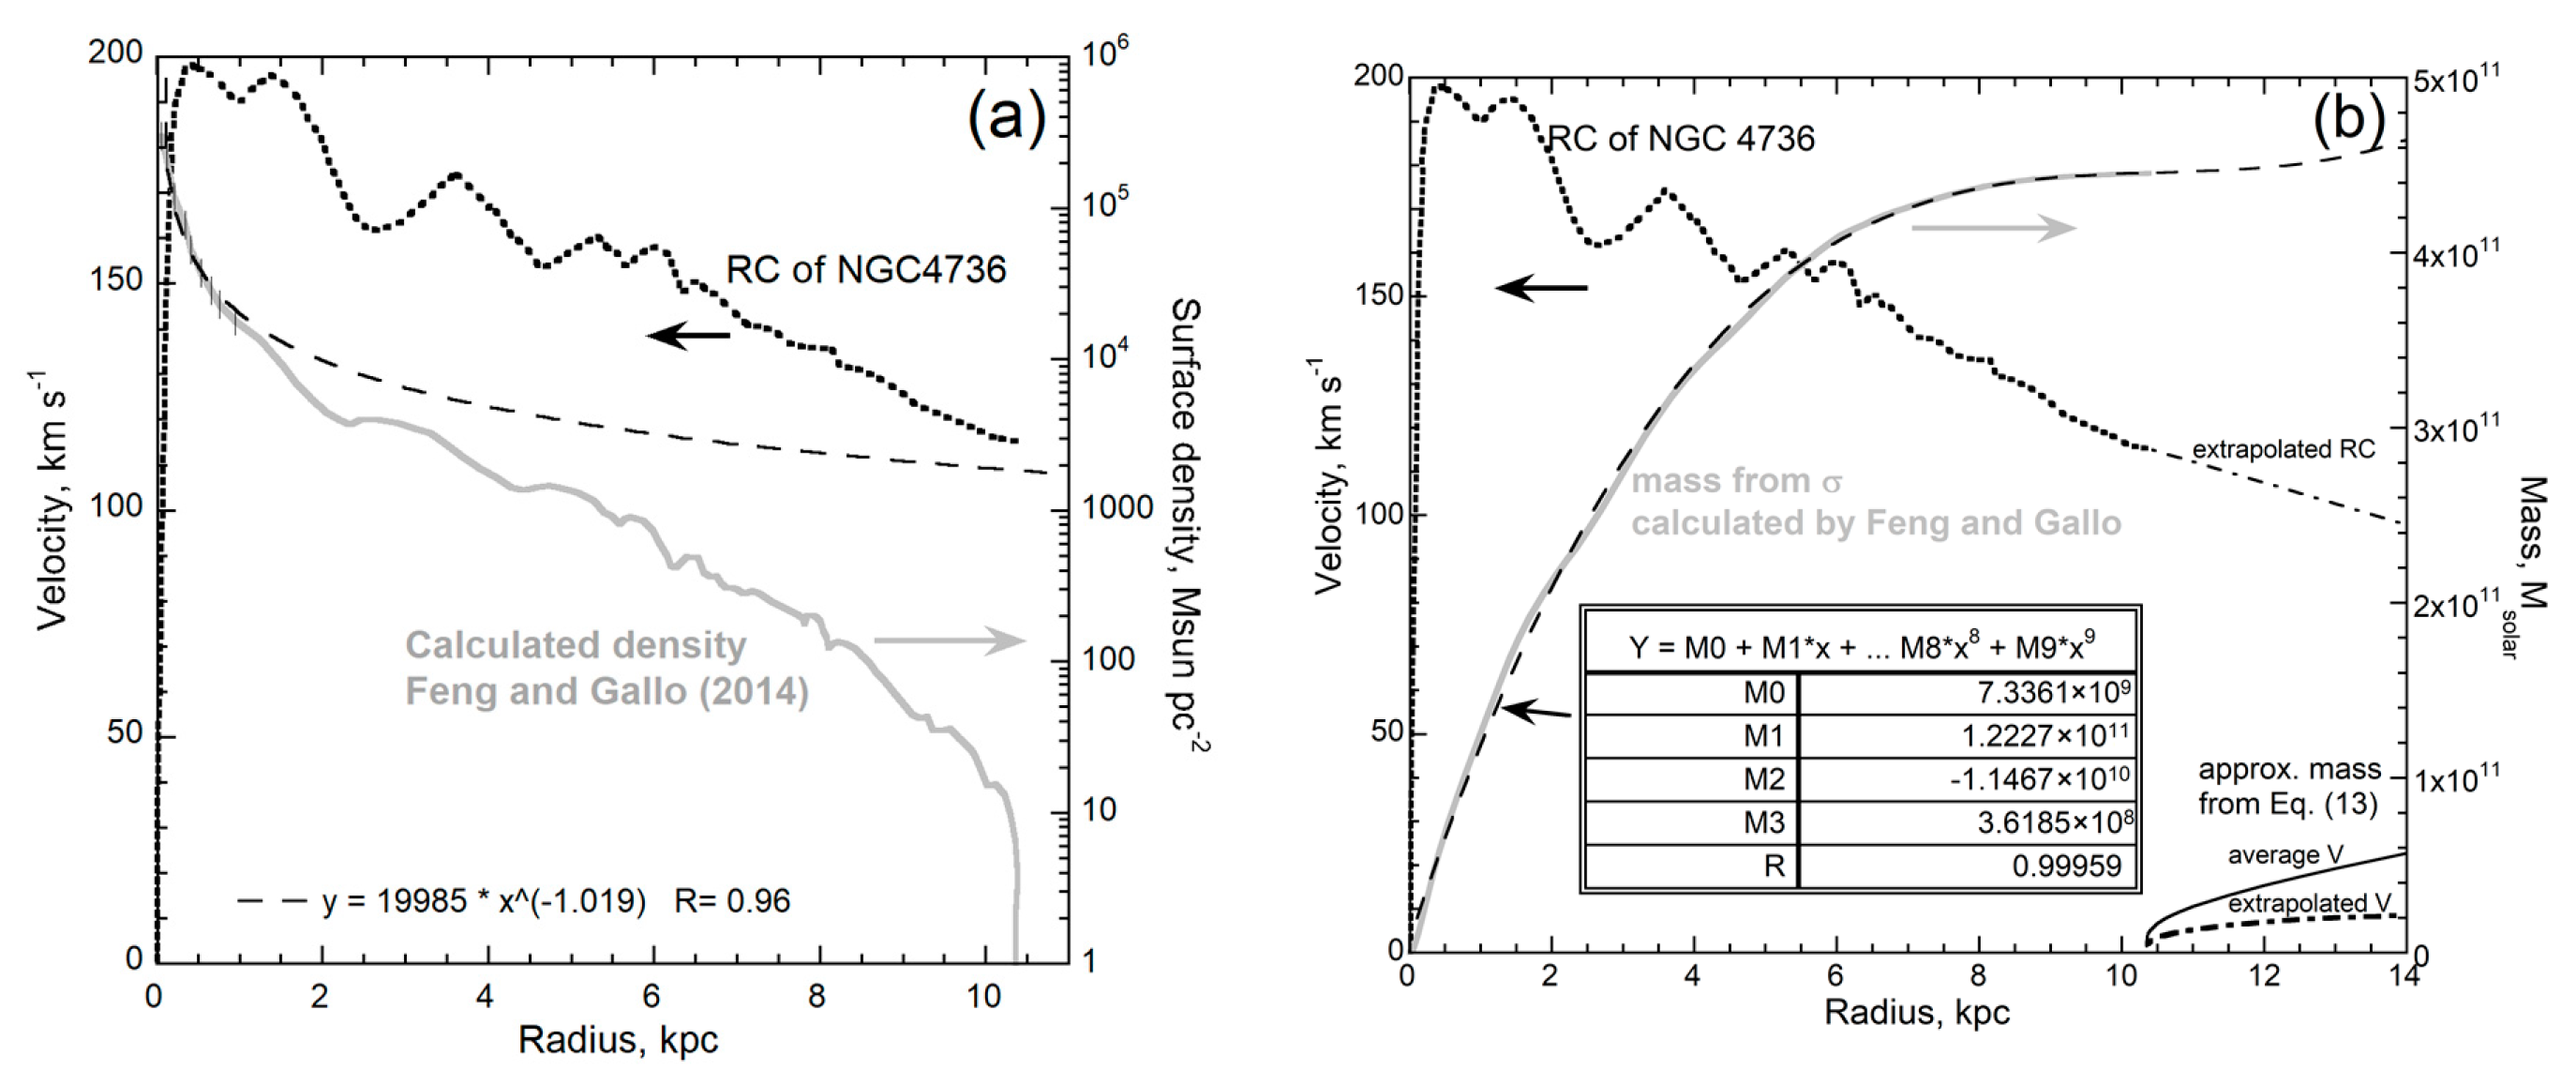
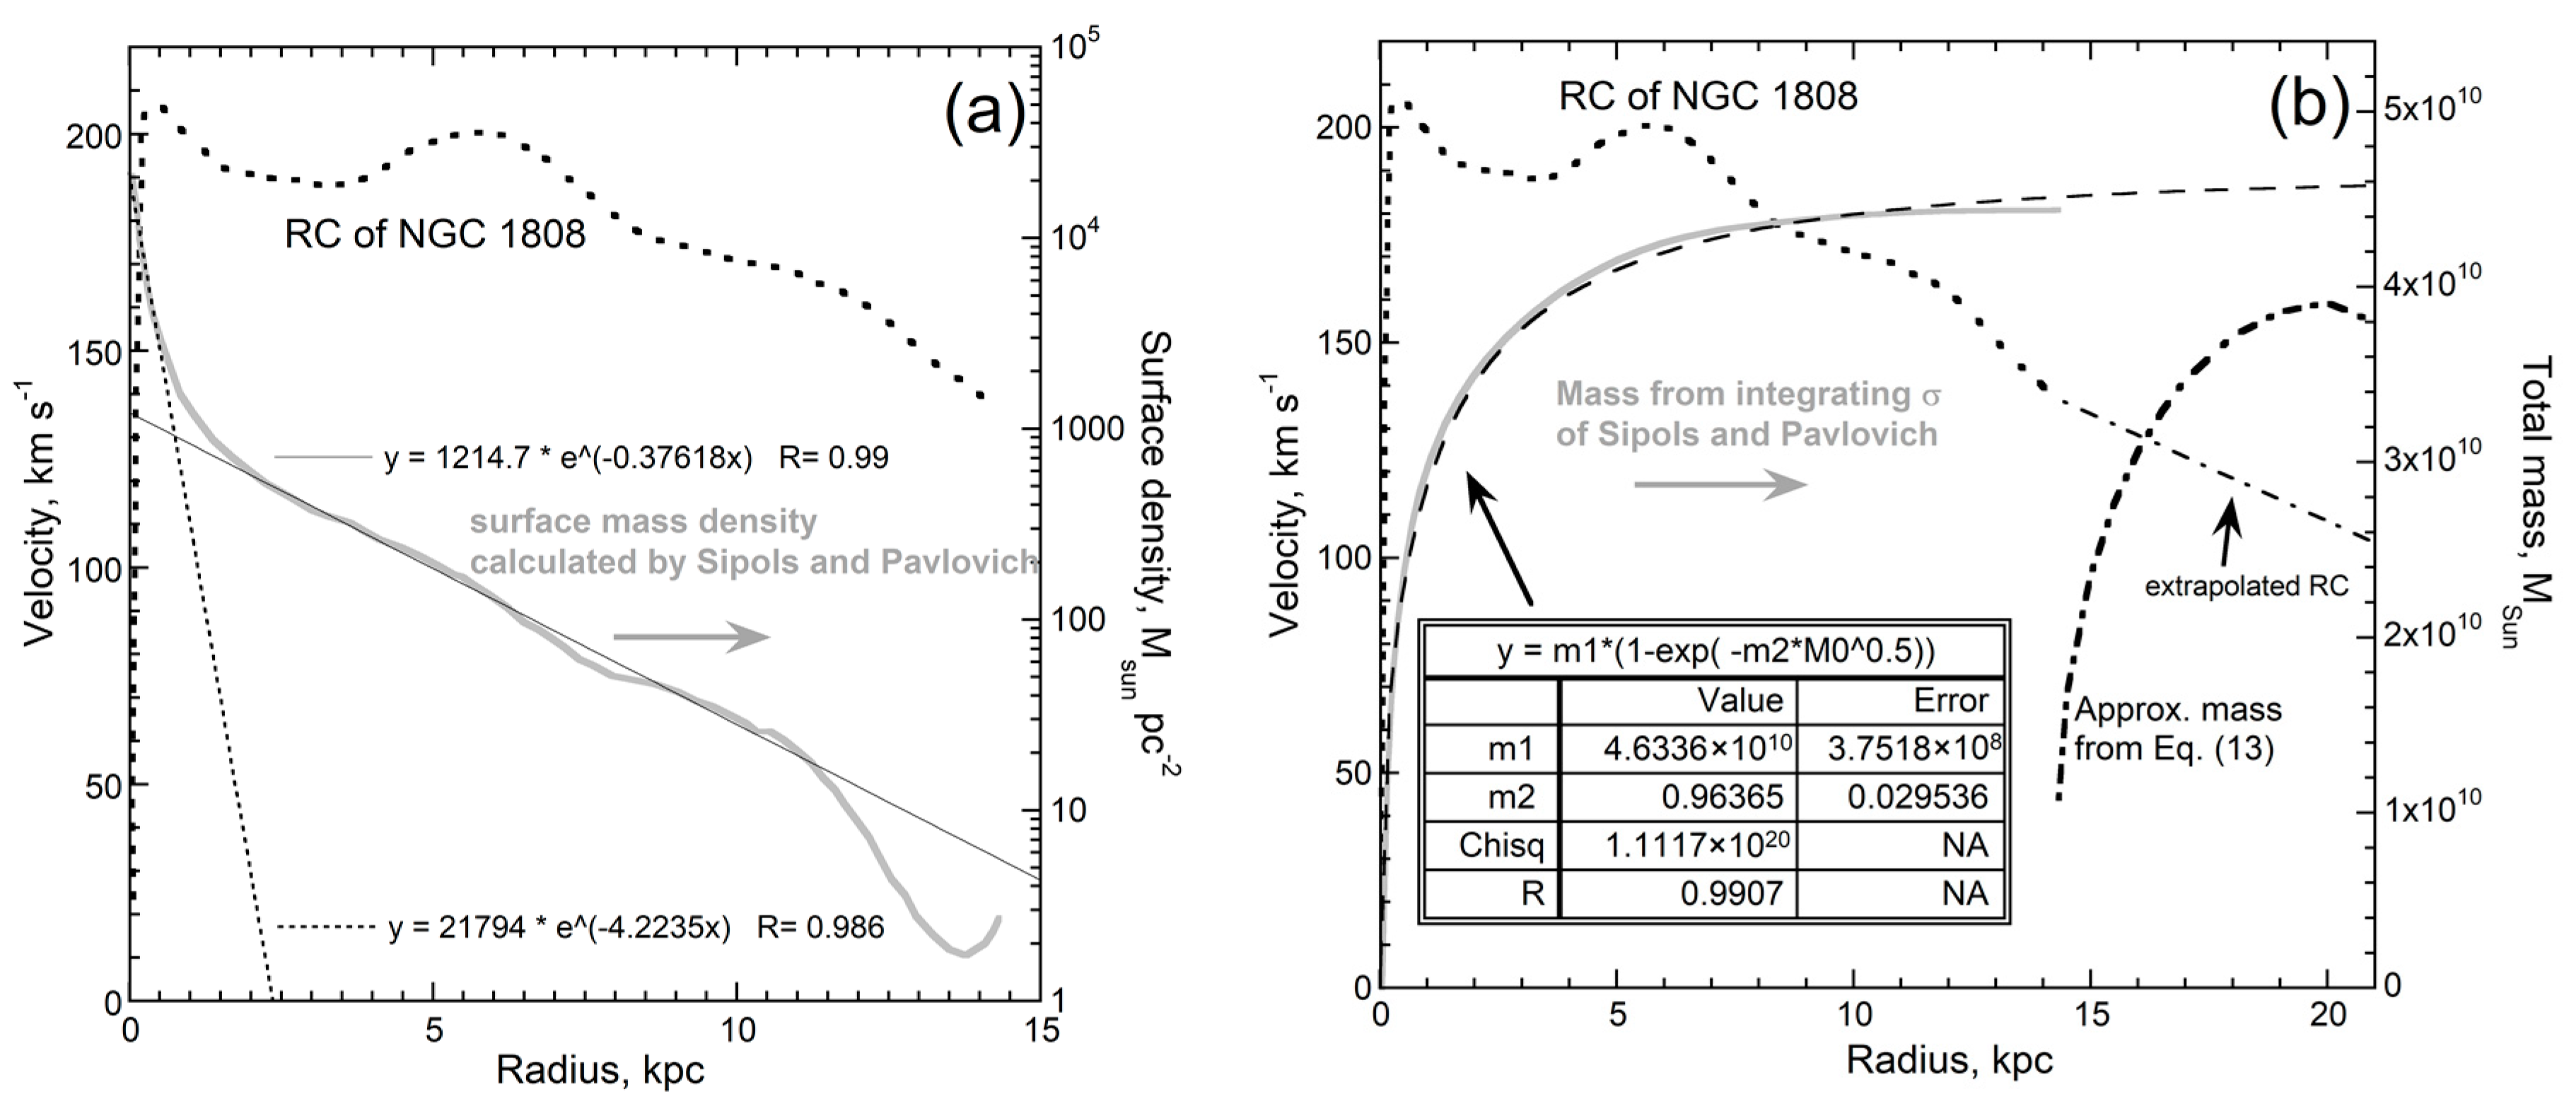
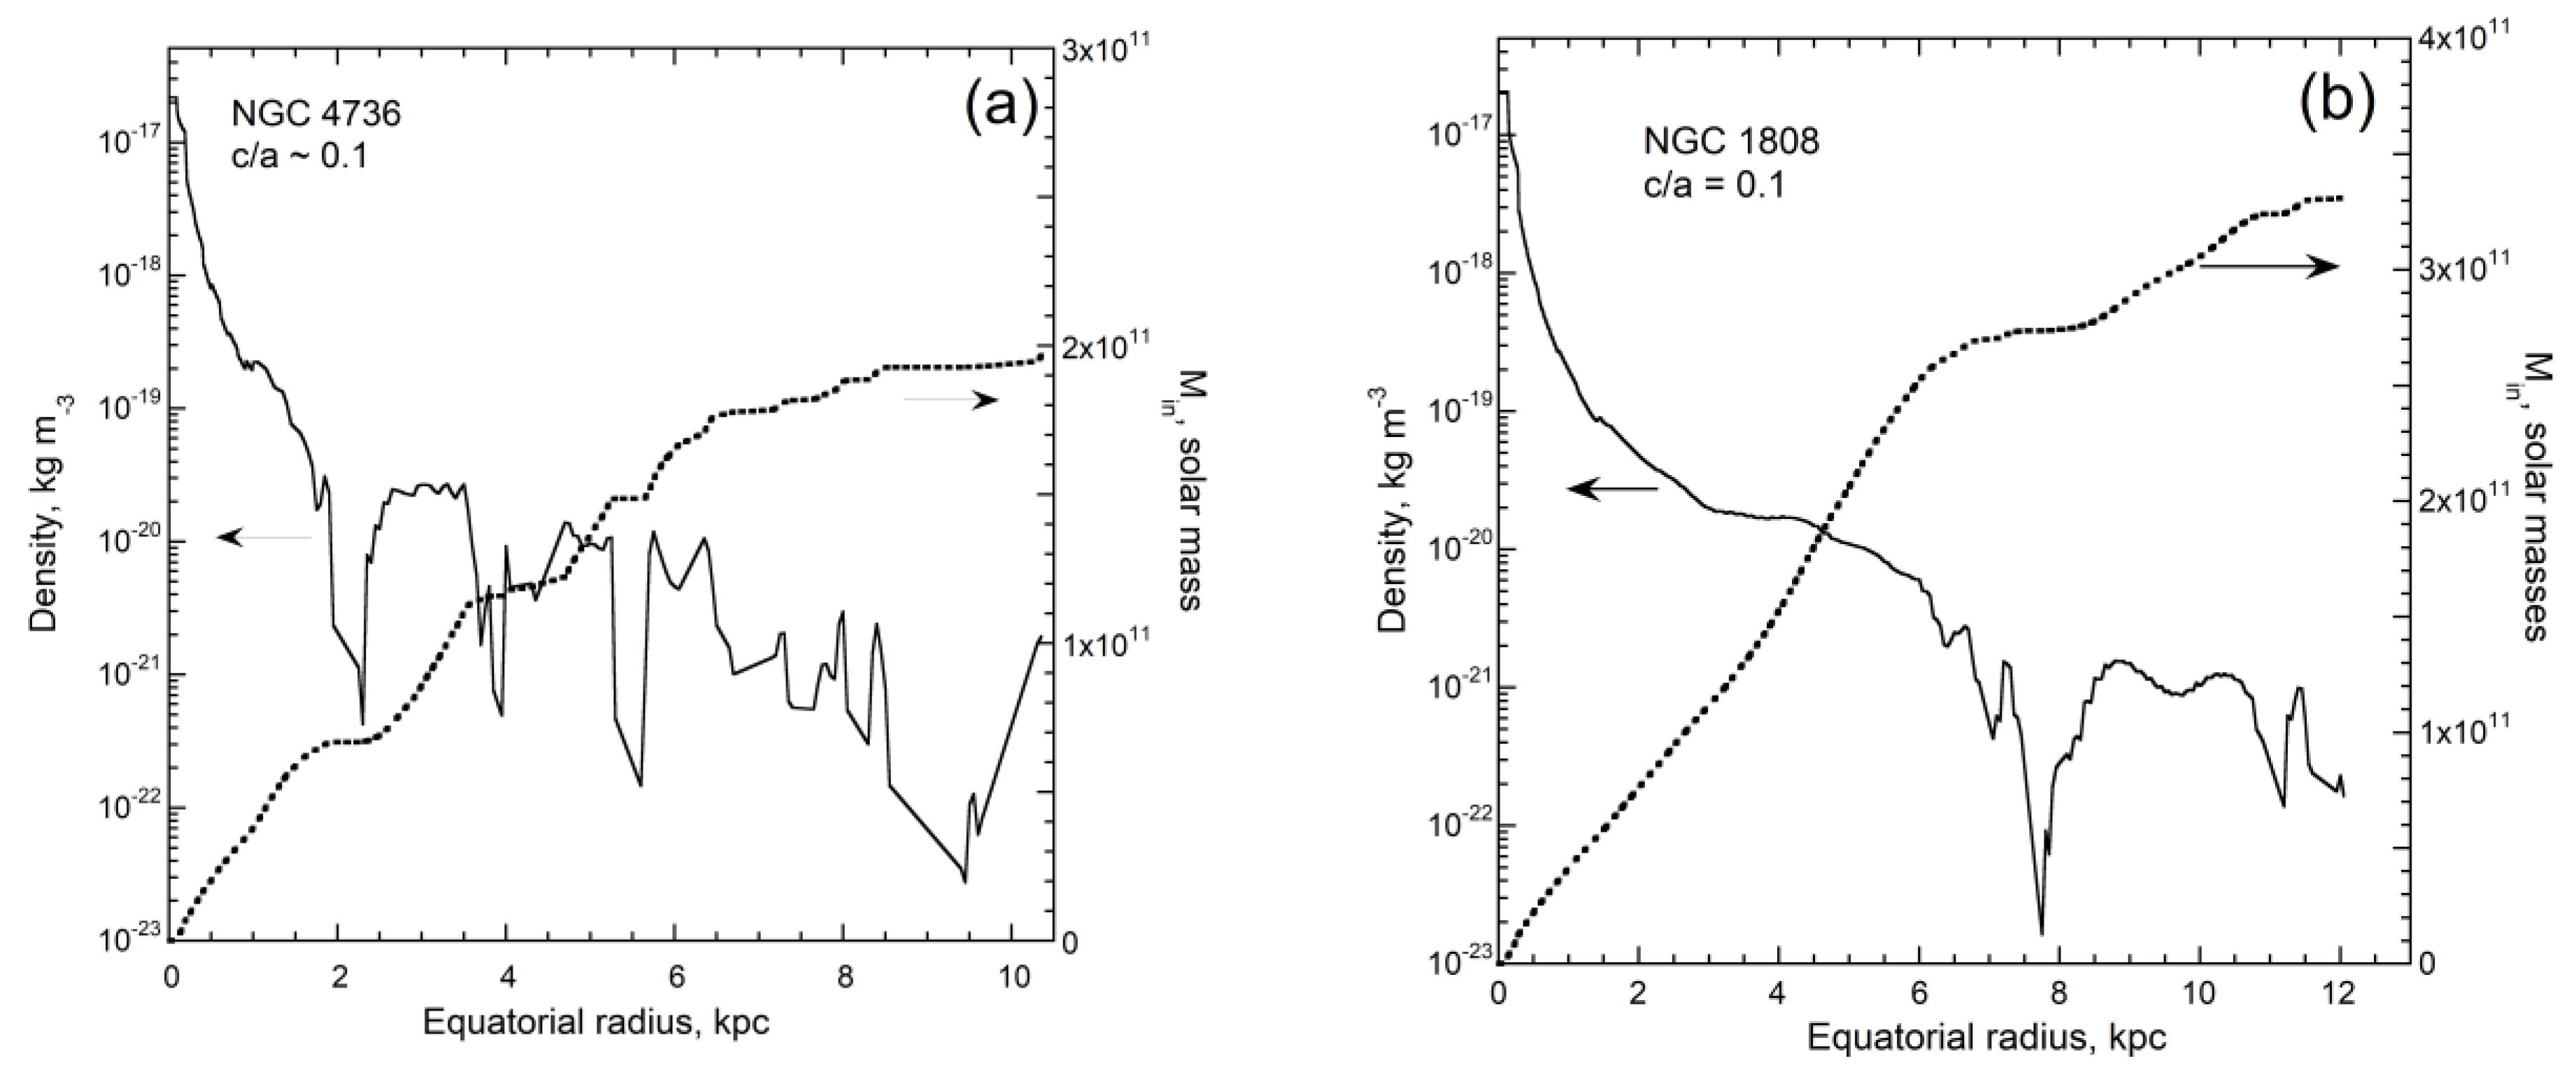
The philosophies of the NBDM and MOND camps are irreconcilable. This impasse, which is tied to the importance of cosmological models to astronomy [1], has drawn interest from researchers in other fields to generate alternative classes of models. The methodologies of those highly skilled in computation [8,9,10,11,12,13] differ greatly from the analytical methods of the present authors [14,15], yet these very different approaches have led to the same conclusion: Specifically, the dynamics of galaxies are satisfactorily explained by Newton’s law of gravitation and no massive NBDM haloes are needed.
Section 1.2 discusses the models applied to galactic rotation in general terms. This permits us to set a framework for evaluation, as outlined in Section 1.3.

1.1. Evidence Independent of Rotation Cuve Modeling

Observational astronomers have directed substantial efforts towards detecting matter surrounding spiral galaxies. Large collaborations and expenditures are involved.
Radio wavelengths (λ) probe H atoms and cosmic rays (nuclei of H and He atoms) in and around galaxies. Isophotes (e.g., Figure 1) reveal that this baryonic gas extends beyond the visible central regions of spiral galaxies, where density decreases in both radial and azimuthal directions. Further information is provided in a 2015 special issue of Galaxies [16] and in a review [17]. This distribution of baryons has characteristics similar to those of an atmosphere around a star or planet, such as having a much lower density than the central body.
In contrast, NBDM has not been detected in special searches, as exemplified by recent exploration of the short wavelength end of the EM spectrum (γ-rays of ~10 TeV) [18] which focused on dwarf spheroidal satellites orbiting the Milky Way. Although earlier NOMs multicomponent fits suggested compositions exceeding 99% DM [19], none was observed. Neutrinos are now dismissed as composing haloes [20].
Failures of observational astronomy to provide independent evidence for non-baryonic haloes led to efforts in an entirely different direction: Although experimental particle physics cannot establish the constituency of haloes, this approach could potentially discover non-baryons and reveal their properties. However, three different, well thought out experiments in 2019 using large hadron colliders provided no evidence for such particles. Consequently, weakly interacting massive particles (WIMPs) are now ruled out [20].
At present, definitive tests and viable candidates for NBDM particles are lacking. Proposals now invoke a hypothetical particle (axions) from 1980s literature [21], which has not been documented in particle physics experiments. Consequently, the proposals involve gravitational lensing models [22]. This type of evidence is indirect and gravitational, and so does not differ in essence from the NOMs approach.
Independent support for NBDM haloes is now limited to cosmological and other models. Cosmological models require large, but lower amounts of NBDM (e.g., [1]). However, model-to-model comparisons have nothing to do with the scientific method, and provide insufficient proof that either model is valid.

1.2. Types of Models

Two fundamentally different approaches, termed forward and inverse methods, are used to investigate physical phenomena, including galactic RC, as follows:
Forward (or direct) problems are familiar. These are solved by inserting some inputs into a formulation (e.g., into an equation or computer program), which then returns a result that can be compared to a measurement [27]. The latter is the case for NOM analyses, where the density or mass distributions for each of several different geometric shapes are assumed, and then velocity curves are calculated and compared to observations (Table 1, top). Forward methods are a focus in physical science and are emphasized in education, more now than ever, due to computational advances, commercialization, and proliferation of powerful, readily available software.
In the less familiar inverse problem, the nature of a remote source is deduced from its output or response [27]. This approach is rarely taught, and has been applied to RC by three different research groups (Table 1, bottom), one of which provides an analytical solution. Groetsch [27] mentions several successful solutions to inverse problems in astronomy in his monograph, including the important work of Ambartsumian [28] and Kepler’s historic deduction of the laws of planetary motion.
Analytical solutions to inverse problems are unique and therefore are extremely important, but may be conceptually and analytically difficult to obtain, and commonly are not even possible. Unique analytical inverse models are increasingly confused with statistical solutions that have become popular recently [29], due to the computational advances mentioned above. Statistical solutions need not be unique.

1.3. Purpose and Goals

This paper reviews and evaluates the available models of galactic rotation, focusing on spiral types. In view of the diverse morphologies of galaxies, actual motions are more complex than the snapshot of tangential velocities revealed by Doppler shift measurements. Dynamical galactic models are but approximations to this reality and invariably contain flaws. Moreover, RC curves are obtained from the Doppler data using models which have their own approximations. Section 2 provides evidence for two systematic errors existing which artificially flatten RC. Our evaluations focus on the mathematical physics of both forward (Section 3) and inverse models (Section 4), in hopes of providing the most impartial evaluation that we can muster. Section 5 summarizes. The developments over the last 5 years (e.g., Table 1) suggest that a paradigm shift of RC analysis is beginning.

2. Available Data and Approximations Used in its Analysis

Most remote sensing involves processing some type of EM radiation. Images are important, because galaxies are classified according to their morphology, and shape affects gravitation. Contour maps can be based on intensity over some particular wavelength range, but can also be referenced to the departure from some average or reference value. The latter is the essence of Doppler measurements.

2.1. Shapes from Images

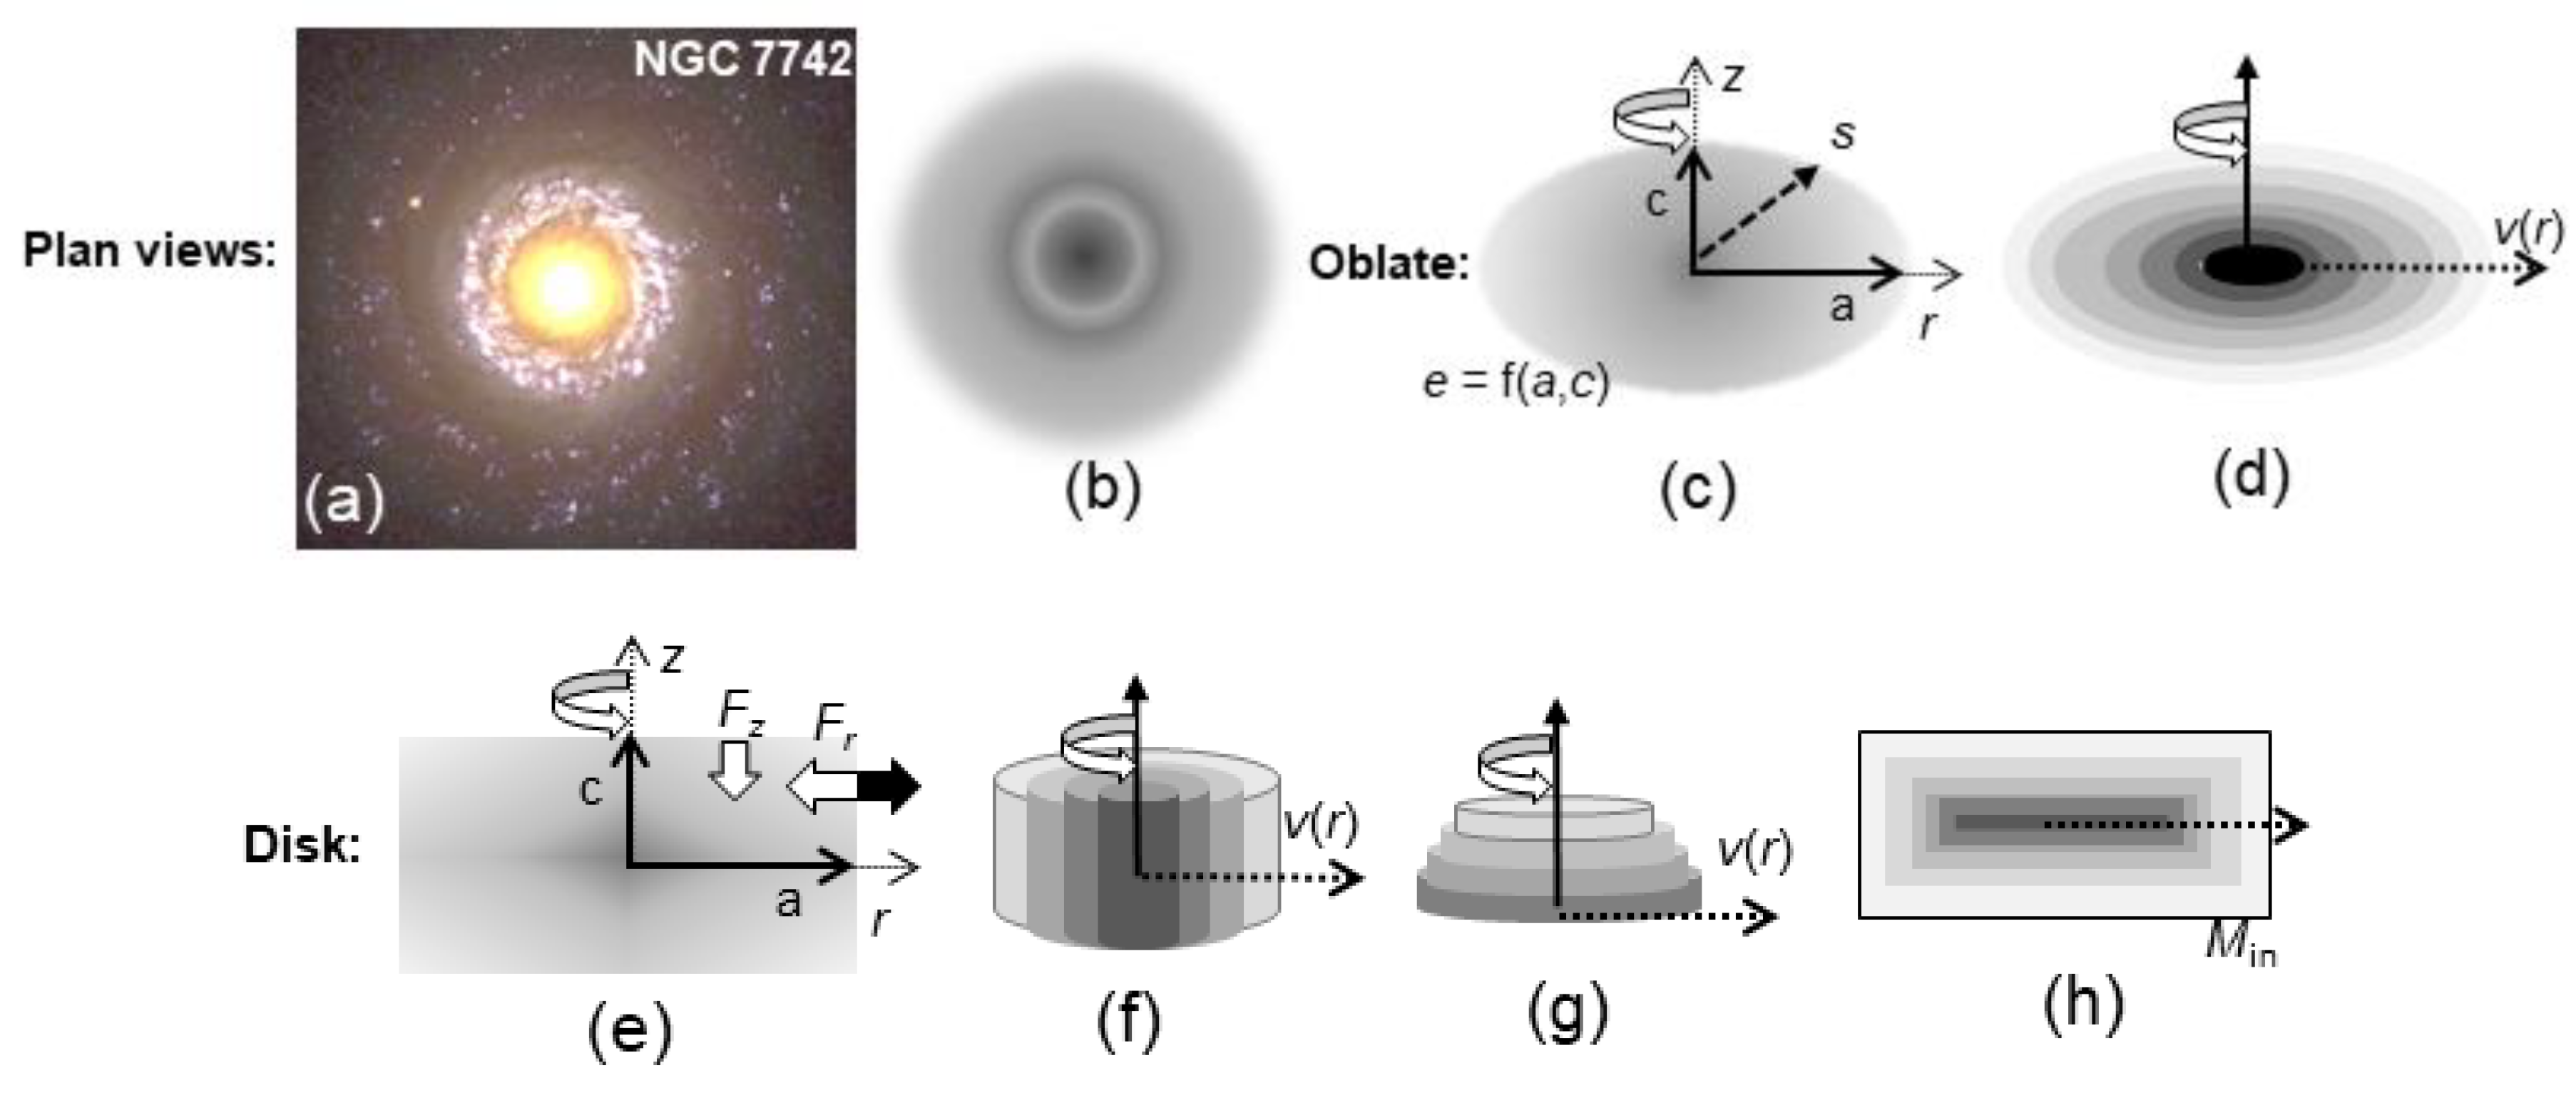
The shape of a containerless body is defined by its isodensity contours. Face-on photographs of spiral galaxies document radial symmetry, with luminous density decreasing outwards (e.g., Figure 2a,b). Spiral arms indicate a secondary angular dependence that does not greatly perturb the radial dependence of measured velocities [36].
Spiral galaxies have finite thickness perpendicular to the equatorial plane, which needs to be accounted for in extracting RC from Doppler measurements. Our concern in this section is how the assumed shape for the cross section impacts RC derivations.

2.1.1. Density Contours of the Oblate Spheroid

Historically, oblate spheroids were recognized as the required shape for galaxies [38,39]. The basis is Newton’s and Maclaurin’s quantification of how spin affects the shape of a large, homogeneous self-gravitating object [40]. The problem of Earth’s inhomogeneous, layered configuration was recently solved [41]. The oblate shape persists, despite this dense object experiencing additional frictional forces from relative motions among its layers, due to the strength of Newtonian attraction.
Numerous edge-on images at virtually all wavelengths demonstrate that spiral galaxies have the expected oblate gravitational shape (Figure 1, see [24,42]). The geometry of an oblate spheroid (Figure 2c) is represented by its ellipticity (e) which is defined via the ratio of the minor axis (c) to the major (a):
e = ( 1 c 2 / a 2 ) 1 2
Any orientation of an oblate spheroid provides an elliptical cross section: for views down the special z-axis, e = 0. The surface of the oblate body is described by:
z 2 = ( 1 e 2 ) ( a 2 r 2 )
Binney and Tremaine’s [43] incorrect definition of z2 = (1 − e2)(r2a2) in their equation 2.114 provides imaginary numbers for z inside the oblate body. Formulae for spheroids in their tables 2.1 and 2.2 are also incorrect, perhaps due to this mistake.
Thin internal shells of constant density are known as homeoids, after Newton. Constant density is linked to homeoids being equipotential. When viewed down the z-axis, homeoids have circular outlines (Figure 2b). In the z-r plane, homeoid surfaces have an elliptical shape (Figure 2d), which is defined by equations similar to the above, except that a is where the homeoid surface intersects the equatorial plane. Homeoids have constant density which means that the density where any given homeoid intersects the z-axis is identical to the density where it intersects the r-axis. These intersections are linked via (2) and (3). The oblate body and its nested internal homeoids are presumed to have the same ellipticity [15,44]. Equations for nesting in accord with constant force surfaces are given in [45]: this case may describe distant material orbiting about the dense center.
Contours at various wavelengths for spiral galaxies are elliptical in nearly edge-on orientations (e.g., Figure 1), thus corroborating the oblate shape. Greater variation is seen for tilted spiral galaxies, which arises from various structural elements (such as bars and double nuclei) diverging from axial symmetry, shadowing in perspective views, and interactions with neighbors ([24,42]). Nonetheless, the basic oblate spheroid shape is evident in thousands of images (e.g., [42]).

2.1.2. Flat Oblate Spheroids are not Thin Disks

After ~1963, the disk shape (Figure 2e) was considered to describe spiral galaxies [46]. This digression stems from Perek’s [47] erroneous assertion that density in the axial (z) direction is independent of ρ in the r direction for a spheroid, which contradicts Newton’s homeoid theorem [48]. The mathematical description of the ellipse (3) links ρ(z) to ρ(r) for each and every position.
Oblate objects and disks differ fundamentally. Oblate spheroids are inherently 3-dimensional, whereas a thick disk can be cast as the vertical extension of 2-dimensional surface, i.e., a volume element (dV) of a flat, thin disk of constant thickness is 2πrdr times its height (H), whereas dV of a sphere is 4πr2dr, and that for a spheroid is simply the latter times a constant geometric factor involving its ellipticity. Basically, spherical and cylindrical geometrical elements differ by a factor of r. Cylindrical geometry is ideal for the analysis of fields about long, thin wires [49], but fields around a flat disk are far more complicated (Section 3.1.5).
Density along the z-axis for any given homeoid depends on e and ρ for that homeoid at the equatorial plane (Figure 2c,d). In contrast, for cylindrical shapes, ambiguity exists regarding possible components, depending on whether rotation is coherent vertically (Figure 2f) or horizontally (Figure 2g). Using rings implicitly assumes coherent vertical rotation of concentric cylinders, as is evident in the mathematics applied to Doppler shifts [50] (see below) and to certain disk models (Section 3 and Section 4). This is a problem because density being independent of z creates a discontinuity at some height, H (Figure 2f). Instead, for thin disks, isodensity surfaces must be hollow pillboxes (Figure 2h). This case resembles the homeoids, but has sharp corners that are not possible in a stable, self-gravitating body. A force decomposition appropriate to the cylindrical coordinate system (Figure 2e) shows that the centrifugal acceleration of rotation could balance the radial component against the gravitational draw to the center, but the downwards force at finite z above the equatorial plane is unopposed. Consequently, if sharp corners were somehow created in a real galaxy, these would quickly round-up into the gravitationally stable shape of the oblate spheroid.

2.2. Rotation Curves from Doppler Shifts

Sofue and Rubin [36] summarize data analysis procedures used to obtain RC from Doppler shifts of the approaching and receding galactic limbs. Advances made since 2001 are detailed in the many subsequent papers on this subject. However, the basics (summarized below) have not changed. Regarding the Milky Way, observations are from the inside, which requires a slightly different approach: for details, see Sofue [51,52].

2.2.1. General Approach in Data Analysis

Optical determinations of Doppler shifts trace motions of stars, whereas those of gas emission lines (e.g., Hα, HI, and CO) reveal motions of unconsolidated material. Spectral lines emitted by hydrogen gas clouds permit velocity measurements at great distances from galactic centers, whereas CO is useful for their inner zones, if dust does not interfere [36].
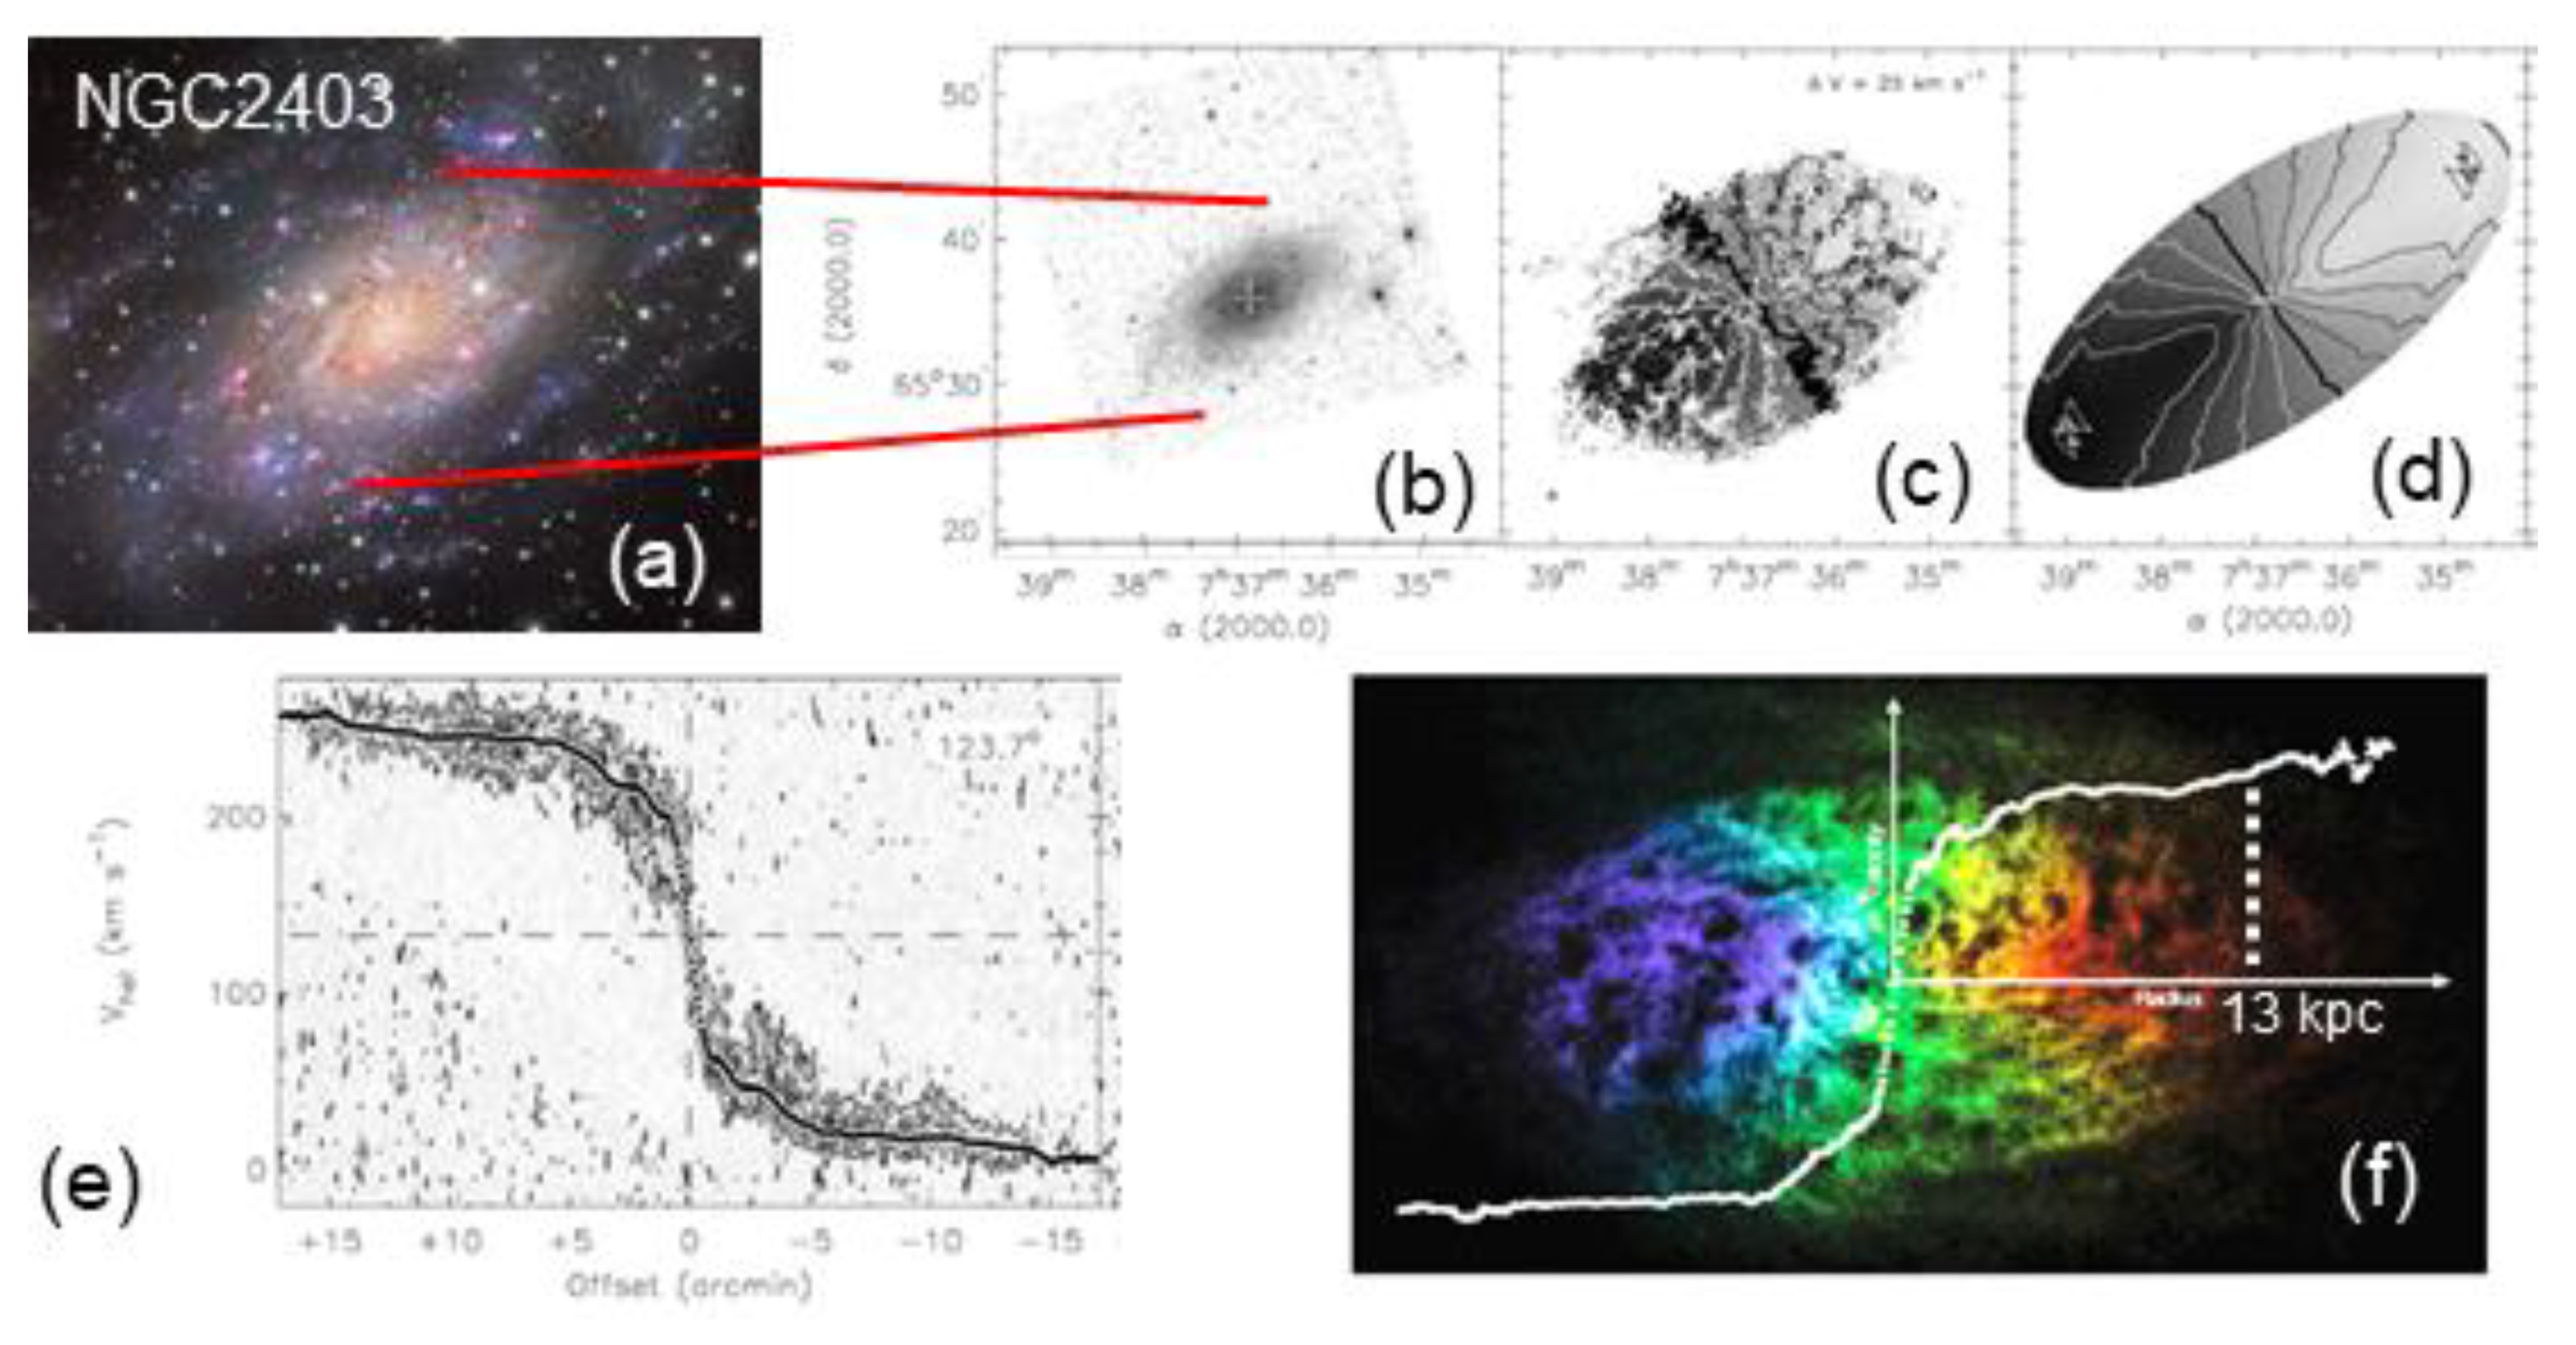
If a galaxy is perfectly flat and exactly face-on, its Doppler shifts from spin about the z-axis cannot be measured. Measurements must be corrected to account for the galactic plane being inclined by angle (i) to the line of sight (Figure 3a,b), and so the derived RC depict the dependence of velocity on radius along the apparent major axis (Figure 3e). The tilted orientation superimposes structural elements for regions that are thick and/or dense, which creates difficulties in establishing RC near galactic centers [36], or for nearly edge-on galaxies (i > 80° [35]), or along the minor axis (Figure 3c,d). Uncertainties are high for i < 40° [35] due to the presentation.
Measurements consist of a velocity field (Figure 3c,f, Section 2.2.3) denoted V(x,y) where x and y are sky coordinates. The tilted ring model of Bergeman [50] is routinely applied, which assumes that the velocity field measurements describe the equatorial plane and that the disk is thin and is composed of rings (Figure 2f):
V ( x , y ) = V 0 + V C ( r ) sin ( i ) cos ( θ )
where V0 is the (systemic) velocity of the center away from the Sun and VC is the circular velocity at a specified mean equatorial radius (r) of the ring. The azimuthal angle (θ) is defined by:
cos ( θ ) = ( x x 0 ) sin ( ϕ ) + ( y y 0 ) cos ( ϕ ) r ; sin ( θ ) = ( x x 0 ) cos ( ϕ ) ( y y 0 ) sin ( ϕ ) r cos ( i )
where φ is the positional angle of the major axis and x0 and y0 depict the galactic center. An iterative procedure is required due to the forms of these equations [50]. A high degree of smoothing exists, as seen in the ring model of Figure 3d. Also, the desired parameter VC is multiplied by sin(i), which lumping induces ambiguity [55], unless the inclination is independently determined.

2.2.2. Two Examples

Progressive improvements in resolution have increased the accuracy of Doppler measurements considerably over in the last few decades. Two recent studies exemplify modern determinations.
Data for NGC 2403 (Figure 3) were discussed in detail above because optimal conditions exist for obtaining its RC [35]. That the RC for its two limbs nearly match (Figure 3e,f) indicates regular, circular motions. Velocity fields of NGC 2403 from HI lines have been measured and analyzed many times, with increasing resolution and sensitivity. The results of deBlok et al. [53] show that agreement is good, except beyond 13 kpc. Variation at large radius may relate to statistical analysis of the peak profiles (Section 2.2.3).
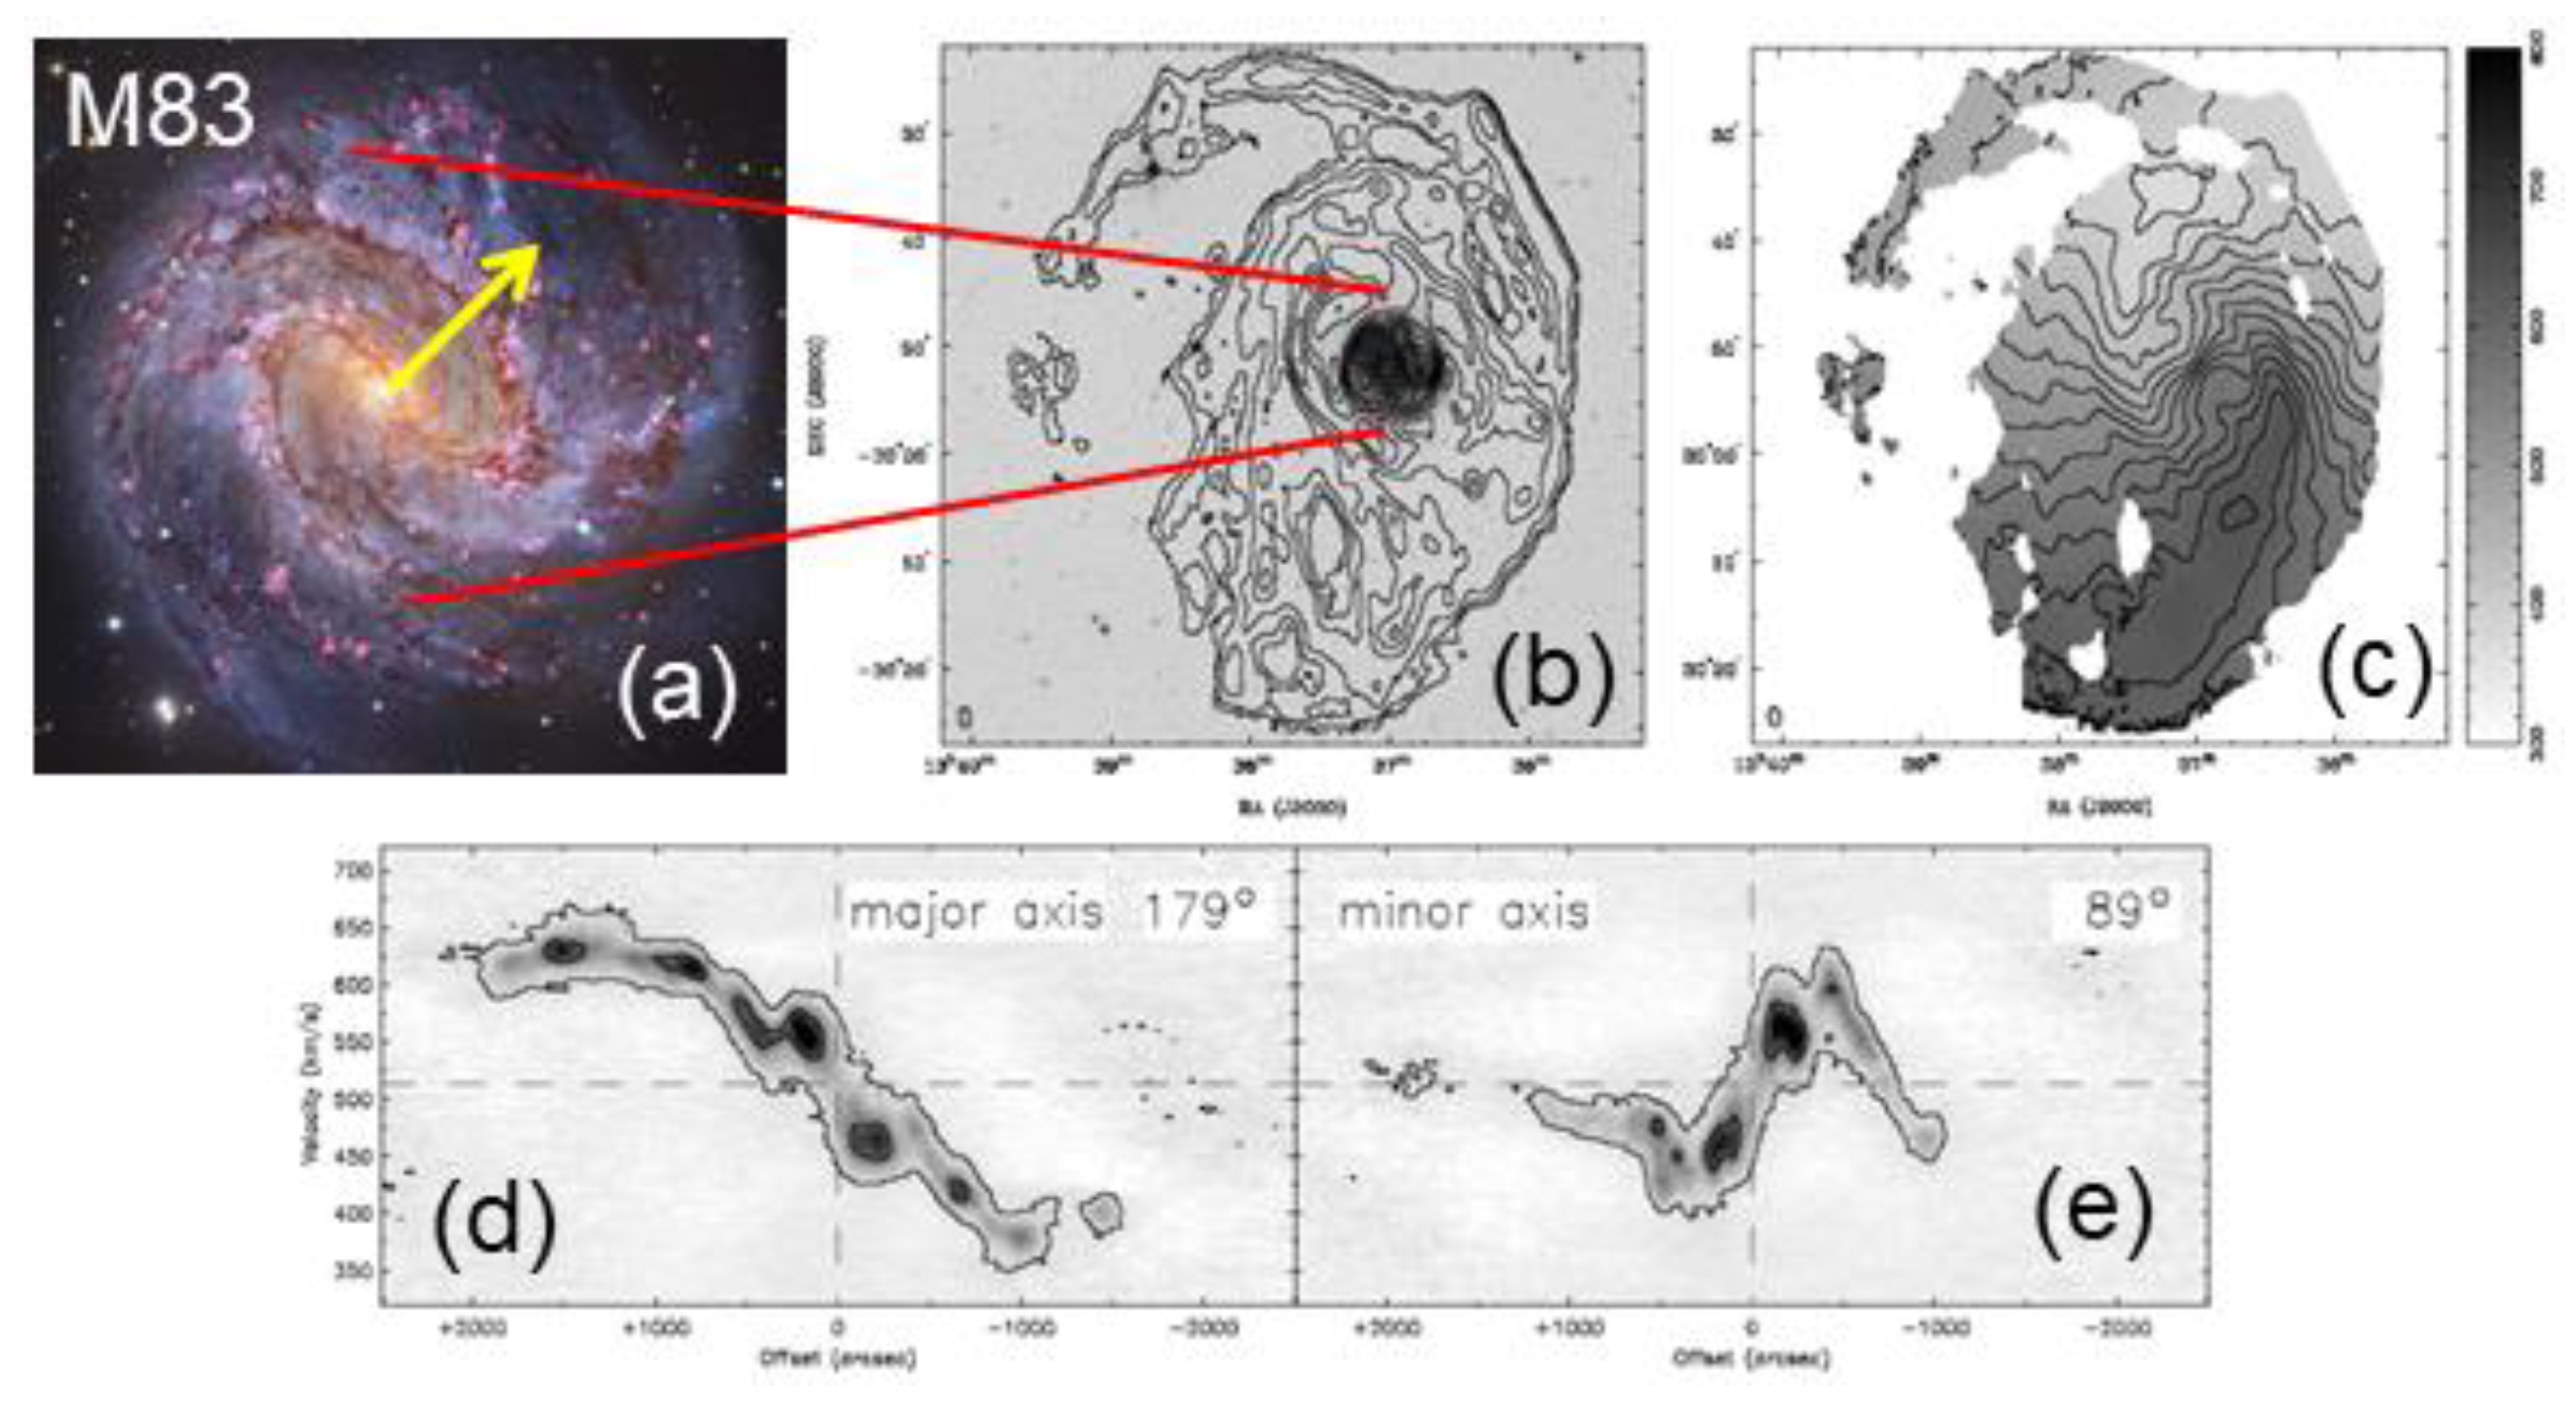
The Southern Pinwheel (NGC 5236) possesses a much more complicated velocity field (Figure 4). Earlier HI studies probed the central regions, which appeared more “normal,” but still indicated asymmetry. The unusual single arm appears to be rotating with the galaxy, despite its large distance of ~45 kpc from the center. Section 2.2.4 argues that the complexity is due to a second axis of spin.

2.2.3. How the Geometrical Control on Density Contours Affects Velocity-Flux Systematics

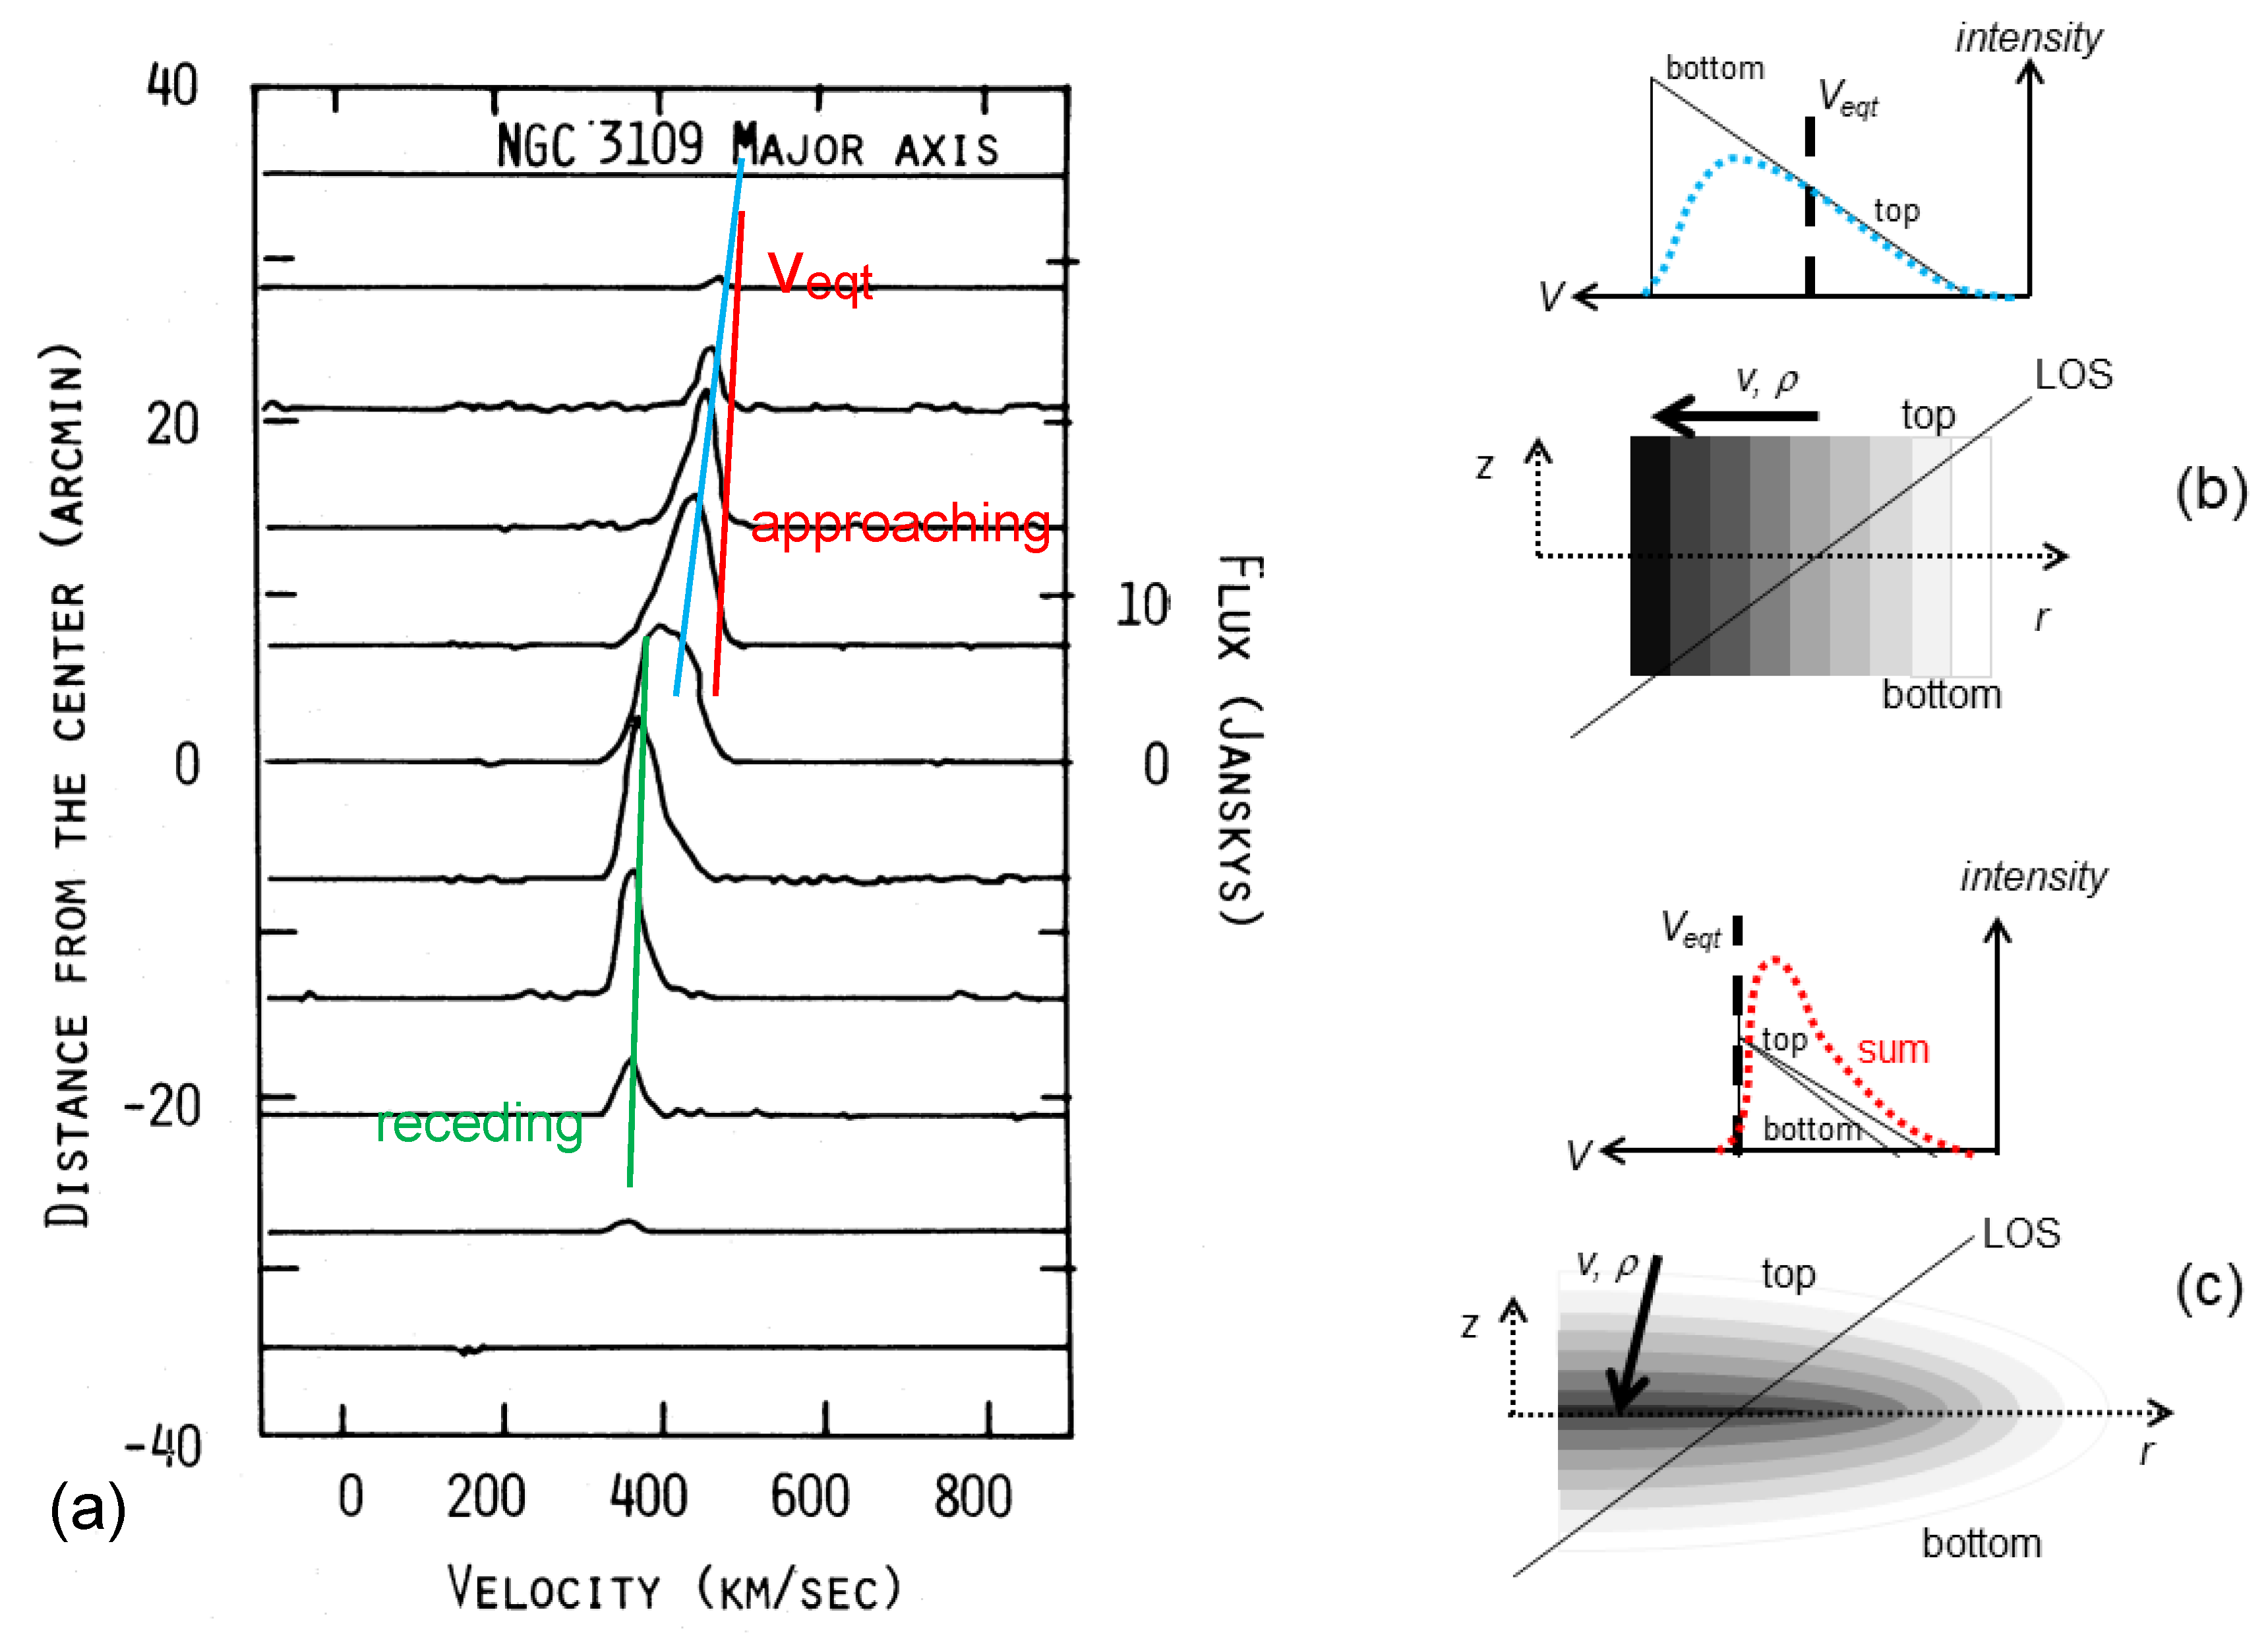
Geometrical constraints on the superposition of elements have not been accounted for in analyses of the velocity fields. The peak in flux-velocity diagrams is assumed to represent VC for the radius being sampled (e.g., [53,57,58,59]; Figure 5a). This is untrue for both the oblate shape and the thin disk approximation in the regions even where elements are not superimposed, as follows:
Along the line of sight crossing the outer sections, a very thin disk constituted of orbiting rings would have velocity and density (detected as emitted flux) that both increase as radius decreases (Figure 5b). For an ideal flat and thin disk where all emissions are received under optically thin conditions, the flux profile would be triangular, and the velocity at the equatorial plane (Veq) would be the average of the highest and lowest velocities along the LOS (Figure 5b). However, as radius decreases, conditions become increasingly optically thick. Light is attenuated as it emerges from within the galaxy, in such a manner that emissions originating below the equatorial plane are highly attenuated, due to this light crossing large amounts of superjacent matter. The blue curve in Figure 5b sketches the expected attenuation pattern. The velocity associated with the maximum flux depends on the particulars of the gas distribution. The same holds for the velocity associated with the average flux. Instead, Veq will be represented by the average of the extrema detected, as long as some emitted light is received from the innermost ring crossing the LOS. Due to the asymmetry of the peaks (Figure 5a), using statistics overestimates |Veq|, if the thin disk geometry were a reasonable approximation.
Rotational velocity and emission intensity along the LOS crossing an oblate object are correlated in a different manner than for an idealized thin disk. Each homeoidal shell of an oblate object (Figure 2d) rotates coherently. Consequently, the velocity-density gradient is parallel to r only exactly on the equatorial plane. Along a random LOS towards the outside of a spiral galaxy, the maximum tangential velocity is reached when the emitted light originates from the equatorial plane of the spiral (Figure 5c). Under optically thin conditions, the velocity-flux profile is approximately triangular, and has a sharp termination at Veq. Without attenuation, triangular profiles describe each of each of the top and bottom sections of the galaxy. Attenuation will make the termination less vertical, but as long as some light is received from the equatorial plane, the maximum velocity is the equatorial velocity, and an asymmetric flux-velocity profile is expected (red curve in Figure 5c). Attenuation will move the peak to lower velocities than the cutoff associated with the equatorial plane. How much depends on the gas distribution.
Reported flux-velocity profiles are in accord with the asymmetric pattern expected for oblate bodies. Other examples from Carignan [57], Gentile et al. [59], Chemin et al. [58], and deBlok et al. [53] have a pattern similar to the red curve in in Figure 5c, for all but the central regions and for the minor axis. Moreover, the steep side of the roughly triangular flux-velocity profiles is always located towards the highest absolute velocity (after subtracting the system velocity), regardless of whether the galactic limb is approaching or receding (Figure 5a), as expected for the oblate. For the skewed velocity-flux distribution of NGC 2403 (not shown), the representative value for the equatorial plane is ~205 km s−1, not ~185 km s−1 from the position of the flux peak. This ~+10% correction is near the center of the RC curves. Data were not provided to the outside. However, a correction of < +2% is indicated for the outskirts by the flux profile of ESO 79-G14 [59] and the lower resolution data (Figure 5a) point to this systematic error decreasing with radius. Hence, RC are not as flat as currently reported.
Thus, use of the position of maximum flux underestimates |VC| by variable amounts. We cannot reconstruct RC with the information reported in Doppler studies of galaxies. Re-analyzing raw data is needed.
Bergeman’s [50] construction is well-reasoned. The geometry is described as rings in a disk. This construction depicts infinitesimally thin coaxially rotating cylinders, which are sufficiently short to be optically thin vertically, i.e., emissions from Veq = VC are presumably being measured. Bergeman’s equations, here (3) and (4), should thus describe spiral galaxies except near the center and for the minor axis, where elements are superimposed. Another factor merits consideration.

2.2.4. Why Multiple Spin Axes Should Exist

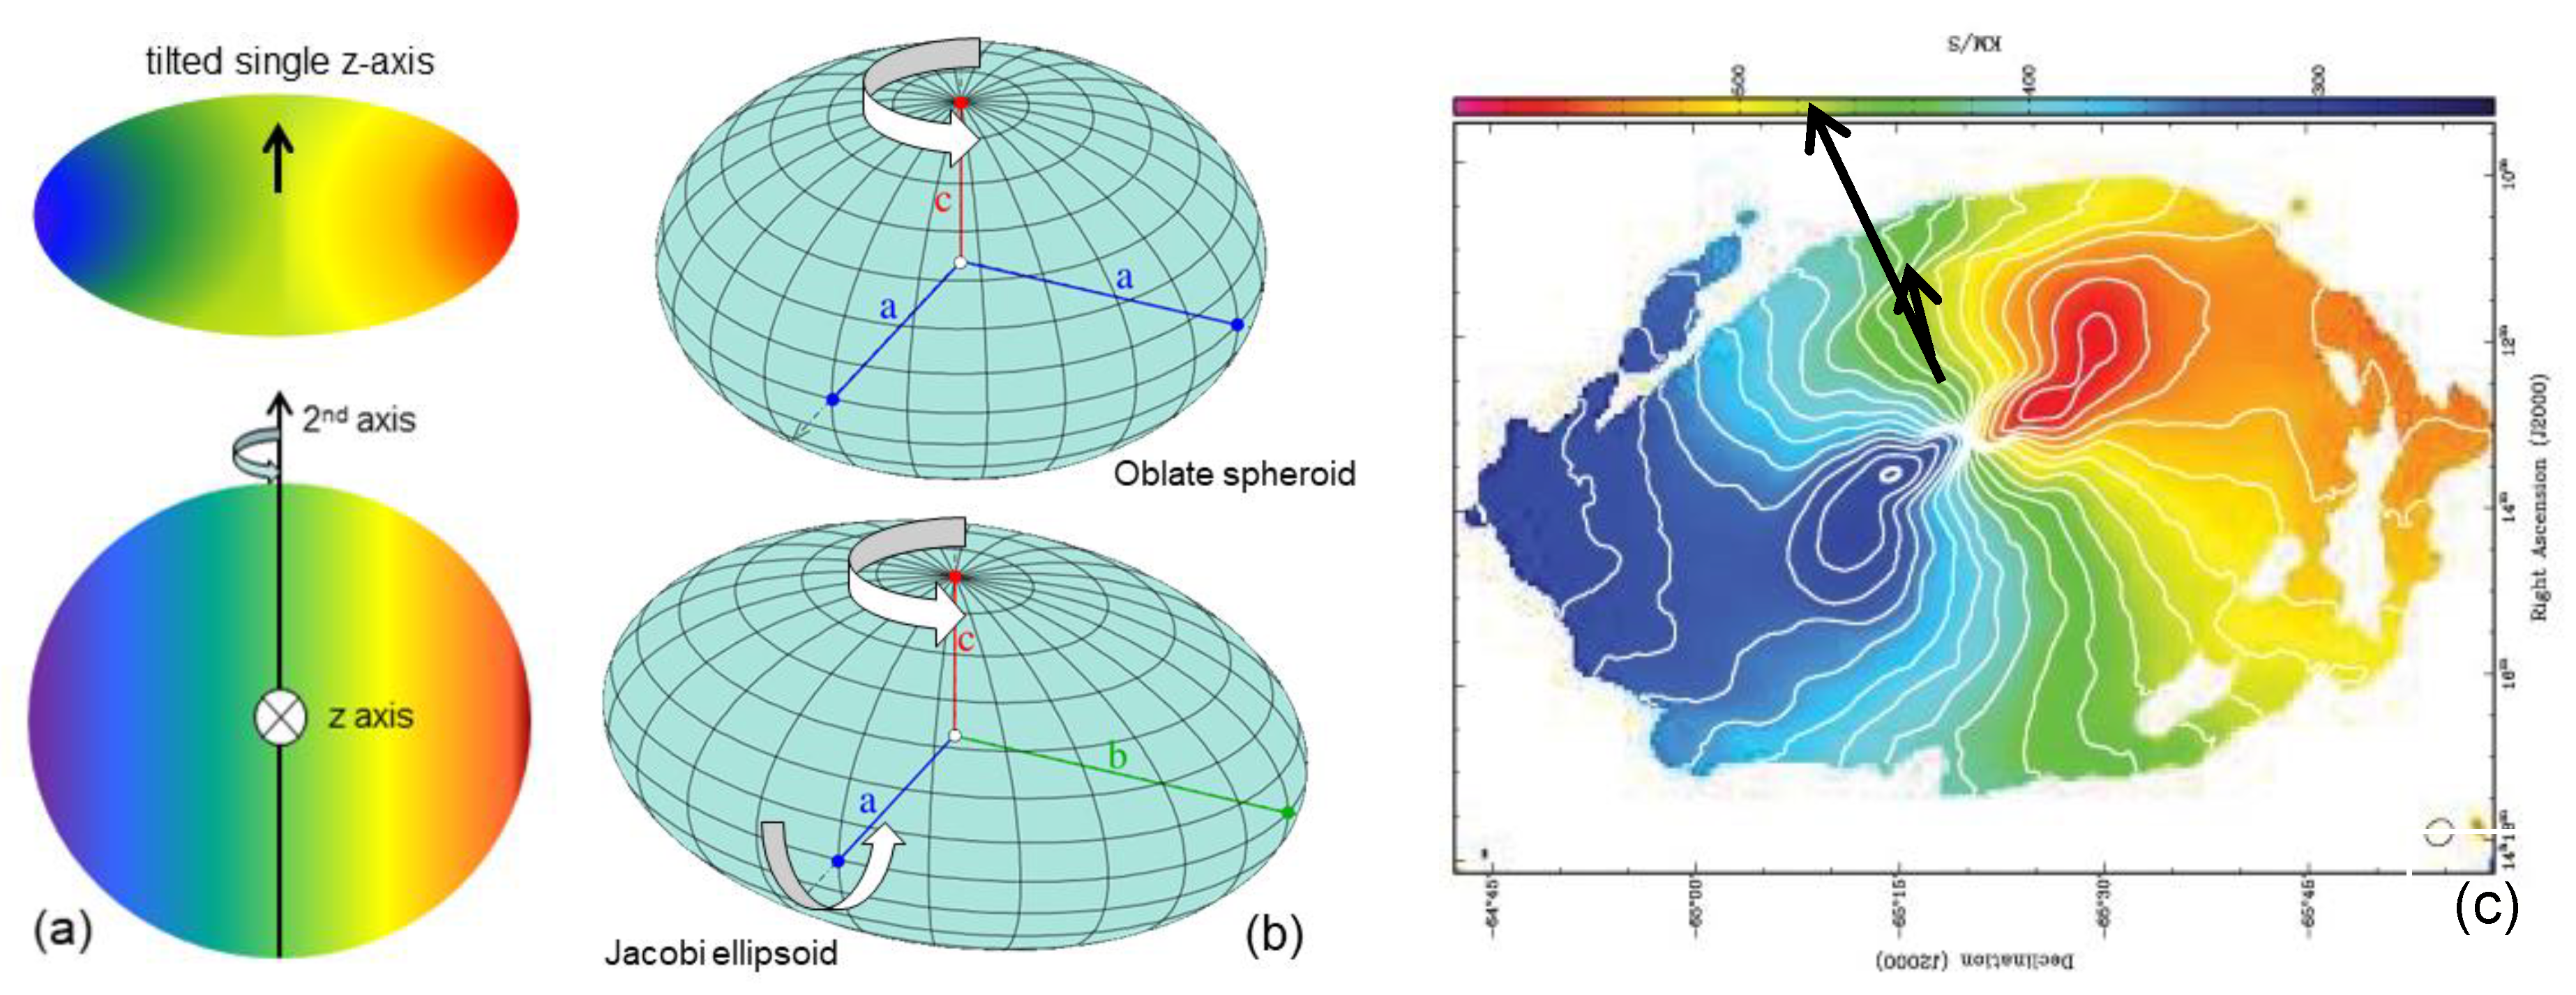
Spin of a spiral galaxy about one preferred axis produces a pattern similar to that of Figure 3f or Figure 6a (top). More complex patterns (e.g., that of M83 in Figure 4c) have been ascribed to the effects of galactic warping. Alternatively, a 2nd axis of spin could exist. This new proposal is supported by many observations, including the image of Figure 1a, as follows:
First, Doppler shifts are observed for face-on galaxies, but should not be, if only a single spin axis exists. An idealized pattern is shown in Figure 6a, bottom. The 2nd axis should be secondary as the faster rate should accompany spin about the short z-axis defined by high symmetry of the oblate (Figure 6b). The fast and slow Doppler shifts would be superimposed, as suggested by the pattern for Circinus (Figure 6c).
Second, perpendicular spin axes are supported theoretically by Jacobi’s 1822 demonstration that the triaxial ellipsoid shape (Figure 6b) is an equilibrium configuration for a self-gravitating fluid body of uniform density that is rotating with a constant angular velocity about its shortest axis. Many have discussed this problem subsequently (e.g., Routh and Green near 1900). Solutions should also exist for motions involving rotation at different rates about each of the short and moderate length axes (Figure 6b), and for variable density, since focoidal shells of the triaxial ellipsoid behave analogously to Newton’s homeoids. Spin about a 2nd axis should be linked to flattening, as deduced for the primary axis by Maclaurin and Todhunter, but may alternatively result from gravitational interactions with neighbors.
Third, any projection or section through an oblate or triaxial ellipsoid defines an ellipse. Such foreshortening along the LOS contributes ambiguities, as demonstrated by difficulties in classifying nearly edge-on presentations. Nonetheless, evidence for triaxiality in spirals is common. The largest spiral class is SB, where the central bar clearly breaks the axial symmetry of the oblate. Spiral arms of M83 exhibit 2-fold symmetry (Figure 4a), discussed further below.

2.2.5. Evidence for Multiple Spin Axes in Doppler Patterns

Perpendicular spin axes are essential to the polar ring morphology, where the spin axis of the outer ring is at 90° to the special axis of the central spiral [60].
The complex pattern of Doppler shifts for M83 (Figure 4c) reveals spin about 2 perpendicular axes, such that the secondary axis spins more slowly. Rotation about the apparent minor axis (Figure 4e) occurs at substantial speeds, since the maximum tangential velocities in this direction are only a factor of 2 lower than those along the major axis. Substantial departure from axial symmetry is evident in the visual image (Figure 4a): the double nuclei roughly define the orientation of the secondary spin axis. The large arm of H gas which is approaching the observer seems to be a singlet. Perhaps the equatorial plane of the gas is tilted with respect to the central, visible spiral, so much of the receding arm is either in front of the plane of visible galaxy or behind, making this feature difficult to observe. Figure 1a shows a 3-dimensional structure that is consistent with a 2nd spin axis.
Behavior similar to that of M83 and Circinus are common among large galaxies [56]. Although Circinus (Figure 6c) is classified as type SA, its images are obscured by the plane of the Milky Way. The arms of this galaxy suggest some reduction from axial symmetry. In fact, some reduction is required even for highly symmetric arms. For example, 3 arms requires the existence of a 3-fold axis of rotation, and so a turn of 120° returns the same image, but axial symmetry is described by an n-fold axis, where n→∞, and a turn of any angle returns the same image. Importantly, 2-fold rotational symmetry (e.g., a bar shape) is consistent with a triaxial distortion of the oblate, as can be seen in comparing Figure 4a to Figure 6b.

2.2.6. Evidence for Multiple Spin Axes in Rotation Curves

RC of M83 indicate that rotational motions exist about both the major and minor apparent axes. However, most studies only report RC for the major axis, which is more reliable due to separation of elements, so we focus on this axis.
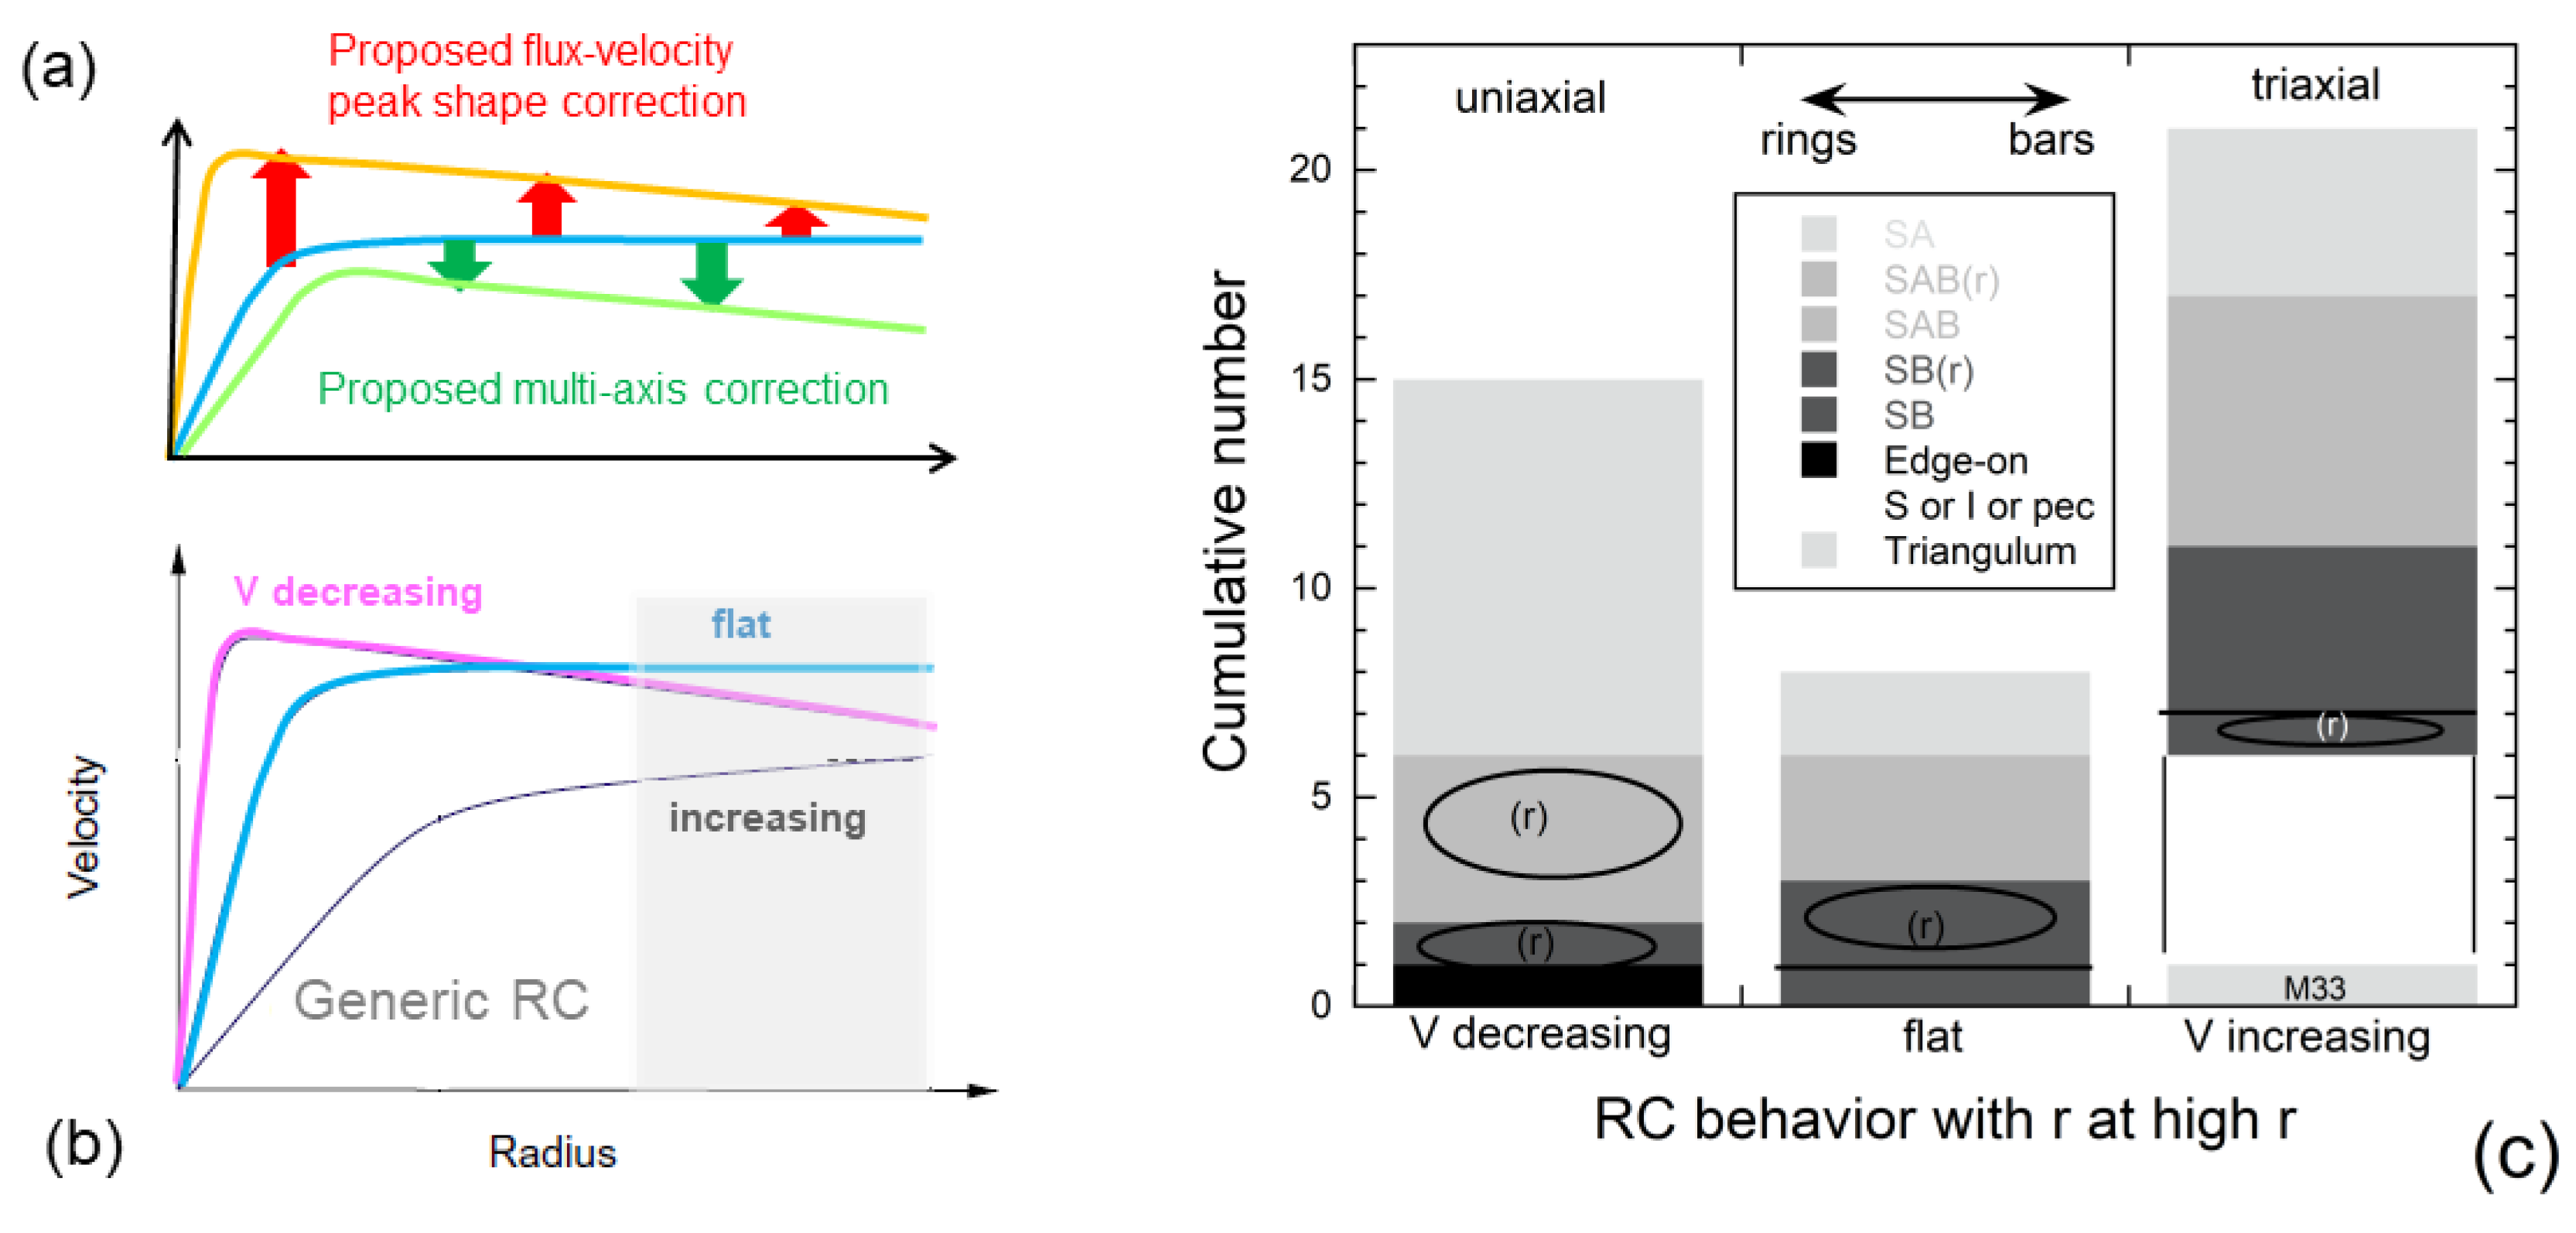
We proposed above that existence of an unrecognized secondary spin axis causes tangential velocities to be increasingly overestimated as r increases. Comparing RC of differently shaped spirals provides a test. Our task is simplified by RC also being categorized by shape. Importantly, these generic shapes for measured RC shown in Figure 7b are likely affected by the processing error covered in Section 2.2.3. As shown in Figure 7a, this processing error and the existence of a 2nd spin axis will both make measured RC appear flatter than they actually are. Hence, measured dV/dr being negative at large radius means that any correction will make the slope more negative, so this category would not be perturbed by either correction. It should represent uniaxial spin since the decrease is expected at very large radius, where the point mass approximation becomes reasonable. Support is provided by RC for the Milky Way, which is analyzed from the inside and so only spin around its c-axis can be detected. The Milky Way has negative dV/dr for its distal regions [51,52].
On this basis, we categorized the non-interacting spirals in Table 3 of [61] based on slope in the outer half of each listed spiral (Figure 7b). Please note that the RC profiles shown are much simpler than measured RC and that even the examples of Figure 3 and Figure 4 are much smoother than is common.
Flat slopes, posited as an distinct galactic category (Figure 7c), may represent negative dV/dr (Figure 7a), since asymmetries in flux-velocity peak shape would make the slope negative, irrespective of whether a 2nd axis exists.
Triangulum was listed in table 3 of [61], but due to its proximity to the much larger Milky Way and Andromeda galaxies, it is quite possible that the RC of small M83 is perturbed, just as orbits of their dwarf satellites are controlled by the alignment of the two giants. Thus, Triangulum is distinguished in the histogram of Figure 7c.
From Figure 7c, measured negative dV/dr is connected with ringed spirals, and thus with axial symmetry. Most of type SA have negative slopes, which is compatible with the overall uniaxial symmetry of this morphological type. Negative dV/dr is not observed in barred types lacking rings, which is consistent with observed departure from uniaxial symmetry.
Edge-on galaxies have a negative slope. This is expected because the presence of 2nd spin axis that is pointing along the LOS will have no effect, whereas the presence of a 2nd spin axis that is perpendicular to the LOS will alter the Doppler shifts most near the center, where elements greatly overlap. This deduction is based on envisioning horizontal compression of Figure 6a.
The results of Figure 7c point to the triaxial symmetry of many galaxies, as demonstrated in their visual images, affecting measured Doppler shifts. However, before the effect of triaxiality can be quantified, the raw data should be reprocessed to correct for the maximum velocity best representing the equatorial plane. Also, galaxies that are both isolated and non-interacting must be considered.

2.2.7. Summary and Prognosis

Determinations of accurate RCs, and therefore of effects such as non-circularity among the motions, are hampered because rings (actually coaxial cylinders: Figure 2f) are assumed and viewed as thin. In contrast, images of spiral galaxies show that density grades outwards from the center in all directions. Hence, the equatorial velocity is not represented by the peak in the velocity-flux diagram associated with each data acquisition, but instead is the maximum velocity along the LOS. Low resolution studies are more affected by this correction than high (~30% for ~1985, Figure 5a but ~10% for ~2008 [54,59]. The centers of galaxies have a larger systematic error than the outskirts, since it is less clear what the true equatorial velocity is, given the larger traverse associated with each data collection point, shadowing of elements, and stronger attenuation.
We have shown that the view of spirals as disks, rather than as oblate spheroids, has also greatly influenced the processing of the Doppler data that underlies rotation curves. Barred spirals visually appear to be triaxial ellipsoids, rather than oblate spheroids. Triaxial geometry necessitates that the motions of the stars are not circular. Irregularities in the Doppler patterns confirm that non-circular motions exist. Although these have been interpreted as the galaxy being warped, a self-gravitating body with 2-axes of rotation is much more likely (e.g., Figure 1a). If triaxiality is low, the short c-axis of any spiral galaxy should dominate its spin, and so the paths remain nearly circular. With low triaxiality, RC are slightly perturbed from axial symmetry, which explains the data summarized in Figure 7. Above, we inferred that the flat curves commonly observed for spiral galaxies contain a systematic error. The velocity should decrease, as observed for spirals with uniaxial symmetry but without interactions and perturbations by neighboring galaxies, and as expected at great distance from the center. When this systematic error exists, it is in the same direction as the processing error identified above.
Triaxial ellipsoid shapes are common, based on SB being the most populous galactic morphology. Whether the effect is simply a perturbation, involving slow rotation about the 2nd axis, cannot be ascertained until the processing of the Doppler shifts is revisited. If the triaxiality is large, then the key assumption underlying RC determinations is invalid, and values of v(r) must be analyzed with trepidation.
For several reasons, the remainder of this report focuses on models for the circular motions about the c-axis. First, spirals with rings have axial symmetry and therefore should have circular motions, which can be properly analyzed in the future. Second, behaviors can be predicted for circular motions and compared to available data. Third, once the Doppler data are reanalyzed, robust models are needed to understand motions inside spiral galaxies with demonstrably circular motions.

3. Forward Models of Galaxies that Presume Nested Orbits

Most models of RC treat the motions of stars and gas in a galaxy as being orbits. Interior potentials and forces differ from the exterior, but because these match on the surface of a self-gravitating object, considering orbits permits progress to be made towards understanding galactic rotation. This section focusses on general behavior.
Forward modeling is used in orbital models, where the density and shape are assumed in simulating RC (Table 1). The basic shapes considered are the point mass, oblate spheroids (which are spheres when e = 0), and the flat disk, which has some unrecognized problems.

3.1. Synopsis and Evaluation of the Mathematical Underpinnings of Forward Orbital Models

Equating the centripetal force for a test particle or ring of mass m to the gravitational attractive force recapitulates the early, 1970s explanations of v(r) measurements. Importantly, the moment of inertia is mr2 for any particle in a circular path, or for a thin ring or thin cylindrical shell about the special axis. Forces around a central point or outside of a spherical distribution of matter are described by:
F c e n t r i p = m v 2 s ; F s p h e r e = G M in m s 2   for   s > a
The variable s, the radius of a sphere, is used here to emphasize that such orbits are not restricted to any single plane. Equating the two forces in (6) yields Burbidge’s result (1) for the endmember case of k = 1. Such Keplerian orbits exist only around a central point mass or a spherical mass distribution, as follows:

3.1.1. Spheres vs. Point Masses

In the early studies of galactic rotation, the finding that their inner zones spun like a record was viewed as a puzzle. This view stems from confusing the physics of a mass that is restricted to a small central region with the physics of a mass that is distributed gradually over a spherical (or spheroidal) volume of interest.
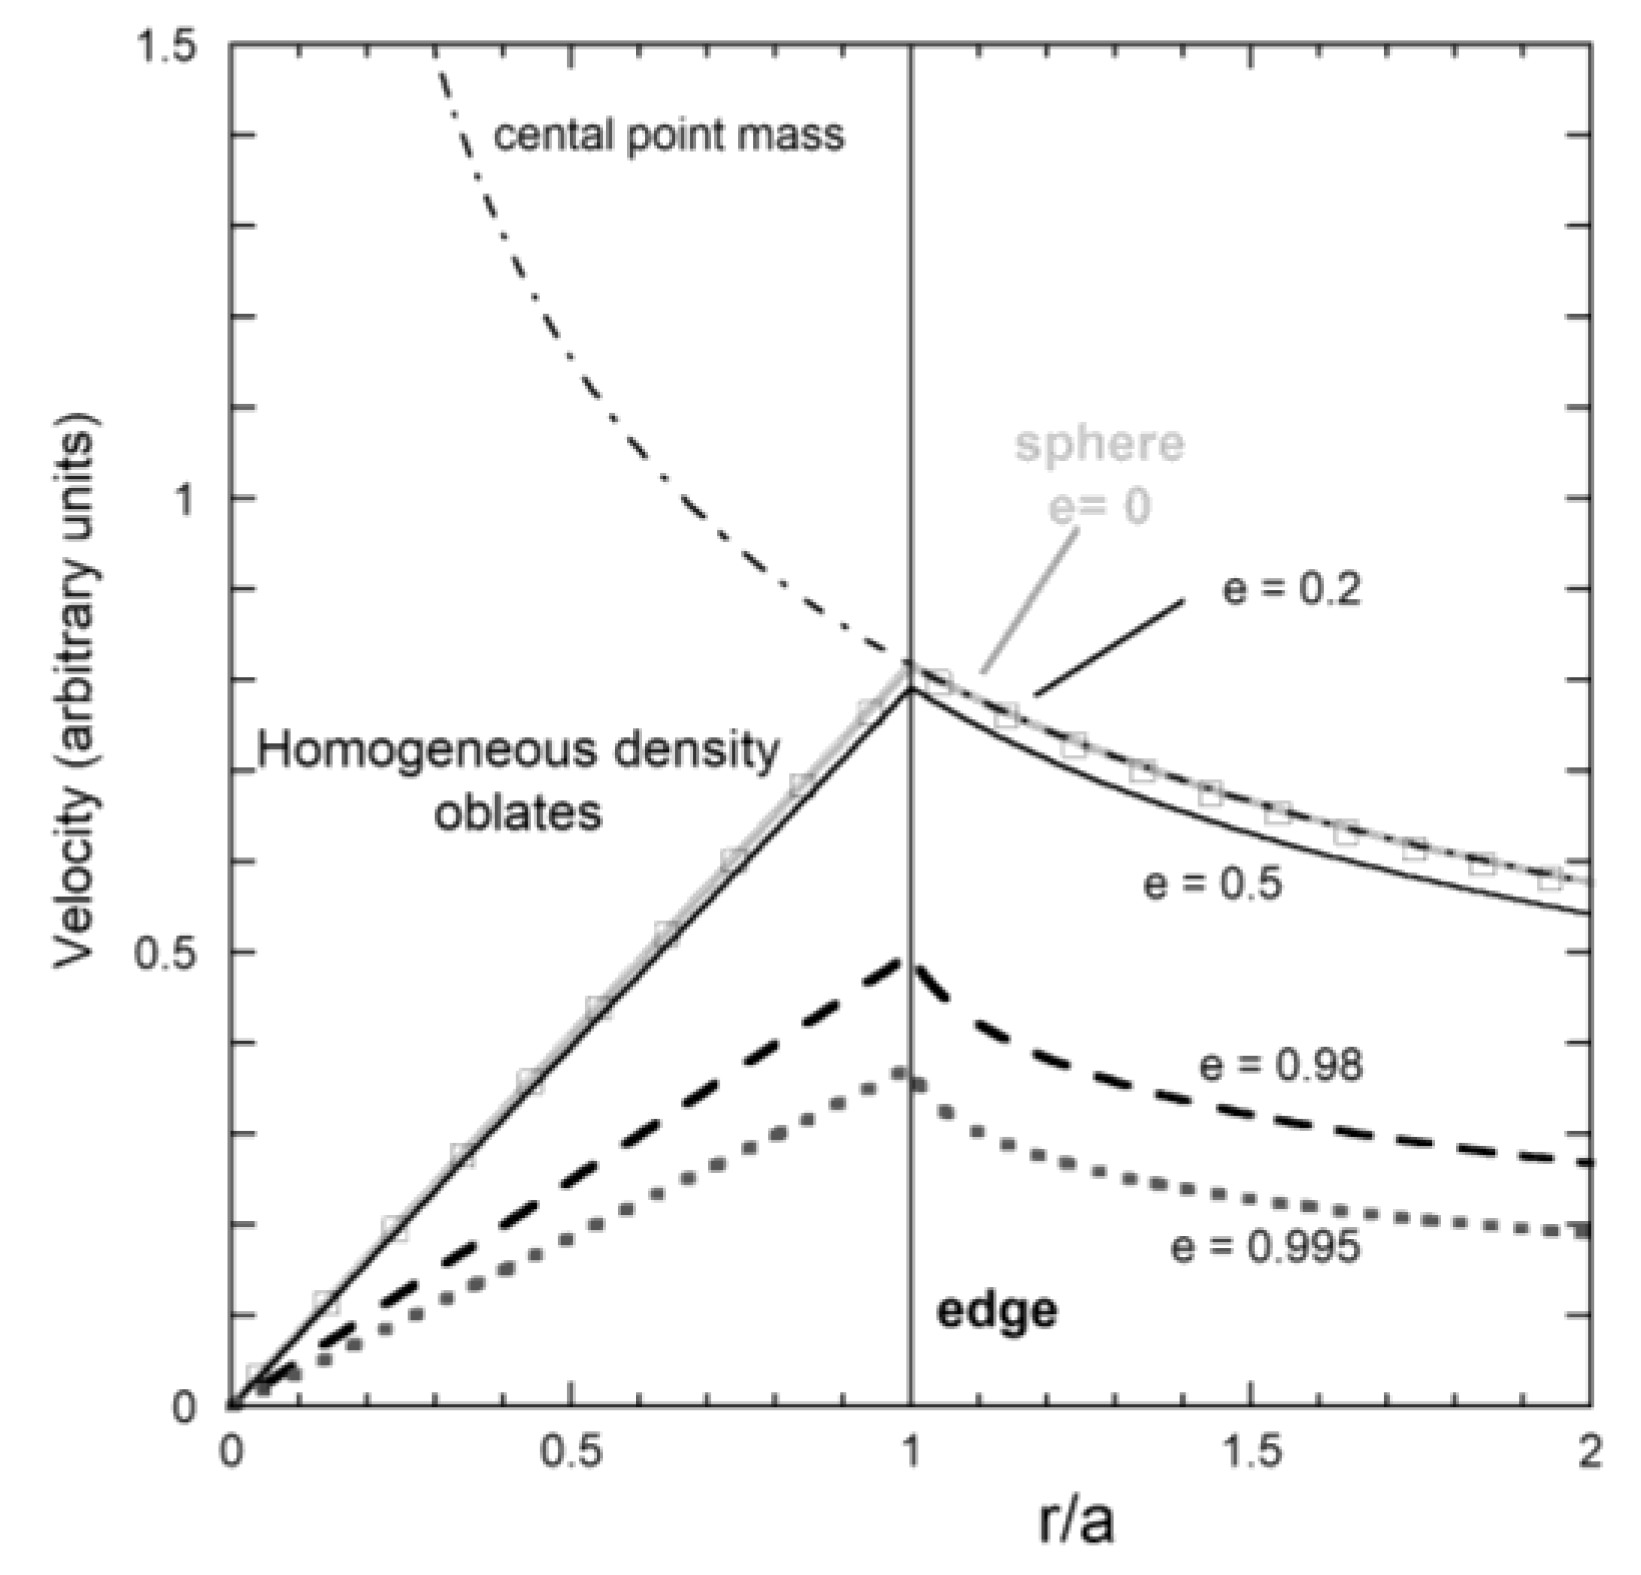
According to Newton, a tiny particle at radius r within a spherical distribution of matter is attracted to the matter inside r as if all that interior matter of total mass Min were positioned at the very center. Furthermore, Newton proved that shells of matter outside that radius exert no net force on the interior particle. This particle is equivalent to the test mass in an orbital problem. Hence, modeling a galaxy in the limiting case of a spherical mass distribution requires that Min grows with r up to the body radius a, whereupon growth stops. The result is Keplerian orbits when r > a, whereas for r < a, a velocity profile for a homogeneous object is linear, even if randomly oriented orbits are considered.
That velocity profiles are linear inside a homogeneous sphere or spheroid is trivial to demonstrate mathematically. For a particle or ring orbiting inside a homogeneous, spherical distribution of mass, the forces in (6) are equal, but an additional constraint of Min = 4πρ r3/3 applies. This substitution yields:
v = r 4 π ρ G 3
Equation (7) establishes the linear relation between velocity and radial distance for this particular orbital case. Instead, if spherical shells of the object are rotating coherently about a defined axis (Section 4), the moment of inertia differs from that of the ring by a factor of ⅔, but the velocity profile is nevertheless linear, and the object is again predicted to spin like a record (Figure 8).
Our analysis is analogous to Thomson’s atomic model, where the charge of the nucleus is distributed uniformly in a tiny sphere. The electrical force vs. radius ([49], pp. 695–697) accelerates a circulating electron with the same functional dependence as the case for the sphere in Figure 8.
A discontinuous change in dv/dr at the surface is expected for a body which abruptly terminates. However, galaxies become progressively rarefied as r increases. A rotation curve for a spherical galaxy would have a smooth peak, rather than a sharp corner as in Figure 8, because this density gradation can be considered to be the summation of progressively larger spheres, each with constant, but reduced, density.
To first order, measured RC have features resembling a spherical distribution of mass when orbits and Newton’s findings for a sphere are considered. Tangential velocities first increase from v = 0 at r = 0 towards some maximum value, and then decrease. This pattern recapitulates the RC pattern associated with a single spin axis and with a ringed morphology (Figure 7). However, with a spherical distribution, orbits need not be limited to the equatorial plane, but can possess the iconic picture of electrons, whose circular orbits crisscross about an atomic nucleus.
The Keplerian pattern can persist to the limit of r→0 only in the case of a central point mass. This case aptly describes our Solar System because the Sun’s radius is tiny compared to planetary orbits. However, for a Keplerian pattern to describe a galaxy, the mass at the center must be far larger than the mass of all the other stars combined. Because spirals are flat, most of their mass lies outside ~½ of their visible radii: see Section 4.

3.1.2. Oblate Shapes

The geometry of a galaxy does not alter Fcentrip of its constituents from (6) but greatly affects the pull of gravity in its interior. Spin is a symmetry breaking mathematical operation that creates a special axis. A body with a tiny difference between its c and a axes is an oblate spheroid, which lacks the special spherical symmetry.
The decrease in symmetry affects equations for the gravitational force about an oblate spheroid. The transcendental equations derived by Gauss and summarized by Schmidt [39] were recently recast [45] into a greatly simplified, yet exact, closed analytical form for the special axes:
F o b l ( r ) = 3 G M m 2 a 2 e 2 [ r a e ArcSin ( a e r ) 1 a 2 e 2 r 2 ] ;   F o b l ( z ) = 3 G M m a 2 e 2 [ 1 z a e ArcTan ( a e z ) ]
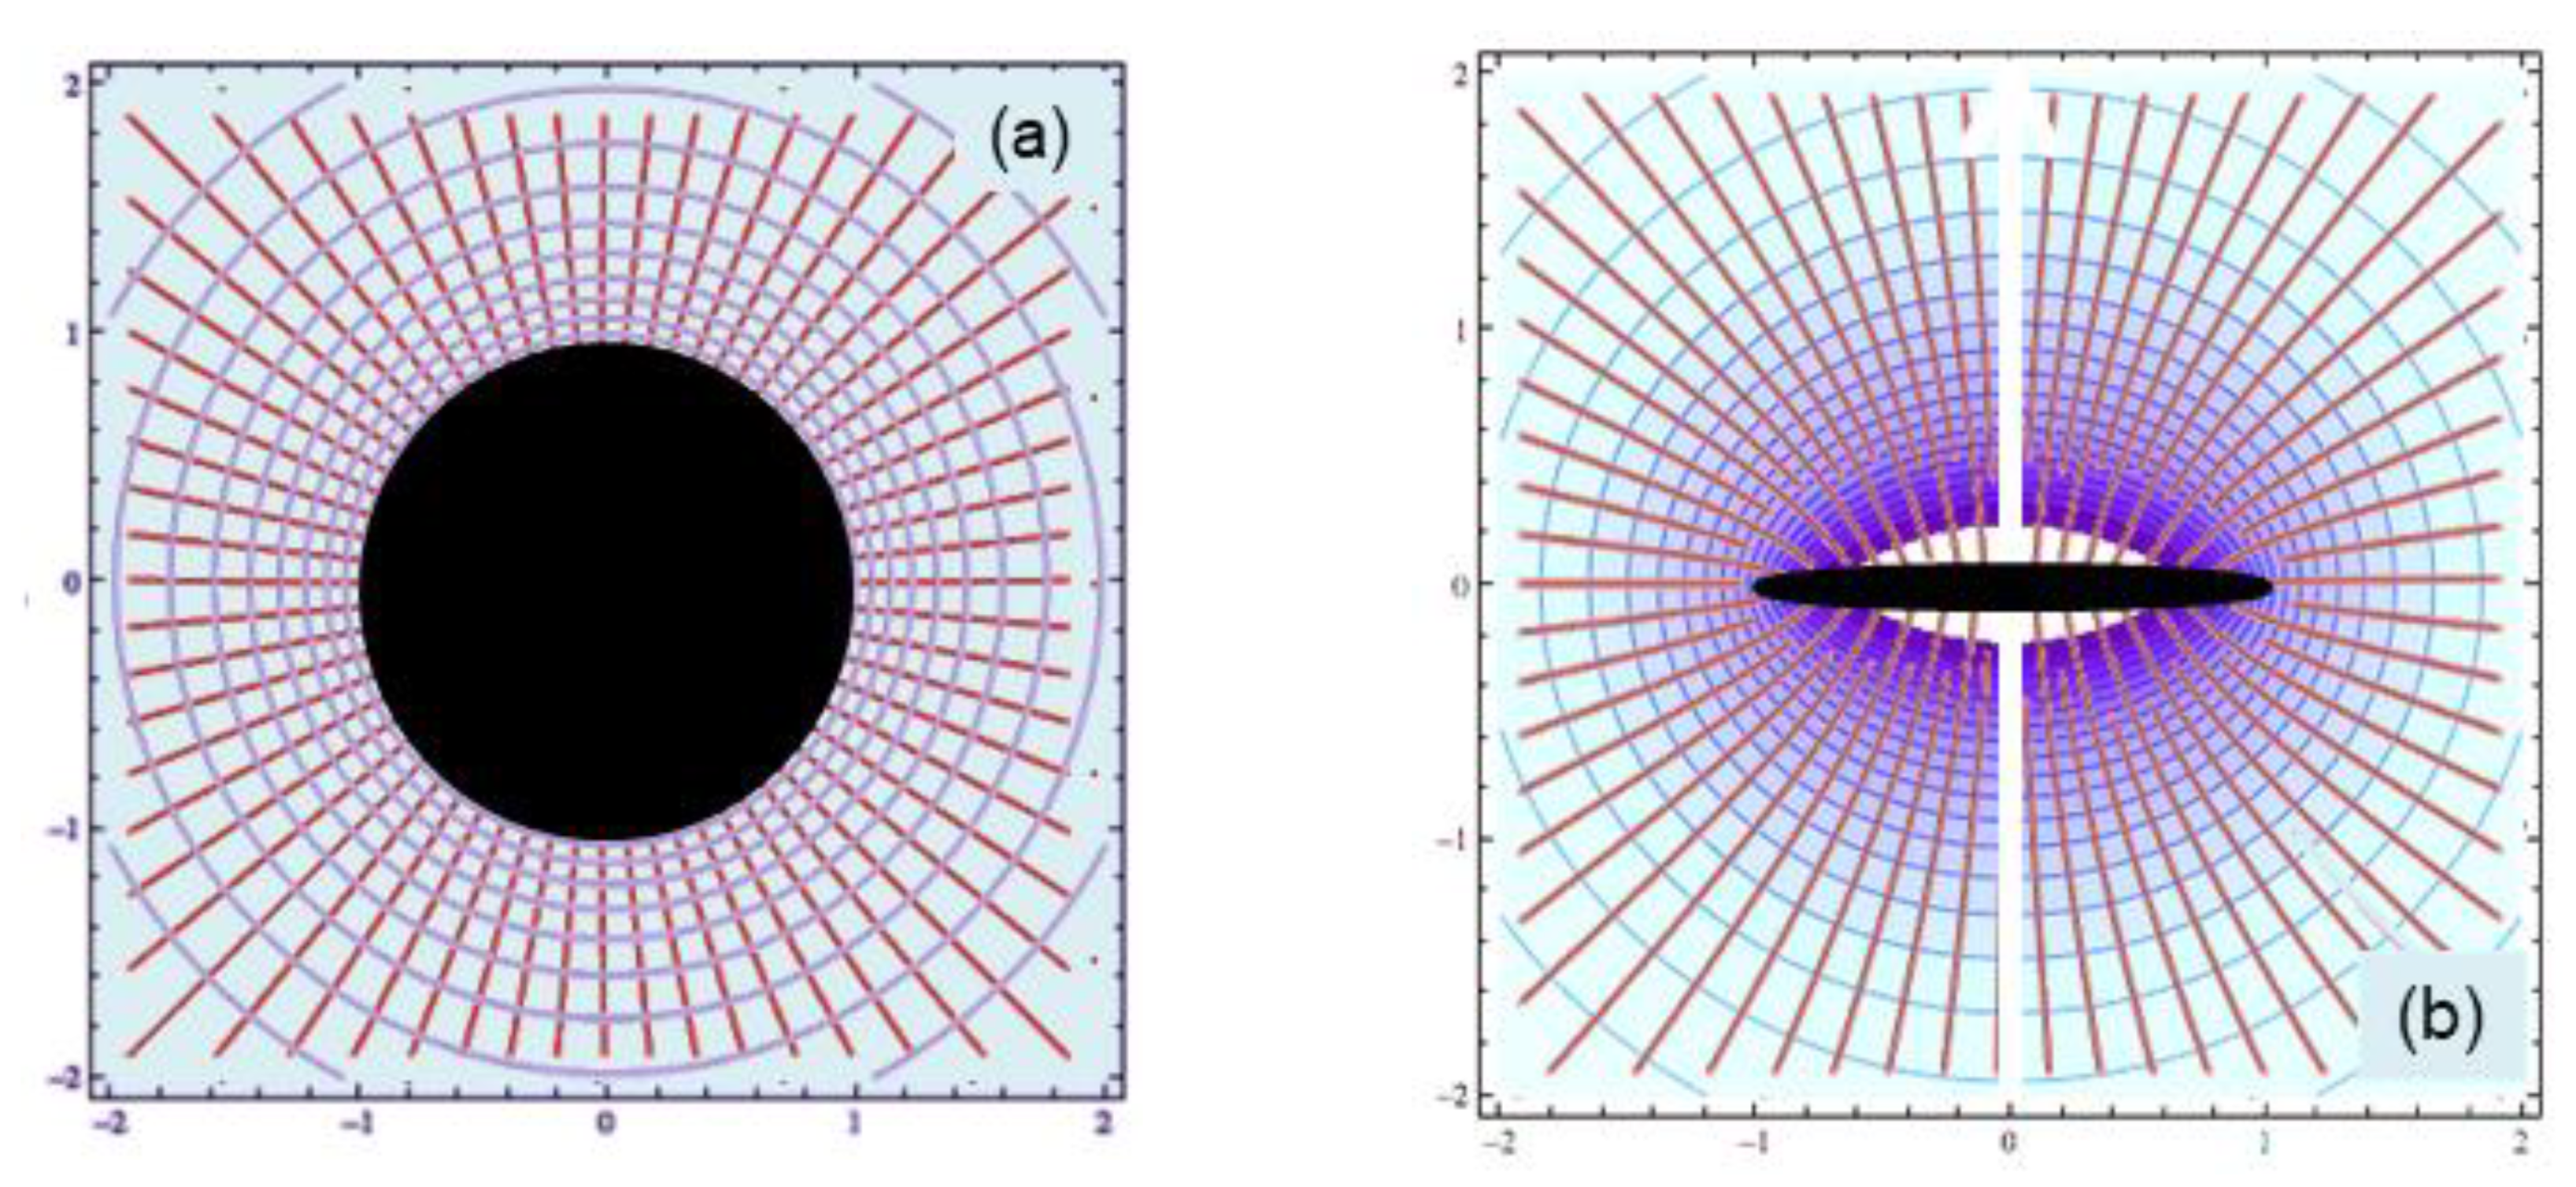
Forces around an oblate body are non-central. Not only does the force not go as 1/r2 from (8), but moreover the lines of force around a flattened oblate only point toward the center along the r and z axes (Figure 9). Behavior of rounder bodies is similar albeit less pronounced [45]. Consequently, stable particle orbits around a spheroidal mass distribution are either polar ellipses or equatorial circles: These limitations underlie the restriction of the orbits of dwarf galaxies around the proximal Milky Way and Andromeda to certain planes [45], and of the orbital patterns inside spiral galaxies to a very few types: normal, counter-rotating, or polar rings.
Balancing forces for a test particle or ring in the equatorial plane of the oblate object gives:
M in = v 2 3 G r 2 a 2 e 2 [ r a e ArcSin ( a e r ) 1 a 2 e 2 r 2 ] ;   M in ( e 1 ) = 2 a 2 v 2 3 G r 1 [ r a ArcSin ( a r ) 1 a 2 r 2 ]
where the RHS gives the limit as e→1. Please note that c/a~0.1 gives e ~0.995.
Newton discovered that any given homeoid in an oblate object only experiences a net gravitational attraction to matter in its interior. Hence, a requirement for forward models of RC is that Min grows with r up to radius a of the oblate body, whereupon growth stops. Consequently, flatter oblates have overall flatter rotation curves, whereas moderately round to nearly circular oblate spheroids (e→0), have essentially Keplerian behavior for r > a (Figure 8). A peak exists in RC for all ellipticities.
Physically realistic gravitational shapes produce orbital patterns with common features because all members of this family of objects behave similarly, as was deduced long ago by Newton and Maclaurin. Crucially, the gravitational force on objects in the equatorial plane does not follow 1/r2 until great distance is attained, per (8), leading to a much different formulation for the dynamical mass from (9), see Section 3.1.4. Basically, transformation of a sphere into an oblate shape causes proportionally more material to lie near the equatorial zones. The strong forces in the equatorial plane cause rotational motions associated with axial symmetry to lie in the equatorial plane. Comparing Equations (1) and (9) shows that k is close to 2/3, not ~1 as previously assumed. The excessive mass in NOMs stems from assuming central forces that decrease inversely with r2 plus using an overly large moment of inertia, that of a test point or ring.

3.1.3. Approximate Formulae for Rings and Disks

Forces around the equator of a thin disk have been incorrectly represented as central in NOMs approach. For transparency, we provide some simple formulae, using an approach similar to that of Kellogg [62] who considered the bar. Upper and lower limits to the force in the plane of an ultrathin ring are:
G M ring m r 2 2 3 b 2 < F ring < G M ring m r 2 b 2
where r > b, r is the distance of the test mass from the center, and b is the radius of the ring. Integration provides upper and lower limits to the exterior force around a homogeneous ultrathin disk of radius a. Numerical analysis (Figure 10a) of forces encircling a homogeneous ultrathin disk closely match our analytical upper limit of:
F disk , ext ( r ) G M disk m a 2 ln [ r 2 r 2 a 2 ] ;   F disk , ext ( z ) = 2 G M disk m a 2 [ z z 2 + a 2 1 ]
Force along the special z-axis, obtained earlier by two different integrations [45,63], is exact. Our results are consistent with exact formulae for the bar [62]. The force experienced when approaching the bar from its top (the z-direction) or the lateral side (the y direction) is well behaved, but the force along x becomes infinite at the tip of the bar.
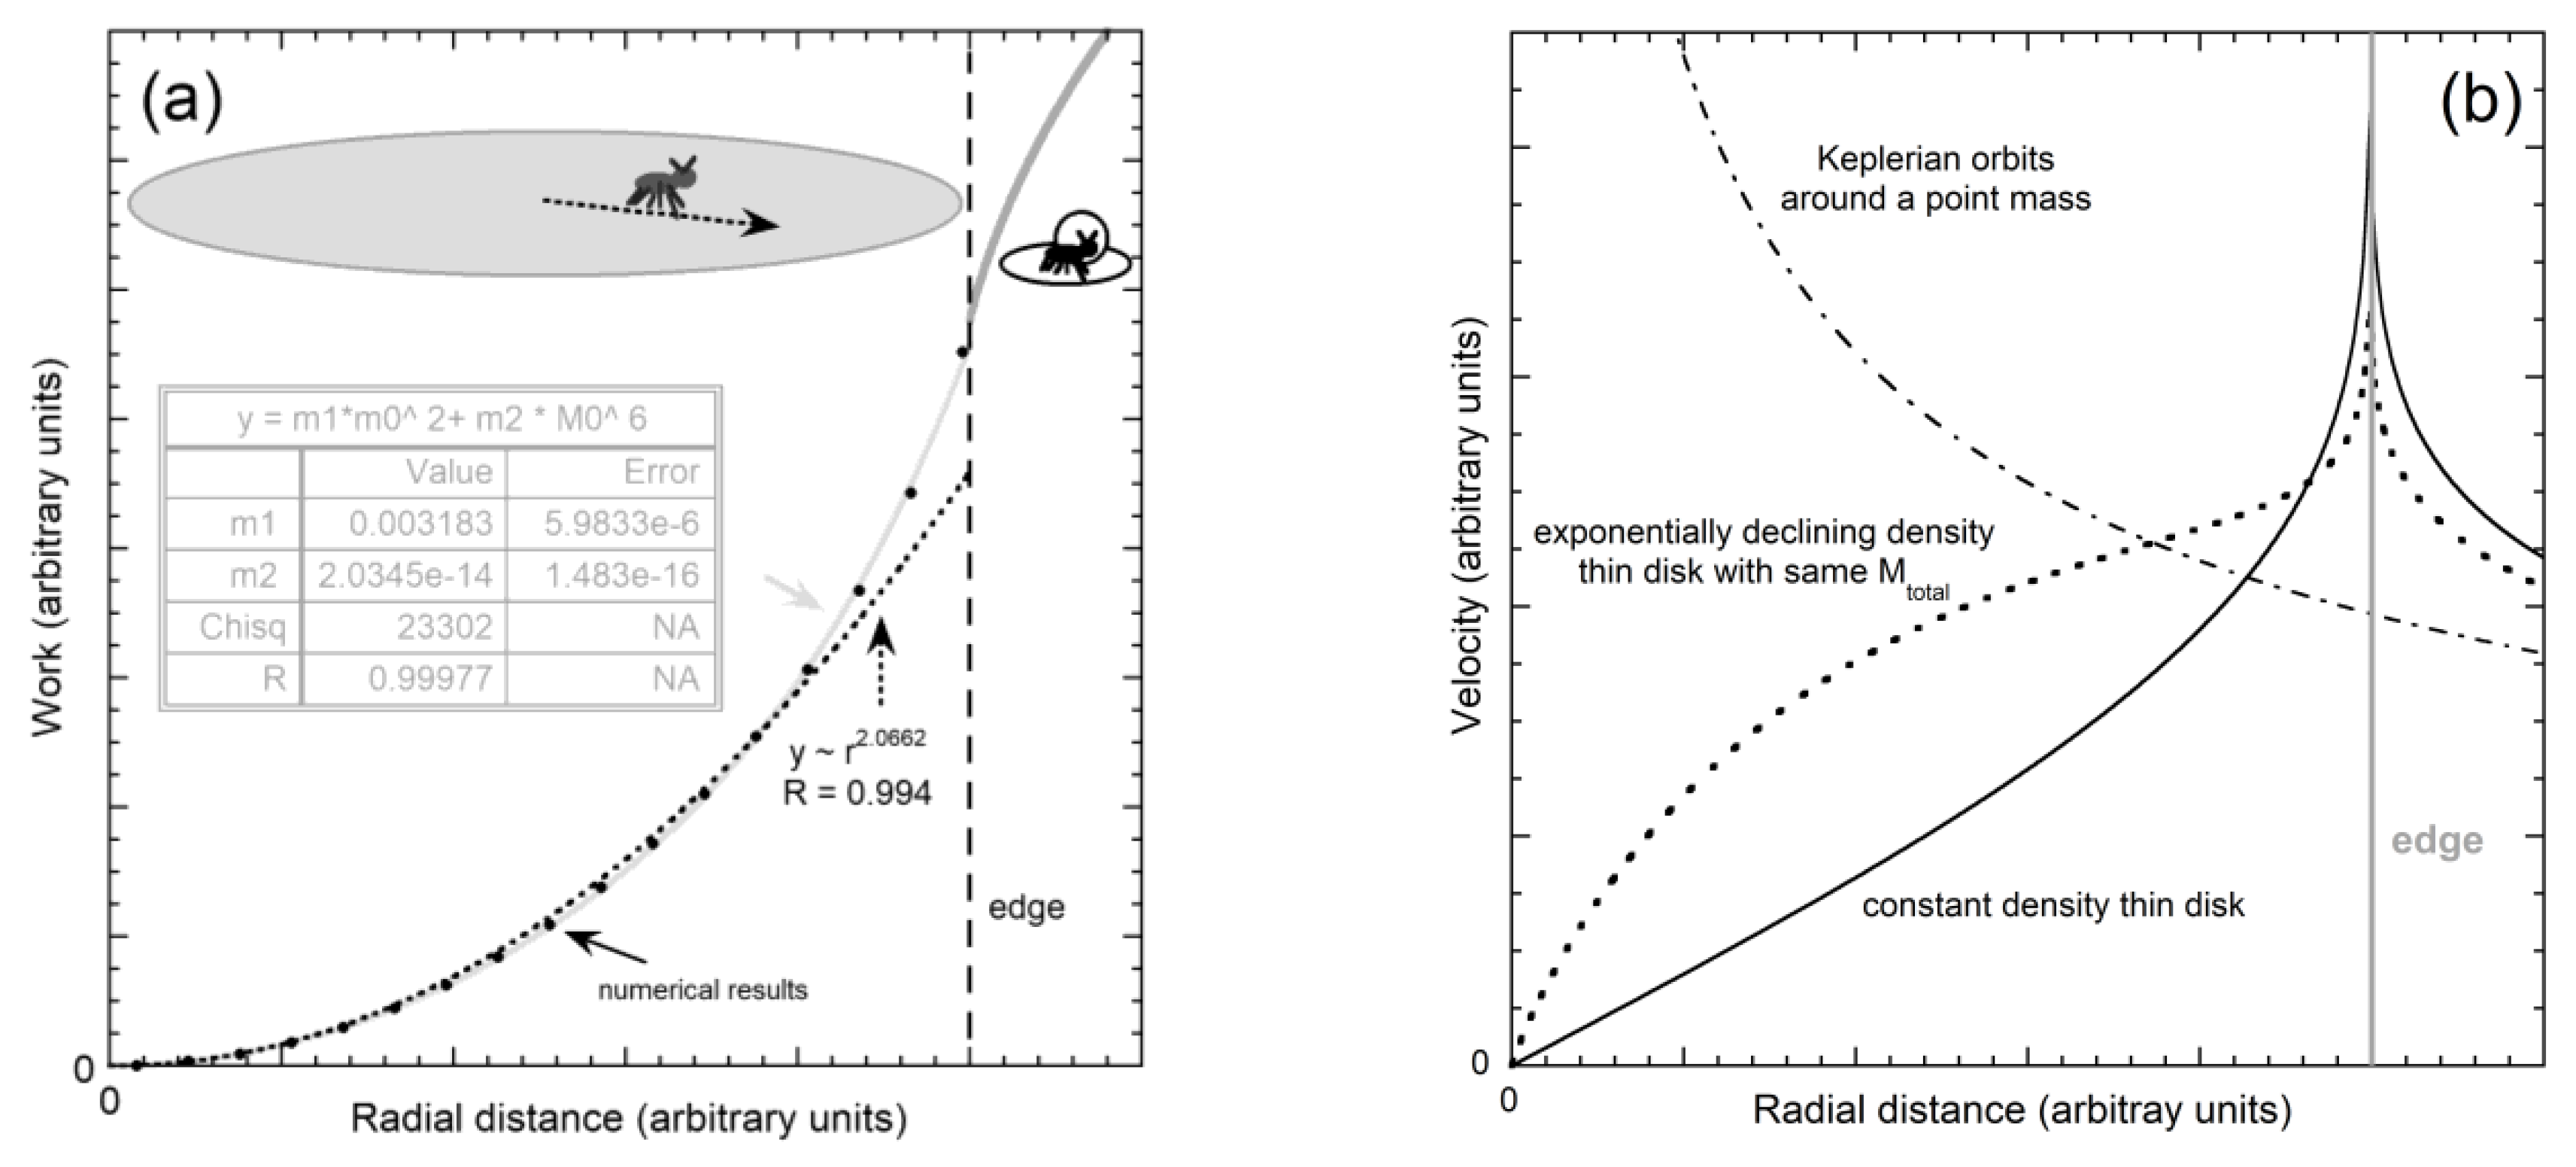
Regarding the interior of a disk, no theorem of Newton exists to guide us. Hence, we provide a numerical model of the work for an ant crossing a constant density disk (Figure 10a), which gives the force inside the disk, via work = force × distance. Fits to interior work are shown in Figure 10a. At the edge, a break in slope occurs, which is consistent with the singularity in our analytical approximation.
The interior force in a homogeneous disk is closely represented by our approximation:
F disk , int ( r ) G M disk m a 2 ( 1 r 3 a ) ln [ 1 r a ]   for   homogeneous   density
Non-centrality of the gravitational forces for a disk, as recognized by Feng and Gallo [64], is obvious in Equation (12). For the surface modeled here, there is no interior force along the z-direction.
Centripetal forces in the equatorial plane remain central, as in (6). Force balance gives the rotation curves. Numerical results are shown in Figure 10b for both constant and exponentially declining density, both inside and outside the ultrathin disk. At the center, the disk spins like a record. This is required under axial symmetry since no net force exists exactly at the center, regardless of the density distribution.
The infinite velocity predicted for r = a under constant density was not reproduced due to the finite size of the numerical steps. At the edge, a discontinuity in dv/dr exists for the exponential case. Figure 10b shows a moderately strong decline, and describes the effect of changing the attenuation, considering the limiting cases. The center of a finite sized body always spins like a record and a discontinuity at the edge of the disk will accompany any feasible density distribution for an ultrathin disk with a definite edge, because this is not a gravitational shape. The results converge to the Keplerian approximation at very large r.
The mass for a constant density ultrathin disk (from exterior orbits) is approximately:
M disk a 2 v 2 r G 1 ln [ r 2 r 2 a 2 ]   for   r > a

3.1.4. Geometry, Stability, and the Dynamical Mass

Currently, the dynamical mass is computed from (1) with k = 1 (e.g., [61]). The implicit, but seemingly ignored, assumption in using Mdyn = rv2/G is that r >> a. For this reason, Burbidge’s [4] evaluation of dwarf satellite galaxy orbits using (1) yielded a reasonable mass for the Milky Way.
Equations (9) and (13) for flat shapes yield different formulae for Mdyn in the limit of r = a:
M dyn , obl = 2 3 a v 2 G e 2 [ 1 e ArcSin ( e ) 1 e 2 ]   for   r = a ;   vs .   M dyn , disk 0   for   r a
For e = 0, (14) or (9) reduce to the result for the sphere (Mdyn,sphere = av2/G). Considering e→1 underscores limitations of the thin disk geometry. From Maclaurin and Todhunter’s [40] equation describing the connection of ellipticity and angular velocity in a self-gravitating oblates, no rotation in expected. Simply put, the limiting case (e→1, which is a plane) cannot rotate because the mass would be infinite per Equation (14), and the energy would be infinite since a is infinite.
A singularity in velocity exists at r = a in our analytical approximations (Figure 10b). The same holds for the tip of a flat bar [62]. This singularity makes it difficult to deduce the total mass from close orbits: i.e., approaching the disk from the outside yields a null mass (14). The limit r >> a yields the point mass formula, Equation (1), as it must, and so the total mass of a finite disk can be estimated from some large r > a.

3.1.5. Geometry, Coordinate Systems, the Theorem of Gauss, and Logarithmic Potentials

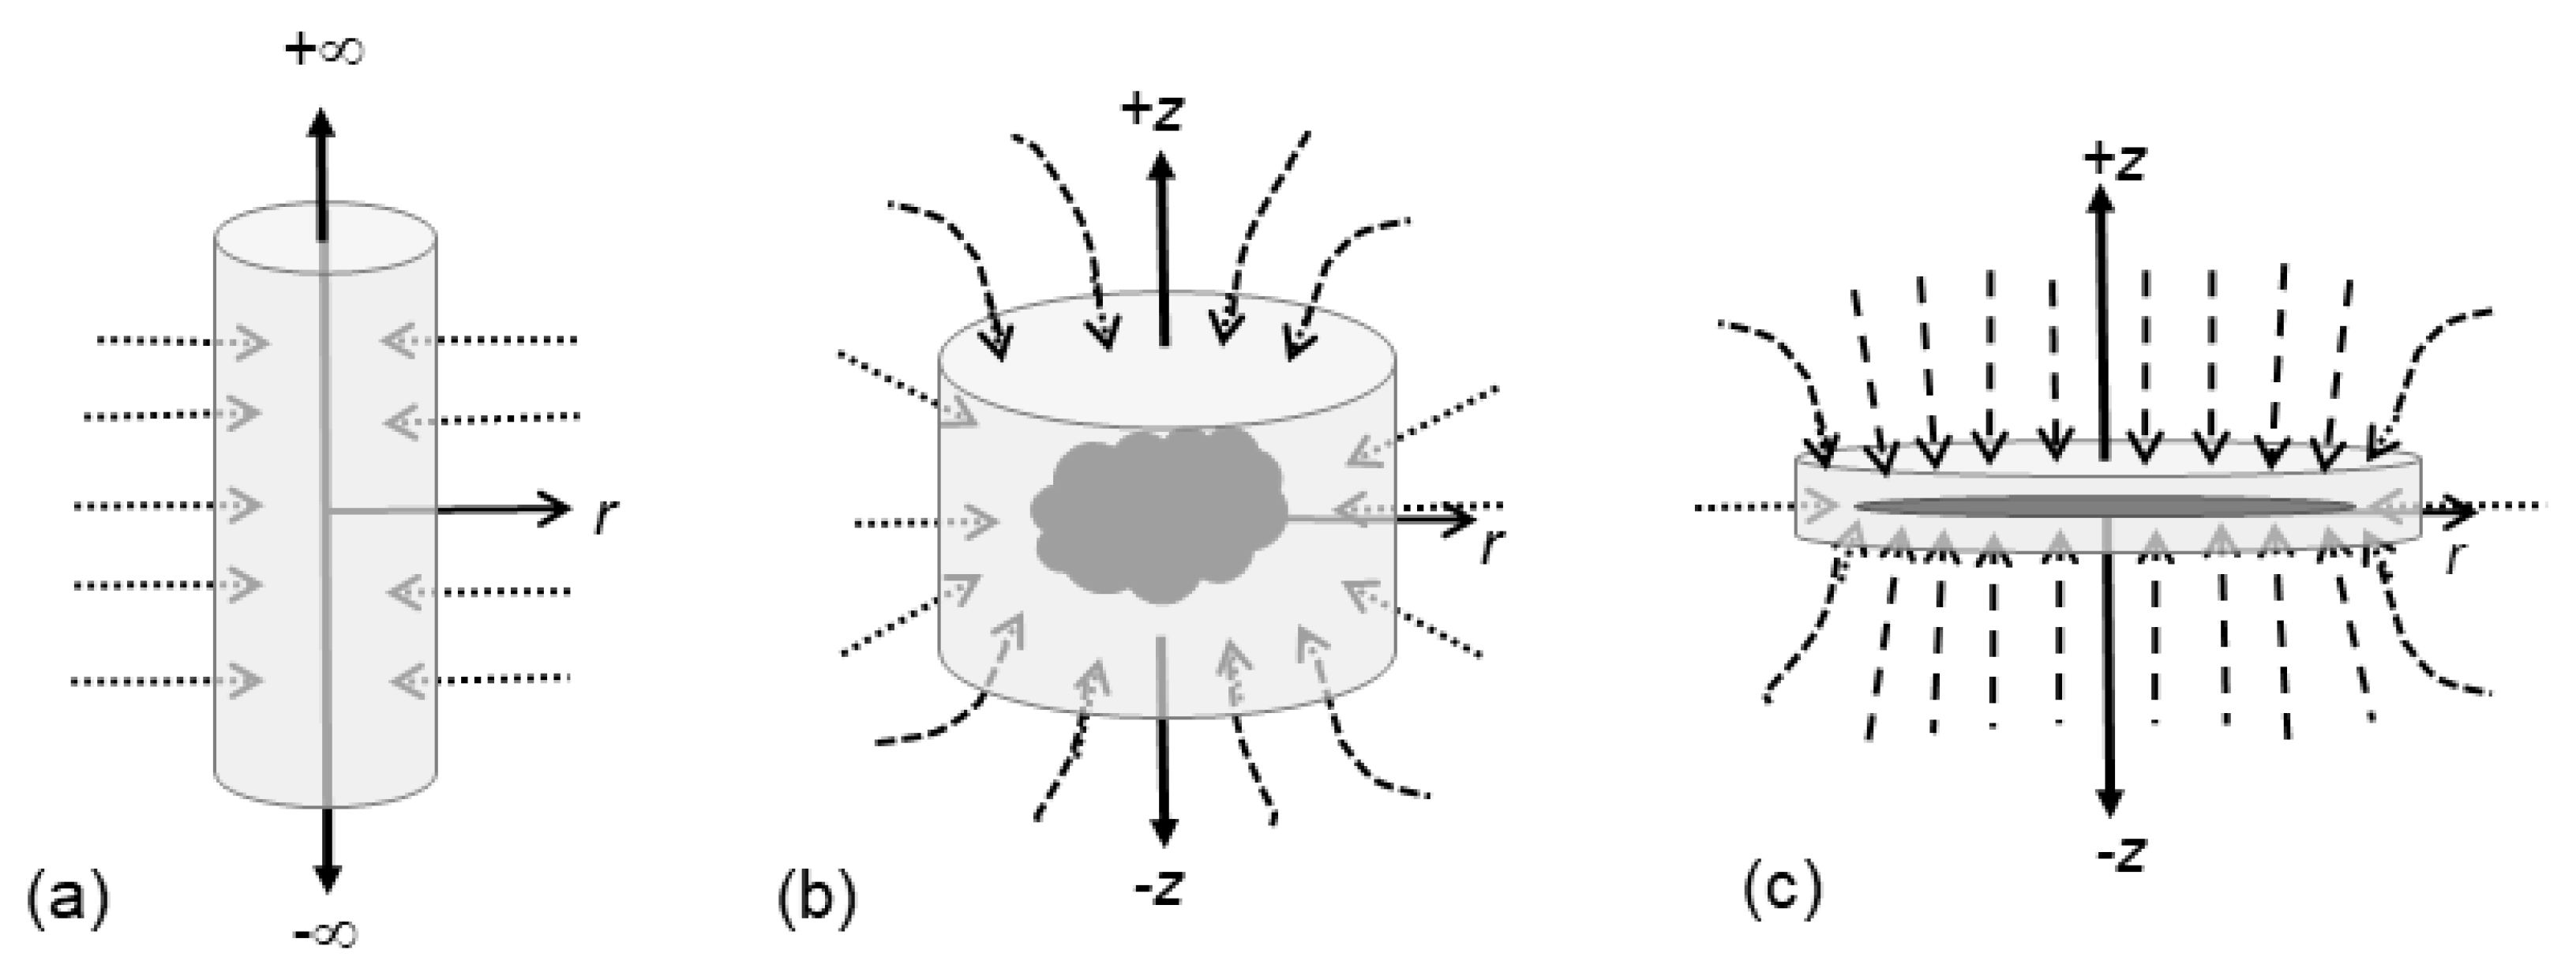
Many proposed solutions to the galactic rotation problem involve logarithmic potentials. One of two long lists of Evans and Bowden [65] consists of ad hoc modifications of a logarithmic potential, which itself is baseless, as follows: The simple logarithmic form is identical to the textbook solution for an electrical field around a long wire [49]. This familiar form for a Coulombic force is derived by applying Gauss’ theorem to an imaginary cylinder enclosing a wire (Figure 11). No algebraic manipulation can possibly transform the simple mathematical solution for a line of mass along the z-axis into something relevant to spiral galaxies, which are highly flattened in the z-direction.
Using the theorem of Gauss instead of Poisson’s equation requires only a single integration, rather than two, thereby avoiding ambiguity and greatly simplifying visualization. Also, specifying the origin and the coordinate system makes the limits of applicability clear [48].
For a long and thin vertical source, equipotential surfaces are concentric cylinders, and the attractive force is purely radial, with no component through the top and bottom of any enveloping cylinder (Figure 11a). For a stubby object (i.e., the vertical and radial length scales are similar, as in Figure 11b), the flux out of the ends of an imagined cylinder becomes increasingly important. For these stubby cases, the radial solution pertains only on the equatorial plane; plus, edge effects become increasingly important. Lines of force are straight only for the special direction (as in the oblate of Figure 9). For a disk, flux along z dominates (Figure 11c) because this is the largest and important surface. The force from a disk along z is a simple analytic solution that is not singular [49], but this is not the case along r: singularities exist, and no simple analytical solution apparently exists.
The other long list of [65] consists of ad hoc substitutions of some function of r, z, and a for the spherical radius in Newton’s gravitational potential of a sphere or point. Although dimensionally correct, none of these substitutions provide the prefactor of GmMin/a2 for the force associated with the exact result for an oblate spheroid (8) or with the asymptotic brackets on force for a disk (11). This prefactor must accompany all approximations for the potential of a disk, since it exists in the exact formulae for the special z-axis of the disk (12), as well as in F(z) for the oblate (8). The prefactor of GmMin/a2 originates in the symmetry breaking operation of spin which transforms spherical into cylindrical coordinates.
All substitutions listed or cited in [65] rest on the misconception that s in spherical coordinates is interchangeable with r in cylindrical coordinates. In comparing the Laplacian operator in the two distinct coordinate systems (i.e., Poisson’s equation), we neglect the angular variables to focus on the symmetry characteristics of the length coordinates:
4 π G ρ ( r , z ) = 1 r r ( r ψ r ) + 2 ψ z 2   vs .   4 π G ρ ( s ) = 1 s 2 s ( s 2 Ψ s )  
Solutions for ψ(s) take on a different mathematical form than solutions for ψ(r) because the mathematical forms for the volume elements in the cylindrical and spherical coordinate systems differ (rdθdzdr vs. r2cosθdθdφdr). Considering Gauss’ theorem leads to the same conclusion [48].

3.1.6. Toomre’s Mathematically Invalid Analysis of the Disk

Toomre’s [46] complicated potential function for the disk promoted use of this shape in galactic models. His derivation incorporates several mathematical errors, each of which invalidates his results. Due to the entrenchment of his study in galactic modeling, a detailed analysis is needed. For reference, Toomre’s 1st equation balances forces in the equatorial plane, as in all forward models:
v 2 r = ψ r = F r ( r )
whereas his 3rd equation is Poisson’s equation, i.e., (15), LHS. Both equations are correct.
  • Flat disks (Figure 2f,g; Figure 11c) require a simple relationship between surface mass density (σ), full thickness (H), and thermodynamic density (ρ):
    σ ( r ) = H / 2 H / 2 ρ ( r , z ) d z ;   σ ( r ) = H ρ ( r ) ,   if   density   along   z   and   r   involves   separable   functions
    When separation of variables is invoked for a disk of finite thickness, density off the plane at any radius equals the density at z = 0 and that particular r, and thus coaxial cylinders are being considered (Section 3.1.5; also see Section 4). As explicitly stated by Toomre below his 4th equation, no mass can exist off the plane. From (17), no mass off the plane means either H = 0, or the z-dependence of ρ entails a delta function, which amounts to the same thing while requiring separation of variables for ρ (i.e., Perek’s [47] specious declaration, see [14,48]). To provide his 4th equation which contains only surface density, Toomre [46] divided Poisson’s equation by H. Division by 0 invalidates Toomre’s 4th equation, and all equations thereafter, which specify the potential without a z-dependence. It is immaterial whether he set H = 0 before or after division. Additional problems with separation of variables are discussed below.
  • Poisson’s equation cannot be applied to a surface, as its use requires volume elements, per the discussion of Garland [66] (see his appendix), who based his work on Kellogg’s [62] 1925 edition. Similarly, MacMillan ([63] p. 124) states that the surface under consideration must be closed, which condition cannot be met by a plane. The above division by H = 0 is a simple explanation for application of (15) to a plane being a faux pas. Proof that an enclosed volume is required for (15) is straightforward per the theorem of Gauss [48].
  • Toomre’s 2nd equation proposes a solution to (15) which includes an exponential function of the from exp(−k|z|) where k is a dummy index that is used subsequently in integration. In Toomre’s 4th equation and thereafter he sets z = 0. Obviously, his analysis is limited to the plane, which is invalid, as noted above.
  • In his exponential function exp(−k|z|), k must be inversely proportional to some scale length, in accord with dimensional analysis and to provide a dimensionless argument kz. Because the relevant scale length along z is H and H = 0, k must equal some constant divided by H, and so k is infinite. Hence, k does not vary and cannot be used as the variable of integration, which invalidates Toomre’s analysis [63].
  • Use of an integral formula for the potential is invalid independent of all other mathematical errors. Because all integrals can be recast as summations, the potential Toomre provided is a summation of simpler component potentials. However, Poisson’s equation is non-homogeneous. From Pinsky [67] (Chapter 1), solutions to non-homogeneous differential equations cannot be summed (i.e., superimposed), as in homogeneous equations such as that of Laplace, where ρ = 0 One can arrive at the finding that Toomre’s 2nd equation cannot solve Poisson’s equation from another perspective: Obviously, the exponential dependence on z in Toomre’s 2nd equation involves separation of the potential into a some function of r multiplied by another function of z. Whereas separation of variables is commonly used to solve homogenous differential equations, it is not possible to solve an inhomogeneous differential equation in this way, e.g., [67].
  • Solving (15) using separation of variables is impossible, as revealed by inspection. Separation of variables for the potential requires that density also be a multiplication of two distinct functions, one of z and another of r. For this representation, the RHS of (17) holds at any given radius, and so the density does not depend on z. For this case, the potential cannot depend on z either. Toomre addressed this problem by setting z = 0, which prohibits solving Poisson’s equation.
  • From another perspective, in “dropping” the z-dependence of the potential in Toomre’s 2nd equation from his 4th equation and beyond, Toomre assumed that density is independent of z (via Equations (15) and (17)), i.e., he actually assumed that density is constant along the z-axis. Zero is a constant. Coaxial cylinders (Figure 2) is actually the geometry described in [46].
  • Due to the properties of the exponential function, Toomre’s component of the potential along z cannot reduce to the exact result for the special axis of a disk, which was known circa 1930 [63]:
    ψ disk , ext , axial ( z ) = 2 G M disk m a 2 [ z 2 + a 2 z ]
    Equations (11) and (18) respectively reduce to the correct, inverse square dependence of force with distance at great distance, and of potential with inverse distance, if their limits as a/z approach zero are properly evaluated. The exponential function does not reduce to this required functional dependence.
In summary, gravitation is a 3-dimensional phenomenon, as illustrated in Figure 11. Toomre’s incorrect analysis does not describe gravitation of a disk. Force summations are needed (Section 4).

3.1.7. Fundamental Mathematic Problems in Many Post-1998 NOMs Models

Simulations of RC in many papers involve summing individual contributions from different geometric constituents such as the bulge, disk, halo, and/or black hole. Most studies after ~1998 use Dehnen and Binneys’ [68] problematic modification of Poisson’s equation:
4 π G j ρ j ( r ) = 2 ψ
In these forward models, Equation (16) is used to fit RC, and so centripetal vs. gravitational forces are balanced in the equatorial plane, as in the early approaches.
The modification (19) and implementation via (16) are unjustifiable, even if the proper divergence of the gradient (LHS of (15)) is used [14,48]:
  • Densities do not sum, as discussed in numerous books on thermodynamics. Importantly, addition of densities in Equation (17) is equivalent to summing solutions of individual differential equations. Use of linear superposition is indeed described in RC literature [58,69]. Again, Poisson’s equation is a non-homogeneous partial differential equation: it is well-known that solutions to such equations cannot be summed (e.g., [67]).
  • It is immaterial what component is being summed: velocities, masses, densities (e.g., [30]), or v2, which is generally the case [29,58]. All are equally problematic. All such summations amount to linear superposition, which is allowable only for homogeneous differential equations, i.e., when ρ = 0 everywhere.
The underlying problem with post-1998 approach is that forces due to different geometrical shapes have different radial dependences except for the case of nested spheres. Hence, one exception exists regarding summation: If all components in the galaxy are distributed spherically, then summing v2 is permitted, since each of the different mass distributions can be represented by some effective point mass at the center. This approach stems from the force balance of Equation (1), and is a reasonable approximation for nearly round elliptical galaxies. Spirals cannot be treated in this way because the forces for this axially symmetric shape are not central and do not vary inversely with r2, as discussed in Section 3.1.2 and Section 3.1.3 and shown in Figure 9.
Deductions that NBDM haloes exist around spirals rest on summations that involve at least one non-spherical component. Proposals of haloes are underlain by improper mathematical analyses.

3.1.8. Relativistic Orbital Models

General relativity models are complex, so simplifications are required to construct forward models of RC. We discuss three studies by different groups.
Brownstein and Moffat [7] assume a symmetrical distribution of mass M over a sphere of radius s, which permits using the volumetric density. The centripetal force of (6) remains, but force on a test particle (mass m) in an orbit is modified to
F ( s ) = G m M ( s ) s 2 { 1 + M 0 M [ 1 ( 1 + s s 0 ) exp ( s s 0 ) ] }
Acceleration (a = F/m) is considered, since m cancels during force balance. The relativistic acceleration of (20) is non-central, and involves three fitting parameters: an acceleration (a0), a reference mass (M0), and a reference radius (r0). The number of free parameters is reduced to two by the Newtonian orbital result of a0 = GM0/r02. Reference values of mass and radius are linked via the formulation for density. For this reason, Brownstein and Moffat [7] consider their fits to involve one parameter. However, the function assumed for the density is also a constraint, and masses for stars and gas were modeled separately.
Lin et al. [33] describe relativistic acceleration as an asymptotic function, which makes their model quite similar to MOND (Section 3.1.9). Otherwise, both studies follow the same steps to simulate RC: (1) It is assumed that that s can be replaced by r in the non-central attractive force to represent the equatorial plane. (2) Different mass distributions are assumed for two components (e.g., H gas and other unconsolidated matter vs. stars). (3) Velocities or v2 for these two different mass distributions are summed and fit to RC.
Scelza and Stabile [34] base their analysis on (17). Potentials for a spherical bulge and a flat disk are summed. The bulge potential is a function of s only, but this is not so for the disk, where s2 = r2 + z2. As discussed above, velocities can sum only if the masses are spherically distributed and have central forces (i.e., going as 1/s2 where the vectors point to the center and the velocities are tangential to the spherical shells. However, because substitution of r for s is not justified in Newtonian physics (Section 3.1.5), this substitution is equally questionable in general relativity.
Other relativistic calculations exist, and are similar to those described above.

3.1.9. Modified Newtonian Orbital Dynamics

MOND is a phenomenological model. The initial proposal of Milgrom [5], used subsequently by Sanders and McGaugh [70] and others, assumes that Newtonian orbital acceleration (F/m) governs the central regions of a galaxy, whereas a smaller acceleration governs the outside. A critical acceleration divides the two regimes. Hence, an interpolation function is used to describe the variation in the acceleration across the galaxy. A popular form is:
μ ( x ) = x 1 + x 2   where   x = a a 0  
where a0 = GM0/r02, as above. Because acceleration decreases as r increases, forces in MOND are non-central.
As in the relativistic calculations, MOND models use two free parameters for the attractive force, assume circular orbits, and sum v2 when more than one mass type is considered. For such a summation to be valid, requires central forces (spherical distributions) for all components.

3.2. Comparison of Orbital Forward Models

Forward models simulate RC. The accuracy of a fit does not validate any particular model because certain factors supersede: these include the nature of the assumptions and the number of free parameters, most of which are used to describe the density as a function of radius for each galactic component invoked. For each component, the minimum number of parameters is two: one for constant density and one for its shape, whether the choice is explicit or not (Table 2). Additional parameters are required for more complicated density functions. The function for density also involves some choices, although this can be constrained from the luminosity with additional assumptions. Some force laws involve a free parameter. Only the force constant G of Newtonian gravitational force is experimentally constrained.
Table 2 summarizes forward models. Problems with some approaches are discussed in Section 3.1. Uncertainties and systematic errors in RC (Section 2.2) are neglected in the discussion to follow.

3.2.1. Allowable Number of Free Parameters

The number of free parameters in a robust physical model should not exceed the number of dependent, observational variables it proposes to explain. For example, one can weigh a colorless gem on a scale, measure its volume, and then ascertain whether this is a diamond or glass from the density. The problem is not constrained if additional free parameters or unknowns exist. If two gemstones are placed on the scale, one cannot tell which one is the fake, without making a second measurement. Elementary physics books present many such exercises. The precepts of linear algebra are quite clear: one equation (or observation) with one unknown can be solved; two equations (or observations) with two unknowns has a solution; three equations (or observations) are needed to constrain three unknowns, etc.
Images of galaxies constrain their shape and size. This information (Section 1 and Section 2) underlies the mathematical construction, as indicated in Table 2 and discussed in Section 3.1.
A rotation curve constrains one variable, the tangential orbital velocity (v) as a function of the radius (r) in the equatorial plane. The function v(r) may be complex, but for gravitational shapes, the velocity at any given radius is related to mass inside the orbit (Min), also as a function of r. In forward models, the assumed mass distribution is the input, although this can be cast as density for a specific shape. In general, terms the forward computational approach is (after Groetsch [27]):
M in ( r ) equation   for   force   law   v ( r )
Only one quantity, v(r), is known, so one free parameter is permissibly calculable at any given radius, for any given force law. This parameter is the mass or density function. Hence, summing components does not provide a definitive answer, even if summing the solutions for each component shape were mathematically permissible, which it is not unless all mass components were spherical (Section 3.1.6).
Ambiguity that results from multiple free parameters is discussed in cosmology [71], and has been recognized by users of the NOMs approach (e.g., [36,69,72,73]). Commonly, the NBDM halo component is minimized during fitting [35]. Even with such biasing, available estimates of DM proportions are huge, ~75% for the Milky Way [51,52] and >99% for some dwarf galaxies [19]. This situation occurs because a single mass distribution controls rotation via (22).
Please note that some authors pursuing relativistic or MOND models state that one free parameter was used. This count refers to the acceleration or reference parameter only, and does not take into account that the form used for density also involves parameter(s). If more than one mass is considered (e.g., stars and gas), more than one parameter was used for each component.
Thus, multicomponent models for RC are inconclusive, independent of their mathematical shortcomings. Haloes inferred in the NOMs approach are without basis, simply given the excessive number of free parameters, which is ~8 due to considering 4 shapes. Feng [20] provides further discussion.
The subsubsections below focus on models in Table 2 with a single geometry, none of which require NBDM.

3.2.2. Ambiguities in Force Laws

When the force law is not known, the RC forward problem cannot be solved unambiguously. MOND and relativistic models both use the Newtonian constraint for the central region [7], but model acceleration at great distance in different ways. For each of MOND and relativistic models, uniform acceleration parameters are obtained for many galaxies. This uniformity of parameters results from the following combination of factors: (1) use of non-central forces in these non-Newtonian models; (2) ellipticity in spirals being similar, so that the Newtonian force law of Equation (8) is similar for all galaxies; and 3) rotation curves have similar mathematical forms (Figure 7b).
Newtonian force laws depend on shape. If the shape is known, this is not a free parameter, but a constraint, because “G” in Newton’s law is experimentally constrained (see Section 3.1).

3.2.3. Density Formulations for Disk Models Based on Central Forces

All simulations of RC either assume a density structure or component mass, or construct a model for the mass in stars based on luminosity measurements. For the latter case, some approximations are needed to estimate the mass of unconsolidated material, which is not unreasonable but introduces uncertainties. Most of the functions used (e.g., the popular exponential function [74,75]) give high density near the center, consistent with central regions being brighter. Numerical calculations for the interior of a disk (Figure 10a) show that a simple exponential function provides tangential velocities that first increase with radius, and then flatten, in accord with one of the generic types of RC (Figure 7b).
Density functions are also restricted by the central limit of r→0, as follows: Because M is proportional to ρr3 for the oblate (or ρr2 for a disk), the existence of finite mass at the center requires that ρ increases at least as strongly as 1/r3 at the center of an oblate (1/r2 for a disk).
The log-normal function meets neither of these criteria. Yet, Marr [12,13] obtained reasonable fits to RC by employing a central force law, as in the NOMs approach. RC are replicated because the log-normal function compensates for the inappropriate use of a central force law (F~1/r2) for flattened shapes (Section 3.1). The apparent realism of the computed RC shape underscores the uncertainties inherent to forward modeling.

3.2.4. Approximate Analytical Models of the Disk with a Single Density

Our numerical calculations and approximate formulae for the disk yield a velocity that initially increases at small radius for both constant density and exponentially declining density (Figure 10b). The singularity in the force at the edge of the disk yields a discontinuity in v at r = a. Notably, both forces and velocities around either a point or a wire with finite mass become infinite as r→0. Neither the point mass nor the infinitely thin wire are real entities: these are mathematical conveniences. In applying these formulae, the test particle must be outside the central mass. The same holds for the disk, as the numerical calculations show that the entire disk contributes to the force on any given point: this was recognized in the inverse models of disks previously ([8,9,10,11,76], Section 4).
For a rotating thin disk of constant density, the gravitational pull of ~r1.06 per unit mass would be balanced by the centrifugal force ~v2/r, also per mass. The velocity inside such a disk would increase greatly outwards, stronger than r, as shown in our numerical calculation (Figure 10b). Hence, a hypothetical thin galaxy of constant density would spin with increasingly faster velocities on the outside than would a solid record with interior cohesive forces. Any concentration of mass towards the center would slow down the spin of the outer rings. Thus, rotation of the thin disk with some density function which decreases with r could, in principle, provide the basic shape of RC whereby velocities first increase with r, flatten, and then sometimes decrease roughly as 1/r. Figure 10b compares the numerical results for velocities in a thin disk with density that decreases exponentially outwards (as is commonly assumed) to v of a constant density disk and of a point source, all with the same total mass. Declining density provides an RC similar to those observed for galaxies, but with an undesirable edge effect.

3.2.5. Forward Models of the Spinning, Oblate Shape

Orbits are governed by the potential exterior to an object, whereas axial spin is controlled by the interior potential of the object itself. These two gravitational potentials are mathematically distinct but match at the surface. Section 4 focusses on the organized motions of the interior. Here we follow a forward modeling approach that is equivalent to the NOMs models, i.e., an orbiting test particle is considered but the interior is taken to be an oblate body composed of nested, equipotential homeoids.
Applying the Virial theorem while assuming the homeoids have the same ellipticity e as the surface of the oblate gives:
v hom eoid 2 = 3 G M in 2 r arcsin ( e ) e
[15]. The interior mass is obtained from:
M in = 4 π 1 e 2 0 r ρ ( q ) q 2 d q
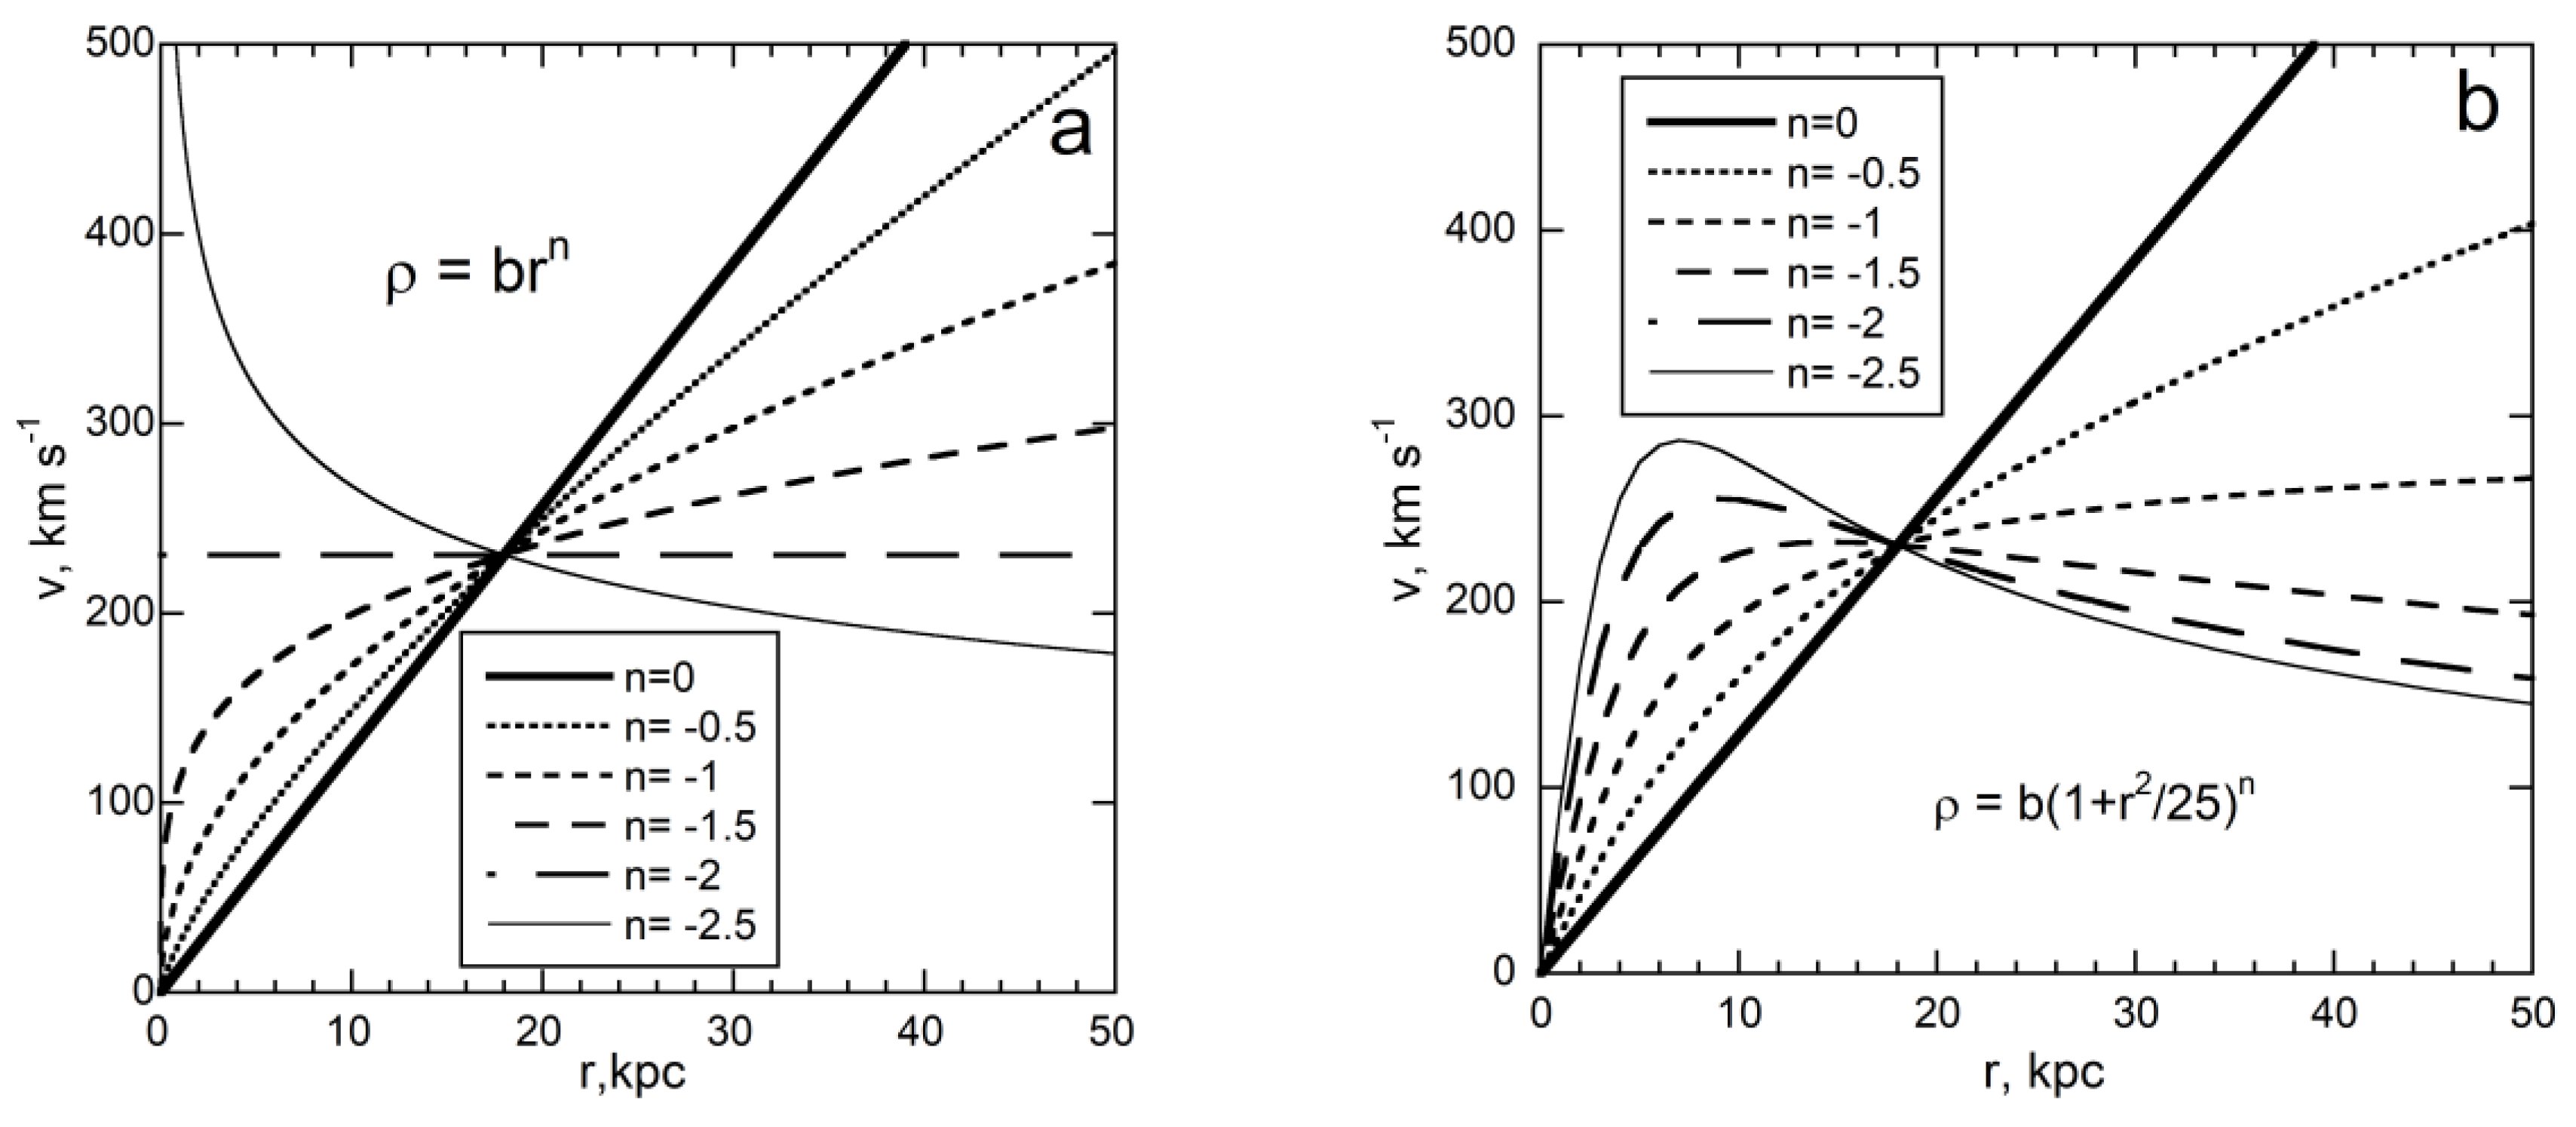
Figure 12 shows results for two different power law formulations for varying internal volumetric density which grades into the surroundings. These density distributions are similar to forms considered by Binney and Tremaine [43]. Figure 12a depicts the case ρ(r) = brn, where b was chosen for each value of n to provide a value for Min of 1011 solar masses at an equatorial radius of 18 kpc, which approximates the Milky Way. For n = 0, velocity v depends linearly on r, because density is the same for all shells; this result is the same as the interior of a rigidly rotating sphere or spheroid of Figure 8. Interestingly, for a power law with n = −2, the equatorial velocity does not vary with horizontal distance, but instead remains constant at [6πGb ArcSin(e)/e]½. Figure 12b was similarly constructed.
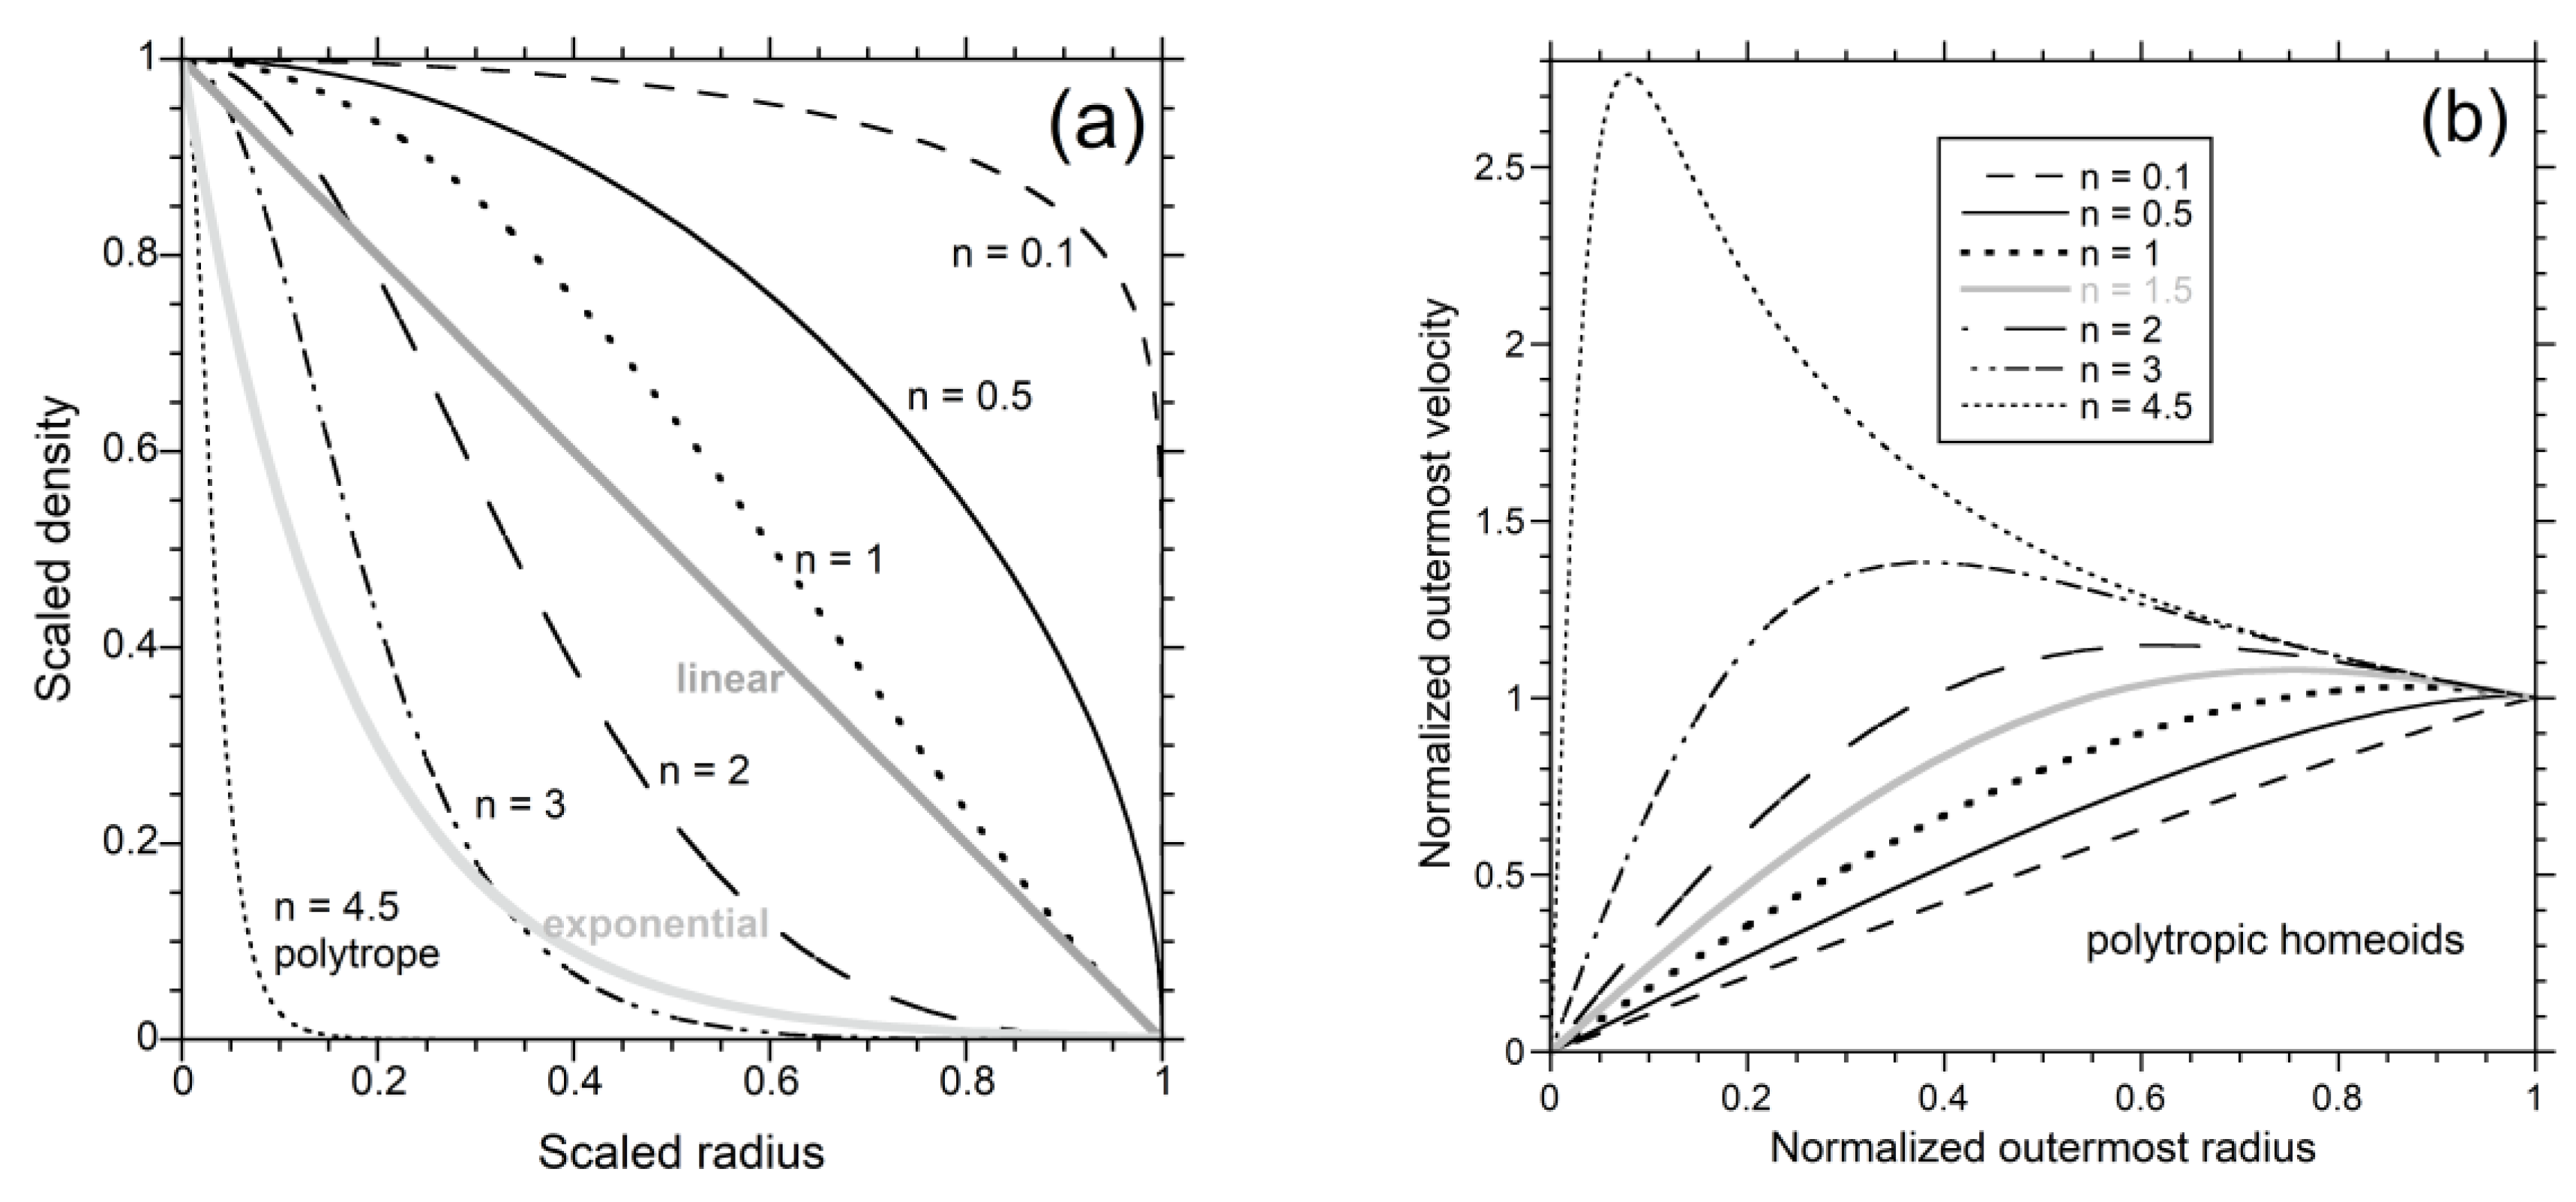
Another possible density function is Emden’s polytrope [77], which is associated with adiabatic (actually isentropic) compression of an ideal gas. Presumably, galaxies form when an immense gas cloud collapses under its own weight, suggesting that the present density distribution could be derived from that of the earlier state. Polytropes represent termination of mass at a finite radius (Figure 13a), and thus this function describes spiral interiors only, e.g., up to the edge in visual images of galaxies or to a fall-off in density to IGM values. Galaxies do not extend to infinity as does the popular exponential decay in density, although these are enveloped in a gaseous H2, H and He atmosphere (Figure 1).
The shape of the polytrope function depends on an index, n, such that n = 1.5 corresponds to monatomic gas (e.g., H or He) while n = 2.5 corresponds to a diatomic gas such as H2 (e.g., [78]). Indices > 1 give model RC declining at large distance (Figure 13b) that are similar to many measurements. Indices near 2 or 3 are promising because these have flat, concentrated density near the center (Figure 13a), and so resemble a galaxy with a bulge.
Many of the curves shown in Figure 12 and Figure 13 resemble generic RC of Figure 7b and actual RC (Figure 3 and Figure 4). This exercise indicates that RC variations result from density variations.

3.2.6. Summary

In summary, forward fitting models are inherently ambiguous because density is assumed and its radial dependence in a real galaxy need not be a simple, smooth function. The beautiful patterns of rings and spiral arms show that complexity exists whereby perfect radial symmetry is an approximation, and that density cannot vary simply with radius. A forward approach only allows evaluation of whether an assumed density (or mass distribution) is possible or plausible. Additional constraints are important, such as the luminosity and information on the proportions of stars to unconsolidated matter, both as a function of radius.
We have shown from elementary physics that the rotational velocity inside a self-gravitating body must increase with radius, irrespective of material properties. This increase exists for self-gravitating oblate spheroids and the limiting case of the sphere. The point mass is not an appropriate analogy for a flat spiral galaxy. Yet, this analogy underlies all proposals of non-baryonic haloes. The vertical line of infinite mass, which underlies the popular logarithmic potential [65] is likewise inapplicable.
These problematic analogies stem from the focus on orbits in astronomy, and from Gauss providing transcendental equations for the gravitational force around oblate spheroids [39], which is the most appropriate shape. More recent emphasis on the disk rests on Perek’s [47] unsubstantiated and incorrect declaration regarding density, and on Toomre’s [46] misapplication of Poisson’s equation to a plane (Section 3.1.6). Focus of the galactic community on the disk for > 50 years, which is not a gravitational shape, greatly limited progress.
Importantly, forces in and around a disk or an oblate spheroid are non-central, i.e., the dependence is not 1/r2 and the lines of force are only parallel to the special directions along the special directions (Figure 9 and Figure 10, [45]). Assuming central forces in NOMs models contributed to overestimating galactic mass. Forward models which are non-central, even with formulae that are unverified with experiments, provide reasonable masses and do not require NBDM haloes.
Despite the limitations of an orbital model, it is possible to fit the rotation curves with certain assumed density distributions. This has been demonstrated for ellipticals (e.g., Romanowsky et al. [79]) with a density distribution similar to that in Figure 12b. The particular distribution (n = −3/2) cancels terms in the relevant integral which permitted Binney and Tremaine [43] to provide a solution to the density with radius for an oblate body. Using equations describing nested homeoids in an oblate spheroid with diverse density formulations provides many solutions (Figure 12 and Figure 13) that resemble smooth, generic rotation curves (Figure 7b).
This exercise underscores that many simple density distributions are compatible with smooth, generic RC, and that the rotation of all spiral galaxies are “dynamically supported.” Literally, NBDM haloes are unsupported. Although much can be learned from a proper mathematical analysis of RC curves via forward models, the solutions are not unique, cf. Figure 12 and Figure 13. Extracting density as a function of radius from RC requires an inverse model, covered next.

4. Inverse Models of Galactic Rotation

The inverse approach is in the “reverse” direction of Equation (22), i.e., the character of the source is inferred from its effect [27]:
v ( r ) equation   for   force   law   M in ( r )
Ideally, no additional assumptions are needed, and the solution is unique. However, Newton’s law is 3-dimensional, whereas our observational view of galaxies is 2-dimensional. Hence, galaxies appear rounder than they actually are, motions are presumed to be circular, and Doppler measurements are presumed to represent the equatorial plane. Insufficient information requires some assumptions.
All the available inverse models for galaxies are grounded in Newtonian physics, but consider different shapes and use different computational approaches (Table 3). Each inverse model is unique, so we discuss these approaches individually. Early efforts on the oblate shape are covered in Section 4.3.
Oblate models provide volumetric density. Plane and disk models provide surface density (σ) which is actually a mass cross section, Equation (17). One can imagine a surface perpendicular to z, but above the galaxy: σ represents the total mass situated below the imaginary surface. The physical meaning of σ lies in its connection with the galactic luminosity, but adjustment must be made for internal attenuation of light, component luminosity, and for the estimated galactic tilt relative to the LOS.

4.1. Numerical Disk-Ring Models

Gallo and Feng [76] and Feng and Gallo [8,64,80] were the first to invert detailed measured RC. The geometry considered is a ring-disk model, similar to that of Bergeman [50] (Section 2.2.1). Feng [9] summarizes these efforts. A finite height, H, is assumed for the coin-like shape.

4.1.1. Mathematical Construct

Feng and Gallo’s [8,64,80] analysis is based on a force balance that sums a series of concentric rings (actually hollow cylinders). The dimensional equivalent of their key equation is:
  A m t e s t [ v ( r ) ] 2 r = G H m t e s t 0 a [ 0 2 π ( q cos θ r ) d θ ( r 2 + q 2 2 r q cos θ ) 3 / 2 ] ρ ( q ) q d q
where q is a dummy radial variable, the integral is over the disk to its full radius, a, and A = 1 in this dimensionalized form. Also assumed is that the moment of inertia = mtestr2, which is valid for a thin ring or hollow cylinder. The total mass M of the galaxy is related to the volumetric density (ρ) or the surface density (σ) by the following:
M = 2 π H 0 a ρ ( q ) q d q = 2 π 0 a σ ( q ) q d q
Volumetric density cannot be constrained without additional assumptions regarding H.
For numerical evaluation, (26) is non-dimensionalized, using A = avc2/(MG), a characteristic velocity (vc) defined by the RC, and two elliptical integrals (K and E):
  A 2 v 2 ( r ) = 0 1 [ K ( m ) q r E ( m ) q + r ] σ ( q ) q d q
This is Equation (6) in Feng and Gallo [64], who state that evaluating the integral of (25) for the case of finite ρ at the center gives the null value in the limit of r→0. Velocity at the center would also approach 0. This is also true for some singularities in density, as can be confirmed by setting r = 0 in the integral of (26). Cancelling the test mass, and multiplying both sides by r gives:
v | r 0 r G H [ 0 2 π cos θ d θ ] { 0 a ρ ( q ) q d q } r G H [ 0 ] 0 a ρ ( q ) q d q r G H [ 0 ] ρ | r 0 = r G [ 0 ] σ | r 0
Because the integral over the angle approaches 0 at small r, velocity will increase linearly with radius at the center as long as σ climbs to infinity no faster than 1/r. Feng and Gallo reached this conclusion by considering properties of elliptical integrals in (28).
Mathematically, Feng and Gallo’s inverse model is sound, but the assumptions need to be specified to interpret their results.
  • Values for H are arbitrary, as stated by the authors, who assumed H = 0.01a.
  • In this formulation, using σ(r) rather than ρ(r) eliminates the free parameter, H from (26). However, this simplification stems from assuming that density in (24) is independent of z, i.e., ρ(z,r) = ρ(0,r). Hence, the model actually describes rotating coaxial cylinders. As sketched in Figure 1 and Figure 2f, these can be tall, since H is unconstrained.
  • The limit of q = a was applied in evaluating the integral of (26). This step assumes that material near the edge of the disk affects motions of material near the center. This behavior is unlike Newton’s analysis of self-gravitating spherical and spinning oblate bodies, which shows that only mass internal to the test mass controls its orbit. Evaluation over the entire disk or cylinder is needed because these shapes are not gravitationally stable (Figure 2e).

4.1.2. Results of Ring-Disk Models

Feng and Gallo explored both idealized and measured RC. In all cases, their model produces singularities both at the center (r→0) and the edge (r→a). The central singularity is consistent with a coaxial cylinder geometry, which becomes the line source as r→0 (Figure 11). The additional singularity at the edge is inherent to a finite size disk (Section 3.1.3).
For an example of their extraction, Figure 14 shows RC and results for a moderate size (R)SA(r) counter-rotating galaxy, which motions require axial symmetry. NGC 4736 exhibits a ring and its velocity decreases with radius, which also indicate simple axial spin. Its rotation curve was determined out to the visible edge [53] and so depicts the dense interior.
Calculated surface density below 1 kpc (Figure 14a) goes as 1/r, which is quantitatively consistent with connection of a coaxial cylinder geometry to a line source. The surface density from ~1 to 9 kpc, which avoids the singularities, is well-described by an exponential function, as discussed by the Feng and Gallo [64].
Mass in Figure 14b was obtained by integrating σ, to eliminate specifying a numerical value for H. The form of the volume element in (25) leads to M = 0 at r = 0, despite the 1/r singularity in density. Hence, the mass is 4.45 × 10¹¹ solar masses out of 10 kpc for NGC 4736. Luminosity in the visible is much lower, ~1 × 10¹⁰ solar [42] for this nearly face-on spiral. The relatively large computed mass is connected with the assumption of disk geometry, whereby the thickness H is uniform from r = 0 to r = a, and in addition, ρ is assumed to the constant in the z-direction. For comparison, mass inside r = a, calculated for an ultrathin disk from the approximate formula of (13), is ~4 × 10¹⁰ solar masses, see Figure 14b. This rough value confirms that the additional density (mass) above and below the equatorial plane influences the inversion.
We emphasize that the large mass results from assuming a coin-shaped geometry. Despite its popularity in galactic astronomy, the disk is not a stable gravitational shape and so cannot quantitatively represent rotation of spiral galaxies.

4.2. Numerical Mass Summations in the Equatorial Plane

Sipols and Pavlovich [11] improved the matrix inversion model of Pavolich et al. [10], and explore the connection of mass with luminosity in detail. Our review is limited to their extractions of σ and mass from RC data. The geometry considered is the equatorial plane with a finite radius, a. Hence, negligible thickness was assumed.

4.2.1. Mathematical Construct

The key equation is (26), where surface mass is considered and A = 1; the mass defined in (26) also holds. Sipols and Pavlovich [11] approximated Equation (26) as a summation over a radial distribution of point masses, designated as mq for each radius (q) of interest:
V r 2 r = G q [ m q θ r q cos θ ( r 2 2 r q cos θ + q 2 ) 3 / 2 ]
As in Section 4.1, the entire disk contributes to motions of particles in the interior.
Rotation curves consist of N datapoints, which represent N orbits, and thus Equation (30) describes each of these orbits. The system is linear, and so inverting the above matrix [10,11] gives a unique solution for mr. Since these point masses are spaced in area elements, σ vs. r is provided, and the result is unique. To obtain the proper spacing of point masses, i.e., mass per unit area, the authors accounted for circumference being proportional to the radius. Pavlovich et al. [10] provide a detailed diagram of their geometrical construction.
Mathematically, the inverse model of Sipols and Pavlovich is sound: here we summarize the assumptions for comparison with other models:
  • An equatorial plane of finite radius a is modeled: so no mass exists above or below z = 0.
  • Each orbit is affected by all the mass points in this plane: As discussed in Section 4.1.1, no theorem of Newton exists to guide evaluation of an integral (or summation) in a disk geometry.

4.2.2. Results of Mass Summations in the Equatorial Plane

Sipols and Pavlovich [11] explored RC measured for a wide range of galaxies. To exemplify their extraction, Figure 15 shows RC and results for a moderate size, counter-rotating type (R)SAB(s)a galaxy, which motions require axial symmetry. Velocity of NGC 1808 decreases with radius, consistent with simple axial spin. Its rotation curves were determined out to the visible edge [81] and so depict the starry interior.
Calculated surface density at r = 0 is finite. Near the origin, σ declines exponentially whereas a weaker exponential decline describes most of the spiral galaxy (Figure 15a). The upturn in σ as r→a is consistent with the singularity inferred analytically, but not seen numerically due to finite step size in the forward modeling (Figure 7b).
Mass in Figure 15b was obtained by integrating σ via (27). Their calculated mass is 4.4 × 10¹⁰ solar masses at 14.2 kpc for NGC 1808. Luminosity in the visible is lower, 5.9 × 10⁹ solar [42], in part due to the tilted presentation, where the major axis appears to be 2.1× the minor axis. Because the area of an ellipse is πab, but the area of circle is πa2, the luminosity of a relevant, face-on presentation would be 1.2 × 10¹⁰ solar. NGC 1808 is actively forming stars and so likely has substantial unconsolidated gas. For comparison, we calculated mass outside r = a, for an ultrathin disk from the approximate formula of (14) as ~4 × 10¹⁰ solar masses, which is in good agreement with the matrix inversion of [11], see Figure 15b.
Results for the plane from [11] are reasonable. However, mass exists above and below the plane in spiral galaxies (Figure 1), and affects the rotation curves.

4.3. Analytical Model of the Oblate

Results of Newton, Maclaurin, Gauss, Todhunter, and Clausius were combined by Criss and Hofmeister [15,44] to provide an analytical inverse model of the volumetric density, ρ(r,z), from data on v(r) and ellipticity of differentially spinning galaxies. Our model assumes quasi-steady-state conditions, which underlie interpretation of galaxy Doppler patterns as circular motions. This assumption is consistent with the oblate spheroid shapes of spiral galaxies documented in images (NED [42]) and intensity contours (e.g., Figure 1), because this shape is the hallmark of a gravitationally stable, spinning entity. The preferred axis of rotation and the organized motions of galaxy constituents show that the phenomenon is spin, not orbits.
Here we note that previous efforts, predominantly of Burbidge [4] and Brandt [82], used the exterior potential and orbits. This approach does not permit inversion of RC and investigation of the interior, particularly as Brandt divided by zero, see [15]. These efforts are more closely related to our forward models, but do not account for Newton’s homeoid theorem. After the long hiatus in considering the oblate shape, we started from the beginning, considering galaxies as differentially rotating homeoidal shells.

4.3.1. Mathematical Construct

Each homeoidal shell (Figure 2d) is equipotential, which requires constant density, and provides stability, per Newton. As the galaxy is a bound state (restricted in both r and z), Clausius’ Virial theorem holds, which relates kinetic to potential energy. Conservation laws are independent, additional restrictions [83]. The gravitational self-potential was provided by Todhunter [40], based on the historic geometrical constructions of Maclaurin. Differentiating this well-known result gives the gravitational self-potential for a homeoid of mass m = ρdV = 3ρVdr/r that surrounds an interior mass Min. A similar approach gives its moment of inertia:
U g , homeoid = G M in m r arcsin ( e ) e   ;   I homeoid = 2 3 m r 2
Applying the Virial theorem or balancing forces gives the same result:
v hom eoid 2 = 3 G M in 2 r arcsin ( e ) e = v tan 2
Differentiating and some algebra [15,44] yields the inverse solution as:
ρ ( r ) = 1 6 π G ( 2 v r v r + v 2 r 2 ) e 1 e 2 arcsin ( e )
Only the r dependence of density need be specified because the z-dependence is defined by the ellipsoidal shape of the homeoids (Section 2.2.1). Homeoids are nested: the same ellipticity as the oblate surface is used for the interior of a galaxy.
Equation (33) is analytic and exact, has no free parameters, and allows direct and unambiguous extraction of density and mass profiles from RC. If e is not known, c/a = 0.1 is used, as indicated by light contours of edge-on galaxies. Ellipticity does not have a large effect on velocity (32) because the geometrical factor arcsin(e)/e ranges only from 1 to ~1.57, in covering shapes from a sphere to the infinite plane (e = 0 to 1).

4.3.2. Results for Differential Spin

Equation (33) was applied to 36 spiral galaxies, and 15 additional types (spiral, lenticular, irregular, spheroidal, elliptical, and polar ring) using a commercial spreadsheet [15].
Excluding the bright centers and diminishing furthest reaches, density approximately follows r−1.8. For all galaxies examined, ρ at the visual edge does not vary much, such that the average value of 1.1 × 10⁻²¹ kg m−3 matches ISM density. The visual edge, being an isophote, is defined by a certain concentration of luminous matter in the galaxy. Association of the visual edge with a certain value of density indicates that total mass correlates with star mass. Consistency exists: luminosity of the 51 galaxies studied linearly depends on the radius associated with the visible edge (Figure 14 in [15]). Further out, the density decreases to roughly IGM values. Near the centers of most galaxies, ρ is like that independently determined for molecular cloud cores, such that larger galaxies, are more concentrated at their centers.
Galaxies are density stratified just like any other self-gravitating body. Likewise, galaxies have a visible edge with some surrounding gas (H, H2) whose density becomes very low at great distance. Galaxies thus have “atmospheres.”
Figure 16 shows two examples, those analyzed using disk models of Figure 14 and Figure 15. NGC 4736 was analyzed earlier by us, but using lower resolution data of Sofue et al. [81]. Results are nearly the same for mass. Larger NGC 1808 is more massive, consistent with its size. Also indicated in Figure 16 is that its density is higher overall. The high-resolution curve of NGC 4736 shows internal structure: rings of rarefied regions are prominent, which is consistent with its morphology [42].

4.4. Comparison of Inverse Models

Our analysis of the oblate shape, which assumes c/a = 0.1 if unknown, provides less mass than the thick disk model, which includes mass in the corners, but more mass than the ultrathin disk model, which does not include material off the equatorial plane. Thus, masses obtained in the three inverse models depend on the volume for the assumed shape in the expected order.

5. Discussion and Conclusions

This paper reviews and evaluates two important matters regarding the rotational motions of spiral galaxies. First, we have analyzed the mathematical extractions of rotation curves from Doppler data on spiral galaxies. We have shown above that Doppler data need to be reanalyzed, and that rotations about more than one axis might be important, particularly for the complex motions within large galaxies.
Second, we have evaluated and compared the various models applied to RC to infer distributions of mass in galaxies that are associated with their presumably circular rotational motions and presumed gravitational stability. Forward models cannot provide unambiguous results, because the number of free parameters is excessive. Also, smooth variations in density with radius are too simple, given the complexity of visual images. Only inverse models can be analytically unambiguous, but the results depend on the geometry assumed. To us, the oblate spheroid is the most appropriate simple shape for galaxies, as it is supported by thousands of images and consistent with Newtonian physics. As was evident centuries ago, gravitation is a 3-dimensional phenomenon, and the oblate spheroid is the stable shape of a spinning object, large or small.
To better understand the present emphasis on the coin-like shape (the disk) in galactic modeling, a quote from Samuel Pierpont Langley [84] is useful. He likened the progress of science to “a pack of hounds, which in the long-run perhaps catches its game, but … where the louder-voiced bring many to follow them nearly as often in a wrong path than in a right one.” Perhaps we can offer additional insights, from the privileged perspective afforded by the currently rapid advances in science and engineering.
The focus on the coin shape for galactic models originated with declaration of Perek [47] in 1958 that density in z and r directions are independent. This unsupportable contention is one component of the improper treatment of Poisson’s inhomogeneous equation by Toomre [46]. One could argue that the oblate shape was set aside because Gauss’s transcendental formulation of its potential is not readily tractable [39]. However, Toomre’s mathematics are even more obscure, far less user friendly, and do not reduce to the proper Newtonian limits at large distance. Perhaps the answer lies in the discovery that velocity profiles describing the outskirts of galaxies are rather flat. In inappropriately comparing this observation to the familiar behavior of the few discrete planets in the Solar System, another wrong turn was taken, one that spawned the concept of non-baryonic dark matter surrounding galaxies. Rotation curves at centers were also misanalysed, in part because differences between discrete and effectively continuous distributions of mass were not considered, but also because the disk, unlike the stable oblate spheroid, lacks a theorem of Newton to facilitate the analysis of its interior. It may seem strange, but the sphere is a better approximation to a spiral galaxy than a disk, as shown in figures on the density and mass extracted for the Milky Way [15] and Andromeda [44] for the case of e = 0. This is verifiably true, due to Todhunter’s recasting of Maclaurin’s geometrical constraints into useful formulae for the gravitational self-potential [40]: An oblate body is nothing more than a flattened sphere.
A type of aether, NBDM, is supported by cosmological models, which contain many free parameters [71], and cannot be validated, any more than the origin of life can be established. Not all questions can be answered with scientific methods, as evolutionary phenomena hide their beginnings, e.g., via bifurcations, as discussed by Nobel Laureate Ilya Prigogine [85].
Over-specialization and compartmentalization may explain the publication of Brandt and Toomre’s papers on galactic rotation, both of which divide by zero. One can argue that the author of any article holds the ultimate responsibility for the correctness of its contents, rather than any reviewer, editor, or publisher. This is true, but critical analytical review, followed by post-publication scrutiny, are of the utmost importance to scientific progress. Experimental evaluation can indeed be difficult in astronomical studies. However, model-to-model comparisons provide no proof that a methodology is valid. Software development and popularity of multicomponent modeling have masked many errors in mathematics and physics incorporated in galactic orbital models.
A third problem is the pretense that consensus is the arbiter of correctness (see e.g., [1]). Practically no major advance in human history has ever satisfied this criterion. Among human shortcomings are that no one likes to admit they were wrong. Max Planck provided a lengthy analysis, which Paul A. Samuelsen encapsulated as “Science progresses, funeral by funeral” [86].
Most scientific research represents incremental embellishments of standard schemes. At least up until the current time, no progress can be made in galactic dynamics within the current framework of two competing, major camps with minimal mutual interaction. Specifically, real progress has reached a standstill for both the non-baryonic dark matter and non-Newtonian camps. We hope that the reader, in closely examining this paper and others in this special issue, will agree that it is time to pursue alternative lines of investigation. Only new avenues will further understanding of the physics underlying the rotational motions of the immense, self-gravitating, and evolving entities known as galaxies.

Author Contributions

Both authors contributed equally to all aspects of this research, but A.M.H. was primarily responsible for manuscript preparation. All authors have read and agreed to the published version of the manuscript.

Funding

This research received no external funding.

Acknowledgments

The authors thank Zoey Zhang for her considerable help in bringing this special issue to completion.

Conflicts of Interest

The authors declare no conflict of interest.

References

  1. de Swart, J.G.; Bertone, G.; van Dongen, J. How dark matter came to matter. Nat. Astron. 2017, 1, 0059. [Google Scholar] [CrossRef] [Green Version]
  2. Rubin, V.C.; Ford, W.K. Rotation of the Andromeda nebula from a spectroscopic survey of emission regions. Astrophys. J. 1970, 159, 379. [Google Scholar] [CrossRef]
  3. Faber, S.M.; Gallagher, J.S. Masses and mass-to-light ratios of galaxies. Ann. Rev. Astron. Astrophys. 1979, 17, 135–187. [Google Scholar] [CrossRef]
  4. Burbidge, G. On the masses and relative velocities of galaxies. Astrophys. J. 1975, 196, L7–L10. [Google Scholar] [CrossRef]
  5. Milgrom, M. A modification of the Newtonian dynamics as a possible alternative to the hidden mass hypothesis. Astrophys. J. 1983, 270, 365–370. [Google Scholar] [CrossRef]
  6. McGaugh, S.S. A tale of two paradigms, the mutual incommensurability of LCDM and MOND. Can. J. Phys. 2015, 93, 250–259. [Google Scholar] [CrossRef] [Green Version]
  7. Brownstein, J.R.; Moffat, J.W. Galaxy rotation curves without nonbaryonic dark matter. Astrophys. J. 2006, 636, 721–741. [Google Scholar] [CrossRef] [Green Version]
  8. Feng, J.Q.; Gallo, C.F. Modeling the Newtonian dynamics for rotation curve analysis of thin-diskgalaxies. Res. Astron. Astrophys. 2011, 11, 1429–1448. [Google Scholar] [CrossRef]
  9. Feng, J.Q. Rotating Disk Galaxies without Dark Matter Based on Scientific Reasoning. Galaxies 2020, 8, 9. [Google Scholar] [CrossRef] [Green Version]
  10. Pavlovich, K.; Pavlovich, A.; Sipols, A. Newtonian explanation of galaxy rotation curves based on distribution of baryonic matter. arXiv 2014, arXiv:1406.2401P. [Google Scholar]
  11. Sipols, A.; Pavlovich, A. Dark matter dogma: A study of 214 galaxies. Galaxies 2020, 8, 36. [Google Scholar] [CrossRef]
  12. Marr, J.H. Galaxy rotation curves with lognormal density distribution. Mon. Not. R. Astron. Soc. 2015, 448, 3229. [Google Scholar] [CrossRef] [Green Version]
  13. Marr, J.H. Entropy and Mass Distribution in Disc Galaxies. Galaxies 2020, 8, 12. [Google Scholar] [CrossRef] [Green Version]
  14. Hofmeister, A.M.; Criss, R.E. The physics of galactic spin. Can. J. Phys. 2017, 95, 156–166. [Google Scholar] [CrossRef] [Green Version]
  15. Criss, R.E.; Hofmeister, A.M. Density Profiles of 51 Galaxies from Parameter-Free Inverse Models of Their Measured Rotation Curves. Galaxies 2020, 8, 19. [Google Scholar] [CrossRef] [Green Version]
  16. Forbes, D.A.; Lopez, E.D. On the Origin (and Evolution) of Baryonic Galaxy Halos. Galaxies 2017, 5, 23. Available online: https://www.mdpi.com/journal/galaxies/special_issues/baryonic_galaxy_halos (accessed on 2 April 2020). [CrossRef] [Green Version]
  17. Tumlinson, J.; Peeples, M.S.; Werk, J.K. The Circumgalactic Medium. Ann. Rev Astron. Astrophys. 2017, 55, 389–432. [Google Scholar] [CrossRef] [Green Version]
  18. Ackermann, M.; Albert, A.; Anderson, B.; Baldini, L.; Ballet, J.; Barbiellini, G.; Bastieri, D.; Bechtol, K.; Bellazzini, R.; Bissaldi, E.; et al. Dark matter constraints from observations of 25 Milky Way satellite galaxies with the Fermi Large Area Telescope. Phys. Rev. D 2014, 89, 042001. [Google Scholar] [CrossRef] [Green Version]
  19. DeVega, H.J.; Salucci, P.; Sanchez, N.G. Observational rotation curves and density profiles versus the Thomas-Fermi galaxy structure theory. Mon. Not. R. Astron. Soc. 2014, 442, 2717–2727. [Google Scholar] [CrossRef] [Green Version]
  20. Giagu, S. WIMP dark matter searches with the ATLAS detector at the LHC. Front. Phys. 2019, 7, 75. Available online: https://doi.org/10.3389/fphy.2019.00075 (accessed on 19 February 2020). [CrossRef]
  21. Peccei, R.D.; Quinn, H.R. CP Conservation in the presence of pseudoparticles. Phys. Rev. Lett. 1977, 38, 1440. [Google Scholar] [CrossRef] [Green Version]
  22. Nagano, K.; Fujita, T.; Michimura, Y.; Obata, I. Axion dark matter search with interferometric gravitational wave detectors. Phys Rev. Lett. 2019, 123, 111301. [Google Scholar] [CrossRef] [PubMed] [Green Version]
  23. NRAO. National Radio Astronomy Observatory (see the gallery of images). Available online: https://public.nrao.edu/gallery/warped-disk-of-galaxy-ugc-3697-2/ (accessed on 30 May 2020).
  24. CHANG-ES. Continuum Halos in Nearby Galaxies- and EVLA Survey. Available online: http://www.queensu.ca/changes (accessed on 26 January 2020).
  25. Irwin, J.; Irwin, B.; Rainer; Benjamin, R.A.; Dettmar, R.-J.; English, J.; Heald, G.; Henriksen, R.N.; Johnson, M.; Krause, M.; et al. Continuum Halos in Nearby Galaxies: An EVLA Survey (CHANG-ES). I. Introduction to the Survey. Astronom. J. 2012, 144, 43. [Google Scholar] [CrossRef]
  26. Wiegert, T.; Irwin, J.; Miskolczi, A.; Schmidt, P.; Carolina Mora, S.; Damas-Segovia, A.; Stein, Y.; English, J.; Rand, R.J.; Santistevan, I. CHANG-ES IV: Radio continuum emission of 35 edge-on galaxies observed with the Karl, G. Jansky very large array in D configuration—Data release 1. Astronom. J. 2015, 150, 81. [Google Scholar] [CrossRef]
  27. Groetsch, C.W. Inverse Problems: Activities for Undergraduates; Cambridge University Press: Cambridge, UK, 1999. [Google Scholar]
  28. Ambartsumian, V. On the derivation of the frequency function of space velocities of the stars from the observed radial velocities. Mon. Not. Roy. Astron. Soc. 1936, 96, 172. [Google Scholar] [CrossRef] [Green Version]
  29. Diaconis, P. Theories of Data Analysis: From Magical Thinking Through Classical Statistics; John Wiley & Sons: New York, NY, USA, 2011. [Google Scholar]
  30. Jardel, J.R.; Gebhardt, K.; Shen, J.; Fisher, D.B.; Kormendy, J.; Kinzler, J.; Lauer, T.R.; Richstone, D.; Gültekin, K. Orbit-based dynamical models of the Sombrero galaxy (NGC 4594). Astrophys. J. 2011, 739, 21. [Google Scholar] [CrossRef] [Green Version]
  31. Kam, Z.S.; Carignan, C.; Chemin, L.; Amram, P.; Epinat, B. Kinematics and mass modelling of M33, Hα observations. Mon. Not. R. Astron. Soc. 2015, 449, 4048–4070. [Google Scholar] [CrossRef] [Green Version]
  32. McGaugh, S. Predictions and Outcomes for the Dynamics of Rotating Galaxies. Galaxies 2020, 8, 35. [Google Scholar] [CrossRef]
  33. Lin, H.-N.; Li, M.-H.; Li, X.; Chang, Z. Galaxy rotation curves in the Grumiller’s modified gravity. Mon. Not. R. Astron. Soc. 2013, 430, 450–458. [Google Scholar] [CrossRef]
  34. Scelza, G.; Stabile, A. Numerical analysis of galactic rotation curves. Astrophys. Space Sci. 2015, 357, 44. [Google Scholar] [CrossRef] [Green Version]
  35. Bottema, R.; Pestaña, J.L.G. The distribution of dark and luminous matter inferred from extended rotation curves. Mon. Not. R. Astron. Soc. 2015, 448, 2566–2593. [Google Scholar] [CrossRef] [Green Version]
  36. Sofue, Y.; Rubin, V.C. Rotation curves of spiral galaxies. Ann. Rev. Astron. Astrophys. 2001, 39, 137–174. [Google Scholar] [CrossRef] [Green Version]
  37. Sil’chenko, O.K.; Moiseev, A.V. Nature of nuclear rings in unbarred galaxies: NGC 7742 AND NGC 7217. Astronom. J. 2006, 131, 1336–1346. [Google Scholar]
  38. Moulton, F.R. An Introduction to Celestial Mechanics; MacMillan: New York, NY, USA, 1914. [Google Scholar]
  39. Schmidt, M. A model of the distribution of mass in the galactic system. Bul. Astron. Inst. Neth. 1956, 13, 15. [Google Scholar]
  40. Todhunter, I. A History of the Mathematical Theories of Attraction and Figure of the Earth; MacMillan and Co.: London, UK, 1873. [Google Scholar]
  41. Criss, R.E. Analytics of planetary rotation: Improved physics with implications for the shape and super-rotation of Earth’s Core. Earth Sci. Rev. 2019, 192, 471–479. [Google Scholar] [CrossRef]
  42. NASA/IPAC. Extragalactic Database. Available online: https://ned.ipac.caltech.edu/ (accessed on 1 February 2020).
  43. Binney, J.; Tremaine, S. Galactic Dynamics, 2nd ed.; Princeton University Press: Princeton, NJ, USA, 2008. [Google Scholar]
  44. Criss, R.E.; Hofmeister, A.M. Galactic density and evolution based on the virial theorem, energy minimization, and conservation of angular momentum. Galaxies 2018, 6, 115. [Google Scholar] [CrossRef] [Green Version]
  45. Hofmeister, A.M.; Criss, R.E.; Criss, E.M. Verified solutions for the gravitational attraction to an oblate spheroid: Implications for planet mass and satellite orbits. Planet. Space Sci. 2018, 152, 68–81. [Google Scholar] [CrossRef]
  46. Toomre, A. On the distribution of matter within highly flattened galaxies. Astrophys. J. 1963, 138, 385–392. [Google Scholar] [CrossRef]
  47. Perek, L. Heterogeneous spheroids with Gaussian and exponential density laws. Bull. Astron. Inst. Czechoslov. 1958, 9, 208–212. [Google Scholar]
  48. Hofmeister, A.M.; Criss, R.E. Implications of geometry and the theorem of Gauss on Newtonian gravitational systems and a caveat regarding Poisson’s equation. Galaxies 2017, 5, 89. [Google Scholar] [CrossRef] [Green Version]
  49. Halliday, D.; Resnick, R. Physics; John Wiley and Sons: New York, NY, USA, 1966. [Google Scholar]
  50. Begeman, K.G. HI rotation curves of spiral galaxies. I. NGC 3198. Astron. Astrophys. 1989, 223, 47–60. [Google Scholar]
  51. Sofue, Y. Dark halos of M 31 and the Milky Way. Publ. Astron. Soc. Jpn. 2015, 67, 759. [Google Scholar] [CrossRef] [Green Version]
  52. Sofue, Y. Rotation curve of Milky Way. Galaxies 2020, 8, 37. [Google Scholar] [CrossRef]
  53. De Blok, W.J.G.; Walter, F.; Brinks, E.; Trachternach, C.; Oh, S.-H.; Kennicutt, R.C., Jr. High-resolution rotation curves and galaxy mass models from THINGS. Astrophys. J. 2008, 136, 2648–2719. [Google Scholar] [CrossRef]
  54. De Blok, W.J.G. Is there a universal alternative to dark matter? Nat. Astron. 2018, 2, 615–616. [Google Scholar] [CrossRef]
  55. Transtrum, M.K.; Machta, B.B.; Brown, K.S.; Daniels, B.C.; Myers, C.R.; Sethna, J.P. Perspective: Sloppiness and emergent theories in physics, biology, and beyond. J. Chem. Phys. 2015, 143, 010901. [Google Scholar] [CrossRef]
  56. Koribalski, B.S.; Wang, J.; Kamphuis, P.; Westmeier, T.; Staveley-Smith, L.; Oh, S.H.; Lopez-Sanchez, A.R.; Wong, O.I.; Ott, J.; de Blok, W.J.G.; et al. The Local Volume HI Survey (LVHIS). Mon. Not. R. Astron. Soc. 2018, 478, 1611–1648. [Google Scholar] [CrossRef] [Green Version]
  57. Carignan, C. Light and mass distribution of the magellanic-type spiral NGC 3109. Astrophys. J. 1985, 299, 59–73. [Google Scholar] [CrossRef]
  58. Chemin, L.; Carignan, C.; Foster, T. HI Kinematics and dynamics of Messier 31. Astrophys. J. 2009, 705, 1395–1415. [Google Scholar] [CrossRef]
  59. Gentile, G.; Salucci, P.; Klein, U.; Vergani, D.; Kalberla, P. Mapping the inner regions of the polar disk galaxy NGC 4650A with MUSE. Mon. Not. R. Astron. Soc. 2004, 351, 903. [Google Scholar] [CrossRef] [Green Version]
  60. Iodice, E.; Coccato, L.; Combes, F.; de Zeeuw, T.; Arnaboldi, M.; Weilbacher, P.M.; Bacon, R.; Kuntschner, H.; Spavone, M. Mapping the inner regions of the polar disk galaxy NGC 4650A with MUSE. Astron. Astrophys. 2015, 583, A48. [Google Scholar] [CrossRef] [Green Version]
  61. Wiegert, T.; English, J. Kinematic classification of non-interacting spiral galaxies. New Astron. 2014, 26, 40–61. [Google Scholar] [CrossRef] [Green Version]
  62. Kellogg, O.D. Foundations of Potential Theory; Dover Publications: New York, NY, USA, 1953. [Google Scholar]
  63. MacMillan, W.D. The Theory of the Potential; McGraw-Hill: New York, NY, USA, 1930. [Google Scholar]
  64. Feng, J.Q.; Gallo, C.F. Mass distribution in rotating thin-disk galaxies according to Newtonian dynamics. Galaxies 2014, 2, 199–222. [Google Scholar] [CrossRef]
  65. Evans, N.W.; Bowden, A. Extremely flat halos and the shape of the galaxy. Mon. Not. R. Astron. Soc. 2014, 43, 2–11. [Google Scholar] [CrossRef] [Green Version]
  66. Garland, G.D. The Earth’s Shape and Gravity; Pergamon Press: Oxford, UK, 1977. [Google Scholar]
  67. Pinsky, M.A. Introduction to Partial Differential Equations; McGraw-Hill: New York, NY, USA, 1984. [Google Scholar]
  68. Dehnen, W.; Binney, J. Mass models of the Milky Way. Mon. Not. R. Astron. Soc. 1998, 294, 429. [Google Scholar] [CrossRef] [Green Version]
  69. Ibata, R.; Lewis, G.F.; Martin, N.F.; Bellazzini, M.; Correnti, M. Does the Sagittarius stream constrain the Milky Way halo to be triaxial? Astrophys. J. Lett. 2013, 765, L155. [Google Scholar] [CrossRef] [Green Version]
  70. Sanders, R.H.; McGaugh, S.S. Modified Newtonian Dynamics as an Alternative to Dark Matter. Ann. Rev. Astron. Astrophys. 2002, 40, 263–317. [Google Scholar] [CrossRef] [Green Version]
  71. Disney, M.J. Modern Cosmology, Science or Folktale? Am. Sci. 2007, 95, 383–385. [Google Scholar] [CrossRef]
  72. Van Albada, G.D.; Sancisi, R. Dark matter in spiral galaxies. Philos. Trans. R. Soc. Lond. 1986, A320, 447–464. [Google Scholar]
  73. De Lorenzi, F.O.; Gerhard, L.; Coccato, M.; Arnaboldi, M.; Capaccioli, N.G.; Douglas, K.C.; Freeman, K.; Kuijken, M.R.; Merrifield, N.R.; Napolitano, E.; et al. Debattista, Dearth of dark matter or massive dark halo? Mass-shape-anisotropy degeneracies revealed by NMAGIC dynamical models of the elliptical galaxy NGC 3379. Mon. Not. R. Astron. Soc. 2009, 395, 76. [Google Scholar] [CrossRef] [Green Version]
  74. Boroson, T. The distribution of luminosity in spiral galaxies. Astrophys. J. Supp. 1981, 46, 177. [Google Scholar] [CrossRef]
  75. Van Van der Kruit, P.C. The radial distribution of surface brightness in galactic disks. Astron. Astrophys. 1987, 173, 59–80. [Google Scholar]
  76. Gallo, C.F.; Feng, J.Q. A thin-disk gravitational model for galactic rotation. In Proceedings of the 2nd Crisis Cosmology Conference, Washington, DC, USA, 7–11 September 2009; Volume 413, pp. 289–303. [Google Scholar]
  77. Emden, R. Gaskuglen—Anwendungen de Mechanischen Wärmetheorie; B.G. Teubner: Leipzig, Germany, 1907. [Google Scholar]
  78. Maron, S.H.; Prutton, C.F. Fundamental Principles of Physical Chemistry; Macmillan: New York, NY, USA, 1970. [Google Scholar]
  79. Romanowsky, A.J.; Douglas, N.G.; Arnaboldi, M.; Kuijken, K.; Merrifield, M.R.; Napolitano, N.R.; Capaccioli, M.; Freeman, K. A dearth of dark matter in ordinary elliptical galaxies. Science 2003, 301, 1696–1698. [Google Scholar] [CrossRef] [Green Version]
  80. Feng, J.Q.; Gallo, C.F. Deficient reasoning for dark matter in galaxies. Phys. Int. 2015, 6, 11–22. [Google Scholar] [CrossRef] [Green Version]
  81. Sofue, Y.; Tutui, Y.; Honma, M.; Tomita, A.; Takamiya, T.; Koda, J.; Takeda, Y. Central rotation curves of spiral galaxies. Astrophys. J. 1999, 523, 136–146. [Google Scholar] [CrossRef] [Green Version]
  82. Brandt, J.C. On the distribution of mass in galaxies. I. The large-scale structure of ordinary spirals with applications to M31. Astrophys. J. 1960, 131, 293–303. [Google Scholar] [CrossRef]
  83. Hofmeister, A.M.; Criss, R.E. Spatial and symmetry constraints as the basis of the Virial Theorem and astrophysical implications. Can. J. Phys. 2016, 94, 380–388. [Google Scholar] [CrossRef]
  84. Langley, S.P. The history of a doctrine. Am. J. Sci. 1889, 37, 1–23. [Google Scholar] [CrossRef]
  85. Nicolis, G.; Prigogine, I. Self-Organization in Nonequilibrium Systems: From Dissipative Structures to Order through Fluctuations; J. Wiley and Sons: New York, NY, USA, 1977. [Google Scholar]
  86. Samuelsen, P.A.; Planck, M.; Kuhn, T.S.; Poincare, H. Science Makes Progress Funeral by Funeral. Available online: https://quoteinvestigator.com/2017/09/25/progress/ (accessed on 24 April 2020).
Figure 1. Distributions of baryonic matter in edge-on spiral galaxies: (a) Visible image of ultrathin UCC3697 (whitish). The blue overlay images the surrounding neutral H atom gas, detected using the L-band, which includes emissions at 21 cm. Thin red arrow indicates the z-axis. Yellow X indicates a secondary spin axis, pointing into the page with the sense shown by the curved yellow arrows. This secondary spin explains the form of the warp (see Section 2.2 ). Publicly available from NRAO/AUI/NSF [23]; (b) Radio contours of NGC5907 in the C- and L-bands, with an optical image, are publicly available at https://www.queensu.ca/changes/. The L-band range. The CHANG-ES project [24] is described in Irwin et al. 2012, AJ, 144, 43 [25] and details about this first data release are provided by Wiegert et al. 2015, AJ, 150, 81 [26].
Galaxies 08 00047 g001
Figure 2. Geometry of spiral galaxies, as approximated in oblate spheroid and disk models: (a) Visual image of nearly face-on NGC 7742, type SA(r), by the Hubble Heritage Team (AURA/STScI/NASA), and publicly available from http://hubblesite.org/newscenter/archive/releases/1998/28/image/a/). This particular ring galaxy is counter-rotating [37]; (b) Schematic of graded density in the equatorial plane; (c) Geometry of a spinning, oblate spheroid; (d) Side view of homeoids of constant density and shape which nest to form the oblate; (e) Geometry and gravitational forces (white arrows) for a disk of finite thickness and radius. Although the horizontal gravitational forces would be balanced by the centrifugal pseudo-force (solid arrow), the force along z is unopposed at any finite distance above the equatorial plane; (f) The basis of ring models: perspective view of concentric cylinders of various density (gray) rotating about the z-axis. Density and velocity gradients are co-linear; (g) Perspective view of stacked disks rotating about the z-axis, which describes density varying vertically; (h) Side view of the assembly of a thick disk with graded density. Nested hollow pillboxes are the required shape for isodensity contours in thick disk geometry.
Galaxies 08 00047 g002
Figure 3. Pictorial essay of an RC extraction by deBlok et al. [53] for a tilted, intermediate sized spiral galaxy from high-resolution study of the 21 cm band using the Very Long Array: (a) Detailed, visual image of NGC 2403, type SAB(s)cd, by Göran Nilsson and The Liverpool Telescope group, which is publicly available at https://commons.wikimedia.org/w/index.php?curid=63317782. Red lines link this image with the Doppler measurements; (b) Image at 3.6 μm from IRAC Spitzer, showing the multiple spiral arms, which is on the same scale as the Doppler measurements; (c) Velocity field derived from fitting Hermite polynomials to the natural-weighted data cube, where the thick line indicates the systemic velocity and the difference between contours is listed; (d) The thin disk model of the Doppler measurements with the same grayscales and contours as the data; (e) Extracted RC (black curve) along the major axis with the inclinations stated on a velocity-position diagram (gray). Excellent agreement is obtained between the approaching and receding limbs. Panels (b) to (e) are modified after de Blok et al. (2008) High-resolution rotation curves and galaxy mass models from THINGS. Astrophys. J. 136, 2648–2719 [53] with permissions by the AAS; (f) Color version of the Doppler measurements with superimposed rotation curves. The vertical dashed line is approximately at 13 kpc. Reproduced with permissions from Springer Nature: Nature Astronomy 2, 615-616, Is there a universal alternative to dark matter? De Blok, W.J.G., https://doi.org/10.1038/s41550-018-0547-4, copyright August 1, 2018 [54].
Galaxies 08 00047 g003
Figure 4. Pictorial essay of an RC extraction for a giant spiral galaxy with an unusually large baryonic atmosphere and a twisted velocity field: (a) Detailed, visual image of M83, which is type SAB(s)c with a double nucleus, by William Blair, NASA, ESA, and the Hubble Heritage Team (STScI/AURA), publicly available at http://www.spacetelescope.org/images/heic1403a/. Red lines link this image with the area mapped in Doppler measurements. Yellow arrow marks one possible 2nd axis of spin, from symmetry of the arms; (b) Integrated HI distribution overlaid onto the B-band image of M83; (c) The mean velocity field, plotted on the same scale; (d) Position-velocity diagram along the major axis with the inclinations stated; (e) The minor axis. Panels (b) to (e) are a high-resolution study of the 21 cm band which used the Australia Telescope Compact Array and are modified after supplement figure A50 in “The Local Volume HI Survey (LVHIS)” by B.S. Koribalski et al. (2018) Mon. Not. R. Astron. Soc. 478, 1611–1648 [56].
Galaxies 08 00047 g004
Figure 5. Velocity distributions in a spiral galaxy: (a) Measured profile, modified after C. Carignan, (1985) Light and mass distribution of the magellanic-type spiral NGC 3109, Astrophys. J. 299, 59–73 [57], with permissions by the AAS. In this panel only, velocity increases to the right. Blue line shows the expected equatorial velocity for a disk. Red and green lines = the expected equatorial velocity for an oblate; (b) Schematic constructing the expected profile (upper section) for a thin disk consisting of rotating rings, where the lower section shows a vertical slice through the galaxy indicating the systematic changes in density and velocity with equatorial radius and a line of sight (LOS). Light lines show the flux-velocity correlations inside the disk, where the colored curve estimates attenuation of the emitted flux along the LOS. For a ring-disk geometry, the equatorial velocity would be midway between the minimum and maximum velocities; (c) Schematic constructing the expected profile (upper section) for an oblate shape consisting of rotating homeoids (lower section). The top and bottom velocity-flux correlations are identical, but are offset for clarity. These will sum, but emissions from the bottom are attenuated more. The red curve approximates the attenuated sum. The equatorial velocity would be the maximum observed, if resolution is very high, but more likely a small tail will exist, representing beam smearing.
Galaxies 08 00047 g005
Figure 6. Indication of multiple spin axes: (a) Schematics of a single rotation of a tilted spiral (top) and a simple secondary rotation for a face-on spiral; (b) Wire diagrams of the oblate spheroid and Jacobi’s triaxial ellipsoid, with spinning about the short axes added to images created by Ag2gaeh and publicly available at https://en.wikipedia.org/wiki/Ellipsoid#/media/File:Ellipsoide.svg under a Creative Commons Attribution Share Alike 4.0 International license; (c) The mean velocity field of Circinus, showing superimposed spins around two axis (black arrows), which are nearly parallel as presented to the LOS, modified after figure 13b in “The Local Volume HI Survey (LVHIS)” by B.S. Koribalski et al. (2018) Mon. Not. R. Astron. Soc. 478, 1611–1648 [56].
Galaxies 08 00047 g006
Figure 7. Evaluation of RC for possible multiple spin axes: (a) Schematic of how systematic errors will affect rotation curves. Blue = typical measured RC with a flat trend. Red arrows = corrections for asymmetric peaks in flux-velocity profiles. Green arrows = corrections for a 2nd spin axis. Both effects make the slopes of rotation curves decrease more strongly at high radius, as shown in the orange and green RC; (b) Simplified representation of commonly observed rotation curve types, after the classification scheme used by Wiegert and English [61] and others. Gray rectangle = the galactic region used to determine the dV/dr; (c) Histogram of the list of non-interacting galaxies in Table 3 of [61]. Types with a ring are indicated by (r) and an ellipse. The box shows the morphological types. The double arrow indicates that dV/dr being negative correlates with axial symmetry, but anti-correlates with symmetry lowering elements such as bars.
Galaxies 08 00047 g007
Figure 8. Forward models of rotation curves for a test particle orbits, comparing a large, central point mass (dot-dashed curve) to orbits both in and around oblate bodies with homogeneous density but varying ellipticity (various black curves). Gray curve = a sphere, for which e = 0: this same pattern was obtained for Coulombic forces in and around a sphere with uniformly distributed charge (e.g., figure 28–9 in [49]). The dashed curve represents an axial ratio of c/a = 0.2, whereas the dotted curve depicts c/a = 0.1. For variable density, the maximum would be rounded rather than a corner, and thus would resemble the idealized RC curves in Figure 7b. Please note that this approach assumes orbiting points or rings, not co-rotating spheroidal shells.
Galaxies 08 00047 g008
Figure 9. Lines of force (red) superimposed on ellipsoidal contours of constant potential (purple or blue): (a) Sphere (black circle) with c/a = 1, where the lines of force are perfectly radial and the orthogonal equipotential surfaces are spherical; (b) Oblate body (black ellipse) with c/a = 0.1, as in spiral galaxies, where the lines of force are not radial and are only perpendicular to the body for the special axial directions. White arrow = spin axis. Equipotential contours are ellipses which become rounder with distance. Contours near the oblate are too finely spaced to be shown.
Galaxies 08 00047 g009
Figure 10. Energetics of ultrathin disks: (a) Numerical calculation of work (dots) done by a test particle (the ant) as it crawls across a disk surface with constant density. Nearly 106 point masses were used in our integration. Light gray curve and inset shows a two-parameter fit. Dotted curve shows a rough power law. Dark gray curve shows a numerical calculation for the work done at r > a by an external test particle (ant in spacesuit); (b) Numerical calculations of velocity inside and outside an ultrathin disk for homogeneous density (solid) and for an exponentially decaying density but with the same mass (dots), showing a discontinuity at r = a. Keplerian orbits (dot-dashes) match these curves at several body radii, as expected. Weakening the exponential decline (moving mass outwards) would provide an RC less steep at the center, but steeper on the outside, moving the peak at r = a closer to the RC for constant density. Strengthening the exponential (concentrating mass inwards) would provide an RC that is steeper at the center and flatter in the middle, such that the peak at r = a is weaker, while remaining higher than the Keplerian orbit al constraint for r > a.
Galaxies 08 00047 g010
Figure 11. Lines of force in cylindrical geometry, showing how these depend on the aspect ratio of the central body (dark gray). The light gray cylinders are imaginary shapes constructed to evaluate the divergence of the lines of force, per Gauss’ method: (a) Line source, where force lines need only be computed in the radial direction; (b) Stubby body, showing edge effects and bending force lines, which are only perfectly straight along the z and r axes; (c) Thin disk. Away from the edges, flux is essentially vertical, and analytic (Equation (11)), with no discontinuities.
Galaxies 08 00047 g011
Figure 12. Simulated RC for oblate bodies with varying internal density, calculated for c/a = 0.1 = (1-e2)½ and Min = 1011Msun at 18 kpc. An edge is not assumed: (a) Power law; (b) Formulae resembling that of Binney and Tremaine [43], which these authors used to cancel terms and make the integral tractable. The case of n = −3/2 has the same shape as the result provided by Figure 2.13 in Ref. [43]), which to our knowledge is the only analytical solution heretofore available for an oblate spheroid.
Galaxies 08 00047 g012
Figure 13. Polytropic model for galaxies: (a) Density for polytropes (black patterns, with indices labeled, which are normalized to the central density as a function of scaled radius normalized to unity at the center and zero at the surface (r = a). Index n = 0 for constant density is not shown. Gray shows linear and exponential densities for comparison. Reproduction of Figure 4b from Hofmeister and Criss [14], which is open access under a Creative Commons Attribution 4.0 International License: (b) Rotation curves for differentially rotating homeoids inside an oblate with the same ellipticity. During the normalization factors involve the ellipticity cancel.
Galaxies 08 00047 g013
Figure 14. Inverse analysis of NGC 4736 of Feng and Gallo [64], based on measured RC of De Blok et al. [53], shown as a black dotted line: (a) Results for σ from numerical evaluation of (24) by [64]. Dashed line = least squares fit below 1 kpc, which equals 1/r within the uncertainty of the selected cutoff; (b) Mass obtained form (25), which integration smooths σ. Black dashed line = a third order polynomial obtained from a least squares fit. Heavy lines in the lower right corner show mass computed for a thin, constant density disk from (13), using two approximations for RC. Average v = 159 km s−1. Thin dash-dotted line shows the extrapolation used. Equation (13) has a singularity in v at r = a, but merges with the point mass approximation at very large r.
Galaxies 08 00047 g014
Figure 15. Inverse analysis of NGC 1808 by Sipols and Pavlovich [11], based on measured RC of Sofue et al. [81], shown as a heavy dotted line: (a) Results for σ from matrix inversion of (29) by [11]. Dashed line = least squares fit below 0.8 kpc. Thin line = fit from 2 to 12 kpc; (b) Mass obtained form (26), which integration smooths σ. Black dashed line = the least squares fit listed in the box. For comparison, mass was computed for a thin, constant density disk from (13) using extrapolated velocity (thin dash-dotted line). Equation (13) has a singularity in v at r = a, while merging with the point mass approximation at large r.
Galaxies 08 00047 g015
Figure 16. Inverse analysis within the visible disk of counter-rotating spirals. Arrows point to the relevant y-scale: (a) NCG 4736, using RC data from deBlok et al. [53], shown in Figure 14; (b) NGC 1808, using RC data of Sofue et al. [81], shown in Figure 15.
Galaxies 08 00047 g016
Table 1. Comparison of forward and inverse approaches to RC analysis. 1.
TypeInput and ShapePhysical ModelOutputExamples
ForwardSurface density; 4 shapes 2Orbits under central forces 3Simulated RC with NBDMe.g., [30,31]
ForwardSurface density; disk 2Orbits under central forces 3Simulated RC[12,13]
ForwardSurface density; disk 2MOND 4Simulated RC[5,6,32]
ForwardSurface density; disk 2General relativity 4Simulated RC[7,33,34]
InverseRC; diskElliptical integrals 5Surface density vs. radius[8,9]
InverseRC; equatorial planePoint mass attractions 6Surface density vs. radius[10,11]
InverseRC; spheroid Virial theorem for spin 7Volume density vs. radius [14,15]
1 “Disk” refers to a coin shape with a finite height. “Shapes” refers to combining point, spherical, and disk shapes, where different densities or masses describe the shapes considered. Surface density (σ) is related to luminosity. Volumetric density (ρ) is the thermodynamic quantity. 2 Assumed and iterated until a fit is obtained. 3 Central forces are characterized not only by a 1/r2 dependence but also by all vectors being directed to the center. 4 MOdified Newtonian Dynamics and general relativity calculations both include an acceleration parameter in a non-central force law, which can be varied for optimal fitting (see e.g., [7,35]). 5 Numerical model that examines synthetic and measured RC. 6 Newton’s law is used to describe attractions between pairs of points in the equatorial plane, which are then summed or integrated. 7 This formulation is constrained by the gravitational potential and moments of inertia of homeoidal shells inside spinning, self-gravitating oblate spheroids.
Table 2. Forward Models Applied to Rotation Curves.
ModelComponent Geometry 1Force ConstantsNumber of Parameters 4LimitationsReferences or Figures
NOMsDisk + NBDM halo + bulge + black hole 2, 3G≥8Densities often summed 2[29,30,35,36,51,54,55,56,57,58,59,60,69] 6
Log-NormalDiskG≥2No mass at center[12,13]
MONDDisk 3G + a≥3Ad hoc force law 5[5,6,32,70]
RelativityDisk 3G + a≥3Flexible force law 5[7,33,34]
NumericalUltrathin diskG≥2Disks are unstableFigure 10
SpheroidHomeoidG≥2Complex mathematicsFigure 8, Figure 12 and Figure 13
Point masspointG1Unrealistic for galaxiesFigure 10
1 Densities or masses are assumed for each component, each of which has a shape that requires one descriptive parameter, i.e., e = 0 for the sphere, finite e for the spheroid, H/a for the coin-shaped disk, or H = 0 for the equatorial plane. 2 Summations of elements are restricted (e.g., all components must act effectively as point mass) for this approach to be mathematically correct. 3 Some models assume that the disk has two components, gas, and stars, with different mass distributions, which requires more parameters. 4 The minimum number is needed to describe each shape for the case of a constant density. 5 Recent studies involve complicated mathematics: nonetheless, equivalence between r and s is assumed. 6 Many additional studies use the NOMs approach. Examples of component behavior are shown in the figures listed.
Table 3. Newtonian Inverse Models Applied to Rotation Curves.
ModelGeometryParameters 1MethodologyReferences
Ring integrationFinite thickness diskThicknessNumerical[8,9,64,76,80]
Mass summationEquatorial plane-Matrix inversion[10,11]
SpinOblate spheroidEllipticityAnalytical[14,15,44,48]
1 In addition to the input, v(r).