Simulations of the Polarized Sky for the SKA: How to Constrain Intracluster Magnetic Fields

 , , , , , ,
  and
and 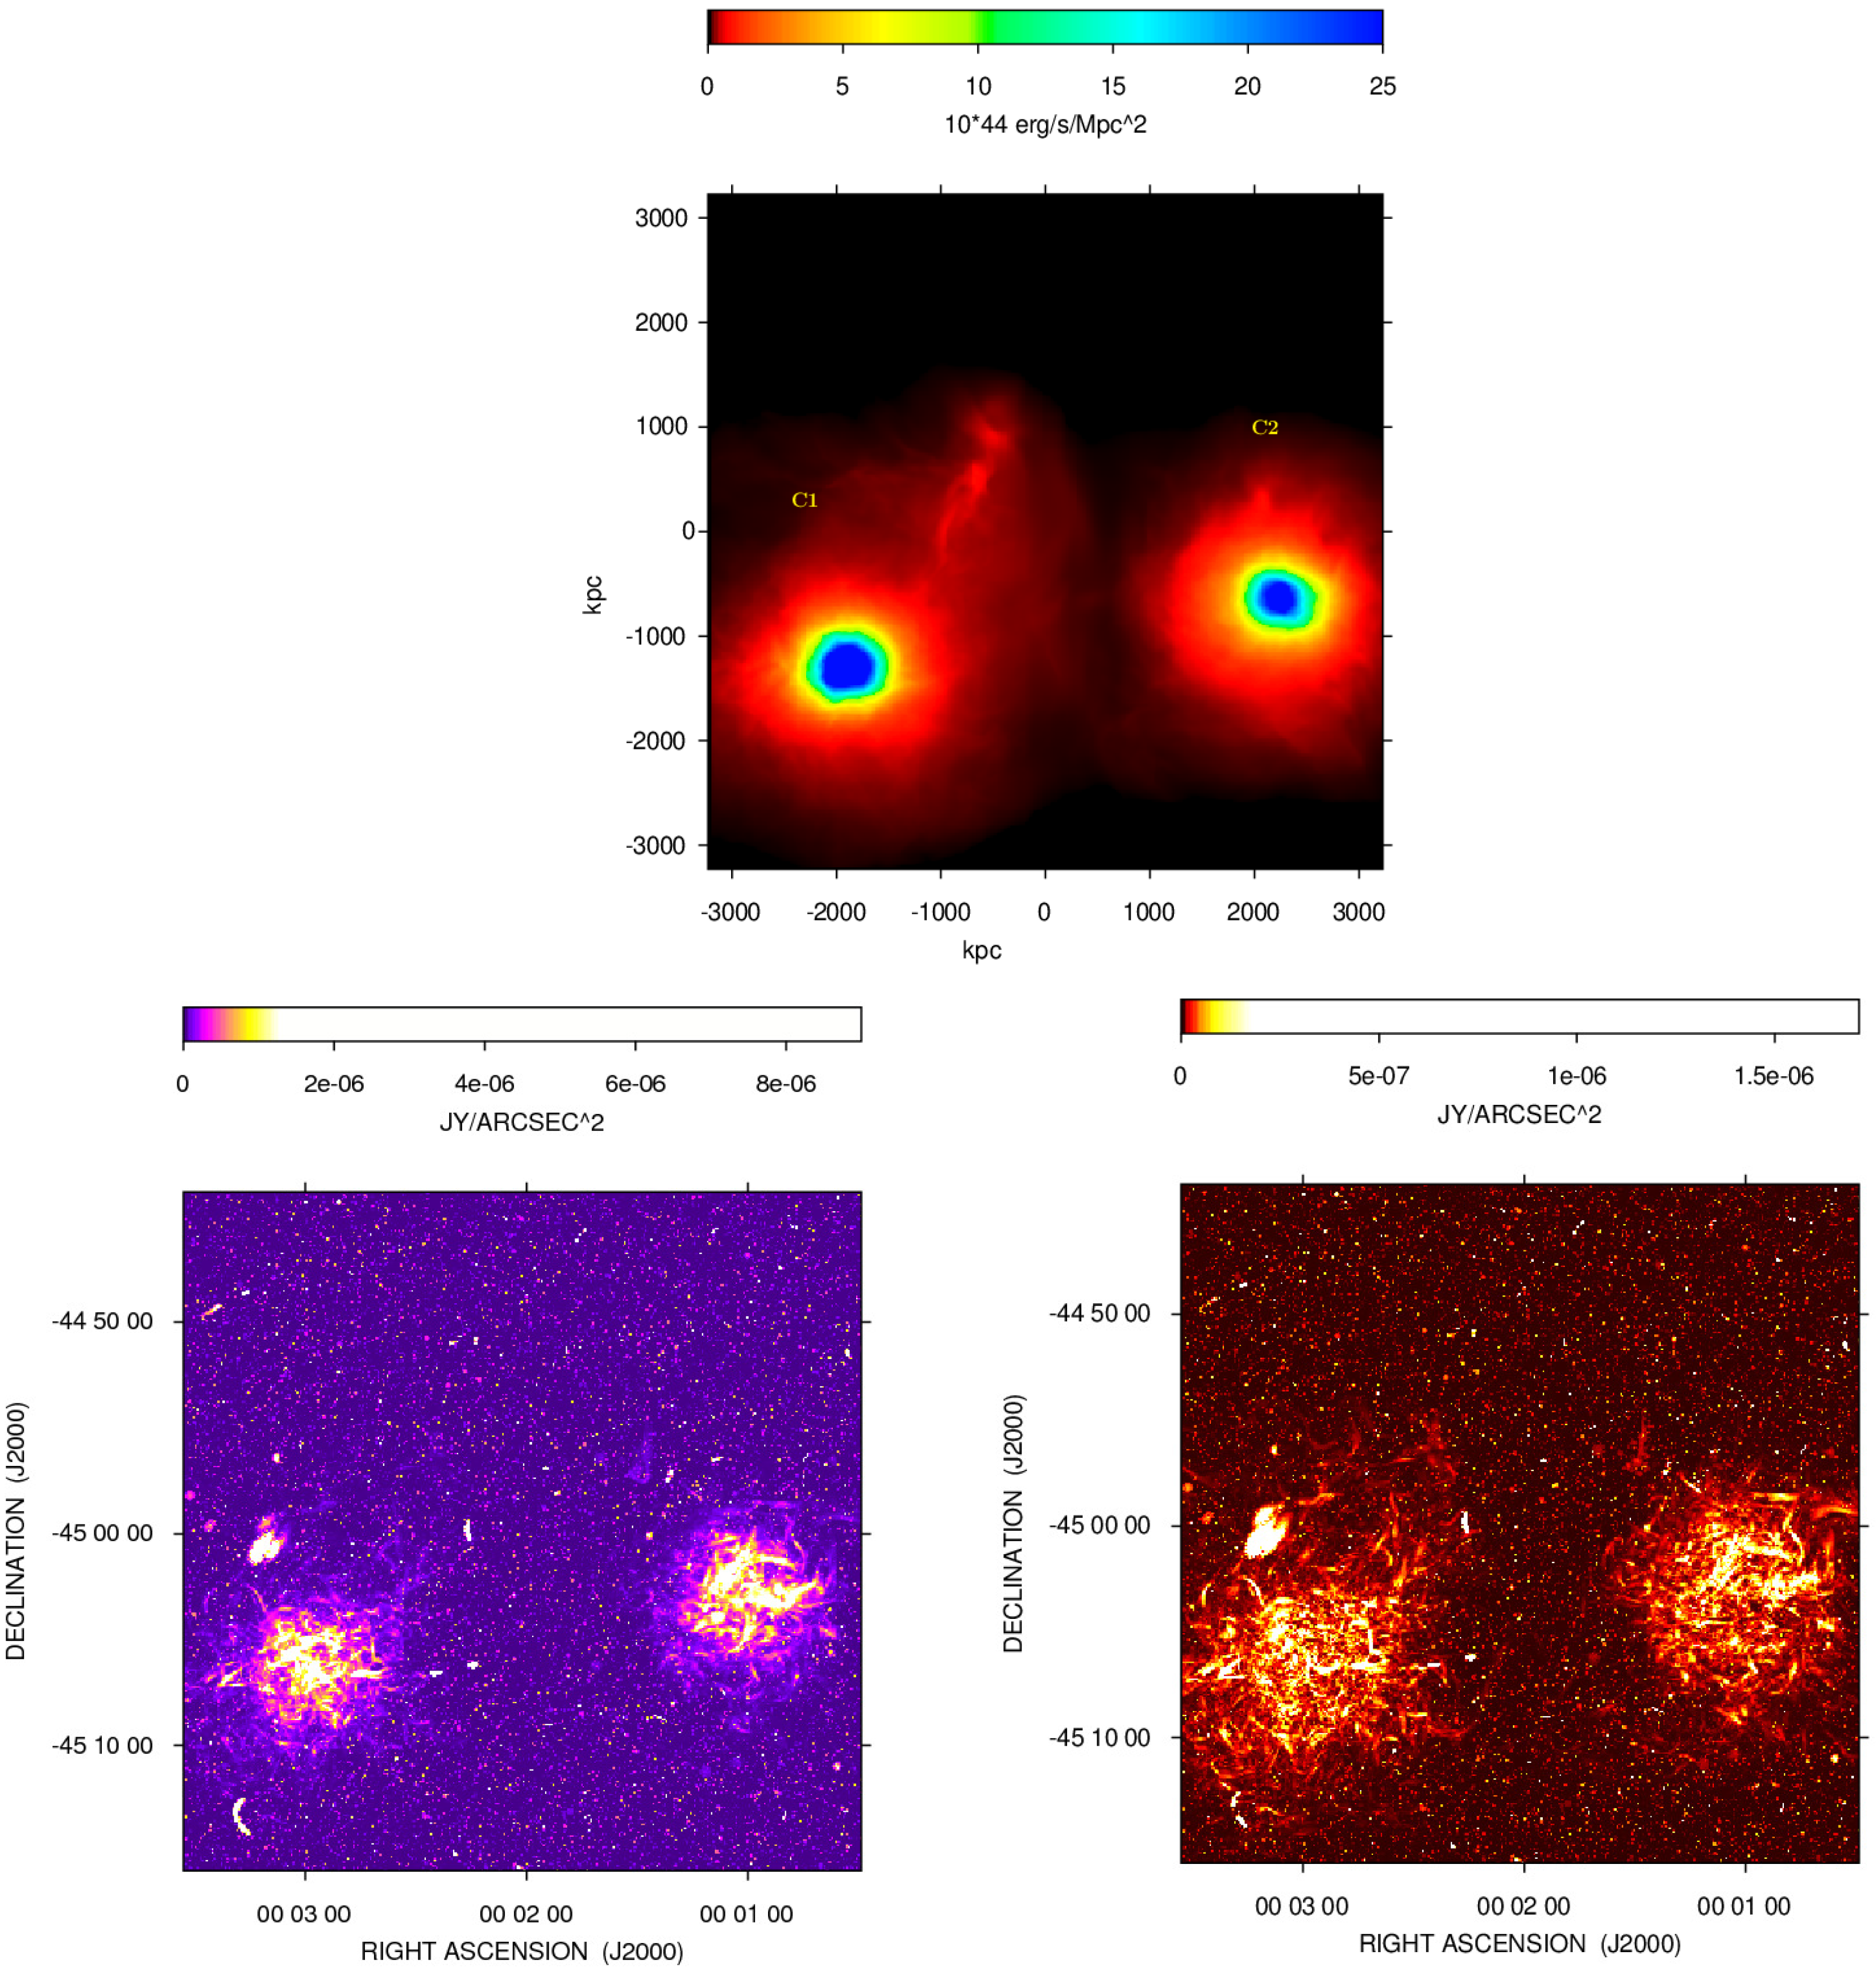
Abstract
1. Introduction
2. Method
- we specified the computational volume of the galaxy clusters;
- we used the Navarro–Frank–White (NFW) profile of Reference [11] to describe the distribution of the cluster sources with respect to the center of the cluster;
- the NFW profile was normalized with respect to the cluster radio luminosity function (RLF) of Reference [11];
- we calculated the total number of cluster sources by integrating the NFW profile over the cubical box;
- we assigned the type to each radio source depending on the fraction fixed by the AGN and SFG RLFs;
- we extracted the source luminosity, size, and position with a Monte Carlo approach from the cumulative distribution functions of, respectively, the RLF, the size model (the same adopted in Reference [12]), and the NFW profile;
- according to the source luminosity and type, we attributed a morphological and spectro-polarimetric model to the source;
- the redshift of this sources corresponded to the selected cluster redshift;
- we integrated the cosmological AGN and SFG RLFs along the simulated portion of the universe to compute the number of background and foreground radio sources of each specific type;
- we assigned the redshift from the cumulative distribution function of the redshift-evolved RLFs;
- for the luminosity, morphology, and spectro-polarimetry properties, we proceeded in the same way as for the cluster-embedded sources.
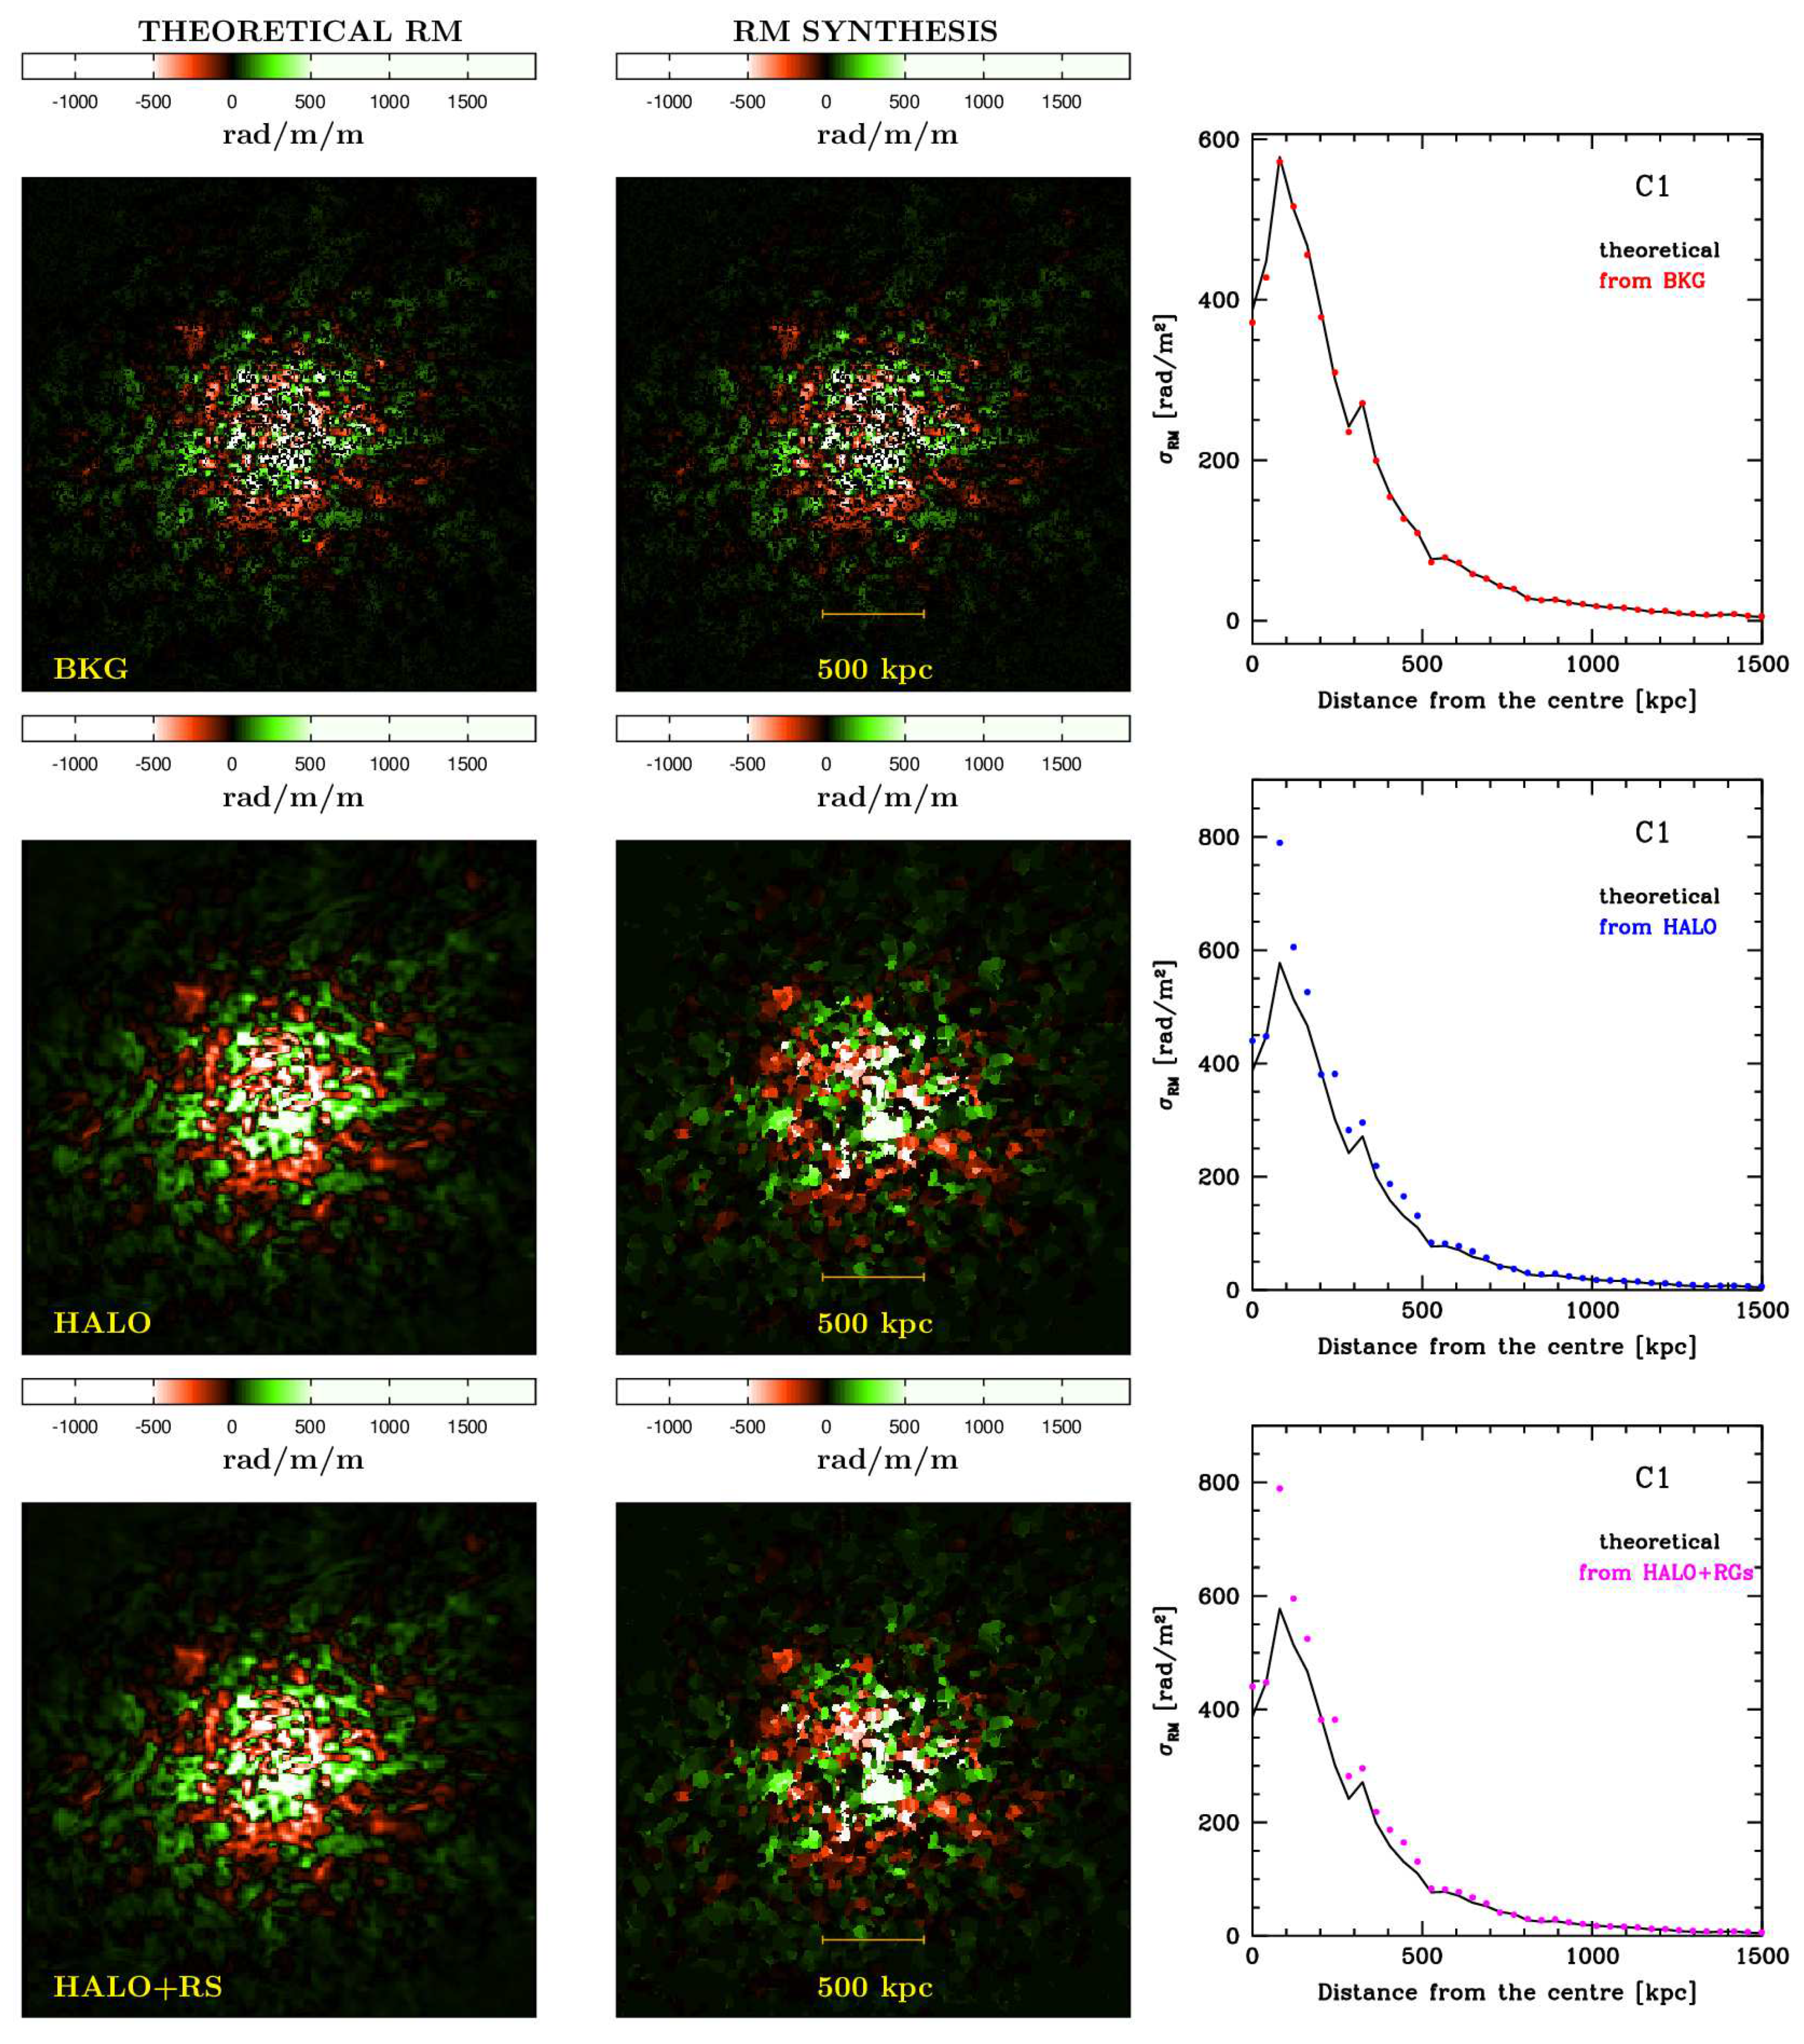
3. Simulated Images
4. Results
- background radio sources;
- cluster radio halos;
- all sources: background, cluster, and foreground discrete sources, plus the cluster radio halos.
5. Discussion and Conclusions
Author Contributions
Funding
Acknowledgments
Conflicts of Interest
References
- Dolag, K.; Bykov, A.M.; Diaferio, A. Non-Thermal Processes in Cosmological Simulations. Space Sci. Rev. 2008, 134, 311–335. [Google Scholar] [CrossRef]
- Carilli, C.L.; Taylor, G.B. Cluster Magnetic fields. Annu. Rev. Astron. Astrophys. 2002, 40, 319–348. [Google Scholar] [CrossRef]
- Govoni, F.; Feretti, L. Magnetic fields in Clusters of Galaxies. Int. J. Mod. Phys. D 2004, 13, 1549–1594. [Google Scholar] [CrossRef]
- Ruzmaikin, A.A.; Sokoloff, D.D. The calculation of Faraday rotation measures of cosmic radio sources. Astron. Astrophys. 1979, 78, 1–6. [Google Scholar]
- Feretti, L.; Giovannini, G.; Govoni, F.; Murgia, M. Clusters of galaxies: Observational properties of the diffuse radio emission. Astron. Astrophys. Rev. 2012, 20, 54. [Google Scholar] [CrossRef]
- Brentjens, M.A.; de Bruyn, A.G. Faraday rotation measure synthesis. Astron. Astrophys. 2005, 441, 1217–1228. [Google Scholar] [CrossRef]
- Burn, B.J. On the depolarization of discrete radio sources by Faraday dispersion. Mon. Not. R. Astron. Soc. 1966, 133, 67–83. [Google Scholar] [CrossRef]
- Ideguchi, S.; Tashiro, Y.; Akahori, T.; Takahashi, K.; Ryu, D. Study of the Vertical Magnetic Field in Face-on Galaxies Using Faraday Tomography. Astrophys. J. 2017, 843, 146. [Google Scholar] [CrossRef]
- Govoni, F.; Murgia, M.; Xu, H.; Li, H.; Norman, M.L.; Feretti, L.; Giovannini, G.; Vacca, V. Polarization of cluster radio halos with upcoming radio interferometers. Astron. Astrophys. 2013, 554, A102. [Google Scholar] [CrossRef]
- Murgia, M.; Govoni, F.; Feretti, L.; Giovannini, G.; Dallacasa, D.; Fanti, R.; Taylor, G.B.; Dolag, K. Magnetic fields and Faraday rotation in clusters of galaxies. Astron. Astrophys. 2004, 424, 429–446. [Google Scholar] [CrossRef]
- Lin, Y.T.; Mohr, J.J. Radio Sources in Galaxy Clusters: Radial Distribution, and 1.4 GHz and K-band Bivariate Luminosity Function. Astrophys. J. Suppl. Ser. 2007, 170, 71. [Google Scholar] [CrossRef]
- Wilman, R.J.; Miller, L.; Jarvis, M.J.; Mauch, T.; Levrier, F.; Abdalla, F.B.; Rawlings, S.; Klöckner, H.R.; Obreschkow, D.; Olteanu, D.; et al. A semi-empirical simulation of the extragalactic radio continuum sky for next generation radio telescopes. Mon. Not. R. Astron. Soc. 2008, 388, 1335–1348. [Google Scholar] [CrossRef]
- Condon, J.J. Cosmological evolution of radio sources found at 1.4 GHz. Astrophys. J. 1984, 284, 44–53. [Google Scholar] [CrossRef]
- Condon, J.J. The 1.4 gigahertz luminosity function and its evolution. Astrophys. J. 1989, 338, 13–23. [Google Scholar] [CrossRef]
- Bonafede, A.; Feretti, L.; Giovannini, G.; Govoni, F.; Murgia, M.; Taylor, G.B.; Ebeling, H.; Allen, S.; Gentile, G.; Pihlström, Y. Revealing the magnetic field in a distant galaxy cluster: Discovery of the complex radio emission from MACS J0717.5+3745. Astron. Astrophys. 2009, 503, 707–720. [Google Scholar] [CrossRef]
- Girardi, M.; Boschin, W.; Gastaldello, F.; Giovannini, G.; Govoni, F.; Murgia, M.; Barrena, R.; Ettori, S.; Trasatti, M.; Vacca, V. A multiwavelength view of the galaxy cluster Abell 523 and its peculiar diffuse radio source. Mon. Not. R. Astron. Soc. 2016, 456, 2829–2847. [Google Scholar] [CrossRef]
- Govoni, F.; Murgia, M.; Feretti, L.; Giovannini, G.; Dallacasa, D.; Taylor, G.B. A2255: The first detection of filamentary polarized emission in a radio halo. Astron. Astrophys. 2005, 430, L5–L8. [Google Scholar] [CrossRef]
| 1. |


© 2018 by the authors. Licensee MDPI, Basel, Switzerland. This article is an open access article distributed under the terms and conditions of the Creative Commons Attribution (CC BY) license (http://creativecommons.org/licenses/by/4.0/).
Share and Cite
Loi, F.; Murgia, M.; Govoni, F.; Vacca, V.; Prandoni, I.; Li, H.; Feretti, L.; Giovannini, G. Simulations of the Polarized Sky for the SKA: How to Constrain Intracluster Magnetic Fields. Galaxies 2018, 6, 133. https://doi.org/10.3390/galaxies6040133
Loi F, Murgia M, Govoni F, Vacca V, Prandoni I, Li H, Feretti L, Giovannini G. Simulations of the Polarized Sky for the SKA: How to Constrain Intracluster Magnetic Fields. Galaxies. 2018; 6(4):133. https://doi.org/10.3390/galaxies6040133
Chicago/Turabian StyleLoi, Francesca, Matteo Murgia, Federica Govoni, Valentina Vacca, Isabella Prandoni, Hui Li, Luigina Feretti, and Gabriele Giovannini. 2018. "Simulations of the Polarized Sky for the SKA: How to Constrain Intracluster Magnetic Fields" Galaxies 6, no. 4: 133. https://doi.org/10.3390/galaxies6040133
APA StyleLoi, F., Murgia, M., Govoni, F., Vacca, V., Prandoni, I., Li, H., Feretti, L., & Giovannini, G. (2018). Simulations of the Polarized Sky for the SKA: How to Constrain Intracluster Magnetic Fields. Galaxies, 6(4), 133. https://doi.org/10.3390/galaxies6040133