Letter

One Piece at a Time—Adding to the Puzzle of S0 Formation

by
Carlos Escudero
1,2,*,†,
Favio Faifer
1,2,† and
Lilia Bassino
1,2,†
1
Facultad de Ciencias Astronómicas y Geofísicas, Universidad Nacional de La Plata, Paseo del Bosque s/n, La Plata B1900FWA, Argentina
2
Instituto de Astrofísica de La Plata (IALP; CCT La Plata, CONICET-UNLP), Paseo del Bosque s/n, La Plata B1900FWA, Argentina
*
Author to whom correspondence should be addressed.
These authors contributed equally to this work.
Galaxies 2017, 5(3), 37; https://doi.org/10.3390/galaxies5030037
Submission received: 29 June 2017 / Revised: 1 August 2017 / Accepted: 3 August 2017 / Published: 7 August 2017
(This article belongs to the Special Issue On the Origin (and Evolution) of Baryonic Galaxy Halos)

Abstract

:
Understanding the origin of galaxies remains a topic of debate in the current astronomy. In this work, we have focused on lenticular (S0) galaxies located in low-density environments, using their associated globular cluster (GC) systems as a tool. Initially, we have started the study of three S0 galaxies—NGC 2549, NGC 3414 and NGC 5838—using photometric data in several filters obtained with the GMOS camera mounted on the Gemini North telescope. The different GC systems, as well as their host galaxies, have shown particular features, such as multiple GC subpopulations and low-brightness substructures. These pieces of evidence show that the mentioned galaxies have suffered several merger/interaction events, even the accretion of satellite companions, probably causing their current morphologies.

1. Introduction

One of the biggest challenges that persists in astronomy today is understanding how the galaxies we observe were formed. In this context, a fundamental aspect lies in identifying those influential factors in the formation and evolution of galaxies of a given morphological type. In this regard, the importance of globular clusters (GCs) has been recognized as tracers of the first formation stages of the galaxies, and also as a useful tool for obtaining information about different epochs, regions, and physical processes that would otherwise be inaccessible [1].
To a greater or lesser extent, GC systems reveal a bimodal colour distribution, indicating the presence of at least two subpopulations of GCs, usually referred to as “blue” and “red”. This colour bimodality has usually been interpreted as a metallicity bimodality, suggesting that the galaxy has experienced two periods of intense star formation. However, the presence of trimodal colour distributions has been observed in some massive galaxies [2,3,4], which would indicate that new GCs have been formed through merger events, and/or have been stripped off of smaller galaxies.
As each history has a beginning, the beginning of the work presented here focused on the analysis of the GC systems associated with lenticular galaxies (S0) located in relatively low-density environments, such as groups and/or the field (Escudero et al., in preparation). To this end, we have used excellent photometric data obtained with Gemini/GMOS through the filters g r i . This data set in itself constitutes an important contribution to the study of this type of galaxy, since it will serve as the starting point for future spectroscopic work, and will allow the different processes that govern the galaxies and their GC systems to be delineated.

2. Sample of Galaxies

In this work, we have focused on three S0 galaxies: NGC 2549, NGC 3414 and NGC 5838, essentially classified as S0, and are located in poor (NGC 2549) as well as rich groups (NGC 3414 and NGC 5838). Table 1 shows some properties thereof.
Following is a brief description of the galaxies presented here, with relevant information obtained from previous studies in the literature.
NGC 2549: This edge-on S0 galaxy is the central galaxy of a low-density group or “poor group”. It presents an X-shape distribution of light in the bulge [5], and evidences a ring-like structure towards larger radii [6,7]. The spectroscopic study by Sil’chenko et al. [8] shows that this galaxy presents a young bulge with an age 2 Gyr, whereas the disk reveals an increase of the age from 6.4 to 12 Gyr.
NGC 3414: Defined as a peculiar S0, it is the central galaxy of the LGG 227 group [9]. The appearance of this galaxy has given diverse interpretations about its nature. Whitmore et al. [10] suggested that it was an edge-on galaxy with a large polar ring, whereas Chitre and Jog [11] considered it as face-on galaxy with a prominent bar. Age estimates of the bulge and disk are in 12 Gyr [8].
NGC 5838: This SA0 galaxy is located in the group of galaxies NGC 5846. However, NGC 5838 is the dominant galaxy of a smaller subgroup. It presents kinematically decoupled nuclear regions, with two rings or dust disks and young stars [12]. Its bulge contains old stellar populations with a slight colour gradient [13]. On the other hand, Michard and Marchal [14] suggest that the outer disk could show weak signs of a spiral pattern. McDermid et al. [15] estimated ages within the effective radius, obtaining 11.27 Gyr.

3. Results

We present the analysis developed on each galaxy and the preliminary results obtained. Initially, we obtained the surface brightness profile of the galaxies using the IRAF task ellipse. In order to avoid the light contribution from nearby bright or extended objects, before executing ellipse we masked them in the image. In each case we modelled the galaxy light allowing the centre, ellipticity and position angle of the isophotes to vary freely. Subsequently, the smooth ellipse models were subtracted from the original images.
NGC 2549: when modeling and subtracting the diffuse galaxy halo (panel (a) in Figure 1), different stellar structures are evident. In particular, some excesses of light are clearly observed at the position of the two possible rings (orange letters A and B). On the other hand, when analyzing the colour distribution of the GC system (panel (b) in Figure 1), it does not show signs of a clear bimodality, although the system is obviously not unimodal. The colour histogram is dominated by the presence of the blue GC subpopulation (modal value ( g i ) 0 0.84 mag), and a less conspicuous red GC subpopulation ( ( g i ) 0 1.07 mag). In addition, these red GCs have a “knee” extending to the red end in ( g i ) 0 . When observing the spatial distribution of the latter (red circles in panel (a)), they have a slight concentration towards the galaxy ( 16 candidates within 4.2 kpc of galactocentric radius). These features suggest the accretion and/or merger of some lower-mass neighbours.
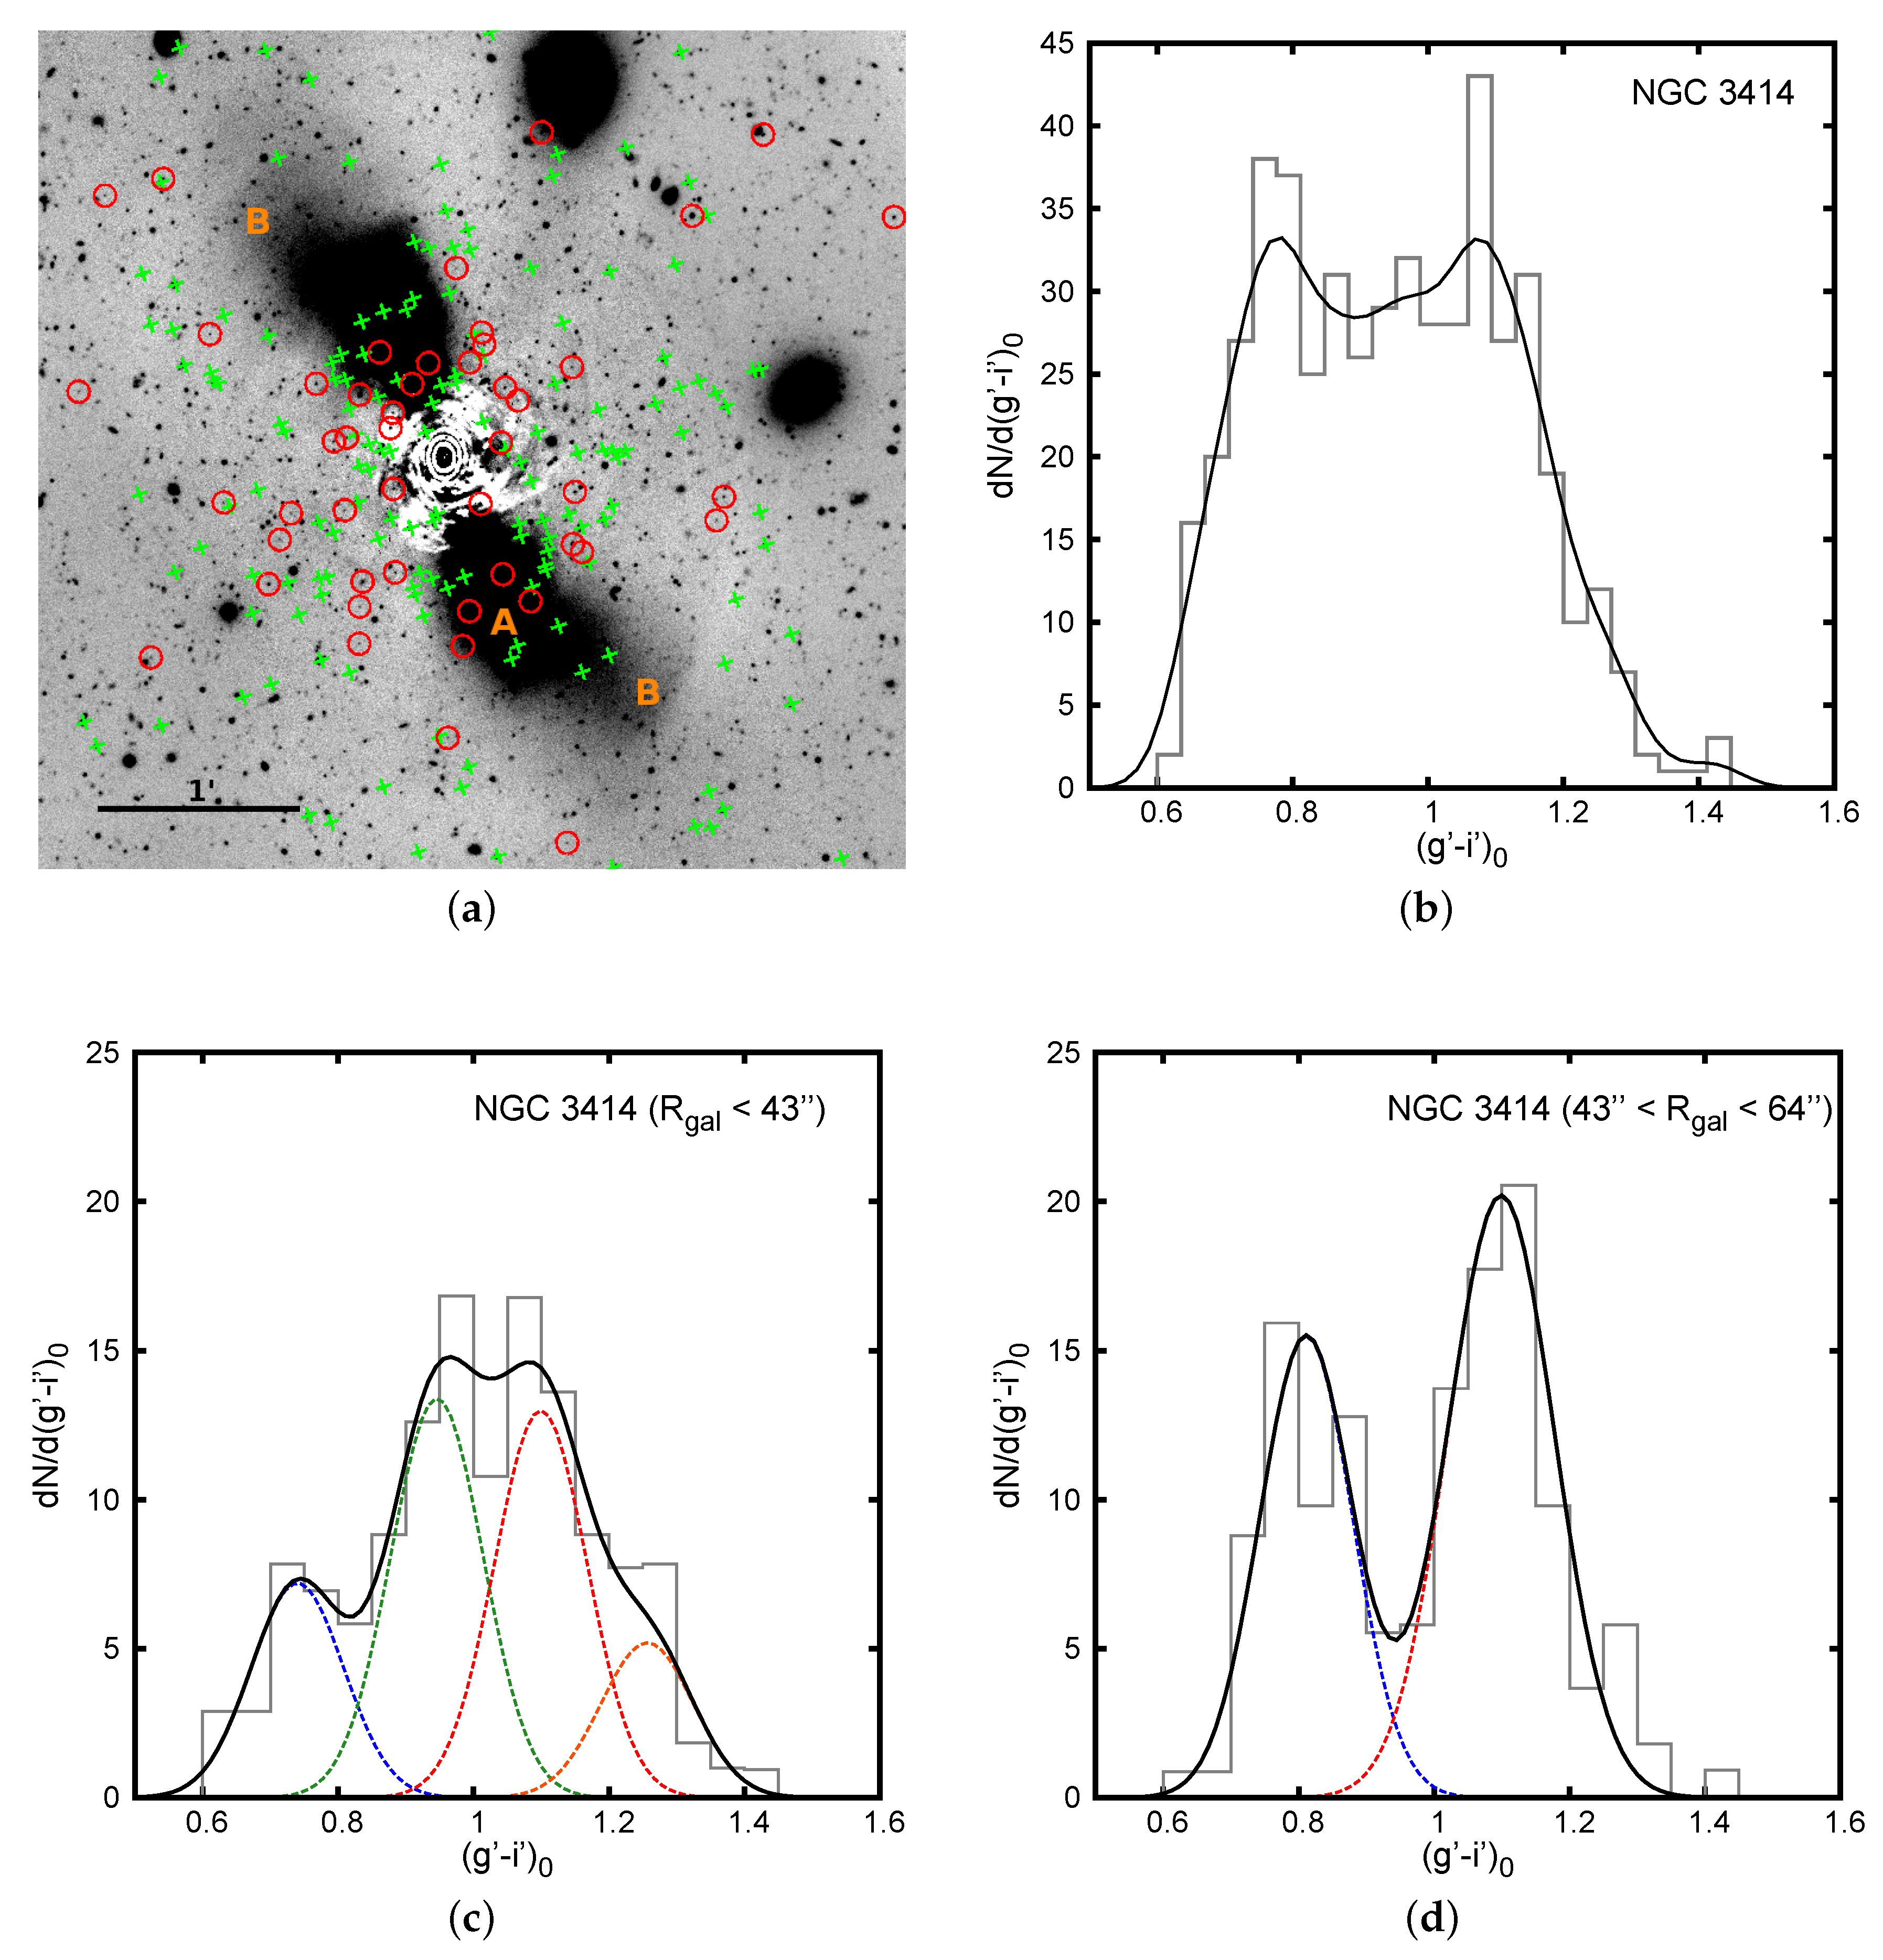
NGC 3414: In this case, by subtracting the model on the original image (panel (a) in Figure 2), two clear structures arise. On the one hand, the probable bar or disk perpendicular to the dust spiral, and shell structures on opposite sides, located at a distance of R gal 1.7 arcmin (orange letters A and B, respectively). Shell structures are usually interpreted as evidence that the galaxy has experienced a dry minor merger event recently. Furthermore, the asymmetric dust structure would indicate the accretion or merger of some gas-rich minor galaxy. In this case, the GC colour distribution presents a broad and flat shape (panel (b) in Figure 2). To study the different possible GC subpopulations in this galaxy, we separated our sample into several radial bins. Panel (c) shows that there are at least three peaks in the innermost region, which are found in the modal values ( g i ) 0 0.75 , ( g i ) 0 0.96 , and ( g i ) 0 1.09 mag, in addition to a possible group of GC significantly redder in ( g i ) 0 1.24 mag. The first and third peaks correspond to typical values for the aforementioned blue and red GC, while the intermediate and the reddest peaks may be associated with different subpopulations present in this galaxy. Towards larger galactocentric radii (panel (d)), the number of blue candidates begins to increase, clearly observing two peaks (blue and red GCs). The spatial distribution of the possible intermediate subpopulation and those GCs with reddest colours are shown in panel (a) (green crosses and red circles, respectively). The latter ones show a clear concentration towards the center of NGC 3414 which confirms the nature of GCs associated with the galaxy. The mean integrated colour shown by this group may have originated from highly enriched material during an old fusion with neighboring galaxies, although the reddening effect caused by the dust cannot be ruled out.
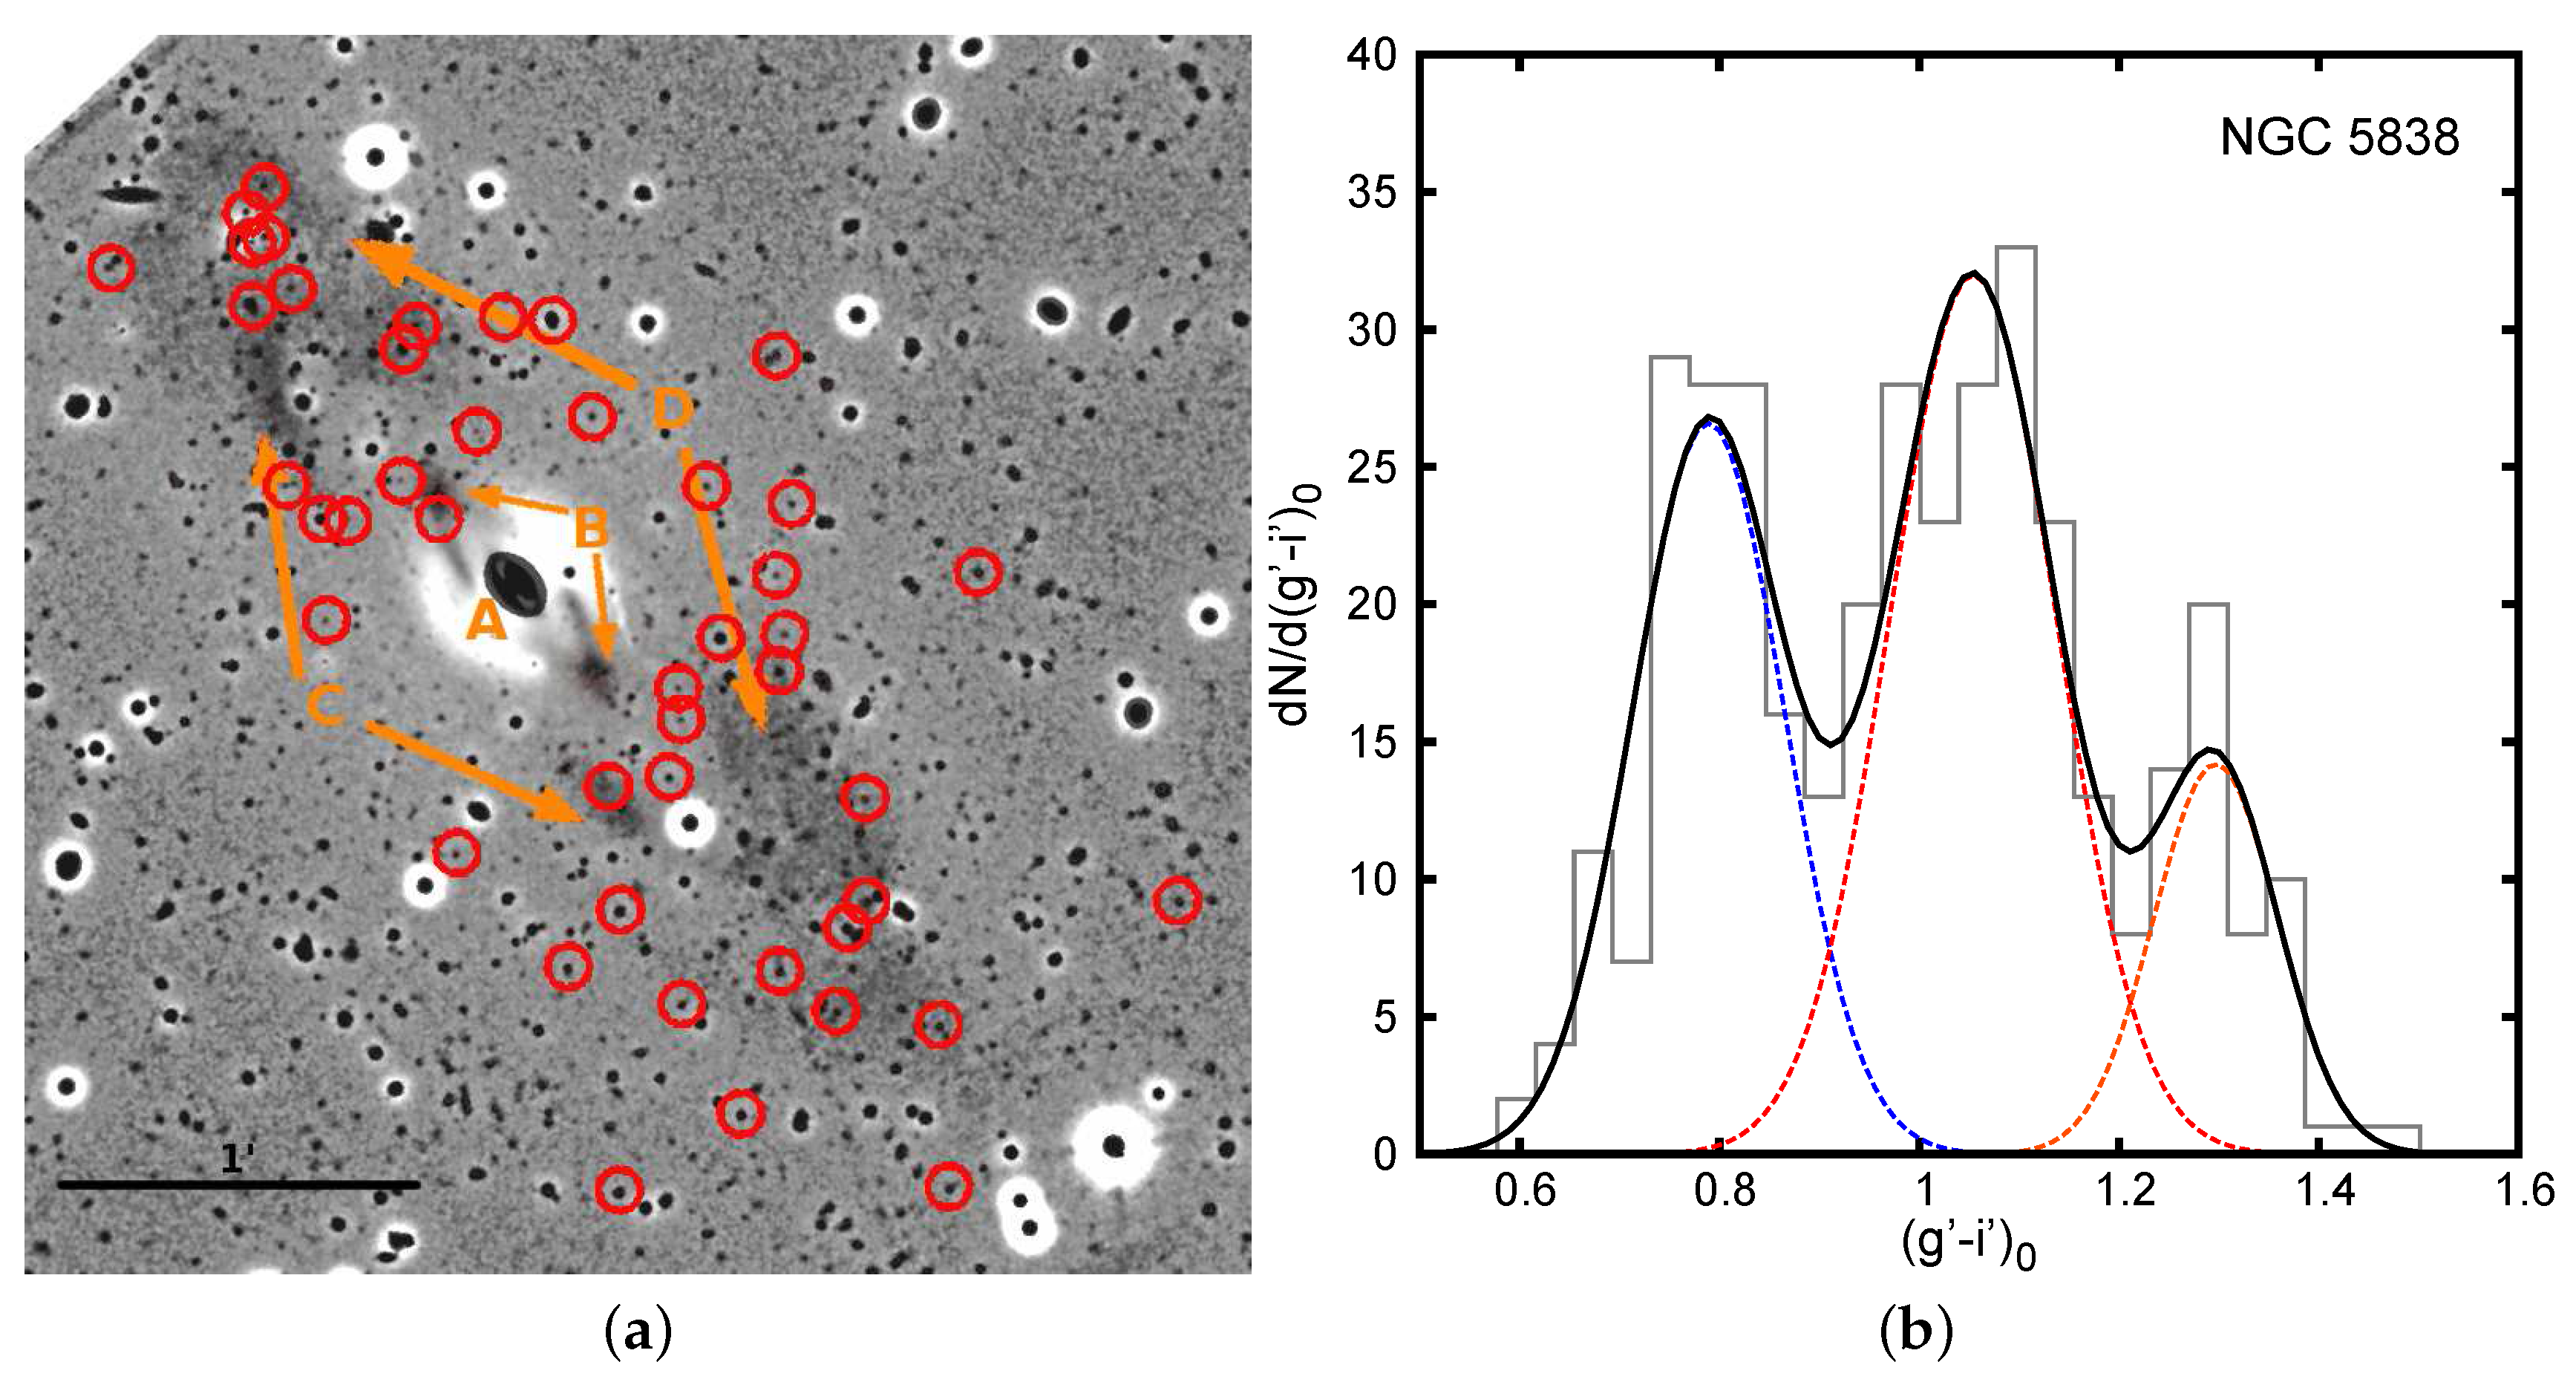
NGC 5838: to highlight the various complex structures present in this galaxy, we have used the unsharp masking technique. In panel (a) of Figure 3, a ring of dust (orange letter A) is observed towards the central part, whereas towards the outer zones it is possible to observe stellar rings and/or thin remains of a possible spiral structure, or the debris of a low-mass object destroyed in a fusion (B, C, D). The GC system of NGC 5838 (panel (b) in Figure 3) has a clear trimodal integrated colour distribution with peaks in the modal values ( g i ) 0 0.79 , ( g i ) 0 1.06 , and ( g i ) 0 1.28 mag. The first two are in good agreement with typical colors for the blue and red GC subpopulations, with a clear “valley” between them in ( g i ) 0 0.90 mag. On the other hand, when analyzing the spatial distribution of the reddest candidates (red circles in panel (a)), it is observed that they present an elongated distribution along the semi-major axis of the galaxy. As mentioned in the case of NGC 3414, the presence of GCs with these particularly red colours may be due to the effects of internal reddening coming from the galaxy, and/or the existence of a very rich metal subpopulation formed in a third GC formation.

4. Conclusions

We have obtained photometric data from three S0 galaxies located in relatively low density environments in order to initially characterize their GC systems and look for evidence about their formation. As shown in this work, the various and particular properties exhibited by some of these systems, such as the existence of multiple GC subpopulations and low surface-brightness substructures, indicate that most of the studied galaxies have probably undergone several merger/interaction-accretion events. The presence of these features may be related to the formation history of the GCs [20,21,22], mainly of those that present different colours to the typical blue and red subpopulations. These pieces of evidence leads directly to a question: is it possible that these events are responsible for their current morphologies? The answer is still open.

Acknowledgments

This research was funded with grants from Consejo Nacional de Investigaciones Científicas y Técnicas de la República Argentina, Agencia Nacional de Promoción Científica y Tecnológica, and Universidad Nacional de La Plata, Argentina.

Conflicts of Interest

The authors declare no conflict of interest.

References

  1. Brodie, J.P.; Strader, J. Extragalactic Globular Clusters and Galaxy Formation. Annu. Rev. Astron. Astrophys. 2006, 44, 193–267. [Google Scholar] [CrossRef]
  2. Blom, C.; Spitler, L.R.; Forbes, D.A. Wide-field imaging of NGC 4365’s globular cluster system: the third subpopulation revisited. Mon. Not. Roy. Astron. Soc. 2012, 420, 37–60. [Google Scholar] [CrossRef]
  3. Caso, J.P.; Richtler, T.; Bassino, L.P.; Salinas, R.; Lane, R.R.; Romanowsky, A. The paucity of globular clusters around the field elliptical NGC 7507. Astron. Astrophys. 2013, 555, A56. [Google Scholar] [CrossRef]
  4. Sesto, L.A.; Faifer, F.R.; Forte, J.C. The complex star cluster system of NGC 1316 (Fornax A). Mon. Not. Roy. Astron. Soc. 2016, 461, 4260–4275. [Google Scholar] [CrossRef]
  5. Laurikainen, E.; Salo, H. Observed properties of boxy/peanut/barlens bulges. In Galactic Bulges; Springer: Basel, Switzerland, 2016. [Google Scholar]
  6. Seifert, W.; Scorza, C. Disk structure and kinematics of S0 galaxies. Astron. Astrophys. 1996, 310, 75–92. [Google Scholar]
  7. Michard, R.; Poulain, P. Colour distributions in E-S0 galaxies. - V. Colour data for strongly inclined lenticulars. Astron. Astrophys. Suppl. 2000, 141, 1–22. [Google Scholar] [CrossRef]
  8. Sil’chenko, O.K.; Proshina, I.S.; Shulga, A.P.; Koposov, S.E. Ages and abundances in large-scale stellar discs of nearby S0 galaxies. Mon. Not. Roy. Astron. Soc. 2012, 427, 790–805. [Google Scholar] [CrossRef]
  9. Garcia, A.M. General study of group membership. II - Determination of nearby groups. Astron. Astrophys. Suppl. 1993, 100, 47–90. [Google Scholar]
  10. Whitmore, B.C.; Lucas, R.A.; McElroy, D.B.; Steiman-Cameron, T.Y.; Sackett, P.D.; Olling, R.P. New observations and a photographic atlas of polar-ring galaxies. Astron. J. 1990, 100, 1489–1522. [Google Scholar] [CrossRef]
  11. Chitre, A.; Jog, C.J. Luminosity profiles of advanced mergers of galaxies using 2MASS data. Astron. Astrophys. 2002, 388, 407–424. [Google Scholar] [CrossRef]
  12. Peletier, R.F.; Balcells, M.; Davies, R.L.; Andredakis, Y.; Vazdekis, A.; Burkert, A.; Prada, F. Galactic bulges from Hubble Space Telescope NICMOS observations: ages and dust. Mon. Not. Roy. Astron. Soc. 1999, 310, 703–716. [Google Scholar] [CrossRef]
  13. Peletier, R.F.; Balcells, M. Near-infrared surface photometry of bulges and disks of spiral galaxies. The data. New Astron. 1997, 1, 349–362. [Google Scholar] [CrossRef] [Green Version]
  14. Michard, R.; Marchal, J. Quantitative morphology of E-S0 galaxies. III. Coded and parametric description of 108 galaxies in a complete sample. Astron. Astrophys. Suppl. 1994, 105. [Google Scholar]
  15. McDermid, R.M.; Alatalo, K.; Blitz, L.; Bournaud, F.; Bureau, M.; Cappellari, M.; Crocker, A.F.; Davies, R.L.; Davis, T.A.; de Zeeuw, P.T.; et al. The ATLAS3D Project - XXX. Star formation histories and stellar population scaling relations of early-type galaxies. Mon. Not. Roy. Astron. Soc. 2015, 448, 3484–3513. [Google Scholar] [CrossRef]
  16. Tully, R.B.; Courtois, H.M.; Dolphin, A.E.; Fisher, J.R.; Héraudeau, P.; Jacobs, B.A.; Karachentsev, I.D.; Makarov, D.; Makarova, L.; Mitronova, S.; et al. Cosmicflows-2: The Data. Astron. J. 2013, 146, 86. [Google Scholar] [CrossRef]
  17. Tonry, J.L.; Dressler, A.; Blakeslee, J.P.; Ajhar, E.A.; Fletcher, A.B.; Luppino, G.A.; Metzger, M.R.; Moore, C.B. The SBF Survey of Galaxy Distances. IV. SBF Magnitudes, Colors, and Distances. Astrophys. J. 2001, 546, 681–693. [Google Scholar] [CrossRef]
  18. Theureau, G.; Hanski, M.O.; Coudreau, N.; Hallet, N.; Martin, J.M. Kinematics of the Local Universe. XIII. 21-cm line measurements of 452 galaxies with the Nançay radiotelescope, JHK Tully-Fisher relation, and preliminary maps of the peculiar velocity field. Astron. Astrophys. 2007, 465, 71–85. [Google Scholar] [CrossRef]
  19. Cappellari, M.; Emsellem, E.; Krajnović, D.; McDermid, R.M.; Serra, P.; Alatalo, K.; Blitz, L.; Bois, M.; Bournaud, F.; Bureau, M.; et al. The ATLAS3D project - VII. A new look at the morphology of nearby galaxies: the kinematic morphology-density relation. Mon. Not. Roy. Astron. Soc. 2011, 416, 1680–1696. [Google Scholar] [CrossRef]
  20. Sikkema, G.; Carter, D.; Peletier, R.F.; Balcells, M.; Del Burgo, C.; Valentijn, E.A. HST/ACS observations of shell galaxies: inner shells, shell colours and dust. Astron. Astrophys. 2007, 467, 1011–1024. [Google Scholar] [CrossRef]
  21. Blom, C.; Forbes, D.A.; Foster, C.; Romanowsky, A.J.; Brodie, J.P. The SLUGGS Survey: new evidence for a tidal interaction between the early-type galaxies NGC 4365 and NGC 4342. Mon. Not. Roy. Astron. Soc. 2014, 439, 2420–2431. [Google Scholar] [CrossRef]
  22. Bassino, L.P.; Caso, J.P. The merger remnant NGC 3610 and its globular cluster system: a large-scale study. Mon. Not. Roy. Astron. Soc. 2017, 466, 4259–4271. [Google Scholar] [CrossRef]
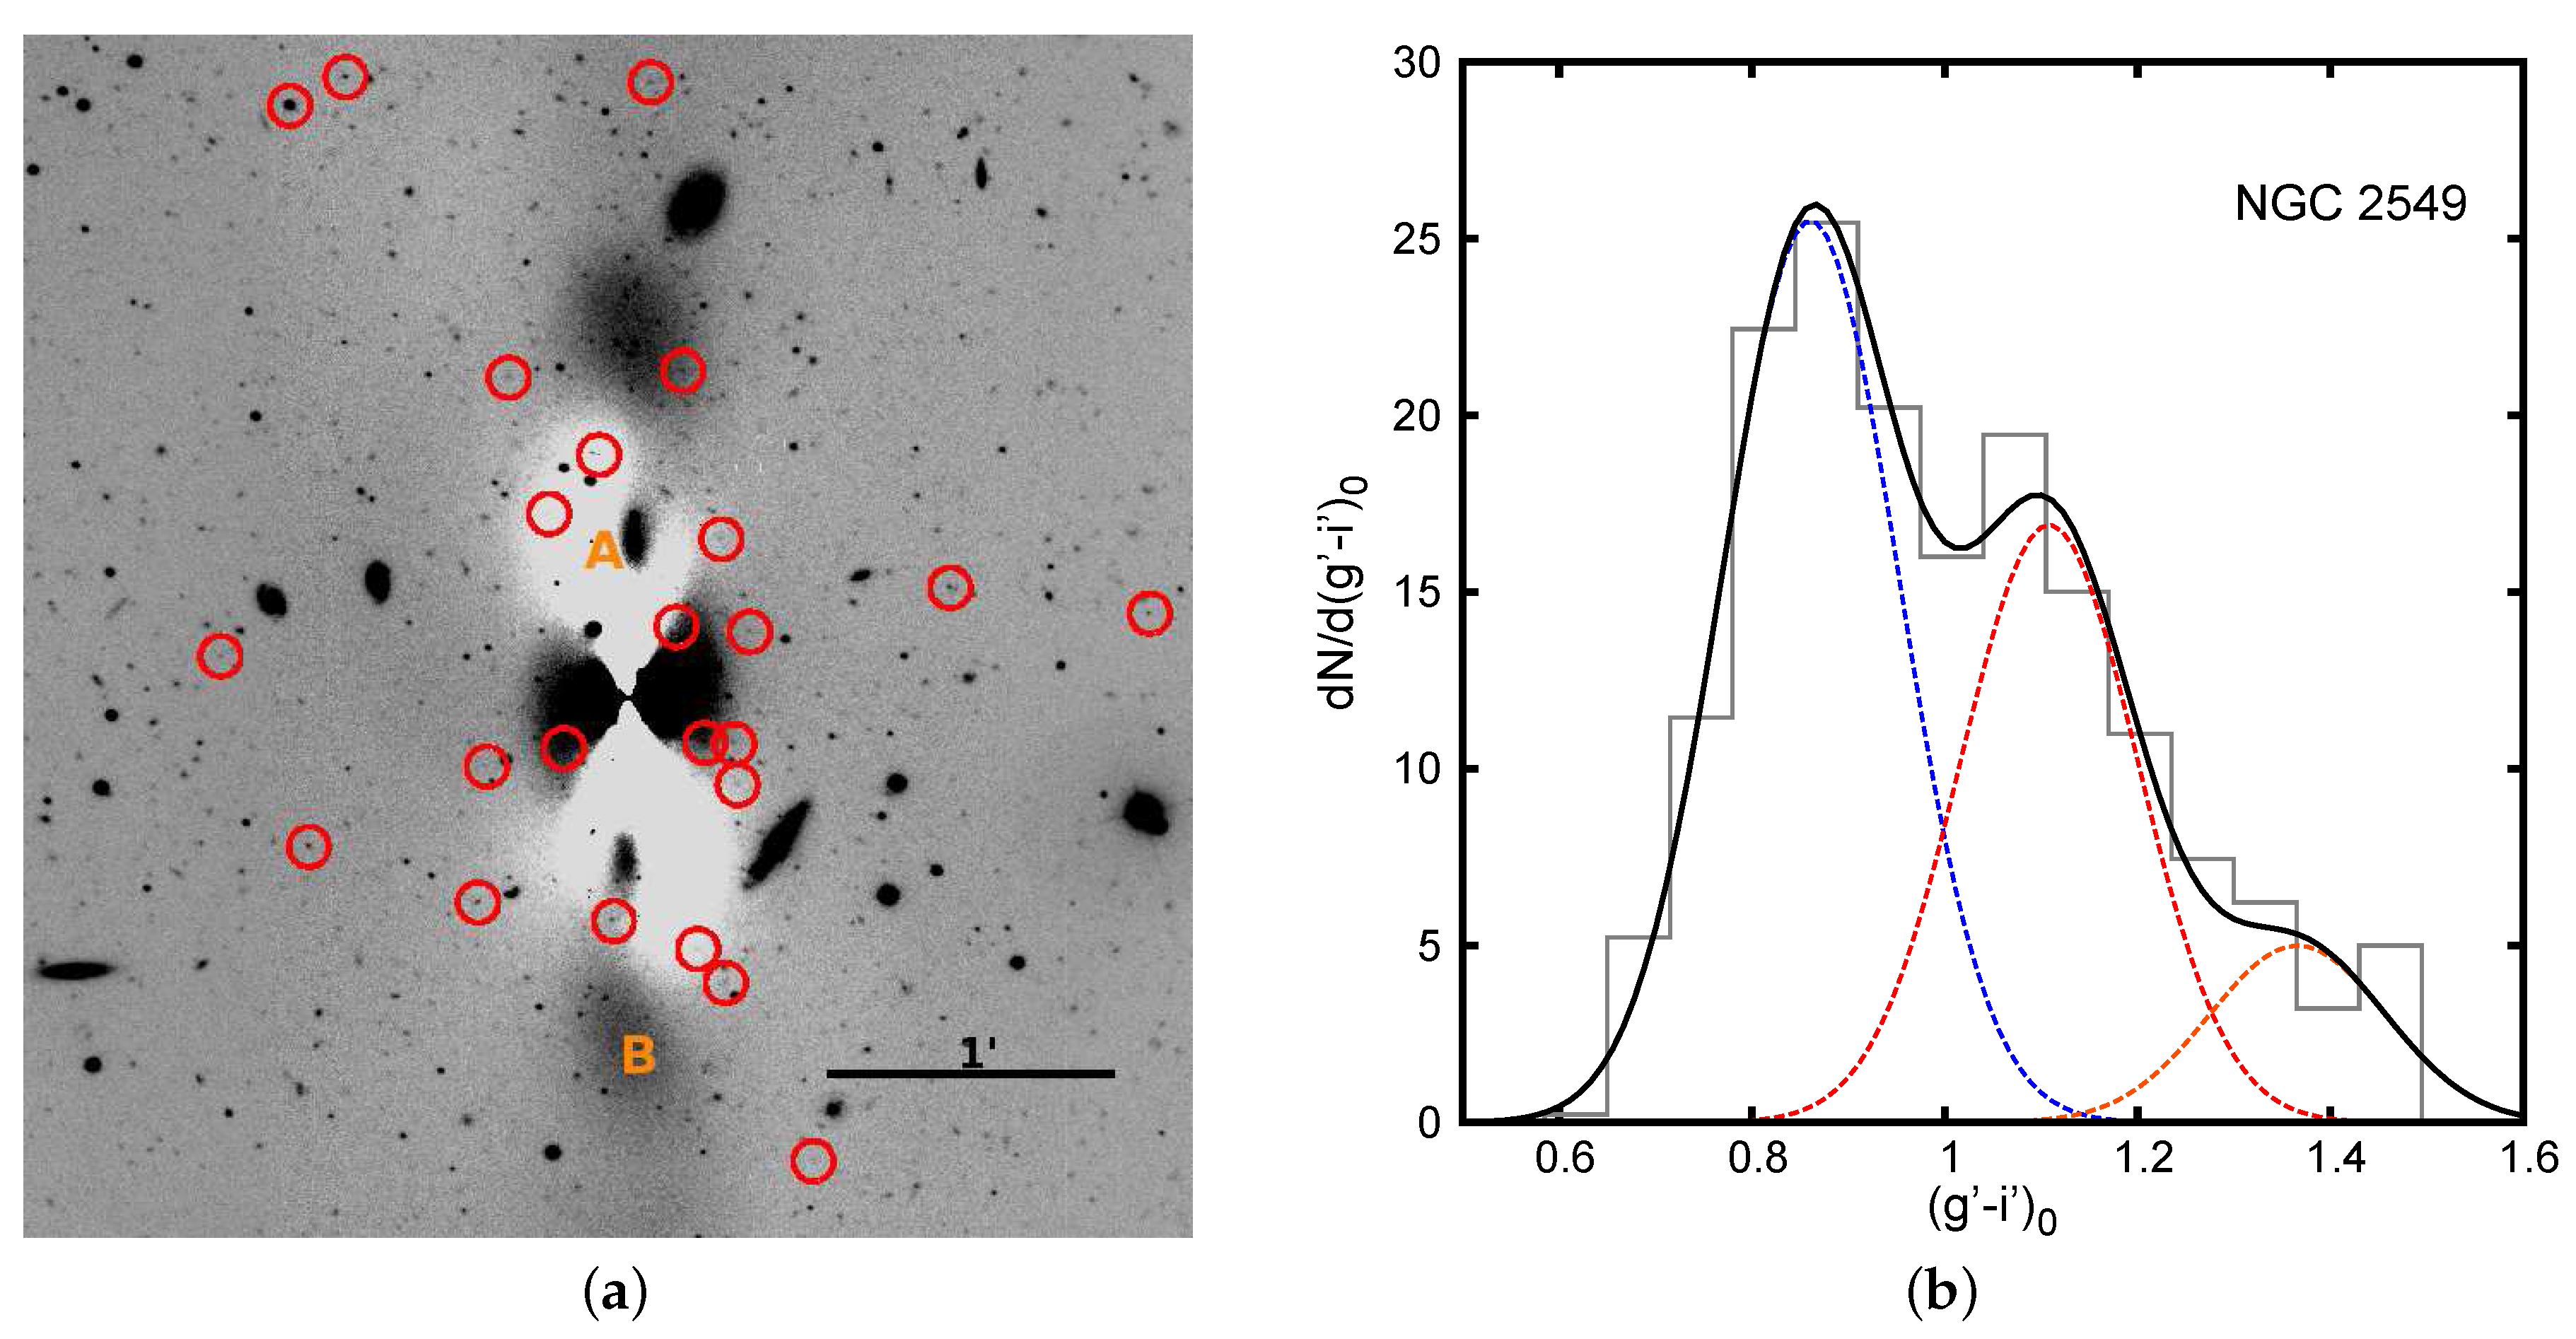
Figure 1. (a) Image after the galaxy light is removed. The letters A and B indicate the excesses of light possibly associated with two rings. Red circles show the position of the globular cluster (GC) candidates with reddest colours. (b) Colour histogram ( g i ) 0 for the GC candidates of NGC 2549. The dashed lines show the Gaussian fit performed for each GC subpopulation.
Galaxies 05 00037 g001
Figure 2. (a) Image after the galaxy light is removed. The orange letters A and B indicate the bar/disk and the shells structures, respectively. Red circles and green crosses show the position of the GC candidates with the reddest colour ( g i ) 0 and those with intermediate colour, respectively. (b) Colour histogram ( g i ) 0 for the GC candidates of NGC 3414. Solid black line represents the smoothed colour distribution. (c,d) Colour histograms with the GC candidates according to the galactocentric distance < 43 and 43 64 arcsec, respectively. The dashed lines show the Gaussian fit performed for each GC subpopulation.
Galaxies 05 00037 g002
Figure 3. (a) Image after the galaxy light is removed. The orange letter A indicates the inner ring of dust. Letters B, C, and D show the outer stellar rings and/or the thin remains of a possible spiral structure. (b) Colour histogram ( g i ) 0 for the GC candidates of NGC 5838. The dashed lines show the Gaussian fit performed for each GC subpopulation.
Galaxies 05 00037 g003
Table 1. Galaxy sample. Morphological type taken from the NASA/IPAC Extragalactic Database (NED), right ascension and declination (NED), V magnitudes from the RC3 catalogue, distance modulus of Tully et al. [16], Tonry et al. [17] and Theureau et al. [18] for NGC 2549, NGC 3414, and NGC 5838, respectively. Last column indicates the mean surface density of galaxies inside a cylinder of height h = 600 km s 1 centered on the galaxy which contains the 10 nearest neighbors [19].
GalaxyType α J 2000 δ J 2000 M V ( m M ) 0 log Σ 10
(h:m:s)(d:m:s)(mag)(mag)(Mpc 2 )
NGC 2549SA0 0 (r)08:18:58.3+57:48:10.9 19.44 30.51 0.71
NGC 3414S0 pec10:51:16.2+27:58:30.3 21.11 32.01 0.16
NGC 5838SA0 15:05:26.2+02:05:57.6 21.24 32.01 0.39