Open Access
This article is
- freely available
- re-usable
Galaxies 2016, 4(4), 67; https://doi.org/10.3390/galaxies4040067
Article
Multiwavelength Monitoring of the Gamma-Bright Blazar Mkn 421
1
St. Petersburg State University, Universitetsky Prospekt, 28, Peterhof, St. Petersburg 198504, Russia
2
Department of Physics, Institute for Plasma Physics, University of Crete, Heraklion GR-71003, Greece
3
Crimean Astrophysical Observatory, P/O Nauchny, Crimea 298409, Russia
4
Pulkovo Observatory of Russian Academy of Sciences, Pulkovskoye Chaussee 65, Saint-Petersburg 196140, Russia
*
Author to whom correspondence should be addressed.
Academic Editors:
Jose L. Gómez,
Alan P. Marscher
and
Svetlana G. Jorstad
Received: 13 July 2016 / Accepted: 16 November 2016 / Published: 23 November 2016
Abstract
:We present the results of photo-polarimetric monitoring observations of the blazar Markarian 421 carried out with different telescopes (the 0.4 m telescopes of St. Petersburg State University and the Pulkovo Observatory, the 0.7 m telescope of the Crimean Astrophysical Observatory) during 2008–2015. We analyse the optical data as well as gamma-ray ligh t curves obtained with the Fermi Large Area Telescope. The multiwavelength flux variations are discussed.
Keywords:
blazars; monitoring observations; color variations1. Introduction
Mkn 421 is the closest (z = 0.031) and the most well studied TeV blazar. It is classified as a high synchrotron peaked blazar [1] based on its spectral energy distribution (HSP). It was the first blazar detected at TeV energies [2]. Mkn 421 exhibits large variations in the TeV, GeV, X-ray, and optical wavebands [3,4,5], with correlated TeV and X-ray variations [6].
Here we present results of a color variation analysis of the blazar Mkn 421 during 2008–2015.
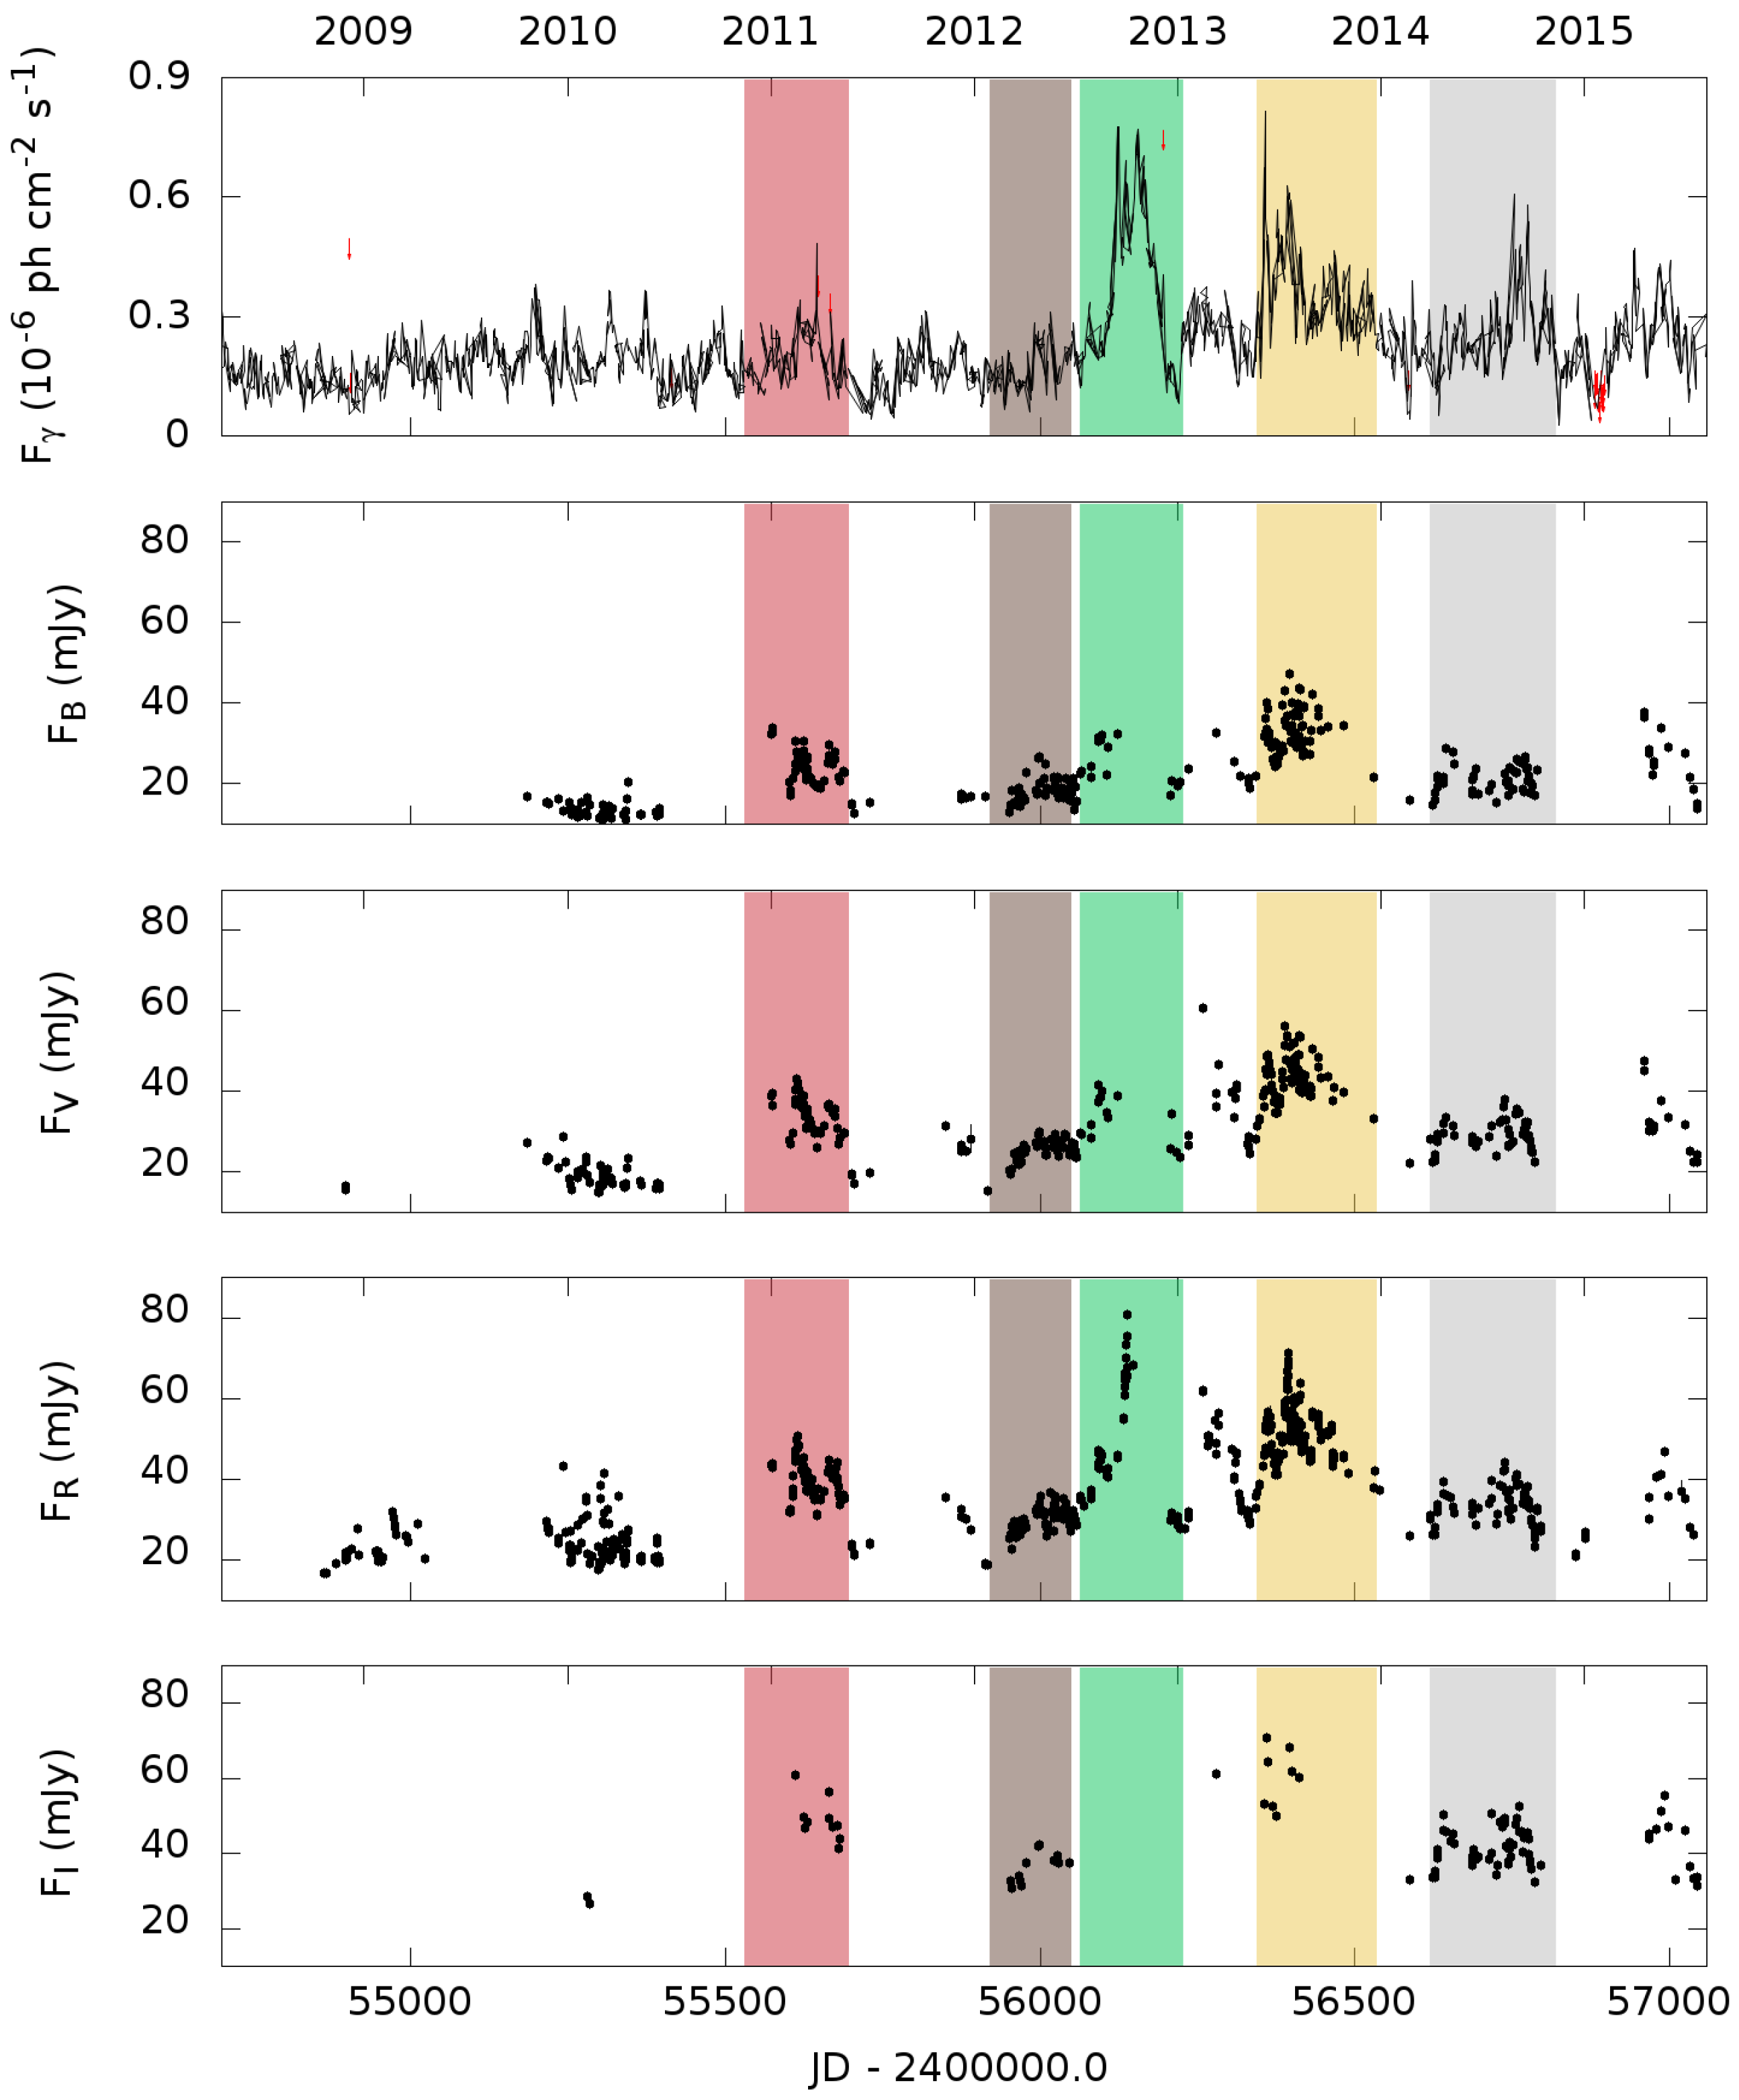
2. Observations and Data Reduction
The photometric observations in bands were carried out with several telescopes: 70-cm of Crimean Observatory (AZT-8), 40-cm of the Astronomical Institute of St. Petersburg State University (LX-200) and 40-cm of Pulkovo Observatory of the Russian Academy of Sciences (LX-200). The observing and reduction techniques are described in [7].
Figure 1 presents the Fermi Large Area Telescope γ-ray light curve (red vectors correspond to upper limits) and the -bands optical light curves of Mkn 421 during 2008–2015.
We derive γ-ray flux densities at 0.1–200 GeV by analyzing data from the Fermi Large Area Telescope (LAT), provided by the Fermi Science Space Center using the standard software [8]. We have constructed γ-ray light curves with 4-day binning, with a detection criterion that the maximum-likelihood test statistic (TS) should exceed 10.0.
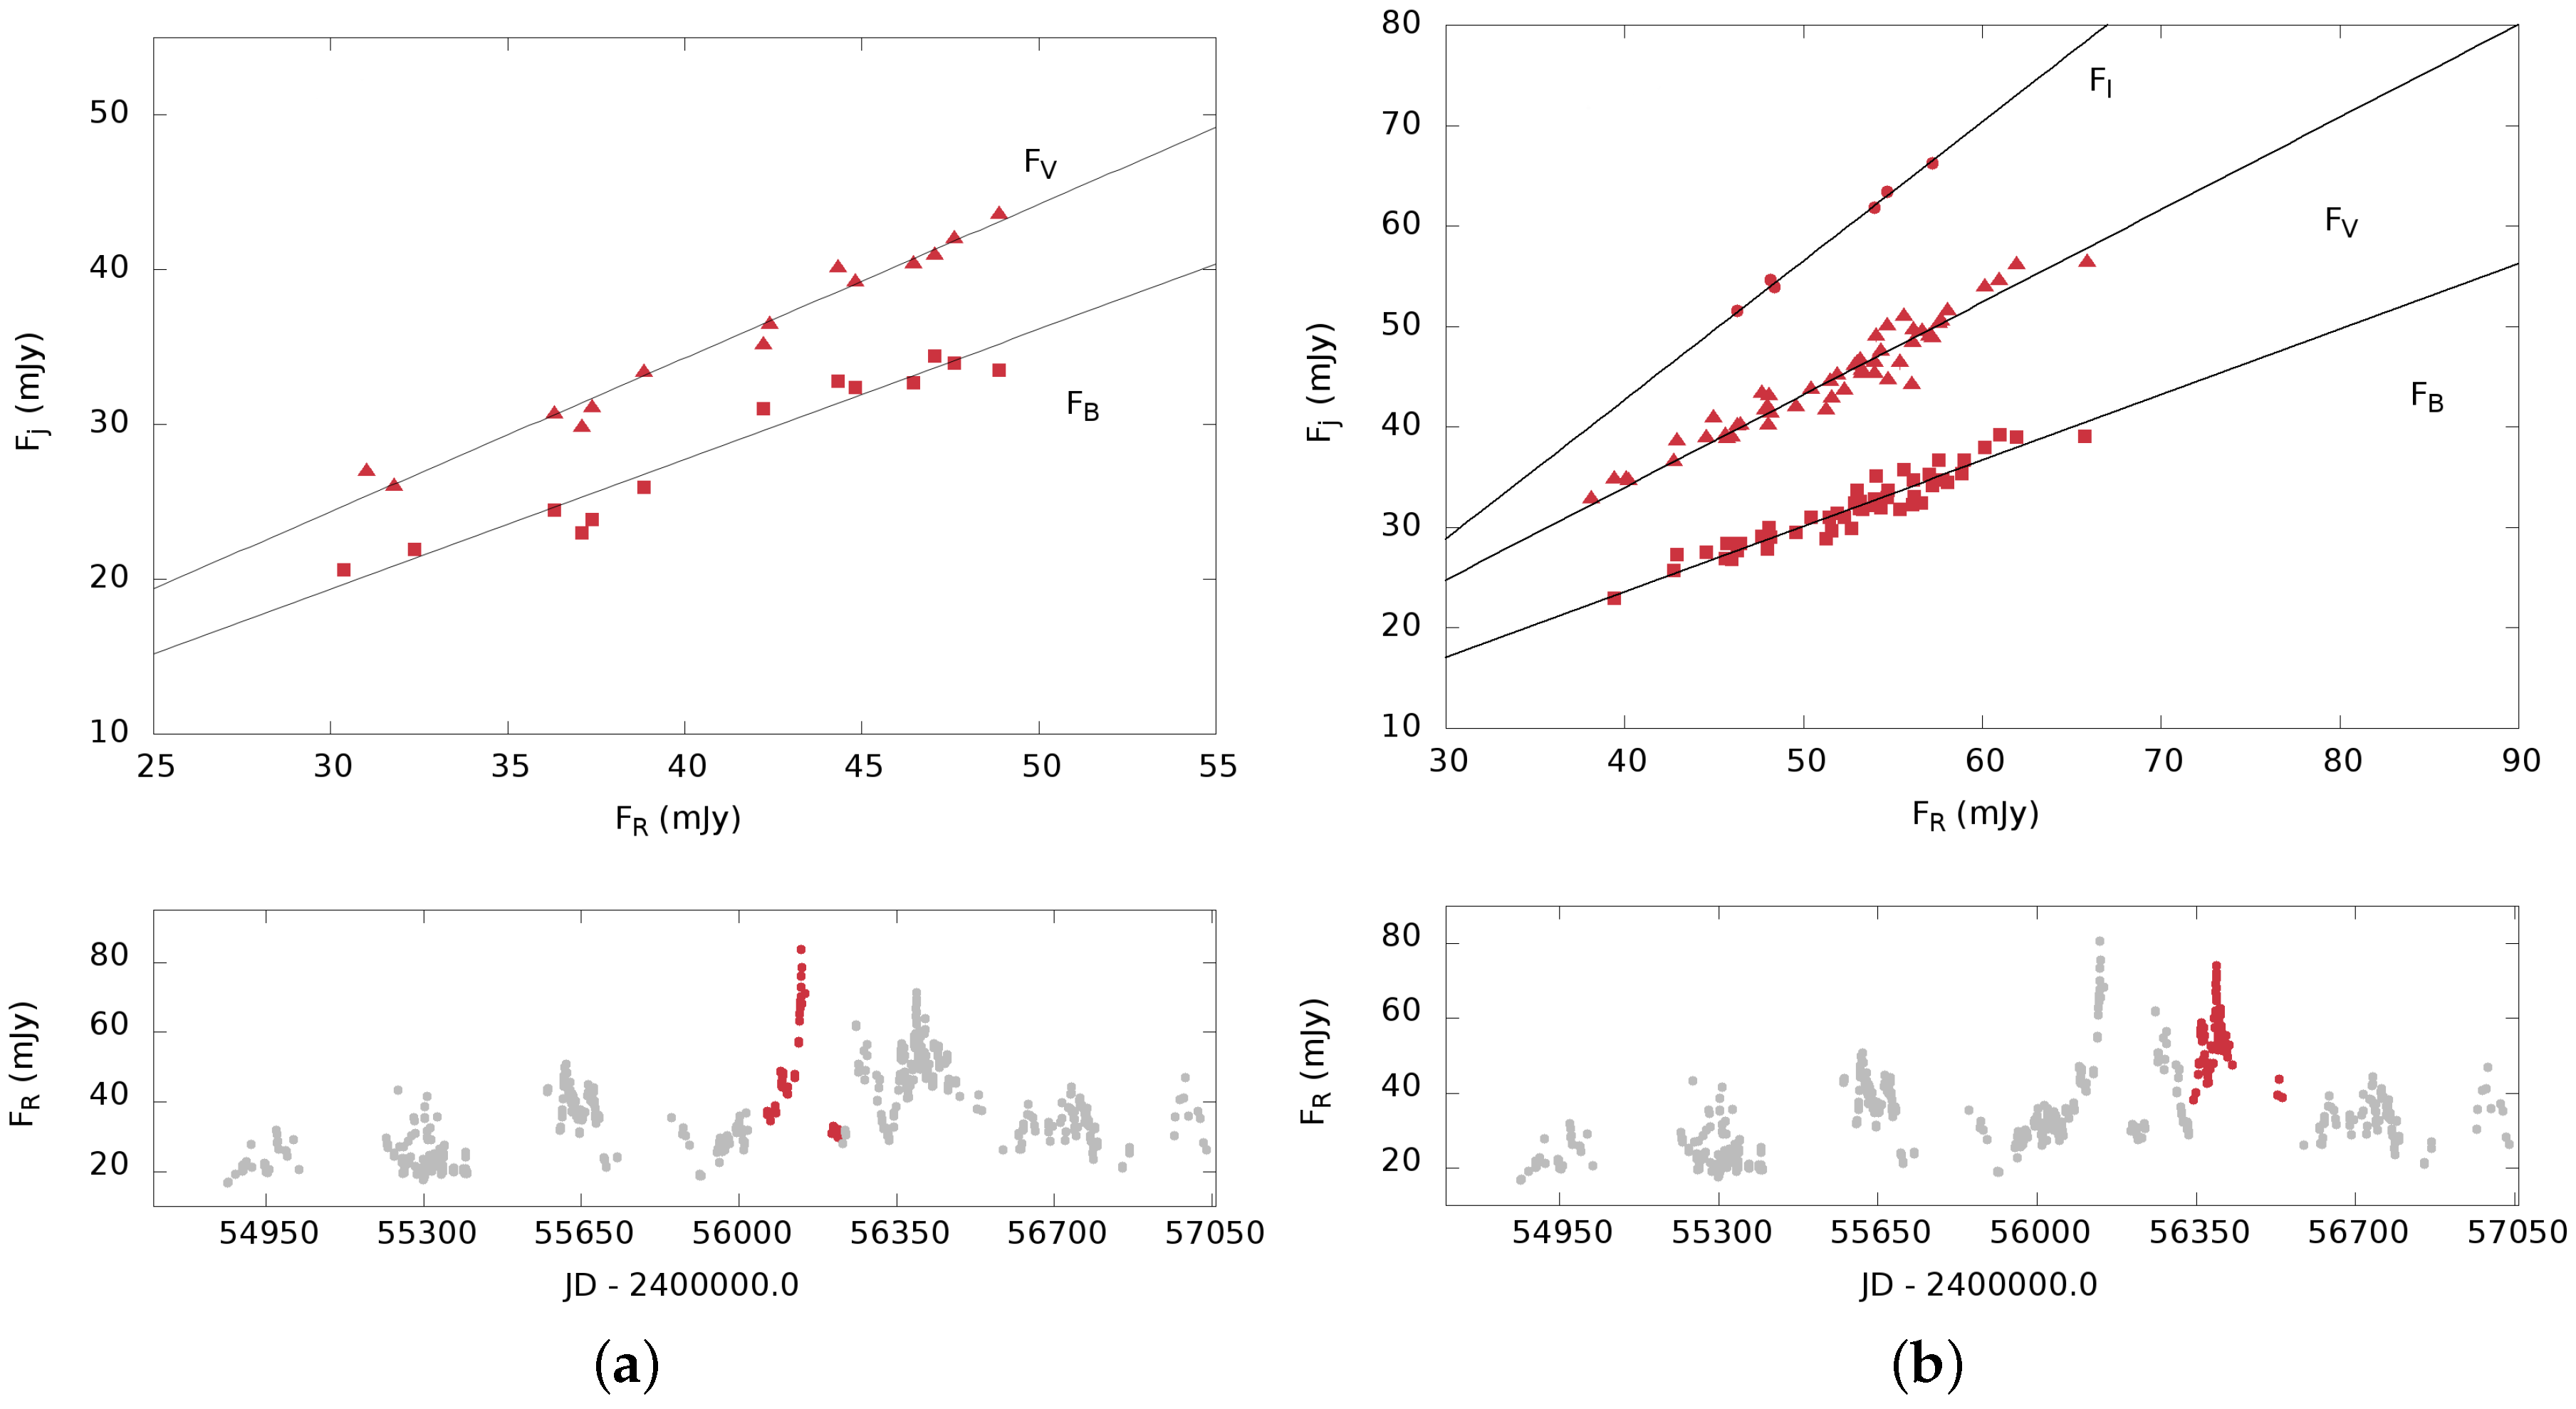
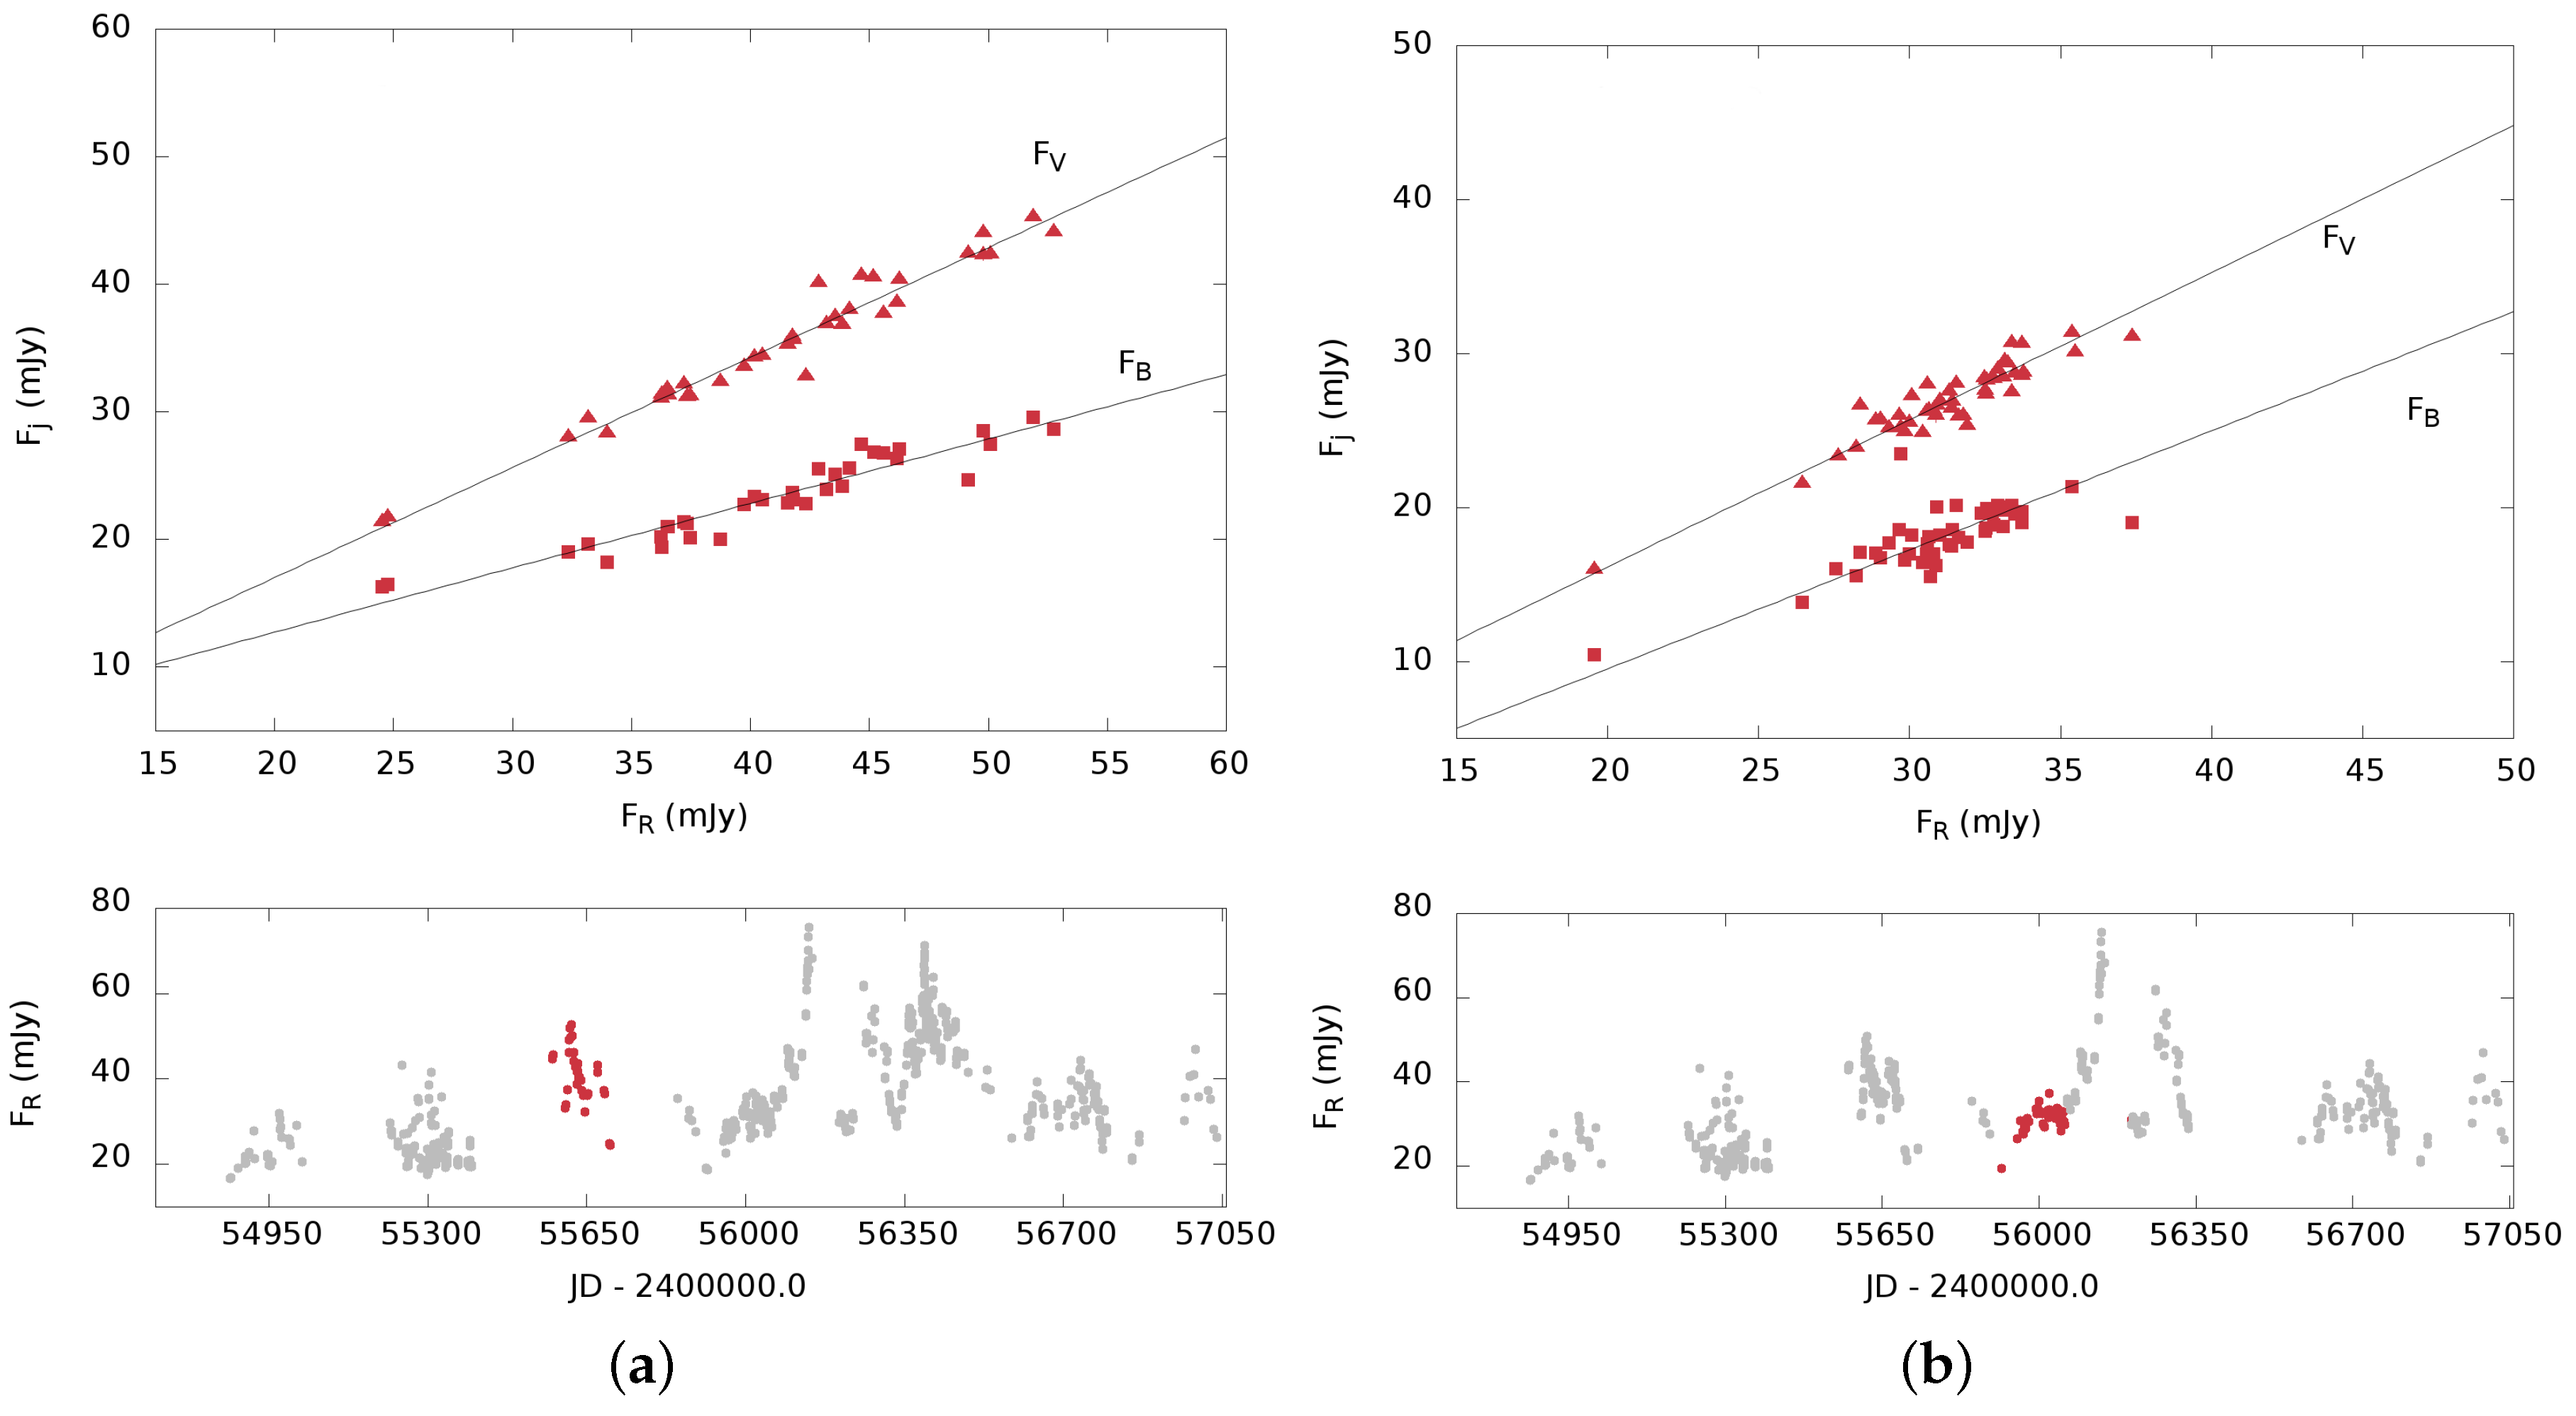
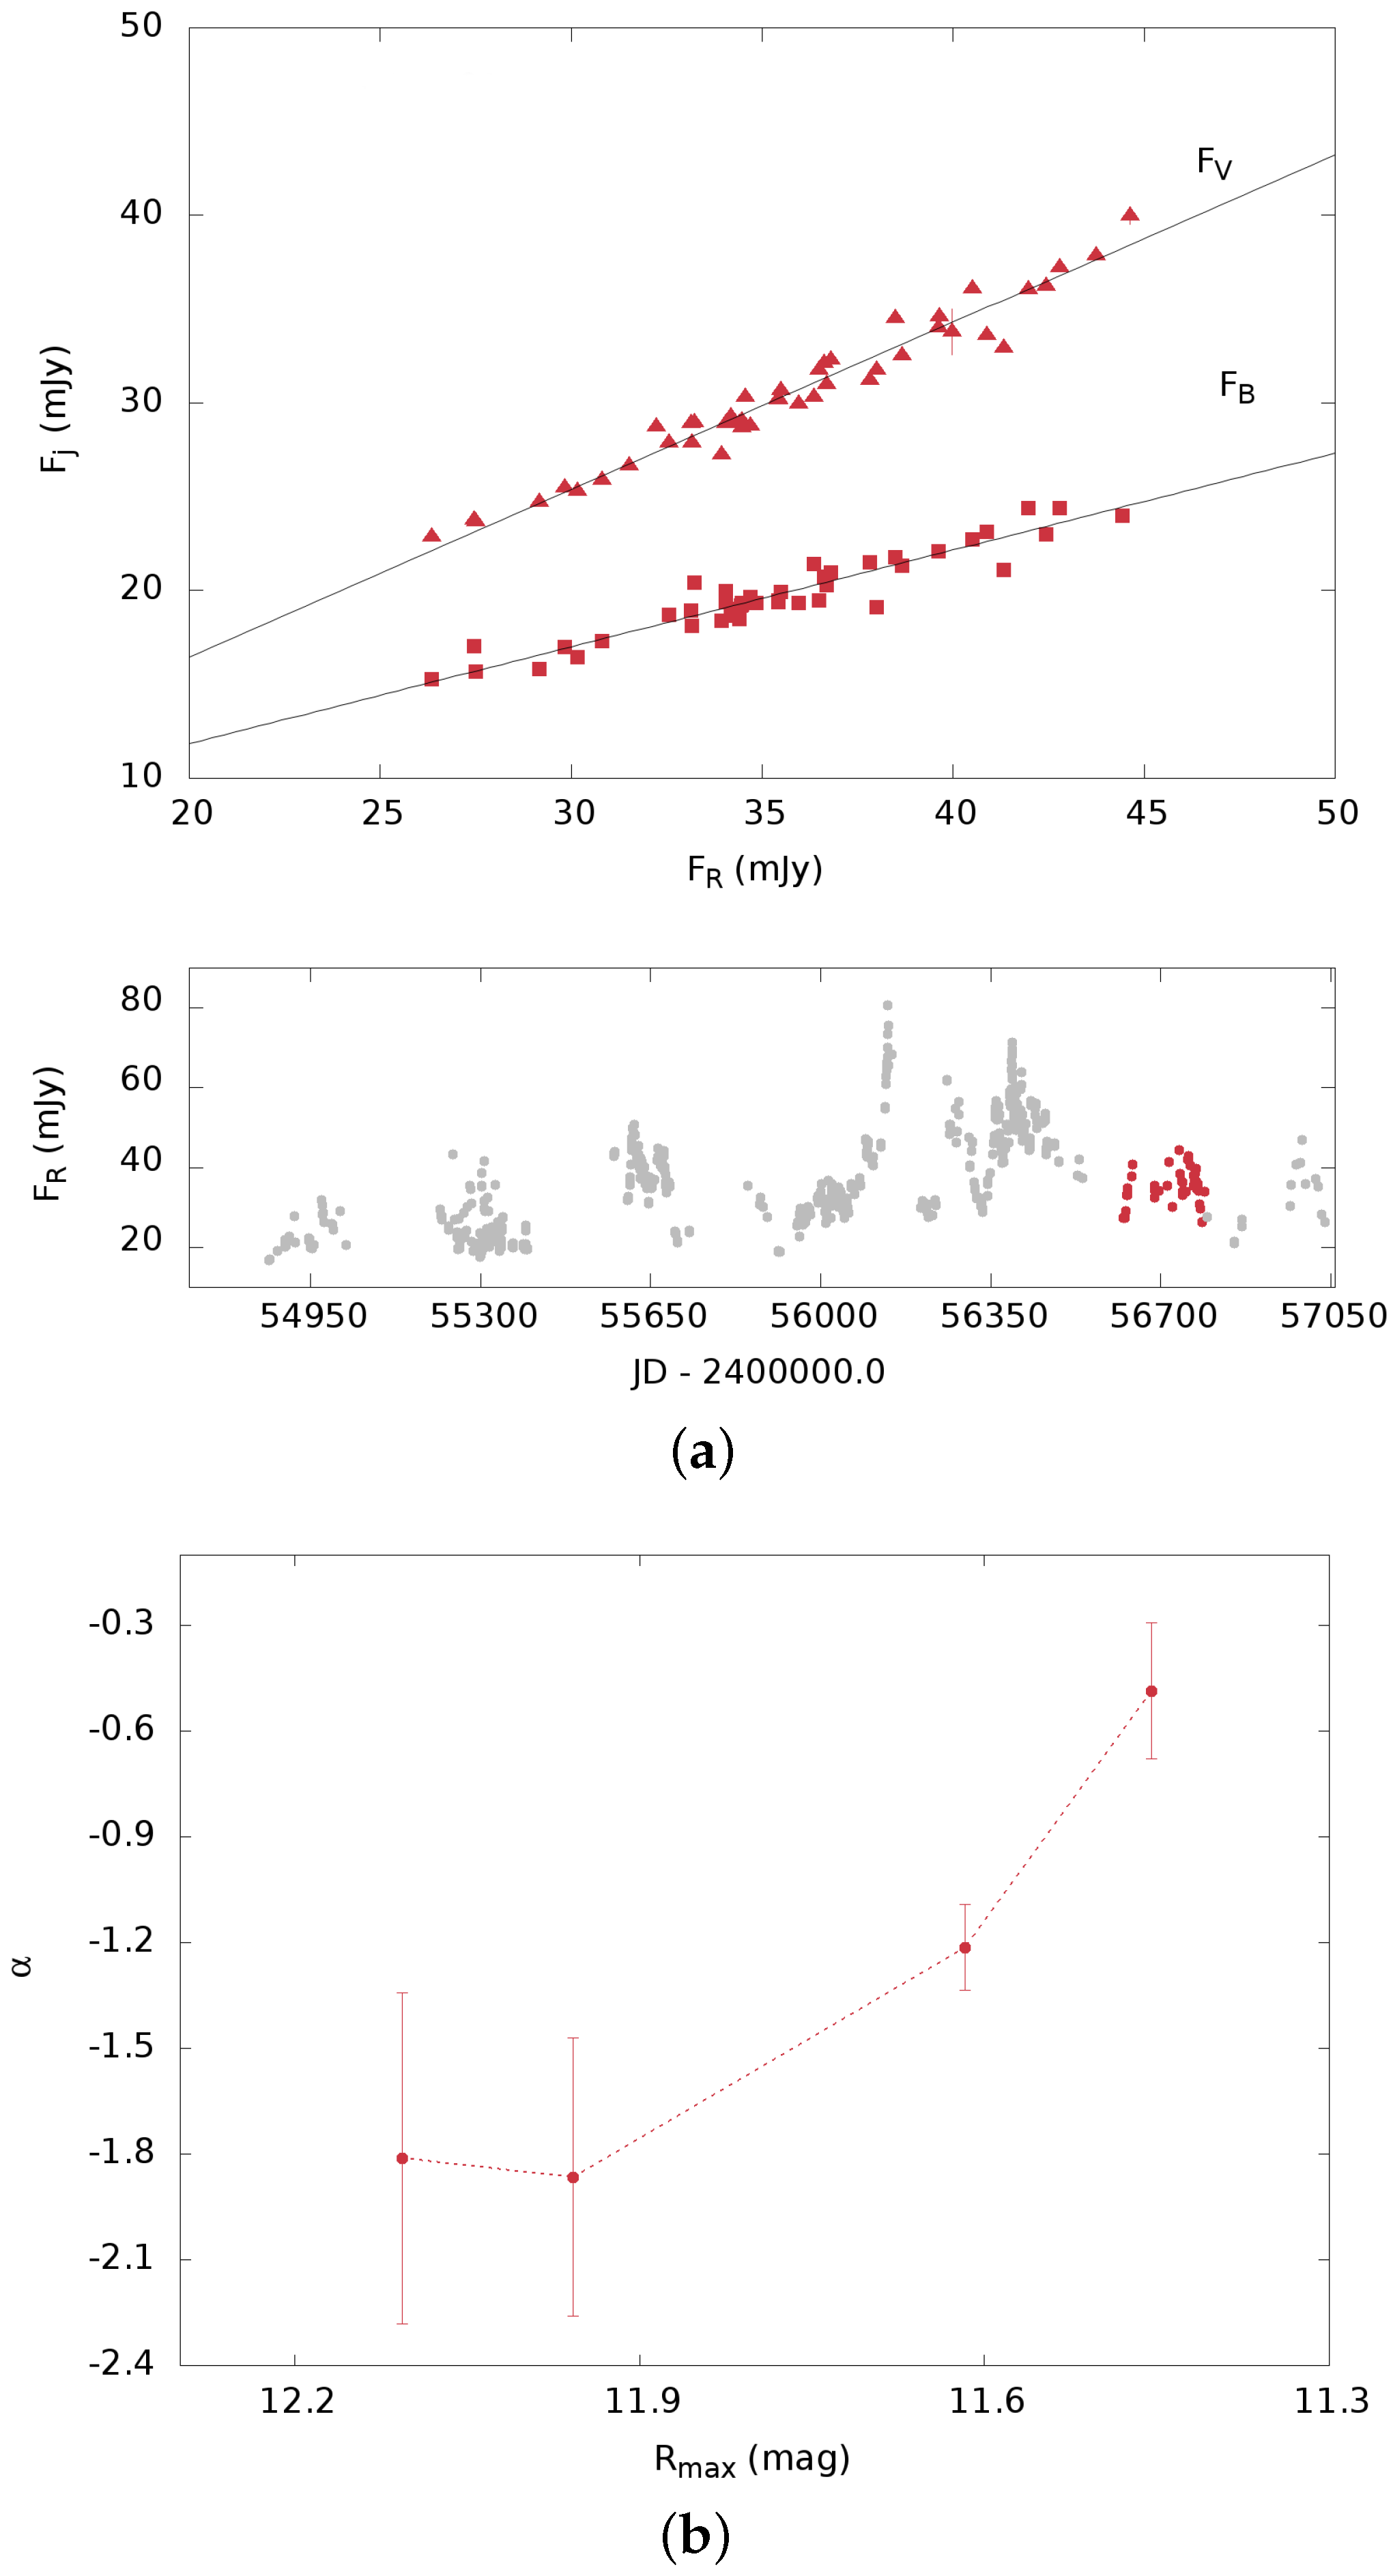
3. Results and Discussion
Color analysis is an important tool to investigate the spectral behavior of the source and, in turn, the nature of its emission.
The technique that was used in our analysis of the color variations is described in [9]. It assumes the presence of two components in the radiation: one constant and one variable, with the latter responsible for the source activity.
This technique, which has been used to analyze color variations of blazars many times (see, for instance [7]), is based on plotting “flux-flux” diagrams for two bands. The data for simultaneous observations lie along straight lines in such diagrams if the color characteristics of the variable component remain unchanged during the studied time interval; the slopes of these lines yield the flux ratios for the variable component in the analyzed bands. Thus, multicolor variability observations can provide the relative spectral energy distribution (SED) of the variable component.
We have plotted the observed flux density as function of (Figure 2, Figure 3 and Figure 4a) for various intervals of the light curve. These intervals are marked with the multicolor rectangles in Figure 1. For 2012 the analysis was made for the outburst and its close neighborhood. As can be seen, the data points are best-fitted by a straight lines and the slopes of these lines are different for various intervals. Note that the flux density is given only for 2013, because we do not have a sufficient number of data points in I band.
The SEDs follow the power law ( where α is spectral index). The least-square fit gives the spectral indices. The relative SEDs for these intervals, corrected for the interstellar extinction, are given at Table 1:
The spectral indices are different for the outburst of 2012 and its neighborhood (green and brown rectangles in Figure 1): and , respectively. The change of the spectral index could be caused by emergence of a new radiant component. The SED of this component is harder compared to the pre-outburst SED. This can be explained by enrichment of the emitting plasma with high-energy electrons. Figure 4b presents the change of the spectral index with the brightness of the outburst. As can be seen, the spectrum is harder when the outburst is brighter. Such “bluer when brighter” behavior was also detected in the blazars OJ 287 and BL Lac [10].
Acknowledgments
We thank all our colleagues who participated in the observations. The research at St. Petersburg State University was partly funded by RFBR grants 16-32-00036, 15-02-00949 and SPbSU grant 6.38.335.2015.
Author Contributions
All authors have participated in both the analysis and the scientific discussion.
Conflicts of Interest
The authors declare no conflict of interest.
References
- Abdo, A.A.; Ackermann, M.; Agudo, I.; Axelsson, M.; Baldini, L.; Ballet, J.; Barbiellini, G.; Bastieri, D.; Baughman, B.M.; Bechtol, K.; et al. The Spectral Energy Distribution of Fermi Bright Blazars. Astrophys. J. 2010, 716, 30. [Google Scholar] [CrossRef]
- Punch, M.; Akerlof, C.W.; Cawley, M.F.; Chantell, M.; Fegan, D.J.; Fennell, S.; Gaidos, J.A.; Hagan, J.; Hillas, A.M.; Jiang, Y.; et al. Detection of TeV photons from the active galaxy Markarian 421. Nature 1992, 358, 477–478. [Google Scholar] [CrossRef]
- Acciari, V.A.; Aliu, E.; Arlen, T.; Aune, T.; Beilicke, M.; Benbow, W.; Boltuch, D.; Bradbury, S.M.; Buckley, J.H.; Bugaev, V.; et al. TeV and Multi-wavelength Observations of Mrk 421 in 2006–2008. Astrophys. J. 2011, 738, 25. [Google Scholar] [CrossRef]
- Acciari, V.A.; Aliu, E.; Aune, T.; Beilicke, M.; Benbow, W.; Böttcher, M.; Bradbury, S.M.; Buckley, J.H.; Bugaev, V.; Butt, Y.; et al. Simultaneous Multiwavelength Observations of Markarian 421 During Outburst. Astrophys. J. 2009, 703, 169. [Google Scholar] [CrossRef]
- Horan, D.; Acciari, V.A.; Bradbury, S.M.; Buckley, J.H.; Bugaev, V.; Byrum, K.L.; Cannon, A.; Celik, O.; Cesarini, A.; Chow, Y.C.K.; et al. Multiwavelength Observations of Markarian 421 in 2005–2006. Astrophys. J. 2009, 695, 596–618. [Google Scholar] [CrossRef]
- Fossati, G.; Buckley, J.H.; Bond, I.H.; Bradbury, S.M.; Carter-Lewis, D.A.; Chow, Y.C.K.; Cui, W.; Falcone, A.D.; Finley, J.P.; Gaidos, J.A.; et al. Multiwavelength Observations of Markarian 421 in 2001 March: An Unprecedented View on the X-Ray/TeV Correlated Variability. Astrophys. J. 2008, 677, 906–925. [Google Scholar] [CrossRef]
- Hagen-Thorn, V.A.; Larionov, V.M.; Efimova, N.V.; Hagen-Thorn, I.; Arkharov, A.A.; di Paola, A.; Dolci, M.; Takalo, L.O.; Sillanpää, A.; Ostorero, L. Optical and IR monitoring of the BL Lac object S5 0716+714 from 2001–2004. Astron. Rep. 2006, 50, 458–467. [Google Scholar] [CrossRef]
- Atwood, W.B.; Abdo, A.A.; Ackermann, M.; Althouse, W.; Anderson, B.; Axelsson, M.; Baldini, L.; Ballet, J.; Band, D.L.; Barbiellini, G.; et al. The Large Area Telescope on the Fermi Gamma-Ray Space Telescope Mission. Astrophys. J. 2009, 697, 1071–1102. [Google Scholar] [CrossRef]
- Hagen-Thorn, V.A.; Marchenko, S.G. Photometry and Polarimetry of Active Galactic Nuclei. Balt. Astron. 1999, 8, 575–592. [Google Scholar]
- Blinov, D.A. The Structure of the Jets Blazars on the Results of Optical Monitoring. Ph.D. Thesis, St. Petersburg State University, St. Petersburg, Russia, 2011. [Google Scholar]
Figure 1.
From top to bottom: γ-ray and the -band optical light curves of Mkn 421 during 2008–2015.

Figure 2.
(a) Flux-flux diagrams for the interval of 2011; (b) Flux-flux diagrams for the interval of 2012.
Figure 2.
(a) Flux-flux diagrams for the interval of 2011; (b) Flux-flux diagrams for the interval of 2012.

Figure 3.
(a) Flux-flux diagrams for the outburst of 2012; (b) Flux-flux diagrams for the interval of 2013.
Figure 3.
(a) Flux-flux diagrams for the outburst of 2012; (b) Flux-flux diagrams for the interval of 2013.

Figure 4.
(a) Flux-flux diagrams for the interval of 2014; (b) The change of the spectral index with the brightness of the outburst.
Figure 4.
(a) Flux-flux diagrams for the interval of 2014; (b) The change of the spectral index with the brightness of the outburst.

Intervals | α |
---|---|
2011 | |
2012 | |
2012 flare | |
2013 | |
2014 |
© 2016 by the authors; licensee MDPI, Basel, Switzerland. This article is an open access article distributed under the terms and conditions of the Creative Commons Attribution (CC-BY) license (http://creativecommons.org/licenses/by/4.0/).