Article

Light Variability from UV to Near-Infrared in the Ap Star CU Vir Induced by Chemical Spots

Institute of Astronomy of Russian Academy of Sciences, Pyatnitskaya Str., 48, 119017 Moscow, Russia
*
Author to whom correspondence should be addressed.
Galaxies 2025, 13(4), 97; https://doi.org/10.3390/galaxies13040097
Submission received: 8 July 2025 / Revised: 9 August 2025 / Accepted: 18 August 2025 / Published: 21 August 2025
(This article belongs to the Special Issue Stellar Spectroscopy, Molecular Astronomy and Atomic Astronomy)

Abstract

Multiwavelength modelling of the light variations in the chemically peculiar star CU Vir is presented. The modelling is based on the recent Doppler Imaging of CU Vir, which provides maps of the surface distribution of Si, Fe, He, and Cr. Intensity maps in both individual photometric filters and in the wide wavelength range from UV to NIR were calculated, taking into account the individual chemical abundances on the stellar surface. Comparison with observations revealed good agreement of both the light curves and their amplitude along the spectrum. Additionally, we analysed changes in the photometric period of the CU Vir from 1955 to 2022, including TESS measurements. The data of the last decades clearly indicate a gradual decrease in this period. Measurements of the CU Vir period over the next two decades will be crucial for verifying or refuting the periodic nature of its variations.

Graphical Abstract

1. Introduction

Rotationally modulated spectroscopic and light variability is one of the key characteristics of chemically peculiar magnetic Ap/Bp stars. The reason for this variability is the inhomogeneous surface distribution of elements (chemical spots) [1], which is built up by selective atomic diffusion [2,3]. Such a patchy surface abundance pattern, in turn, affects the emergent flux via the effects of line blanketing, bound-free transitions, and modification of the local thermal structure of the atmosphere [4]. In the last few decades, the advances in surface imaging have made it possible to quantitatively model the light variability of some Ap/Bp stars and to reproduce quite successfully their photometric observations [5,6,7,8,9]. These results generally confirmed the concept of the Ap/Bp stars’ variability. At the same time, the increasing accuracy of observations of the chemically peculiar stars allows the study of very fine effects, such as variations in low-amplitude variability of HgMn stars [10] due to the migration of spots or still unexplained changes in photometric periods of Ap/Bp stars (e.g., [11]). Proper interpretation of these phenomena also requires improved accuracy of light curve modelling and an understanding of all mechanisms underlying variability within a single rotational cycle.
The Ap star CU Vir (HD 124224) has been known to be spectroscopically variable since Deutsch [12]. Later, Hardie [13] discovered the periodic light variations of CU Vir. The star possesses one of the fastest axial rotation rates among the known Ap/Bp stars with a period of P 0 . 52 d . Subsequent observations revealed unusual changes in the photometric period [11,14,15,16,17,18]. The first semi-quantitative model by Krivoseina et al. [5] allowed the reconstruction of the surface distribution of silicon in CU Vir, concentrated in three spots, and on its basis to reproduce satisfactorily the observed light curves in v b y bands. Krtička et al. [8], using results of multi-element Doppler Imaging (DI) by Kuschnig et al. [19], performed modelling of the light curve of CU Vir from UV to the visual range. It was shown that the bulk of the photometric variability of the star is caused by the inhomogeneous distribution of silicon, as well as iron and chromium. Due to the flux redistribution, the photometric amplitude in UV grossly exceeds that in the visual spectrum. The synthetic light curves showed good agreement with observations except in the near-UV region. Various explanations for the remaining difference between model and observations have been proposed, including limitations of DI, unaccounted contributions from other elements, effects of vertical abundance stratification, deviations from LTE in the line formation region, effects of magnetic field, etc. In a subsequent study by Kochukhov et al. [20], the parameters of CU Vir were refined, and Zeeman–Doppler Imaging (ZDI) was performed on the basis of high-resolution NARVAL [21] spectra. These authors derived the topology of the magnetic field, which deviates significantly from the axisymmetric dipole, and also revealed the relation between magnetic and abundance structures. The chemical spot pattern was in general agreement with Kuschnig et al. [19] imaging. Krtička et al. [22] showed that employing DI maps by Kochukhov et al. [20] improved the theoretical representation of the flux-calibrated HST observations in far-UV. However, it is still of interest to examine how the employment of new surface maps, updated atomic data, and advanced atmospheric models will affect the theoretical representation of CU Vir’s light variability over a wide wavelength range, including recent spacecraft TESS (Transiting Exoplanet Survey Satellite [23]) data. This is the aim of our study.
The paper consists of a description of observational data (Section 2), an analysis of the changes in the period of CU Vir (Section 3), modelling of the light curve (Section 4) and its results (Section 5), and a discussion in Section 6.

2. Observational Data

2.1. Doppler Imaging

For the modelling of light curves, we employed the results of multielement DI of CU Vir by Potravnov et al. [24]. This paper provides a detailed discussion of spectroscopic observations, DI technique, and derived surface abundance distributions for five elements—He, Mg, Si, Fe, Cr—which were reconstructed using the archival high-resolution ( R 65 , 000 ) spectroscopic timeseries obtained with the NARVAL echelle spectrograph. This is the same raw observational material used by Kochukhov et al. [20]. Thirteen spectra were obtained in a few runs during the 2009–2011 interval and cover the rotational period of CU Vir with good phase coverage (see Table 1 in [24] for the log of observations employed for DI). DI results in a strongly inhomogeneous surface distribution of the above-mentioned elements, with He and Mg varying roughly in antiphase with Si, Fe, and Cr. The abundance differences reached up to [ X / H ] = log ( N X / N t o t ) log ( N X / N t o t ) + 2 dex in the abundance scale for the element X relative to the Sun. The detailed discussion of spectroscopic observations, DI technique, and obtained surface abundance distributions is given in the paper by Potravnov et al. [24].
It is essential for light curve modelling that the resulting surface maps are presented in the form of the equi-element spherical grid of 3764 elements in total, with fixed abundances of the five considered elements in each grid cell.

2.2. Photometry

In our study, we analysed the publicly available photometric observations of CU Vir spanning the UV to red optical wavelengths. We used modern, accurate ground- and space-based optical photometry and UV spectrophotometry for light curve modelling and also employed historical photometric data to evaluate the period variations.
We used data from Sokolov [25], who analysed IUE spectra taken in January–March 1979 using the LWR (Long Wavelength Redudant 2000–3000 Å) and SWP (Short Wavelength Prime 1250–1900 Å) cameras and extracted a set of monochromatic fluxes. The 23 scans in the dataset provide uniform phase coverage over the stellar rotational period. Krtička et al. [8] reprocessed these IUE data to study the monochromatic light variations in UV.
In the optical range, we mainly focused on data by Pyper et al. [15] obtained in the Strömgren photometric system u v b y . This is the longest series of homogeneous accurate observations of CU Vir, with 2820 measurements per filter. The typical photometric accuracy is 0.005m, 0.004m, 0.004m, and 0.003m for u v b y bands, respectively. The dataset spans the period from 1991 to 2012 and was obtained in 21 observational sets. We also used the extensive set of heterogeneous historical data available in the literature to discuss the period changes.
In our study, we also analysed the red optical photometry observed from 26 March 2022 to 22 April 2022 (over 14,000 measurements across 26 days with three data gaps) by the TESS space mission [23]. The dataset processed using the SPOC (Science Processing Operations Center) automatic software package was obtained via the MAST (Mikulski Archive for Space Telescopes) portal. The radiation flux was converted to the TESS magnitude scale using the formula m T E S S = −2.5 l o g ( S A P _ F L U X ) + 20.44 as specified in the mission documentation (https://tess.mit.edu/public/tesstransients/pages/readme.html#flux-calibration accessed on 8 August 2025). The TESS dataset of CU Vir covers 50 rotational cycles, of which 37 have complete phase coverage.

3. Period Changes in CU Vir and Ephemeris

In contrast to the bulk of Ap/Bp stars with stable photometric periods, CU Vir demonstrates period variations that must be taken into account when phasing observational data. The first detection of these period changes was reported by Kuschnig et al. [26]. Subsequent analysis by Pyper et al. [14] revealed an abrupt period increase (indicative of the stellar spin-down) by ∼1.6 s occurring somewhere between 1983 and 1992. Continued photometric monitoring uncovered further period variations, which, within the model of discrete changes, are consistent with other glitches: one more period increase in ∼1992 and a subsequent decrease (acceleration of rotation) after 2012 [16]. The period between glitches is assumed to be constant. Alternatively, Mikulášek et al. [17,18] proposed the model with smooth period oscillations within ≈65 year cycle.
We collected photometric observations of CU Vir from 1955 to 2022 available in the literature and determined the period for annual observational seasons (excluding data from Pyper and Adelman [27], Adelman et al. [28], as well as Hoeg et al. [29], which were not split due to large uncertainties) using a Lomb–Scargle periodogram [30]. The complete list of observations with their detailed characteristics is presented in Table 1. The table includes the years of observations, the date range for each dataset, the number of measurements, the photometric band and the references. For a few datasets obtained before 1970, where the observational coverage was insufficient for reliable period determination, we adopted the period estimates reported in the original publications. The uncertainties of the period are estimated as 1 Δ T N σ m , where Δ T is the duration of the observations (up to 365 days), N is the number of measurements, and σ m is the uncertainty of magnitude measurements. Consequently, periods derived from shorter time series exhibit larger uncertainties, as evident in some of our results.
Table 1. List of observational time series employed to estimate the period of CU Vir.
YearsRange, Days N obs BandReference
19559954UBVHardie [13]
1964–1966836235UBVAbuladze [31]
1980–1983113923 u v b y Pyper and Adelman [27]
1987–1989796354UBVAdelman et al. [28]
1990–1993106879 B T V T Hoeg et al. [29]
2003–2010288511,990SMEI (4500–9500 Å)Krtička et al. [22]
2011–20172016/20281059/995B/VKrtička et al. [22]
1991–201277102820 u v b y Pyper et al. [15]
20222614,264TESS (5800–11,000 Å)MAST *
Literature values
1966318BHardie et al. [32]
1968 12085–105UBVBlanco and Catalano [33]
The period determinations are plotted against data models by Pyper and Adelman [16] (P20) and Mikulášek et al. [18] (M19) (their Model 1 fitted by a cosine function and adopting the following model parameters: P 0 = 0 . 52069404 d , A = 0.1611 , T 0 = 2446604.4390 , and Π = 24 , 110 d = 66 year) in Figure 1. At first glance, the plot can be roughly divided into two parts in terms of the density of observations. A significant increase in the number of observations was noticeable after ∼1990, when systematic observations of the star at FCAPT began [15]. Analysis of the pre-1990 data shows that, given their sparsity and errors, both interpretations, several constant periods and a smoothly changing one, are possible. The period found from Hardy’s 1955 data seems to marginally favour the M19 model.
The data are very sparse between 1980 and 1992; nevertheless, the drastic changes in the period are evident from Figure 1. The M19 model with continuous period changes reaches its extreme near 2005. The derivative of the period change tends to zero at this point, so the 1993–2012 data within the error limits are described well by both the models for the variable and the constant periods (the “tangent” at the maximum point). To quantify this, we used the so-called Bayesian information criterion (BIC) [34] for model selection (see details in Appendix A). Accounting for the quality of data fitting and penalising the growing number of the model’s free parameters, BIC allows for choosing an optimal model without overfitting. Generally, the models with a lower BIC are preferable. We have calculated the BIC for both models within four intervals: 1955–1983, 1983–1992, 1992–2012, and after 2012. We assume a number of free parameters of 2 and 6 for P20 and for the M19 cosine model, respectively, within each interval. The results are summarised in Table 2, together with the general root mean square (RMS). We also calculated the BIC parameter for the entire set of observations, where the combination of four discrete periods in P20 results in eight free parameters. The BIC= −2364.2 for P20 model and −2378.4 in the case of M19, as well as the data in Table 2, indicate a very similar formal quality of fit of the observations by both models, which is consistent with a similar conclusion by Pyper and Adelman Pyper and Adelman [16] based on O-C diagrams.
It can be seen from Table 2 that the estimates of RMS and BIC are quite close for these models, which is consistent with a similar conclusion by Pyper and Adelman [16] based on O-C diagrams. From a formal point of view, the models fit the data roughly equally, with M19 having a smaller RMS, excluding the period of 1955–1983, but a larger number of free parameters. An inspection of the data after 2012 reveals that a gradual decrease in the period is more likely than an abrupt change, in better agreement with the M19 model. This is particularly supported by the most recent TESS data. However, in our opinion, the final proof of the oscillatory model can be obtained in the next 5–10 years when the period will reach a minimum. Given the minor differences in the rotational phases according to the P20 and M19 models, we utilised the former to match the phases with the DI in the previous study. The TESS data were phased with the M19 ephemeris.

4. Light Curve Modelling

4.1. Calculation of Intensity Map

Based on the element distribution maps of silicon, iron, helium, and chromium revealed by DI [24], a grid of plane-parallel LTE models of stellar atmospheres was calculated with the LLmodels code [35], taking into account the individual chemical composition. In the latest version of the LLmodels code, continuum opacity calculations were performed using blocks of Kurucz’ ATLAS12 code [36,37]. The calculation of opacity in the LLmodels also takes into account the individual absorption in spectral lines. Up-to-date data on atomic transitions are retrieved from the VALD3 [38,39] database. The grid consists of 120 models covering all combinations of abundances in the ranges given in Table 3. The parameters of the atmosphere ( T eff = 12,800 K, log g = 4.0) and the abundances of other elements remained unchanged. The surface maps contain 3764 unequally distributed cells across 53 latitude zones, ranging from 108 cells at the equator to 5 cells at each pole. Spectral energy distributions were calculated simultaneously with the models. Using the response curve of photometric filters ( u v b y and TESS), we calculated the flux and radiation intensity of 1 cm2 of the stellar surface. The passbands of the Strömgren photometric system were adopted from [40] and for the TESS imaging receiver from [23].
The calculated intensities converted to the magnitude scale were organised into two separate grids. The first one was designed for the broadband photometry ( u v b y and TESS). The second one was generated across the spectrum spanning 1000–12,000 Å and convolved with an instrumental profile corresponding to the spectral resolution R = 1000 . The latter grid was used for analysis of monochromatic fluxes, in particular for ultraviolet IUE observations.
The logarithmic nature of the magnitude scale significantly reduces mesh gradients. For each surface stellar cell, in accordance with the abundances of Si, Fe, He, and Cr, the intensity was calculated using the grid interpolation method. This procedure generated maps of specific intensities I l , b for the photometric passbands and across the spectrum.

4.2. Synthetic Photometry Technique

The flux light curve was computed in matrix form:
F = G × I
where F is the matrix product, is the flux column matrix for each rotational phase ( F 1 , F 2 , ..., F N p h ) T of [ N p h   × 1] size (we use N p h = 36 phases), I is a 1D flattened intensity map of [ 1 × 3764 ] size created from map I l , b as a sequence of values, and G is the matrix of [3764 × 36] size accounting for cell visibility:
G = A · L
where G is the product of matrix elements, A = S cos ϑ is the [3764 × 36] matrix of apparent areas of each cell at an angle ϑ relative to the observer, S is the real areas of the cells of [3764 × 36] size with identical rows, and L is the [3764 × 36] matrix of the intensity damping due to the limb darkening effect. For cells on the invisible hemisphere of the star, A i j = 0 .
The limb darkening coefficients for a quadratic law
I μ = I 0 [ 1 a ( 1 μ ) b ( 1 μ ) 2 ]
were calculated from intensities I μ , λ of emergent radiation from stellar surface convolved with a specific passband T λ for seven values of μ =cos ϑ using the Levenberg–Marquardt method [41,42] to approximate the function
I μ I 0 = I μ , λ T λ d λ I 0 T λ d λ = 1 a ( 1 μ ) b ( 1 μ ) 2
The calculations were performed using a single stellar atmosphere model with mean Si, Fe, He, and Cr abundances. The effects of abundance variations (both over- and under-abundances) on the limb-darkening coefficients were found to be negligible, introducing deviations of less than 0.5%.
The vector of the relative synthetic magnitudes was calculated as
Δ m s y n = 2.5 l o g F / F ¯
where F ¯ = F / N p h is the average flux. These values will be compared with the observational data.

4.3. Contribution of Different Elements to Light Variability

To model the light curves, we considered four elements with inhomogeneous surface distributions that significantly contribute to observable variability. Silicon was pointed out by Strom and Strom [43] as a principal element affecting opacity and flux redistribution when it is overabundant relative to the Sun. Later, Khan and Shulyak [4] searched for other elements whose overabundance affects the structure of the stellar atmosphere. Besides Si, these are Cr and Fe, the main elements that change the temperature distribution by more than 3 percent. Ti, Mg, and Ni have much smaller effects. And a very small effect is produced by He, C, N, O, Ca, Sr, Eu, and Hg. These authors also selected three key elements (Si, Cr, Fe) that affect the position of stars on the diagram: peculiarity index a (designed to measure the strength of the 5200 Å depression with respect to normal stars) vs. colour b y . We checked the influence of elemental contribution to the Strömgren photometry for the stellar parameters of CU Vir. Using the LLmodels code [35], we computed stellar atmosphere models and spectral energy distributions with solar abundances as a reference. For each model, we increased the individual element abundances (from He to Zn) by 1 dex while holding others constant and then calculated corresponding u v b y magnitudes. Figure 2 presents the resulting magnitude differences relative to the reference. For CU Vir parameters, abundance changes of He, Fe, Si, and C produce the largest effect on the emergent flux. The effect is substantially smaller for Mg, Ca, N, and for the Fe-group, excluding iron itself.
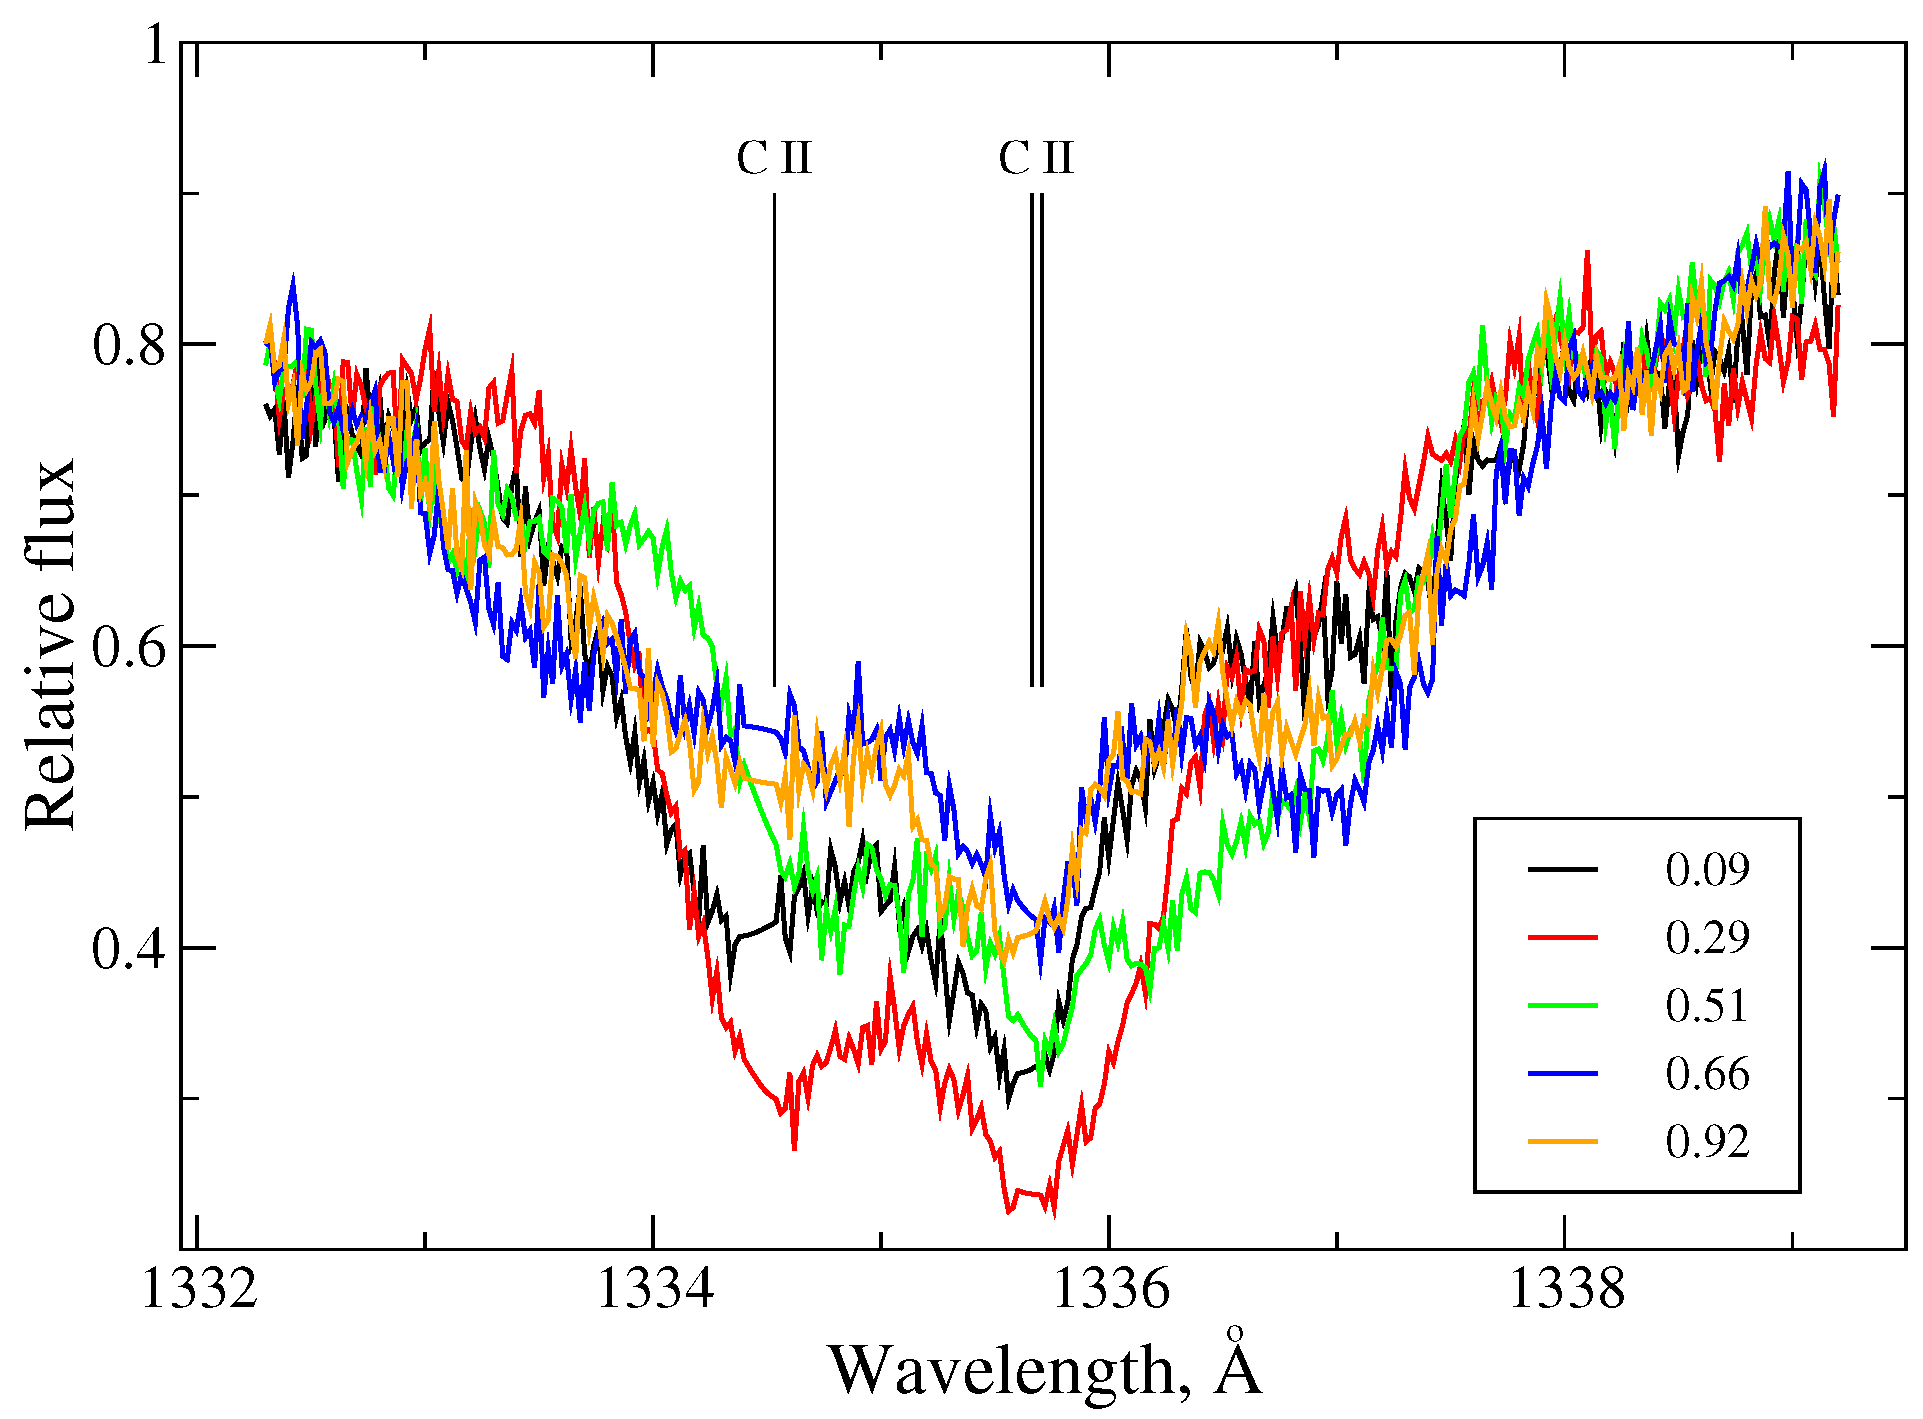
In the case of CU Vir, the inhomogeneous carbon distribution can affect the light curve across UV to IR significantly. Unfortunately, mapping of carbon surface distribution is not possible because of the lack of suitable lines in the optical wavelength range at CU Vir’s temperature. To estimate possible carbon abundance variations, we used Hubble Space Telescope (HST) spectral observations (STIS spectrograph, R = 110 , 000 ) of CU Vir obtained in five rotational phases in 2017 by Krtička et al. [22], program id 14737. Calibrated spectra were retrieved from the MAST portal. Figure 3 demonstrates behaviour of Cii ion lines λ 1334 Å in HST/STIS spectra. While the continuum level also varies, we normalised it using line-free regions to isolate the line profile variations. We estimated carbon abundances for minimal and maximal intensity of the lines ϵ (C) = [−4.50, ...−3.80]; i.e., carbon shows underabundance as in other Ap stars. Consequently, we expect negligible impact of carbon inhomogeneities to photometric variability, which does not exceed 0m.0004 by our estimations.
Using the Mg surface map, we also estimated the effect for this element as the difference between fluxes for maximal and minimal abundances. It is found to be 0m.0064, 0m.0035, 0m.0035, 0m.0030 for the u v b y bands, respectively.
To summarise, we expect that, apart from Si, Fe, He, and Cr, only the joint effect of the iron peak and lighter elements may have a slight impact on the light curve.

5. Results

5.1. Visual Light Curve

Successful modelling of flux variability caused by the inhomogeneous surface distribution of elements in Ap/Bp stars requires adequate reproduction of both the amplitude of the variability in a wide wavelength range and the shape of the light curves in individual photometric bands.
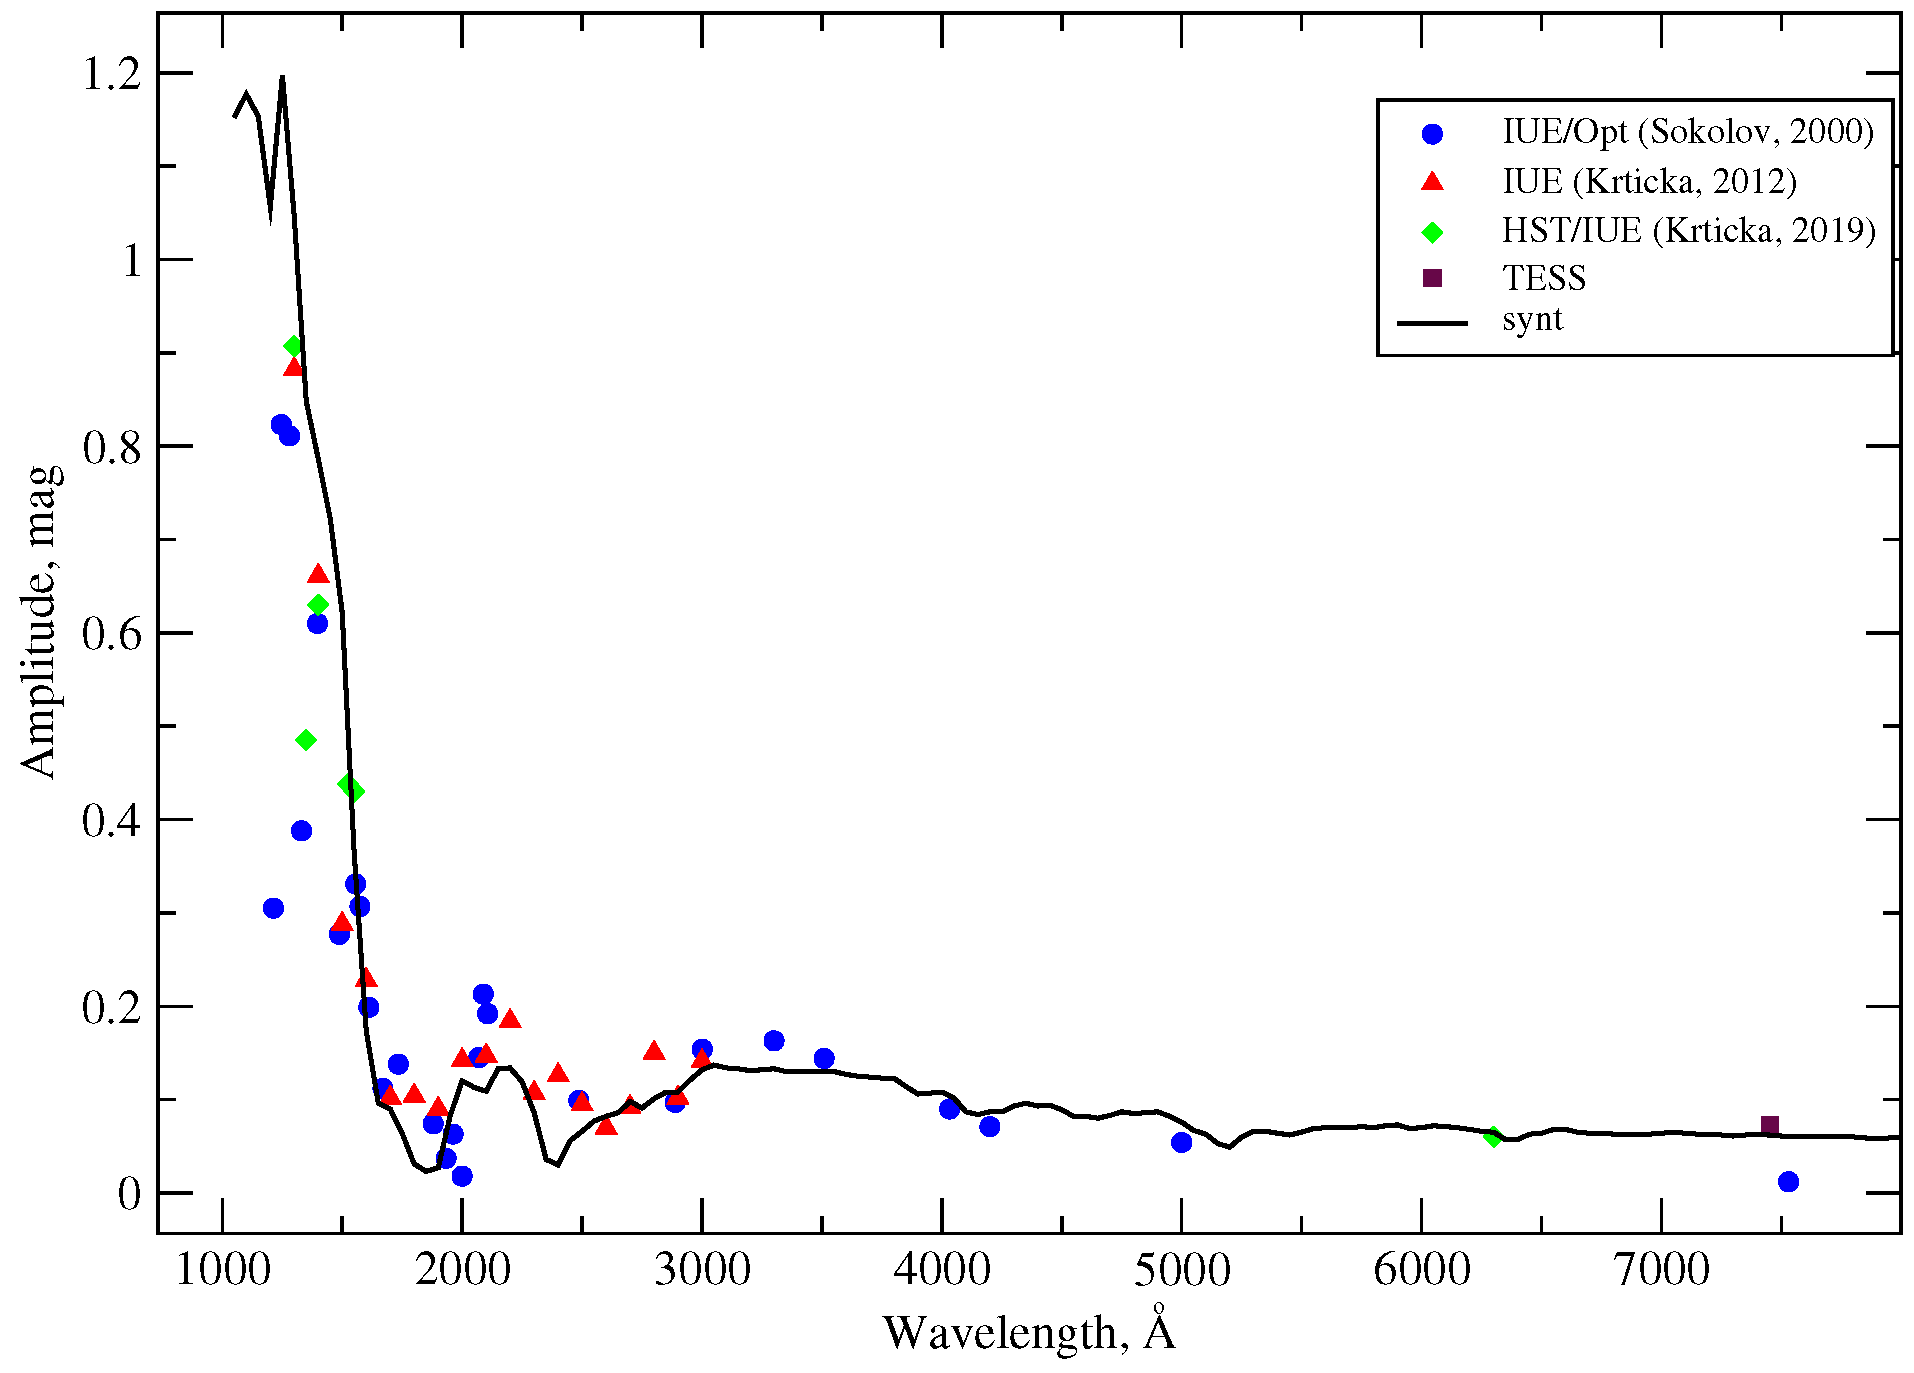
The amplitude of photometric variability for a given by the DI surface distribution of elements in CU Vir is plotted in Figure 4 against the wavelength. The smoothed theoretical curve reproduces the observations well, capturing all major features. The largest amplitude, up to ∼0.9m, is observed in the far-UV, then rapidly decreases to the first “null-point” at 1800 Å, where the photometric variability is practically eliminated. There is some wavelength shift between our model curve and observations; the latter display this point ∼200 Å longward. The second “null-point” at 2400 Å also exists but is predicted by the model at a shorter wavelength than observed. However, we note that there is also an ambiguity in the determination of these points between Krtička et al. [8] and Sokolov [25], who utilised the same IUE observations. The amplitude of photometric variations is reproduced quite well. From 3500 Å onward, the theoretical curve precisely follows the observations.
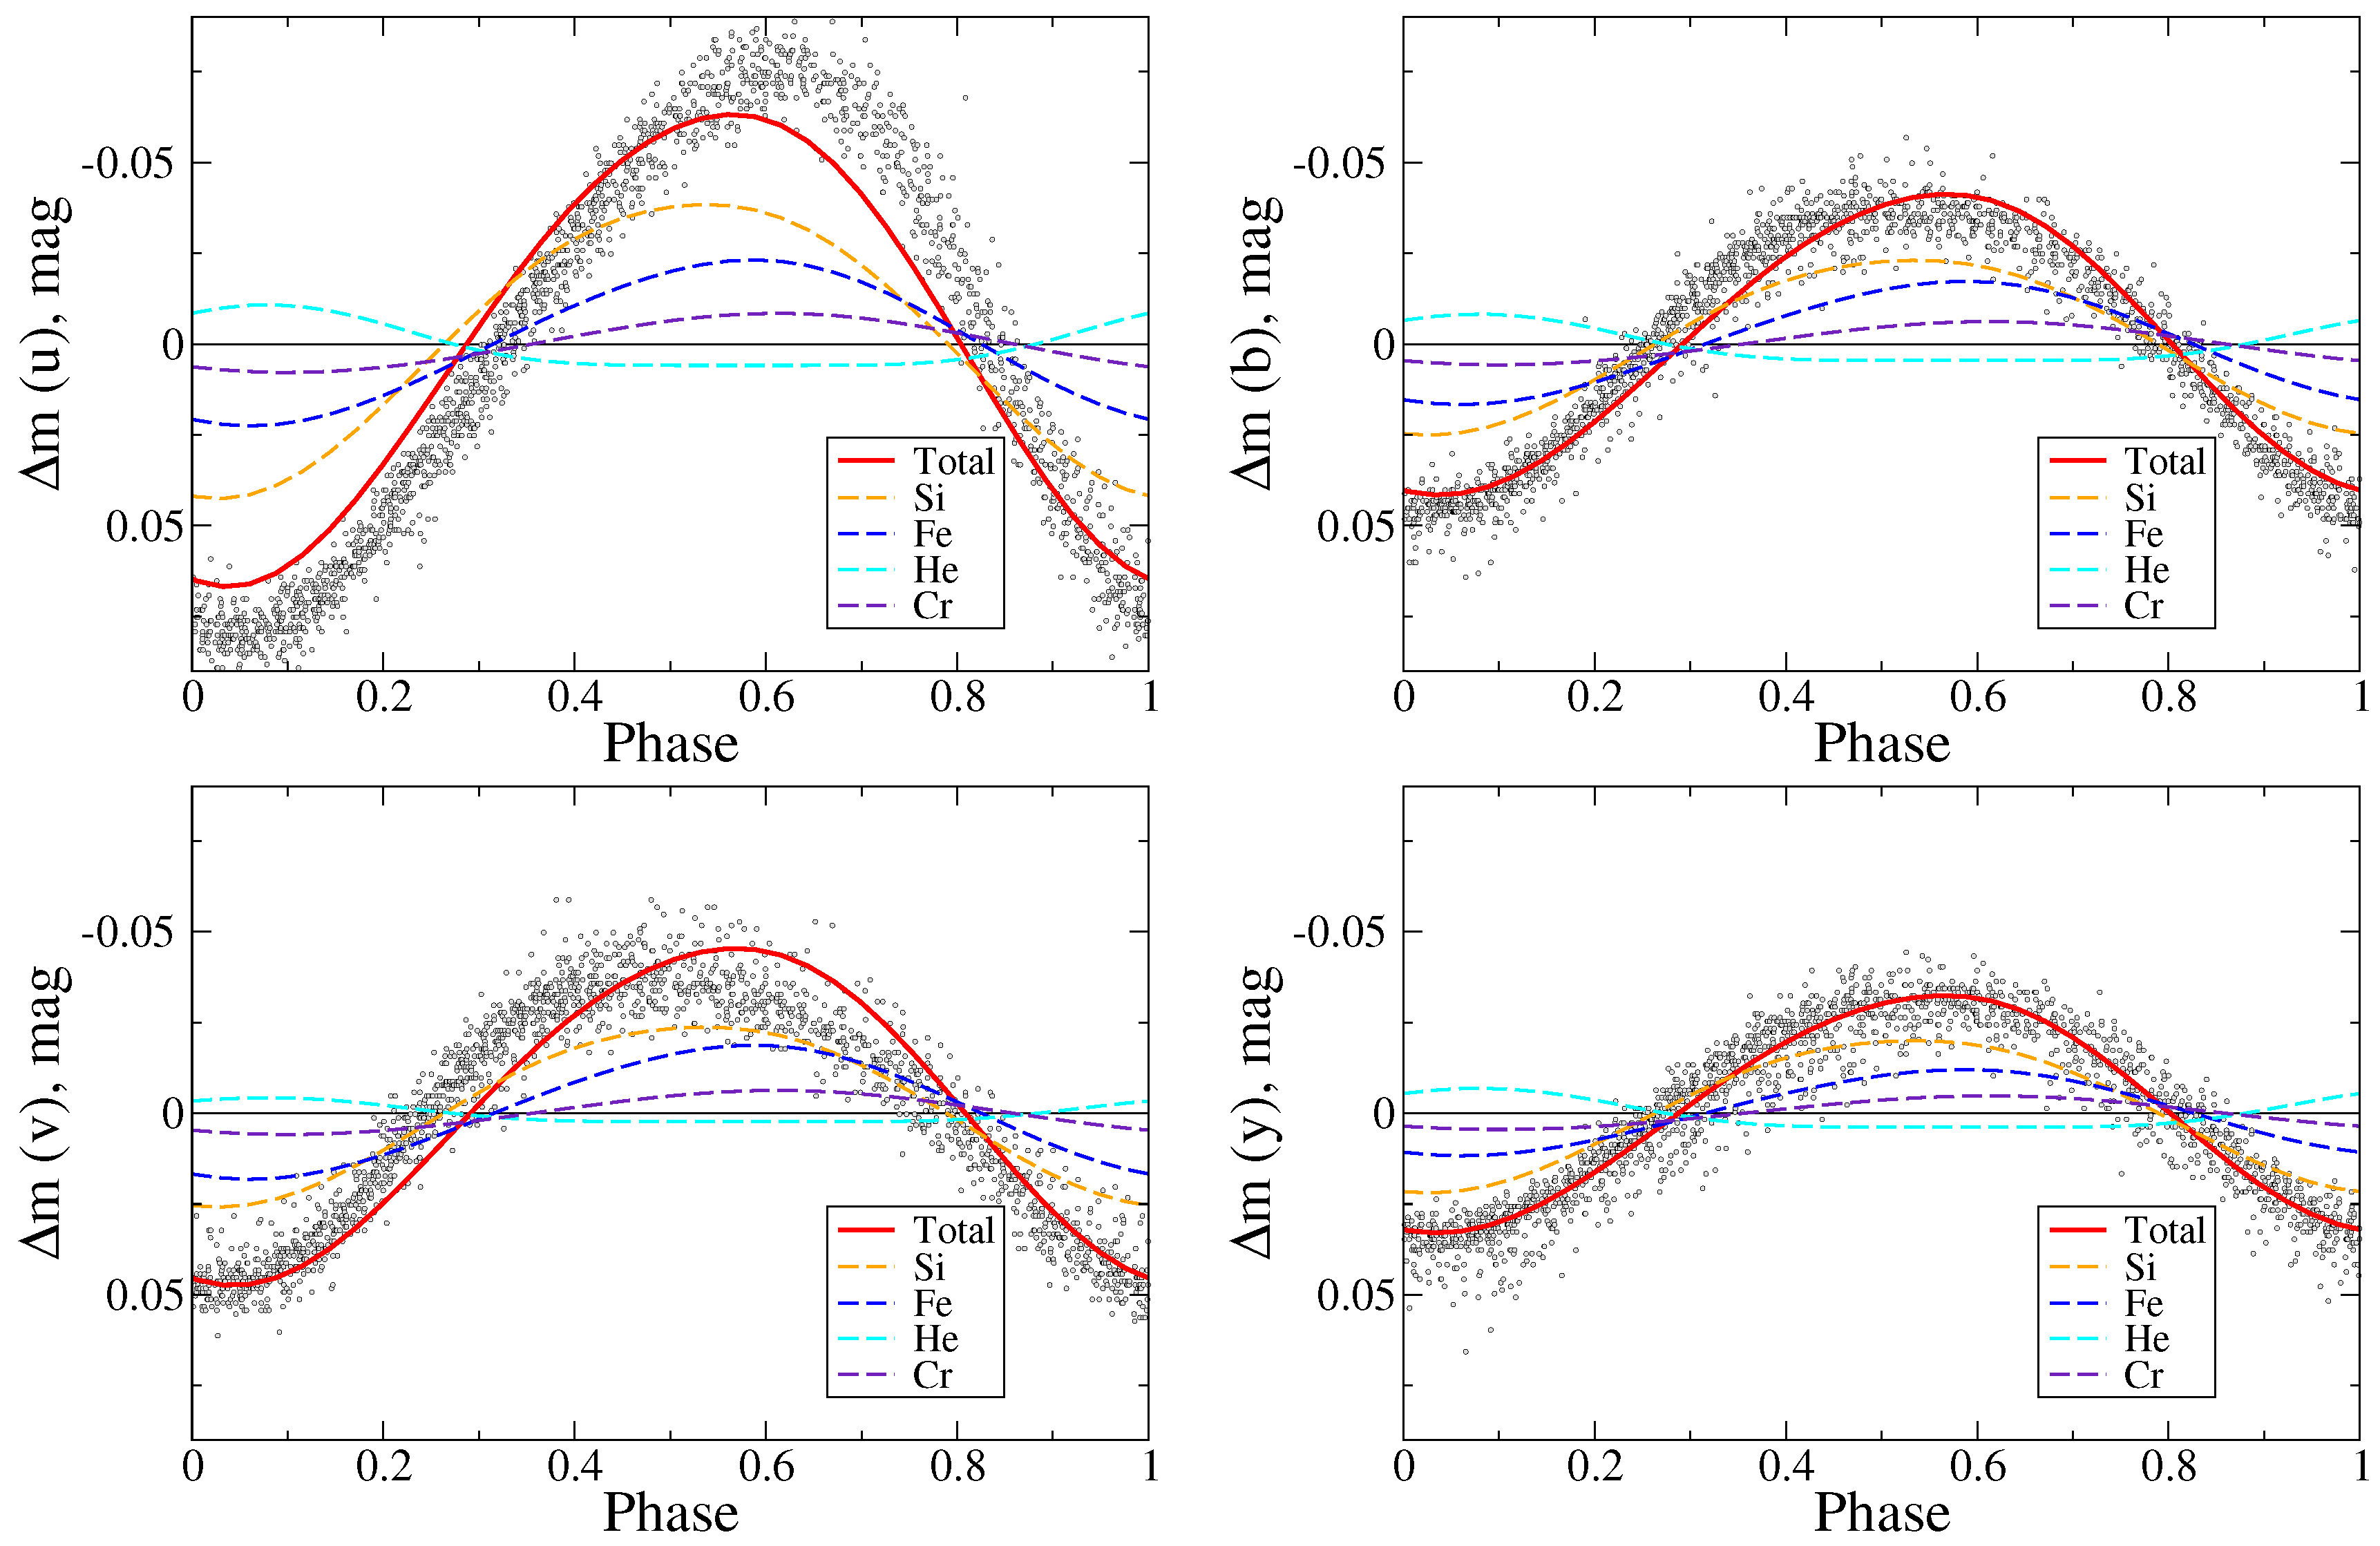
Figure 5 shows a comparison of the phased synthetic light curves in u b v y Strömgren bands and observations of Pyper et al. [15], while Figure 6 is the same for TESS data. One can see that synthetic light curves fit observations very well in all filters, with only modest discrepancy in 0.5–0.7 phase interval for u and v. While the former shows a deficiency of flux in the theoretical curve, the latter shows an excess of it. Possible reasons for this discrepancy will be explored in the discussion. In the TESS passband, the amplitude of the synthetic light curve is also somewhat depleted, but given the small range of variability, the discrepancy itself is also negligible.
Considering the individual contribution to flux variability, we note that the contribution of a large region depleted in Si, Fe and Cr defines the position of the primary light minimum at ϕ 0 . Helium, varying in antiphase, acts as a “counterweight” and regulates the flux depth of the minimum and has almost no effect on the maximum. The wider and more asymmetrical maximum is caused by the transit via line of sight of the region with Si, Fe and Cr overabundance in the ϕ 0.5–0.6 phase range. The small phase shift of the maximum of observed light curves in different filters is possibly caused by the different relative contributions of the considered elements.

5.2. UV Variations

The ultraviolet spectral range is the most difficult to model due to the high density of strong spectral lines, ionisation edges of multiple atoms and ions, and physical effects like the influence of stellar wind [22].
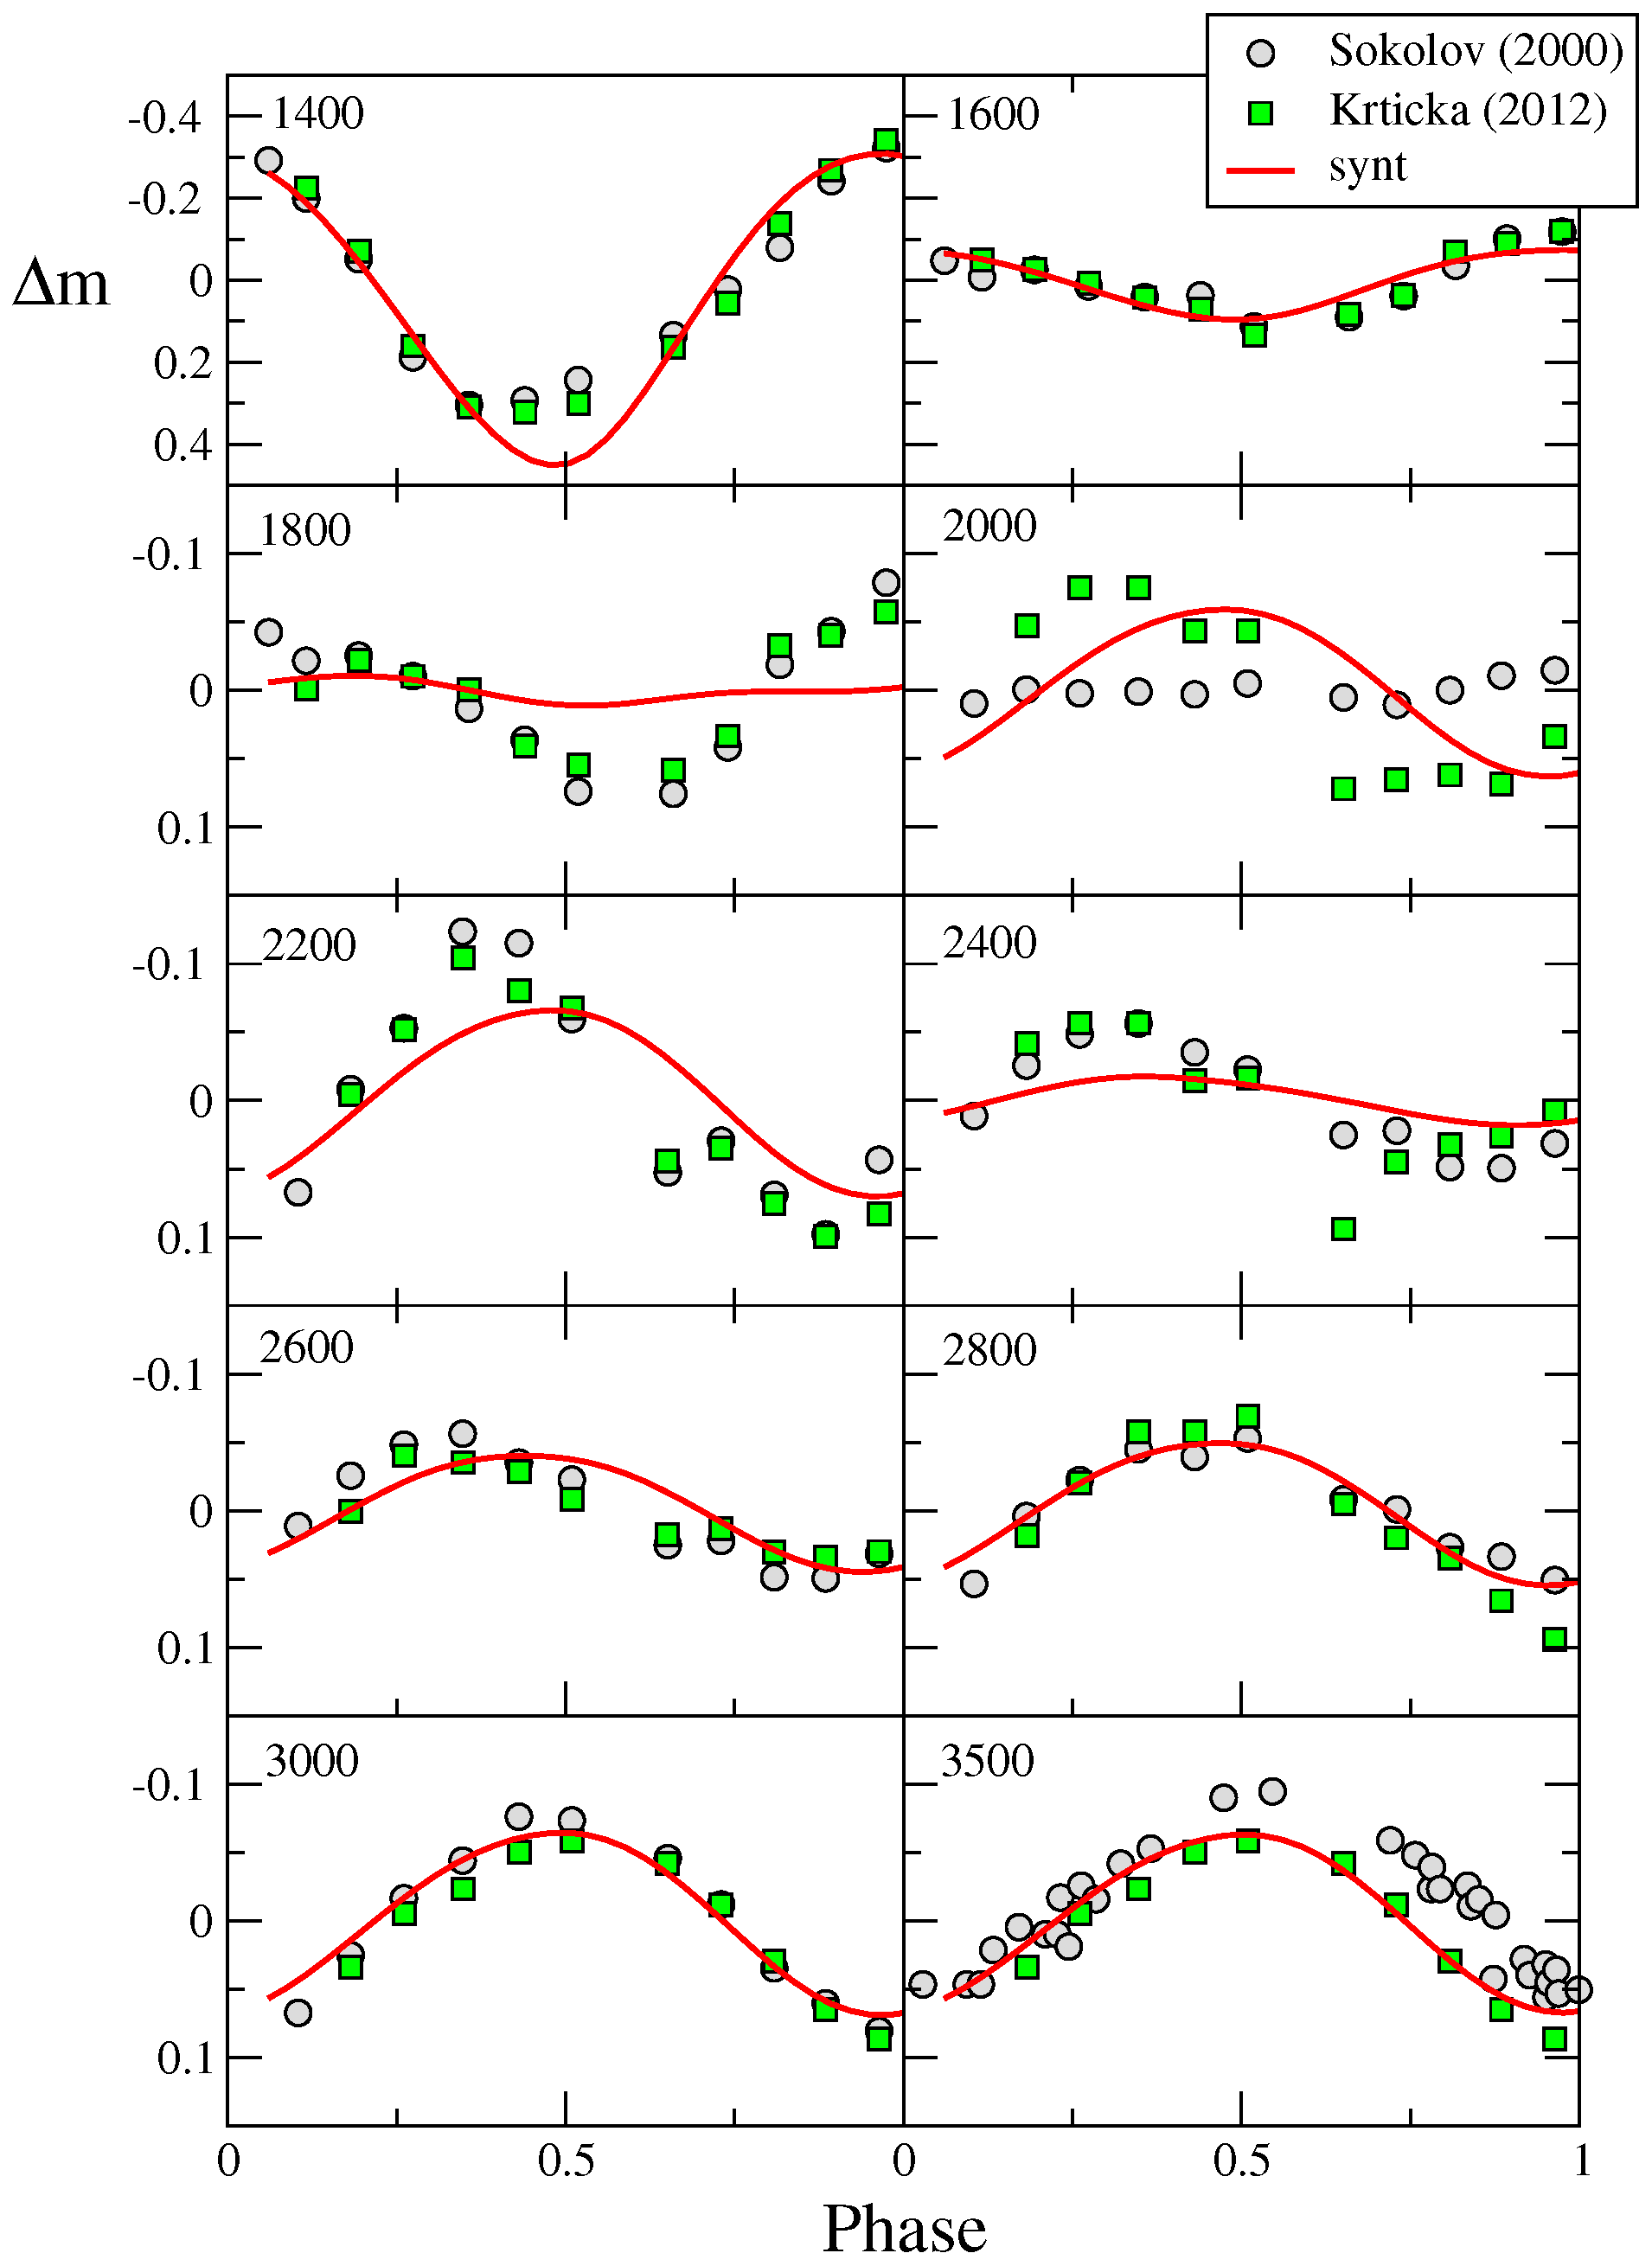
In Figure 7, we show the comparison of our synthetic light curves with UV observations (1400–3500 Å) extracted from IUE spectra by [8,25]. Overall, the calculations successfully reproduce both the shapes and amplitudes of the observed light curves. The characteristic inversion of the light curve in the range 1400–2000 Å, caused by silicon absorption shortward 1600 Å, is clearly visible. At 1800 Å and 2400 Å, synthetic light curves possess “null-points” with very small amplitude. Observations nevertheless show a large amplitude of variability. The reason for this could be the contribution of some elements that change only the monochromatic flux or flux in narrow bands. We do not know their distribution over the surface and do not take them into account in the calculations.
At 2000 Å there is a notable difference in amplitude between observational data (different processing of the same IUE set) by Sokolov [25] and Krtička et al. [8]. Our synthetic light curve fits well with the latter.

6. Discussion

Photometric variability of CU Vir is one of the most intriguing cases among Ap/Bp stars. Despite the regularity and simple shape of the light curve, the star exhibits variations in its photometric period. In order to determine the physical mechanism responsible for these period changes, an accurate theoretical model of light variations within a single rotational cycle is desirable. Previously, the photometric variability of CU Vir was successfully explained by inhomogeneous surface distribution of a few elements and related effects of flux redistribution [5,8,22]. These simulations, based on horizontally inhomogeneous element distribution recovered by the DI technique, reproduce well the main observational features: the amplitude of the photometric variations, and, although less accurately, the shape of the light curves in different filters. However, the question about the reasons for the discrepancies remained open. Krtička et al. [8] suggested and discussed in detail several possible reasons such as limitations of abundance maps, influence of additional elements, vertical abundance stratification, surface temperature variations, the turbulent velocity, the effects of fast rotation, the magnetic field, the convection zone in helium-rich models, and the NLTE effects.
Employing the updated DI data [24] based on high-resolution NARVAL spectra, we revised the CU Vir light curve modelling. Our maps are in general agreement with those by Kuschnig et al. [19], which were used in previous light curve simulations. However, there are also modest differences in the spot geometry and abundance scales due to the different stellar rotation parameters we adopted (following [20]) and the higher spatial resolution of our maps, up to ∼ 3 ° in latitude. The employment in our modelling of the atmospheric models grid with line-by-line opacity treatment (LL-models) based on up-to-date atomic line parameters from the VALD3 database [39] represents an important step forward.
Comparison with observations shows that we succeeded in the representation of the main features of the photometric variability of CU Vir over a range of wavelengths from the far-UV to red optical wavelengths. The synthetic light curves reproduce quite well the amplitude and shape of the light curves. The fit to the observations turns out to be generally better than in previous modelling [8]. The main discrepancies remaining between theory and observation are in the amplitude of “null-points” in UV, and amplitude in Strömgren u and v filters.
Discussing the reasons for deviations in the shape of the theoretical light curve from the observed one, Krtička et al. [8] noted the problem of “missing opacity” due to some element not accounted for in DI. We have estimated the possible contribution of several elements to the emergent flux for the atmospheric parameters of CU Vir. In addition to the elements He, Si, Mg, Cr, and Fe discussed above, the potential effect on photometric variability can be provided by the inhomogeneous surface distribution of light elements C and Ca and iron-peak elements Ti, Mn, Co, and Ni, which may produce significant but much more localised spectral features that manifested in monochromatic UV measurements. The DI of these elements is very difficult due to the lack of strong lines in the spectrum and severe line blending due to the rapid axial rotation of CU Vir. Thus, we can only hypothesise their contribution to the UV variability.
Another possibility is the effects of vertical abundance stratification. However, the rapid rotation of the star and corresponding severe line blending do not allow the direct investigation of the vertical elemental stratification in the atmosphere of CU Vir by existing methods. We were previously able to estimate the effect of vertical stratification on the photometric variability of the more slowly rotating star MX TrA [9], which is ∼1000 K cooler than CU Vir using the stratification profile of the slowly rotating Ap star BD+00°1659 as a benchmark [44]. It can be seen from Figure 5 in [9] that in the region of the Balmer discontinuity (u filter), the stratification leads to an increase in the emergent flux, while in the v band, the effect is reversed. Thus, the impact of vertical stratification of silicon suspected for CU Vir [20,24] qualitatively allows one to reconcile the amplitudes of theoretical light curves and observations in u, v filters.
When modelling the (spectro-) photometric observations obtained at different epochs from 1979 to 2022, we faced the change in the photometric period of CU Vir, which should be taken into account when constructing the phase curves. We performed a comparison of two models for period variations: a discrete model of the period change [14,16] and the model of the oscillating period [17,18]. Without attempting a comprehensive analysis, we utilised only publicly available photometric data from 1955 to 2022 and determined period values in individual seasons. One may say that within the errors, data up to ∼2012 are fitted by both models with similar accuracy. However, photometric observations after 2012 show a gradual decrease in the period, in better agreement with the model by Mikulášek et al. [18], which implies the continuous period variations in CU Vir. The next 5–10 years, are particularly intriguing as the period should reach its minimum in ∼2035 if the period oscillations are real. Further regular photometric and spectroscopic monitoring of CU Vir is highly desirable. As it was shown in our related paper [24], the structure of the chemical spots in CU Vir remains stable on a timescale of ∼26 year, while changes in the period are already apparent. Most probably, the changes in the period of CU Vir appear are caused by MHD effects: Alfven waves [45,46] or Tayler instability [24,47]. Accurate observational monitoring of future period changes in CU Vir are essential for understanding the mechanism.

7. Conclusions

We have made a new attempt to model the light curve of the Ap star CU Vir, whose variability is modulated with the axial rotation period P 0.52907 d and is caused by the inhomogeneous surface distribution of chemical elements. Employing updated Doppler images, advanced LL-models of stellar atmospheres and up-to-date atomic data to properly account for opacity, we succeeded in reproducing the observed amplitude of variability and light curve shape over a wide wavelength range: from far-UV to NIR. Nevertheless, there remain some minor discrepancies between theory and observations in both the ultraviolet and u and v bands. Most likely, these discrepancies are caused by the effects of vertical elemental stratification in the CU Vir atmosphere. We also cannot exclude the “missed opacity” due to some elements not accounted for in our Doppler Imaging, as well as still incomplete knowledge of the structure of atomic transitions in the ultraviolet region. This motivates further theoretical and experimental research on atomic data and their applications in astrophysics for a more realistic modelling of spectroscopic and photometric data.
We also assessed the changes in the photometric period of CU Vir over the long baseline from 1955 to 2022 and compared them with models existing in the literature. Data from recent decades favour a gradual decrease in the period (acceleration of the apparent stellar rotation) in agreement with models [17,18]. However, firm evidence for the periodic character of the changes can be provided by observations in the next decade, when a period minimum will be reached. We encourage observers to continue monitoring CU Vir.

Author Contributions

Conceptualisation, Y.P. and T.R.; methodology, Y.P. and T.R.; software, Y.P.; formal analysis, Y.P. and I.P.; investigation, Y.P., I.P. and T.R.; resources, T.R. and Y.P.; data curation, Y.P.; writing—original draft preparation, Y.P.; writing—review and editing, Y.P., I.P. and T.R.; visualisation, Y.P.; supervision, I.P.; project administration, I.P. and T.R. All authors have read and agreed to the published version of the manuscript.

Funding

This research was funded by the grant of the Russian Science Foundation No. 24-22-00237, https://rscf.ru/en/project/24-22-00237/.

Data Availability Statement

The research is based on open data from the literature and the publicly available archives and databases. The software utilised is available upon reasonable request to the authors.

Acknowledgments

We are grateful to S. Savchenko for discussion on the model estimation methods and calling our attention to the Bayesian information criterion. We are very grateful to the reviewers for their valuable comments, which helped us improve the article.

Conflicts of Interest

The authors declare no conflicts of interest.

Abbreviations

The following abbreviations are used in this manuscript:
DIDoppler Imaging
LTELocal Thermodynamic Equilibrum
IUEInternational Ultraviolet Explorer
HSTHubble Space Telescope
TESSTransiting Exoplanet Survey Satellite
MASTMikulski Archive for Space Telescopes
SMEISolar Mass Ejection Imager
FCATPFour College Automated Photometric Telescope
UVUltraviolet
IRInfrared
NIRNear infrared
BICBayesian information criterion
RMSRoot mean square
MHDMagnetohydrodynamics

Appendix A. Bayesian Information Criterion

We define the Bayesian information criterion (BIC) introduced by Schwarz [34] via the following equation:
B I C = k · ln ( n ) 2 l ,
where k is the number of model parameters, n is the size of the sample, and l is the logarithmic likelihood function. For the calculation of the value of l, let us assume that we have n points (period determinations) with a standard deviation of each measurement σ i . The model passes through the i-th point with deviation δ i = Y o b s Y m o d . Assuming a Gaussian distribution of the probability of deviation of the observed point from the model prediction, then
f i ( Y ) = 1 σ i · 2 π · e 1 2 ( δ i σ i ) 2
The logarithmic likelihood function will be the product of the probabilities at each point:
l = ln i = 1 n 1 σ i · 2 π · e 1 2 ( δ i σ i ) 2 = i = 1 n ln 1 σ i · 2 π · e 1 2 ( δ i σ i ) 2
Taking the logarithm under the sum, we finally obtain
l = 1 2 n ln 2 π + 2 i = 1 n ln σ i + i = 1 n ( δ i σ i ) 2

References

  1. Stibbs, D.W.N. A study of the spectrum and magnetic variable star HD 125248. Mon. Not. R. Astron. Soc. 1950, 110, 395. [Google Scholar] [CrossRef]
  2. Michaud, G. Diffusion Processes in Peculiar a Stars. Astrophys. J. 1970, 160, 641. [Google Scholar] [CrossRef]
  3. Michaud, G.; Alecian, G.; Richer, J. Atomic Diffusion in Stars; Springer: Berlin/Heidelberg, Germany, 2015. [Google Scholar] [CrossRef]
  4. Khan, S.A.; Shulyak, D.V. Theoretical analysis of the atmospheres of CP stars. Effects of the individual abundance patterns. Astron. Astrophys. 2007, 469, 1083–1100. [Google Scholar] [CrossRef]
  5. Krivoseina, A.A.; Ryabchikova, T.A.; Khokhlova, V.L. Distribution of SI on the Surface of the Silicon Ap-Star Cu-Virginis and Interpretation of the Lightcurves in the Vby Bands. Nauchnye Informatsii 1980, 43, 70. [Google Scholar]
  6. Krtička, J.; Mikulášek, Z.; Zverko, J.; Žižńovský, J. The light variability of the helium strong star HD 37776 as a result of its inhomogeneous elemental surface distribution. Astron. Astrophys. 2007, 470, 1089–1098. [Google Scholar] [CrossRef]
  7. Shulyak, D.; Krtička, J.; Mikulášek, Z.; Kochukhov, O.; Lüftinger, T. Modelling the light variability of the Ap star ε Ursae Majoris. Astron. Astrophys. 2010, 524, A66. [Google Scholar] [CrossRef]
  8. Krtička, J.; Mikulášek, Z.; Lüftinger, T.; Shulyak, D.; Zverko, J.; Žižňovský, J.; Sokolov, N.A. Modelling of the ultraviolet and visual SED variability in the hot magnetic Ap star CU Virginis. Astron. Astrophys. 2012, 537, A14. [Google Scholar] [CrossRef]
  9. Pakhomov, Y.; Potravnov, I.; Romanovskaya, A.; Ryabchikova, T. Modeling the TESS Light Curve of Ap Si Star MX TrA. Universe 2024, 10, 341. [Google Scholar] [CrossRef]
  10. Prvák, M.; Krtička, J.; Korhonen, H. The nature of the photometric variability of HgMn stars: A test of simulated light curves of φ Phe against the TESS data. Mon. Not. R. Astron. Soc. 2020, 492, 1834–1840. [Google Scholar] [CrossRef]
  11. Pyper, D.M.; Adelman, S.J. Light Curve Changes and Possible Precession in mCP Stars. Publ. Astron. Soc. Pacific 2021, 133, 084203. [Google Scholar] [CrossRef]
  12. Deutsch, A.J. A New Spectrum Variable of Short Period, HD 124224. Astrophys. J. 1952, 116, 536. [Google Scholar] [CrossRef]
  13. Hardie, R. Light-Variation of the Spectrum Variable HD 124224. Astrophys. J. 1958, 127, 620. [Google Scholar] [CrossRef]
  14. Pyper, D.M.; Ryabchikova, T.; Malanushenko, V.; Kuschnig, R.; Plachinda, S.; Savanov, I. An abrupt decrease in the rotational period of the chemically peculiar magnetic star CU Virginis. Astron. Astrophys. 1998, 339, 822–830. [Google Scholar]
  15. Pyper, D.M.; Stevens, I.R.; Adelman, S.J. An update on the rotational period of the magnetic chemically peculiar star CU Virginis. Mon. Not. R. Astron. Soc. 2013, 431, 2106–2110. [Google Scholar] [CrossRef]
  16. Pyper, D.M.; Adelman, S.J. Newly Discovered Period Changes in Two mCP Stars and Updates for Previously Published Stars. Publ. Astron. Soc. Pacific 2020, 132, 024201. [Google Scholar] [CrossRef]
  17. Mikulášek, Z.; Krtička, J.; Henry, G.W.; Janík, J.; Zverko, J.; Žižňovský, J.; Zejda, M.; Liška, J.; Zvěřina, P.; Kudrjavtsev, D.O.; et al. Surprising variations in the rotation of the chemically peculiar stars CU Virginis and V901 Orionis. Astron. Astrophys. 2011, 534, L5. [Google Scholar] [CrossRef]
  18. Mikulášek, Z.; Krtička, J.; Henry, G.W.; Janík, J.; Pigulski, A. Towards Comprehension of the Variability of the mCP Star CU Virginis. In Proceedings of the Physics of Magnetic Stars, Nizhny Arkhyz, Russia, 1–5 October 2018; Volume 518, p. 125. [Google Scholar] [CrossRef]
  19. Kuschnig, R.; Ryabchikova, T.A.; Piskunov, N.E.; Weiss, W.W.; Gelbmann, M.J. Multi element Doppler imaging of AP stars. I. He, Mg, Si, CR and Fe surface distribution for CU Virginis. Astron. Astrophys. 1999, 348, 924–932. [Google Scholar]
  20. Kochukhov, O.; Lüftinger, T.; Neiner, C.; Alecian, E.; MiMeS Collaboration. Magnetic field topology of the unique chemically peculiar star CU Virginis. Astron. Astrophys. 2014, 565, A83. [Google Scholar] [CrossRef]
  21. Aurière, M. Stellar Polarimetry with NARVAL. In Setting a New Standard in the Analysis of Binary Stars; European Astronomical Society Publications Series; Arnaud, J., Meunier, N., Eds.; Cambridge University Press: Cambridge, UK, 2003; Volume 9, p. 105. [Google Scholar]
  22. Krtička, J.; Mikulášek, Z.; Henry, G.W.; Janík, J.; Kochukhov, O.; Pigulski, A.; Leto, P.; Trigilio, C.; Krtičková, I.; Lüftinger, T.; et al. HST/STIS analysis of the first main sequence pulsar CU Virginis. Astron. Astrophys. 2019, 625, A34. [Google Scholar] [CrossRef]
  23. Ricker, G.R.; Winn, J.N.; Vanderspek, R.; Latham, D.W.; Bakos, G.Á.; Bean, J.L.; Berta-Thompson, Z.K.; Brown, T.M.; Buchhave, L.; Butler, N.R.; et al. Transiting Exoplanet Survey Satellite (TESS). J. Astron. Telesc. Instruments Syst. 2015, 1, 014003. [Google Scholar] [CrossRef]
  24. Potravnov, I.; Ryabchikova, T.; Kitchatinov, L.; Pakhomov, Y. Long-term stability of chemical spots and reasons for the period variations in Ap star CU Vir. Galaxies 2025, 13, 90. [Google Scholar] [CrossRef]
  25. Sokolov, N.A. Spectrophotometric behavior of CU Virginis. Astron. Astrophys. 2000, 353, 707–714. [Google Scholar]
  26. Kuschnig, R.; Ryabchikova, T.; Piskunov, N.E.; Weiss, W.W. Ap-star mapping: He, Mg, Si, and Fe surface distributions on the CP2 star CU Virginis. In Proceedings of the IAU Symposium, Vienna, Austria, 9–13 October 1995; Volume 176, p. 135. [Google Scholar]
  27. Pyper, D.M.; Adelman, S.J. Spectrophotometry of peculiar B and A stars. XVII. 63 Andromedae, HD 34452, epsilon Ursae Majoris, CQ Ursae Majoris, CU Virginis, CS Virginis and beta Coronae Borealis. Astron. Astrophys Suppl. Ser. 1985, 59, 369–397. [Google Scholar]
  28. Adelman, S.J.; Dukes, R.J., Jr.; Pyper, D.M. Photometry of eight Magnetic Peculiar A Stars. Astron. J. 1992, 104, 314. [Google Scholar] [CrossRef]
  29. Hoeg, E.; Bässgen, G.; Bastian, U.; Egret, D.; Fabricius, C.; Großmann, V.; Halbwachs, J.L.; Makarov, V.V.; Perryman, M.A.C.; Schwekendiek, P.; et al. The TYCHO Catalogue. Astron. Astrophys. 1997, 323, L57–L60. [Google Scholar]
  30. Zechmeister, M.; Kürster, M. The generalised Lomb-Scargle periodogram. A new formalism for the floating-mean and Keplerian periodograms. Astron. Astrophys. 2009, 496, 577–584. [Google Scholar] [CrossRef]
  31. Abuladze, O.P. Photoelectric observations of spectral binary variable star CU Vir. Abastumanskaia Astrofiz. Obs. Byulleten 1968, 36, 43–50. [Google Scholar]
  32. Hardie, R.H.; Lieberman, L.; Reichmann, E. On the Period of HD 124224. Publ. Astron. Soc. Pacific 1967, 79, 74. [Google Scholar] [CrossRef]
  33. Blanco, C.; Catalano, F.A. Photoelectric observations of magnetic stars. III. HD 124224, HD 140160, and HD 224801. Astron. J. 1971, 76, 630–633. [Google Scholar] [CrossRef]
  34. Schwarz, G. Estimating the Dimension of a Model. Ann. Stat. 1978, 6, 461–464. [Google Scholar] [CrossRef]
  35. Shulyak, D.; Tsymbal, V.; Ryabchikova, T.; Stütz, C.; Weiss, W.W. Line-by-line opacity stellar model atmospheres. Astron. Astrophys. 2004, 428, 993–1000. [Google Scholar] [CrossRef]
  36. Kurucz, R.L. ATLAS12, SYNTHE, ATLAS9, WIDTH9, et cetera. Mem. Della Soc. Astron. Ital. Suppl. 2005, 8, 14. [Google Scholar]
  37. Kurucz, R.L. ATLAS12: Opacity Sampling Model Atmosphere Program; Record ascl:1303.024; Astrophysics Source Code Library: College Park, MD, USA, 2013. [Google Scholar]
  38. Piskunov, N.E.; Kupka, F.; Ryabchikova, T.A.; Weiss, W.W.; Jeffery, C.S. VALD: The Vienna Atomic Line Data Base. Astron. Astrophys Suppl. Ser. 1995, 112, 525. [Google Scholar]
  39. Ryabchikova, T.; Piskunov, N.; Kurucz, R.L.; Stempels, H.C.; Heiter, U.; Pakhomov, Y.; Barklem, P.S. A major upgrade of the VALD database. Physica Scripta 2015, 90, 054005. [Google Scholar] [CrossRef]
  40. Crawford, D.L.; Barnes, J.V. Standard stars for uvby photometry. Astron. J. 1970, 75, 978–998. [Google Scholar] [CrossRef]
  41. Levenberg, K. A method for the solution of certain non-linear problems in least squares. Q. Appl. Math. 1944, 2, 164–168. [Google Scholar] [CrossRef]
  42. Marquardt, D.W. An Algorithm for Least-Squares Estimation of Nonlinear Parameters. J. Soc. Ind. Appl. Math. 1963, 11, 431–441. [Google Scholar] [CrossRef]
  43. Strom, S.E.; Strom, K.M. Effect of Silicon Opacity on b- and A-Star Atmospheres. Astrophys. J. 1969, 155, 17. [Google Scholar] [CrossRef]
  44. Romanovskaya, A.; Ryabchikova, T.; Pakhomov, Y.; Potravnov, I.; Sitnova, T. Abundance and stratification analysis of slowly-rotating Si-star BD+00°1659 as a benchmark for ApSi-stars studies. Galaxies, 2024; in preparation. [Google Scholar]
  45. Krtička, J.; Mikulášek, Z.; Henry, G.W.; Kurfürst, P.; Karlický, M. Torsional oscillations and observed rotational period variations in early-type stars. Mon. Not. R. Astron. Soc. 2017, 464, 933–939. [Google Scholar] [CrossRef]
  46. Takahashi, K.; Langer, N. Standing torsional Alfvén waves as the source of the rotational period variation in magnetic early-type stars. Astron. Astrophys. 2025, 696, A129. [Google Scholar] [CrossRef]
  47. Potravnov, I.S.; Kitchatinov, L.L. Tayler instability as possible reason for the period changes in Ap star 56 Ari. arXiv 2025, arXiv:2504.08447. [Google Scholar] [CrossRef]
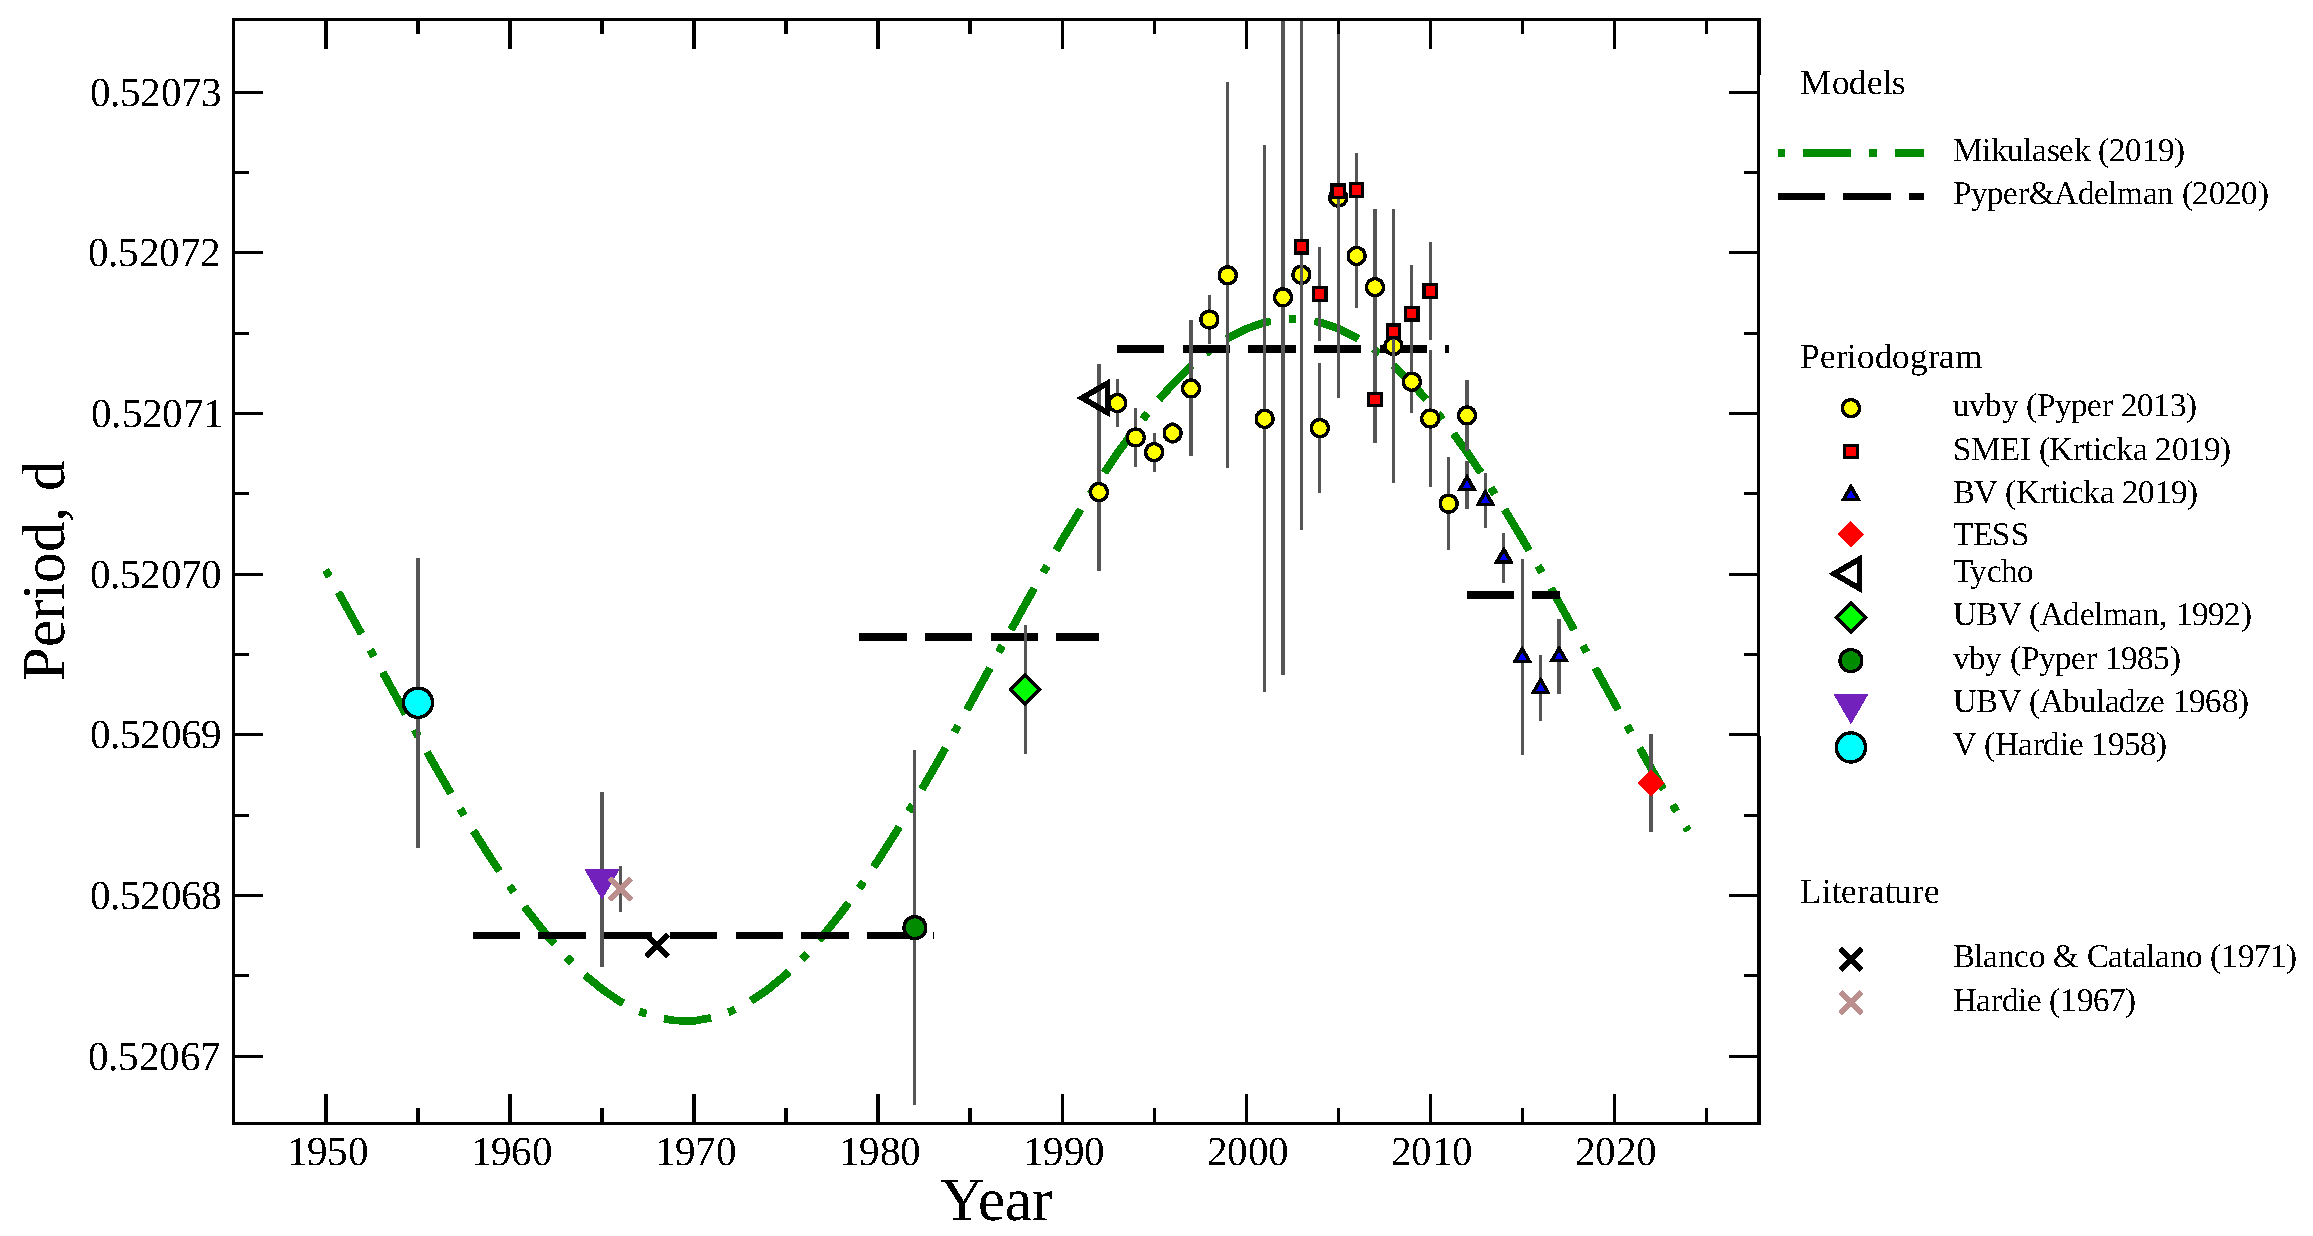
Figure 1. Period variations in CU Vir. The observational data and their references are described in the legend. Points with error bars correspond to our period determinations using the Lomb–Scargle method. The period values according to the Pyper and Adelman [16] model are marked by dashed lines, and the dashed–dotted line shows the Mikulášek et al. [18] cosine model.
Galaxies 13 00097 g001
Figure 2. Contribution of different elements to photometric variability for the Strömgren photometric system.
Galaxies 13 00097 g002
Figure 3. Variations of C ii lines in the HST/STIS spectra of CU Vir. The phases are indicated in the legend. The interstellar lines were removed.
Galaxies 13 00097 g003
Figure 4. Amplitude of variability of CU Vir from FUV to NIR.
Galaxies 13 00097 g004
Figure 5. Comparison of the observed (black points) and synthetic (see in legend) light curves of CU Vir in different Strömgren bands.
Galaxies 13 00097 g005
Figure 6. Comparison of the observed (black line) and synthetic (see in legend) light curves of CU Vir for TESS measurements.
Galaxies 13 00097 g006
Figure 7. Comparison of the observed IUE spectrophotometry of CU Vir in UV with synthetic light curves. The corresponding wavelengths are given in the upper left corner.
Galaxies 13 00097 g007
Table 2. Parameters of RMS and BIC for the approximation of CU Vir period changes in specified time intervals by the Pyper and Adelman [16] and Mikulášek et al. [18] models.
PeriodP20M19
RMSBICRMSBIC
1955–19836.62×10−6−309.88.45×10−6−291.6
1983–1992 1.46×10⁻⁵−56.11.28×10−5−52.5
1992–20125.73×10−6−1780.44.33×10−6−1809.8
2012–20225.34×10−6−231.12.82×10−6−235.5
∗ The values for this period are based on a very limited number of observations.
Table 3. Elemental abundance ranges covered by the grid of models.
Element[X/H]
Si−6.5 −5.3 −4.1 −2.9 −1.7
Fe−5.5 −4.5 −3.5 −2.5
He−3.4 −1.8 −0.2
Cr−6.4 −4.4
Disclaimer/Publisher’s Note: The statements, opinions and data contained in all publications are solely those of the individual author(s) and contributor(s) and not of MDPI and/or the editor(s). MDPI and/or the editor(s) disclaim responsibility for any injury to people or property resulting from any ideas, methods, instructions or products referred to in the content.