Article

Contributions of AGN to the Morphological Parameters of Their Host Galaxies up to Intermediate Redshifts of z ∼ 2

by
Tilahun Getachew-Woreta
1,2,3,*,
Mirjana Pović
1,4,5,
Jaime Perea
4,
Isabel Marquez
4,
Josefa Masegosa
4,
Antoine Mahoro
6,7 and
Shimeles Terefe Mengistue
1,2,8
1
Astronomy and Astrophysics Department, Entoto Observatory and Research Center (EORC), Space Science and Geospatial Institute (SSGI), Addis Ababa P.O. Box 33679, Ethiopia
2
Department of Physics, Addis Ababa University (AAU), Addis Ababa P.O. Box 1176, Ethiopia
3
Physics Department, Bule Hora University (BHU), Bule Hora P.O. Box 144, Ethiopia
4
Instituto de Astrofísica de Andalucía (IAA-CSIC), 18008 Granada, Spain
5
Physics Department, Faculty of Science, Mbarara University of Science and Technology (MUST), Mbarara P.O. Box 1410, Uganda
6
South African Astronomical Observatory (SAAO), P.O. Box 9, Observatory, Cape Town 7925, South Africa
7
Southern African Large Telescope (SALT), P.O. Box 9, Observatory, Cape Town 7935, South Africa
8
Physics Department, College of Natural Sciences, Jimma University, Jimma P.O. Box 378, Ethiopia
*
Author to whom correspondence should be addressed.
Galaxies 2025, 13(4), 84; https://doi.org/10.3390/galaxies13040084 (registering DOI)
Submission received: 28 May 2025 / Revised: 22 July 2025 / Accepted: 24 July 2025 / Published: 1 August 2025

Abstract

The presence of Active Galaxy Nuclei (AGN) can affect the morphological classification of galaxies. This work aims to determine how the contribution of AGN affects the most-used morphological parameters down to the redshift of z ∼ 2 in COSMOS-like conditions. We use a sample of >2000 local non-active galaxies, with a well-known visual morphological classification, and add an AGN as an unresolved component that contributes to the total galaxy flux with 5–75%. We moved all the galaxies to lower magnitudes (higher redshifts) to map the conditions in the COSMOS field, and we measured six morphological parameters. The greatest impact on morphology occurs when considering the combined effect of magnitude, redshift, and AGN, with spiral galaxies being the most affected. In general, all the concentration parameters change significantly if the AGN contribution is >25% and the magnitude > 23. We find that the GINI coefficient is the most stable in terms of AGN and magnitude/redshift, followed by the moment of light (M20), Conselice–Bershady (CCON), and finally the Abraham (CABR) concentration indexes. We find that, when using morphological parameters, the combination of CABR, CCON, and asymmetry is the most effective in classifying active galaxies at high-redshift, followed by a combination of CABR and GINI.

1. Introduction

The study of galaxy properties over cosmic time is crucial for understanding galaxy evolution. One of such properties is the morphology, which is intertwined with properties like stellar mass, color, luminosity, star formation, gas and dust content nuclear activity, and environment, and is fundamental in constraining models of galaxy formation and evolution (e.g., [1,2,3,4,5,6,7,8,9]). The techniques of morphological classification of galaxies can be broadly separated into four groups:
(1) Visual classification is the traditional method, and it is still commonly used to perform morphological classification of galaxies (e.g., [10,11,12,13,14,15,16]). It is time-consuming when dealing with a large sample of galaxies, as well as subjective, but it is one of the most reliable methods for classifying nearby and well-resolved objects. It is therefore often used to test the reliability of other classification methods.
(2) Parametric methods assume an analytical model to fit the surface brightness of galaxies using a set of mathematical, predefined functions (e.g., [11,17,18,19,20,21,22]). These methods provide detailed information on the different components of galaxies (e.g., bulge and disk), and the measurement of the Sérsic index. They have been commonly used in large surveys to obtain a broad classification into early- and late-types, although classification using the Sérsic index can sometimes be difficult, e.g., for late-type spirals and irregular galaxies, galaxies with central light peaks, etc. (e.g., [18,23,24]), including an additional difficulty related to the inclusion of spiral arms in the decomposition (e.g., [25,26]). (3) The non-parametric approach relies on measuring a set of carefully chosen observables rather than assuming any pre-existing analytic model. Non-parametric methods have also been widely used to measure various parameters of galaxies corresponding to morphological types such as light distribution and galaxy shape (e.g., [8,12,27,28,29,30,31,32,33]). Refs. [27,28] introduced the non-parametric technique by defining two observables, the Abraham concentration index and asymmetry. Subsequently, other parameters were introduced, such as smoothness [29,30], the Gini coefficient [34,35], the Conselice–Bershady concentration index [36], and moment of light [35]. The full summary of these parameters can be found in [1,37,38]. Morphological classifications for a large sample of galaxies at both low and high-redshift using non-parametric techniques have been widely used to classify galaxies into early- and late-types in large surveys, often in combination with machine learning (e.g., [1,6,8,31,33,37,38,39,40]).
(4) Finally, machine learning methods for the morphological classification of galaxies, both supervised (e.g., support vector machine (SVM), random forest, decision trees, logistic regression) and unsupervised (e.g., principal component analysis, k-means clustering), and, in particular, the (convolutional) neural networks, have been extensively used over recent years (e.g., [41,42,43,44,45,46,47,48,49,50]); the reliability and success rate of classification are often judged by how well they agree with the visual classification.
The presence of AGN can affect the morphological classification of active galaxies, and inconsistencies have been found in previous studies. Some studies concluded that AGN host galaxies tend to reside in spheroids or bulge-dominated galaxies (e.g., [40,51,52,53,54]), while others found a higher fraction of later types [4,12,55]. It has also been shown that the morphologies of AGN host galaxies may depend on the wavelength used for AGN detection. Radio-detected AGN are mainly hosted by red sequence galaxies (e.g., [56]), while X-ray-detected AGN are found in greater numbers in the green valley (e.g., [40]). Therefore, it is important to carry out further studies on the morphologies of active galaxies; for this, it is also essential to study how different morphological parameters, commonly used in morphological classification, are affected by the contribution of AGN.
Even though numerous studies found that AGN contributions may also affect the morphological classification of their host galaxies, in the best-case scenario, limited contributions are made (see, for example, [4,53,57,58]). At present, the most detailed study on the impact of AGN on morphological parameters and the classification at z ∼ 0 is [38]. In this work, we studied how different contributions of AGN to the total optical light, covering a wide range of AGN fractions between 5% and 75% to consider both type-1 and type-2 AGN, affect the six commonly used morphological parameters: Abraham concentration index, Gini coefficient, Conselice–Bershady concentration index, M20 moment of light, asymmetry index, and smoothness. We found that most morphological parameters are affected by the presence of an AGN when its contribution to the total galaxy light is above 25%, with late-type galaxies being more affected than early-types. However, an exhaustive analysis of the relationship between the commonly used morphological parameters and the effect of the AGN on the classification of galaxies at higher redshift, where the impact of survey depth and resolution on the classification of galaxies is significant [37], is still missing.
In this work, we artificially added 5–75% AGN contributions to the center of non-active local galaxies with known morphologies, and we moved them to the redshift and magnitude distributions corresponding to a sample of galaxies from the COSMOS [59] survey, using five magnitude and redshift ranges. We then studied how the contribution of the AGN has an impact on the derived morphological parameters up to the intermediate redshift of z ∼ 2.
The structure of the paper is as follows: The data are described in Section 2, together with a summary of the sample selection. Section 3 defines the methodology used. The analysis and results are presented in Section 4. The results are discussed in Section 5, while conclusions are drawn in Section 6. We assume a cosmological model with Ω Λ = 0.7 , Ω M = 0.3 , and H 0 = 70 kms 1 Mpc 1 . All magnitudes given in this paper are in the A B system described by [60].

2. Data and Sample Selection

In this work, we use two datasets corresponding to the local universe (at z ∼ 0) and intermediate redshift (up to z ∼ 2). The local sample of galaxies is the same as that described in [38]; therefore, we provide only a summary here. We use a total sample of 2301 local, non-AGN galaxies, randomly selected from the initial sample of ∼ 14,000 galaxies with available visual morphological classification (T-type) from [13] (see their Table 1). Galaxies were selected as non-AGN using the BPT-NII diagram [61] and emission line ratios using fluxes from the MPA-JHU SDSS DR7 catalogue1.
The final local sample used in this work contains 2251 galaxies (after excluding mergers, interactions, peculiar galaxies, and images affected by nearby stars), of which 471 (21%) are early-types (elliptical and lenticular, with T-type ≤ 0), 891 (40%) early-spirals (0 < T-type ≤ 4) and 889 (39%) late-spirals (4 < T-type ≤ 8). We do not have strong edge-on galaxies in our sample; therefore, although the effect of inclination is not taken into account in this study, we do not expect it to significantly affect our main results. Figure 1 shows the g-band magnitude and redshift distributions for the sample of selected local non-AGN galaxies. The selected galaxies are, in general, well separated between ellipticals and spirals when using different morphological diagrams, as shown in [38] (Figures 12–15 for the original sample, top left plots). Finally, all selected galaxies are nearby and extended, with the PSF size much smaller than the galaxy size, as shown in [38] (see their Figure 4 and Table 1). The impact of AGN on galaxy sizes was already tested in our previous work by [38] (their Section 4.1 and Figure 6), showing a negligible impact on the effective radius of <10% up to the AGN contributions of 25%, and of ∼20%, 40%, and 60% for AGN contributions of 25%, 50%, and 75%, respectively. The impact of magnitude/redshift on galaxy sizes was already tested in previous works, including the work of [62] where the authors found a negligible effect on sizes up to redshift of z ∼ 1.
At intermediate redshift, we use as a reference the Cosmic Evolution Survey (COSMOS; [63]). We selected COSMOS since it is one of the deepest surveys with multi-wavelength data available, and it is widely used in galaxy formation and evolution studies. It is the Hubble Space Telescope’s (HST) largest project to date, covering an area of 2 deg 2 and reaching a depth of I(F814W) = 27.2 mag. In this work, we use the photometric images and catalog in the F814W band from the HST-ACS survey. The data reduction, images, and photometric catalog are all described in [64,65]. For photometric redshifts, we used the catalogue by [66], where the redshifts were measured using the Le Phare code and photometric information from 30 broad-, intermediate-, and narrow-band filters from UV, optical, NIR, and MIR bands. For more details on the images and catalogs used in this work, see [37].

3. Methodology

Non-parametric methods of morphological classification have been widely used to separate galaxies with different structures, especially when dealing with large datasets and faint sources at higher redshift (e.g., see [37], and references therein). In this work, we have measured and analyzed the following six morphological parameters commonly used in the literature and non-parametric morphological classification: Abraham concentration index (hereafter CABR; [27]), as the ratio between the flux at 30% of the Petrosian radius and the total flux of the galaxy; Gini coefficient (hereafter GINI; [34,35]), that gives the distribution of light among the pixels associated with a galaxy, taking into account the number of pixels, the flux in each pixel, and the mean flux; Conselice–Bershady concentration index (hereafter CCON; [36]), measured as the logarithm of the ratio of the circular radii containing 80% and 20% of the total flux; M 20 moment of light (hereafter M20; [35]), which depends on the spatial distribution of the light in a galaxy relative to its center, summed over the 20% brightest pixels and normalized by the total second-order moment of light; asymmetry index (hereafter ASYM; [28]), which gives the level of asymmetry in the shape of a galaxy by comparing an object flux in every pixel using an original image and the rotated one by 180 deg, and taking into account the background; and smoothness or clumpiness (hereafter SMOOTH; [30]), which is sensitive to the small-scale structures in galaxies and takes into account the original galaxy image smoothed with a boxcar of a given width and subtracted from the original image. For more details on how all these parameters are defined and measured, see any of the previous studies by [1,37,39], or [38]. We used the galaxy Support Vector Machine (galSVM) code [31] to measure all six parameters. The galSVM is a freely available code written in IDL that uses the libSVM library [67], also freely available, which helps with multi-parametric analyses and allows for an automatic morphological classification of galaxies by using the SVM.

3.1. Morphological Parameters at Intermediate Redshifts

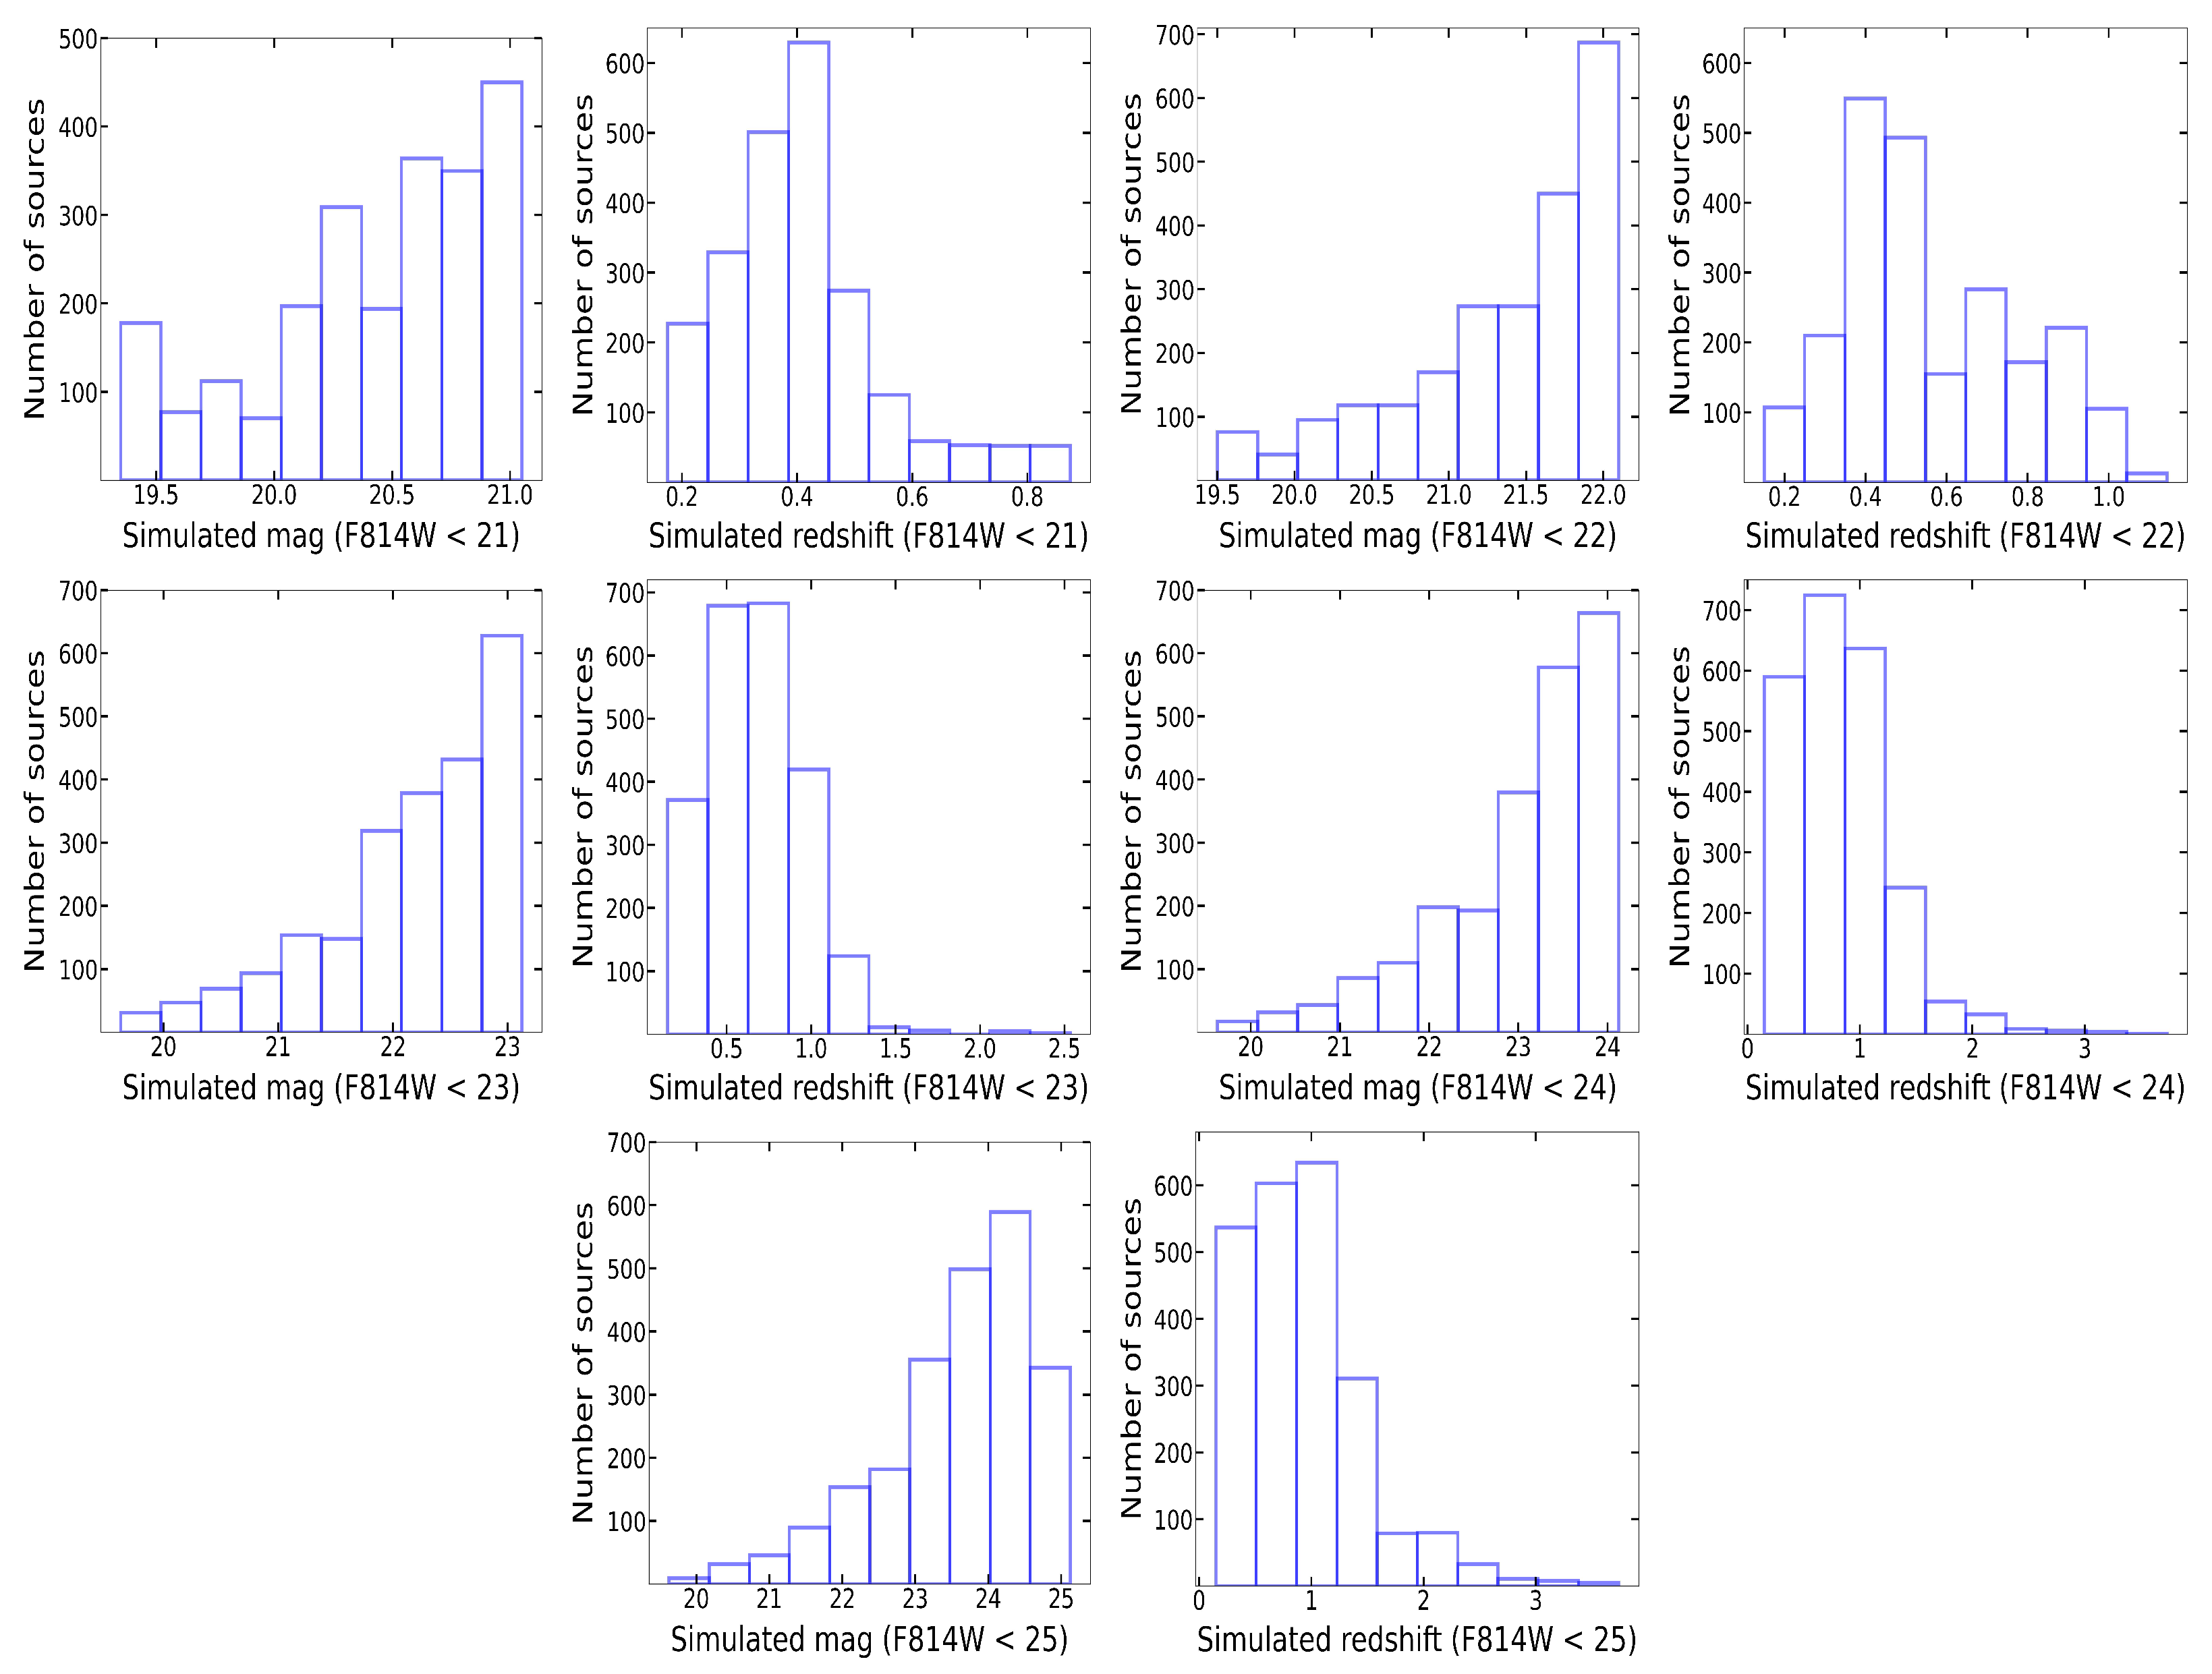
Using galSVM, we first randomly scaled in brightness a local sample of 2251 non-AGN galaxies to match the magnitude and redshift distributions of galaxies in the COSMOS field. In this way, when scaling the galaxy in flux, the surface brightness dimming was directly taken into account. All local galaxies have been re-sampled with a pixel scale of 0.03 arcsec/pix corresponding to COSMOS and convolved with their point spread function (PSF) obtained from the SDSS survey for each galaxy to match the same spatial resolution. In addition, the galSVM code is optimized to classify faint sources. Our previous studies showed that the use of several magnitude limits tends to give a better classification, rather than mapping the entire COSMOS sample of galaxies at once (see [8,39]). In this work, we want to analyze the effect of AGN on the morphological parameters when dealing with different brightness and redshift of galaxies; therefore, we decided to perform the study considering five magnitude limits (and corresponding redshift limits): F814W ≤ 21 (z ≲ 0.7), F814W ≤ 22 (z ≲ 0.9), F814W ≤ 23 (z ≲ 1.1), F814W ≤ 24 (z ≲ 1.6), and F814W ≤ 25 (z ≲ 2). Figure 2 shows these distributions in COSMOS using the HST/ACS F814W photometric band. All 2251 local non-AGN galaxies have been simulated, as explained above, to match the five selected magnitude and redshift distributions.
For each magnitude (and corresponding redshift) limit, we then dropped the simulated galaxies into the real background of the COSMOS image. Special care is taken to place all simulated galaxies in empty background regions to avoid superposition with COSMOS sources. For this, galSVM uses the corresponding SExtractor [68] segmentation images in COSMOS to find sky regions free of sources. In addition, to ensure that each simulated galaxy will be dropped in an empty background region, we only allow 10 galaxies per image as the maximum number of objects per galSVM run. This process is repeated until all simulated galaxies have been dropped. With all this, we expect to reproduce the noise of COSMOS images by placing the local galaxies in a real background of high-redshift sources.
Finally, we measured the six morphological parameters (CABR, GINI, CCON, M20, ASYM, and SMOOTH) of all the simulated galaxies. Depending on the F814W band used in COSMOS and the redshift to which the galaxy was randomly shifted, we measured the morphological parameters of all simulated galaxies using the corresponding SDSS rest-frame bands and their central wavelengths, to avoid K-correction effects (for more information see [31]). With this, we generated new images that show how the galaxies would appear at higher redshift (z < 2). We repeated this process five times, for five magnitude (and therefore redshift) limits, each time measuring all six morphological parameters. In [37], it has been shown how images of galaxies at fainter magnitudes and higher redshifts can be affected (see their Figures 3–5). For further information on the methodology, see the galSVM reference paper [31].

3.2. Morphological Parameters at Intermediate Redshift with Added AGN

As explained in [38], to measure the effect of AGN on morphological parameters, we used the above sample of 2251 local non-AGN galaxies. We simulated them by adding at their centers different fractions of AGN contribution to the total galaxy flux. For each galaxy, the PSF image obtained from the SDSS survey as described in [8] was used to simulate the AGN contribution, while the PSF was modeled using the Moffat function [69]. For each galaxy, new images have been generated by adding five different AGN contributions of 5%, 10%, 25%, 50%, and 75% to the total flux of the galaxy, which was measured with SExtractor. All additional information is given in [38] and their Figure 4. By selecting 5–75% of AGN contribution, we wanted to cover the wide range of AGN fractions, considering both type-1 and type-2 AGN. This is supported by previous studies. For example, in the local universe [70], using the SDSS database, obtained AGN fractions to the host total luminosity between 5% and 80%. The advent of the JWST also allowed to test this fraction at higher redshift. In fact, Ref. [71] quotes AGN fractions between 20% and 70% at z > 4.
After obtaining, for each galaxy, these five images with different AGN fractions, we followed the steps given in Section 3.1. We first simulated all images to match higher redshift (and fainter magnitude) distributions of COSMOS, and then we dropped the simulated images into the real COSMOS background to map its resolution, and we measured six morphological parameters. Finally, we obtained the morphological parameters for the five different AGN contributions to the total flux (from 5% to 75%) and intermediate redshift corresponding to the five simulated magnitude limits (from ≤21 to ≤25).

4. Analysis and Results

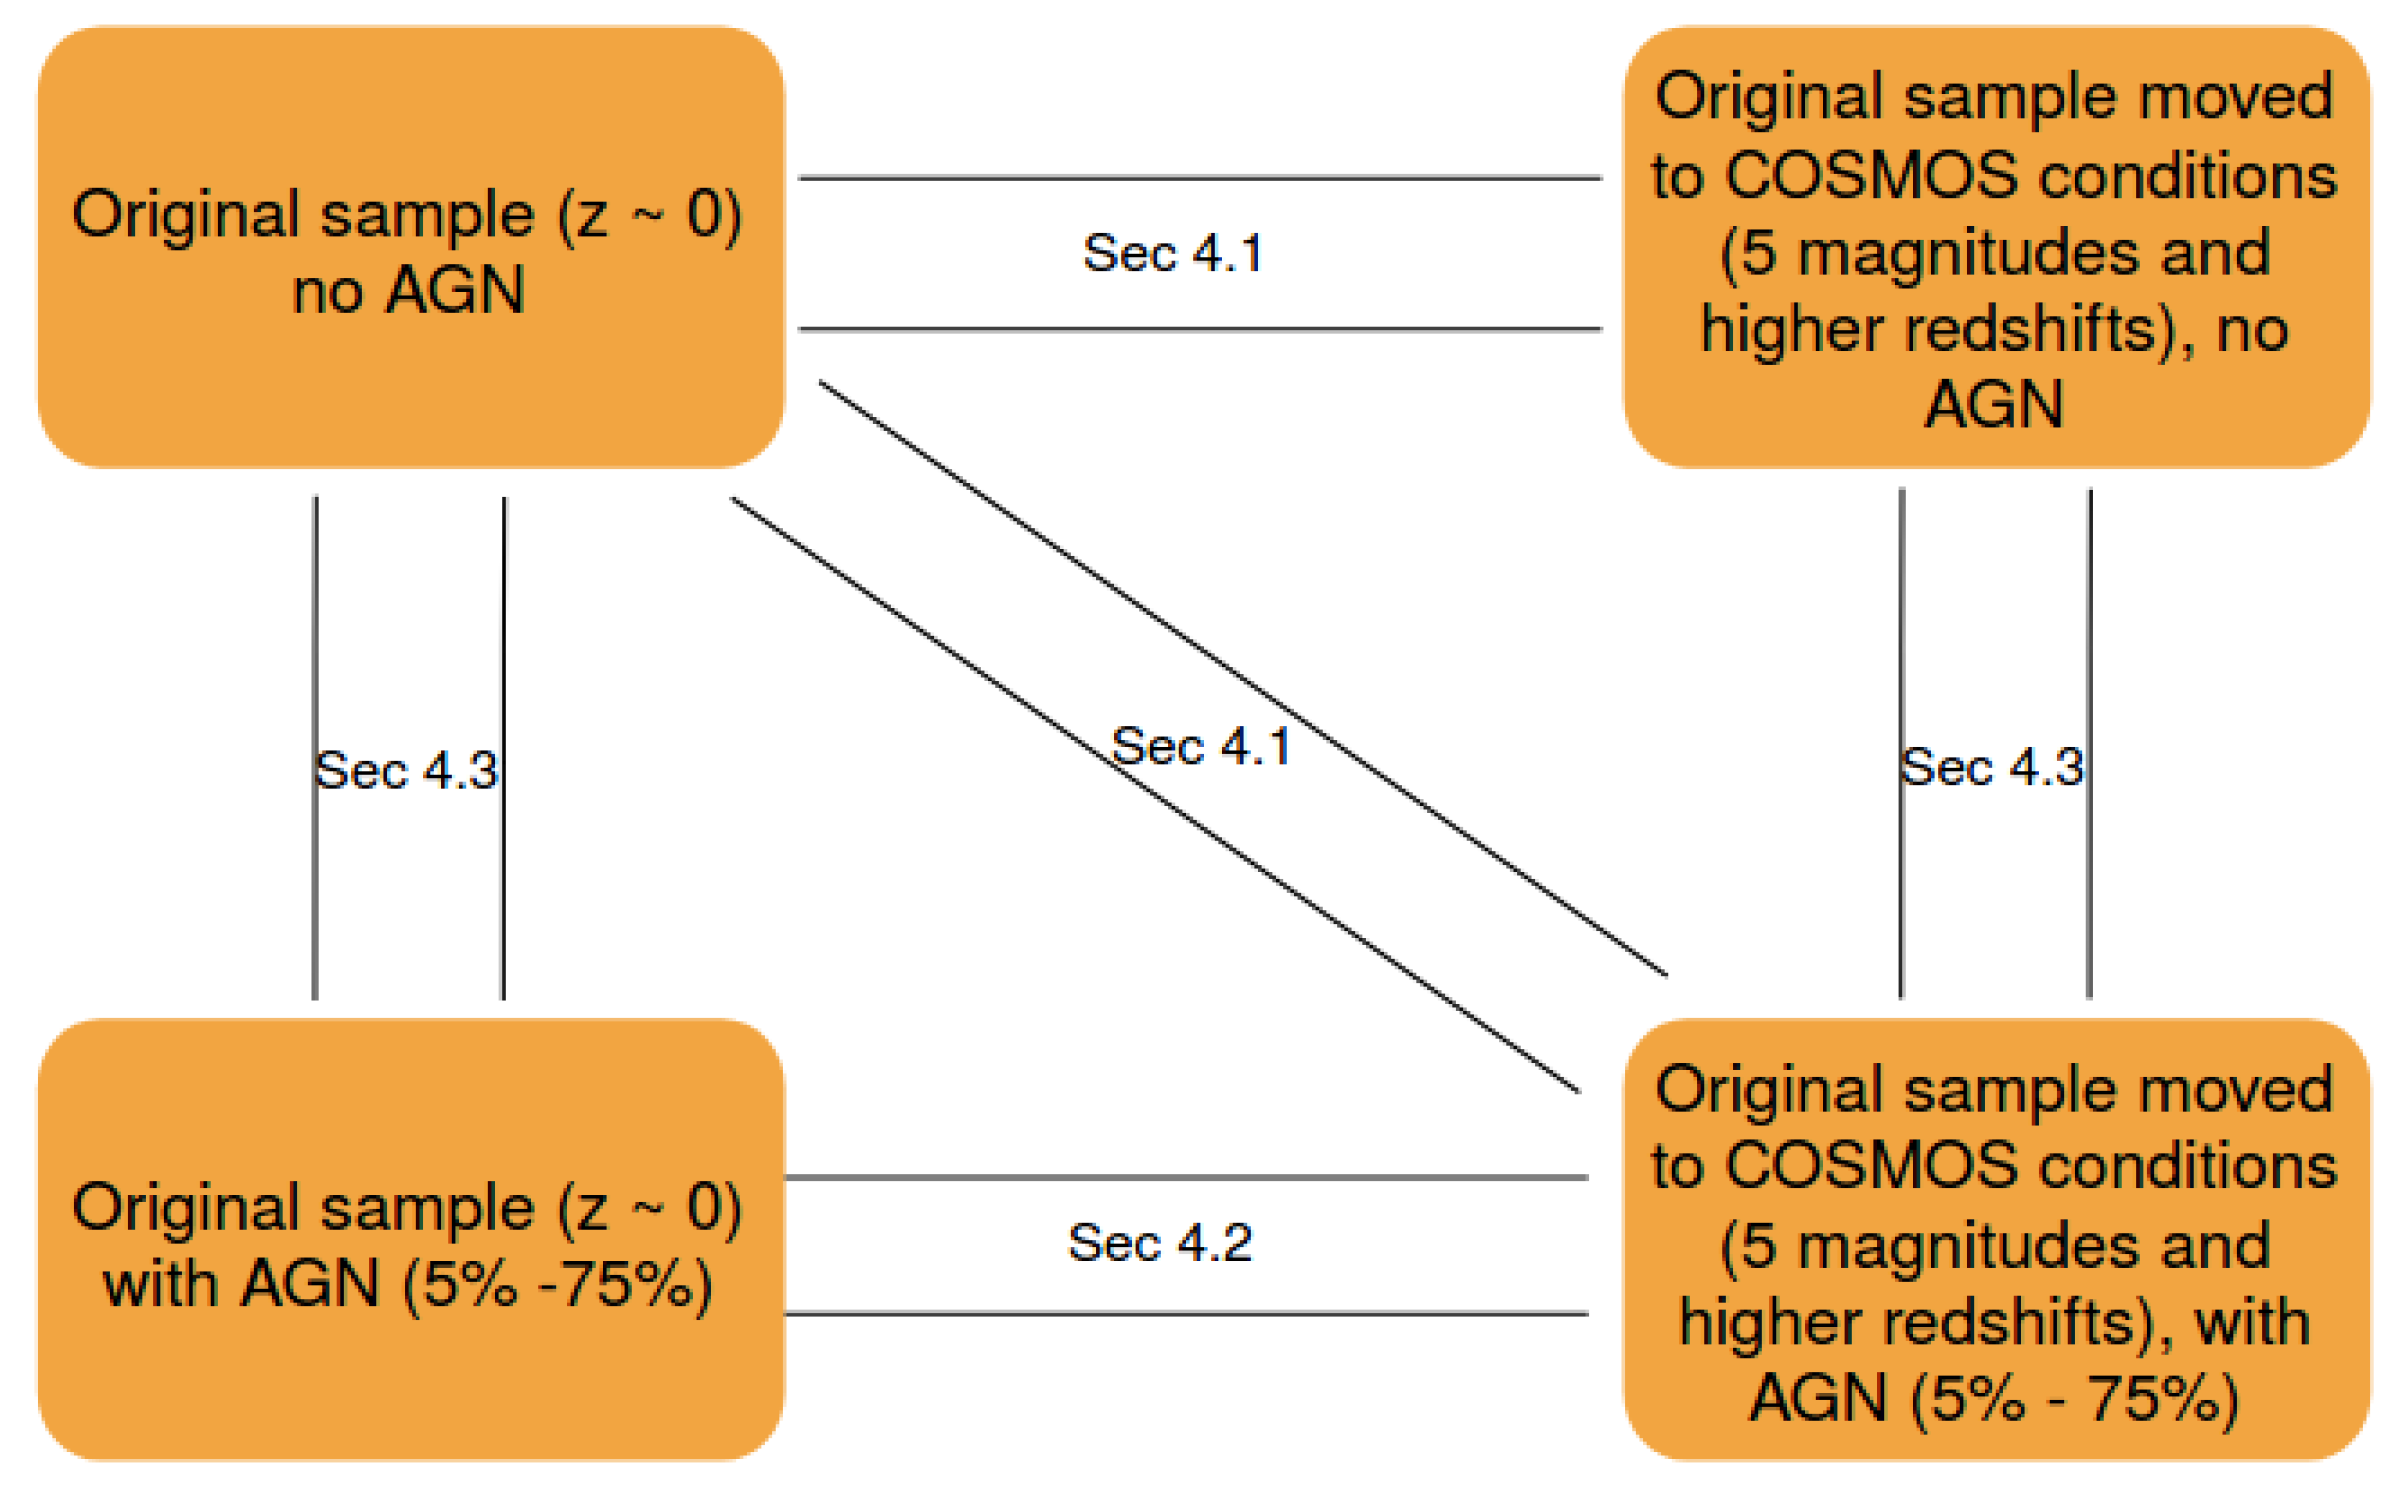
This section describes the analysis carried out. Figure 3 helps to visualise the comparisons made between morphological parameters measured under different conditions, at z ∼ 0 and in COSMOS-like conditions, with and without added AGN, described in Section 4.1, Section 4.2 and Section 4.3. The impact of AGN and magnitude/redshift on the morphological diagrams is presented in Section 4.4.

4.1. Impact of Magnitude, Redshift, and AGN on Morphological Parameters

In this section, we want to analyze how the morphological classification of galaxies can be affected by the magnitude, redshift, and AGN contribution, when all are combined and when non-parametric methods are used. To do so, we analyzed the impact of the magnitude, redshift, and AGN on six morphological parameters by comparing the local non-AGN galaxies without any AGN added, with the same sample in COSMOS-like conditions without and with added AGN. These analyses are summarized in Appendix A.
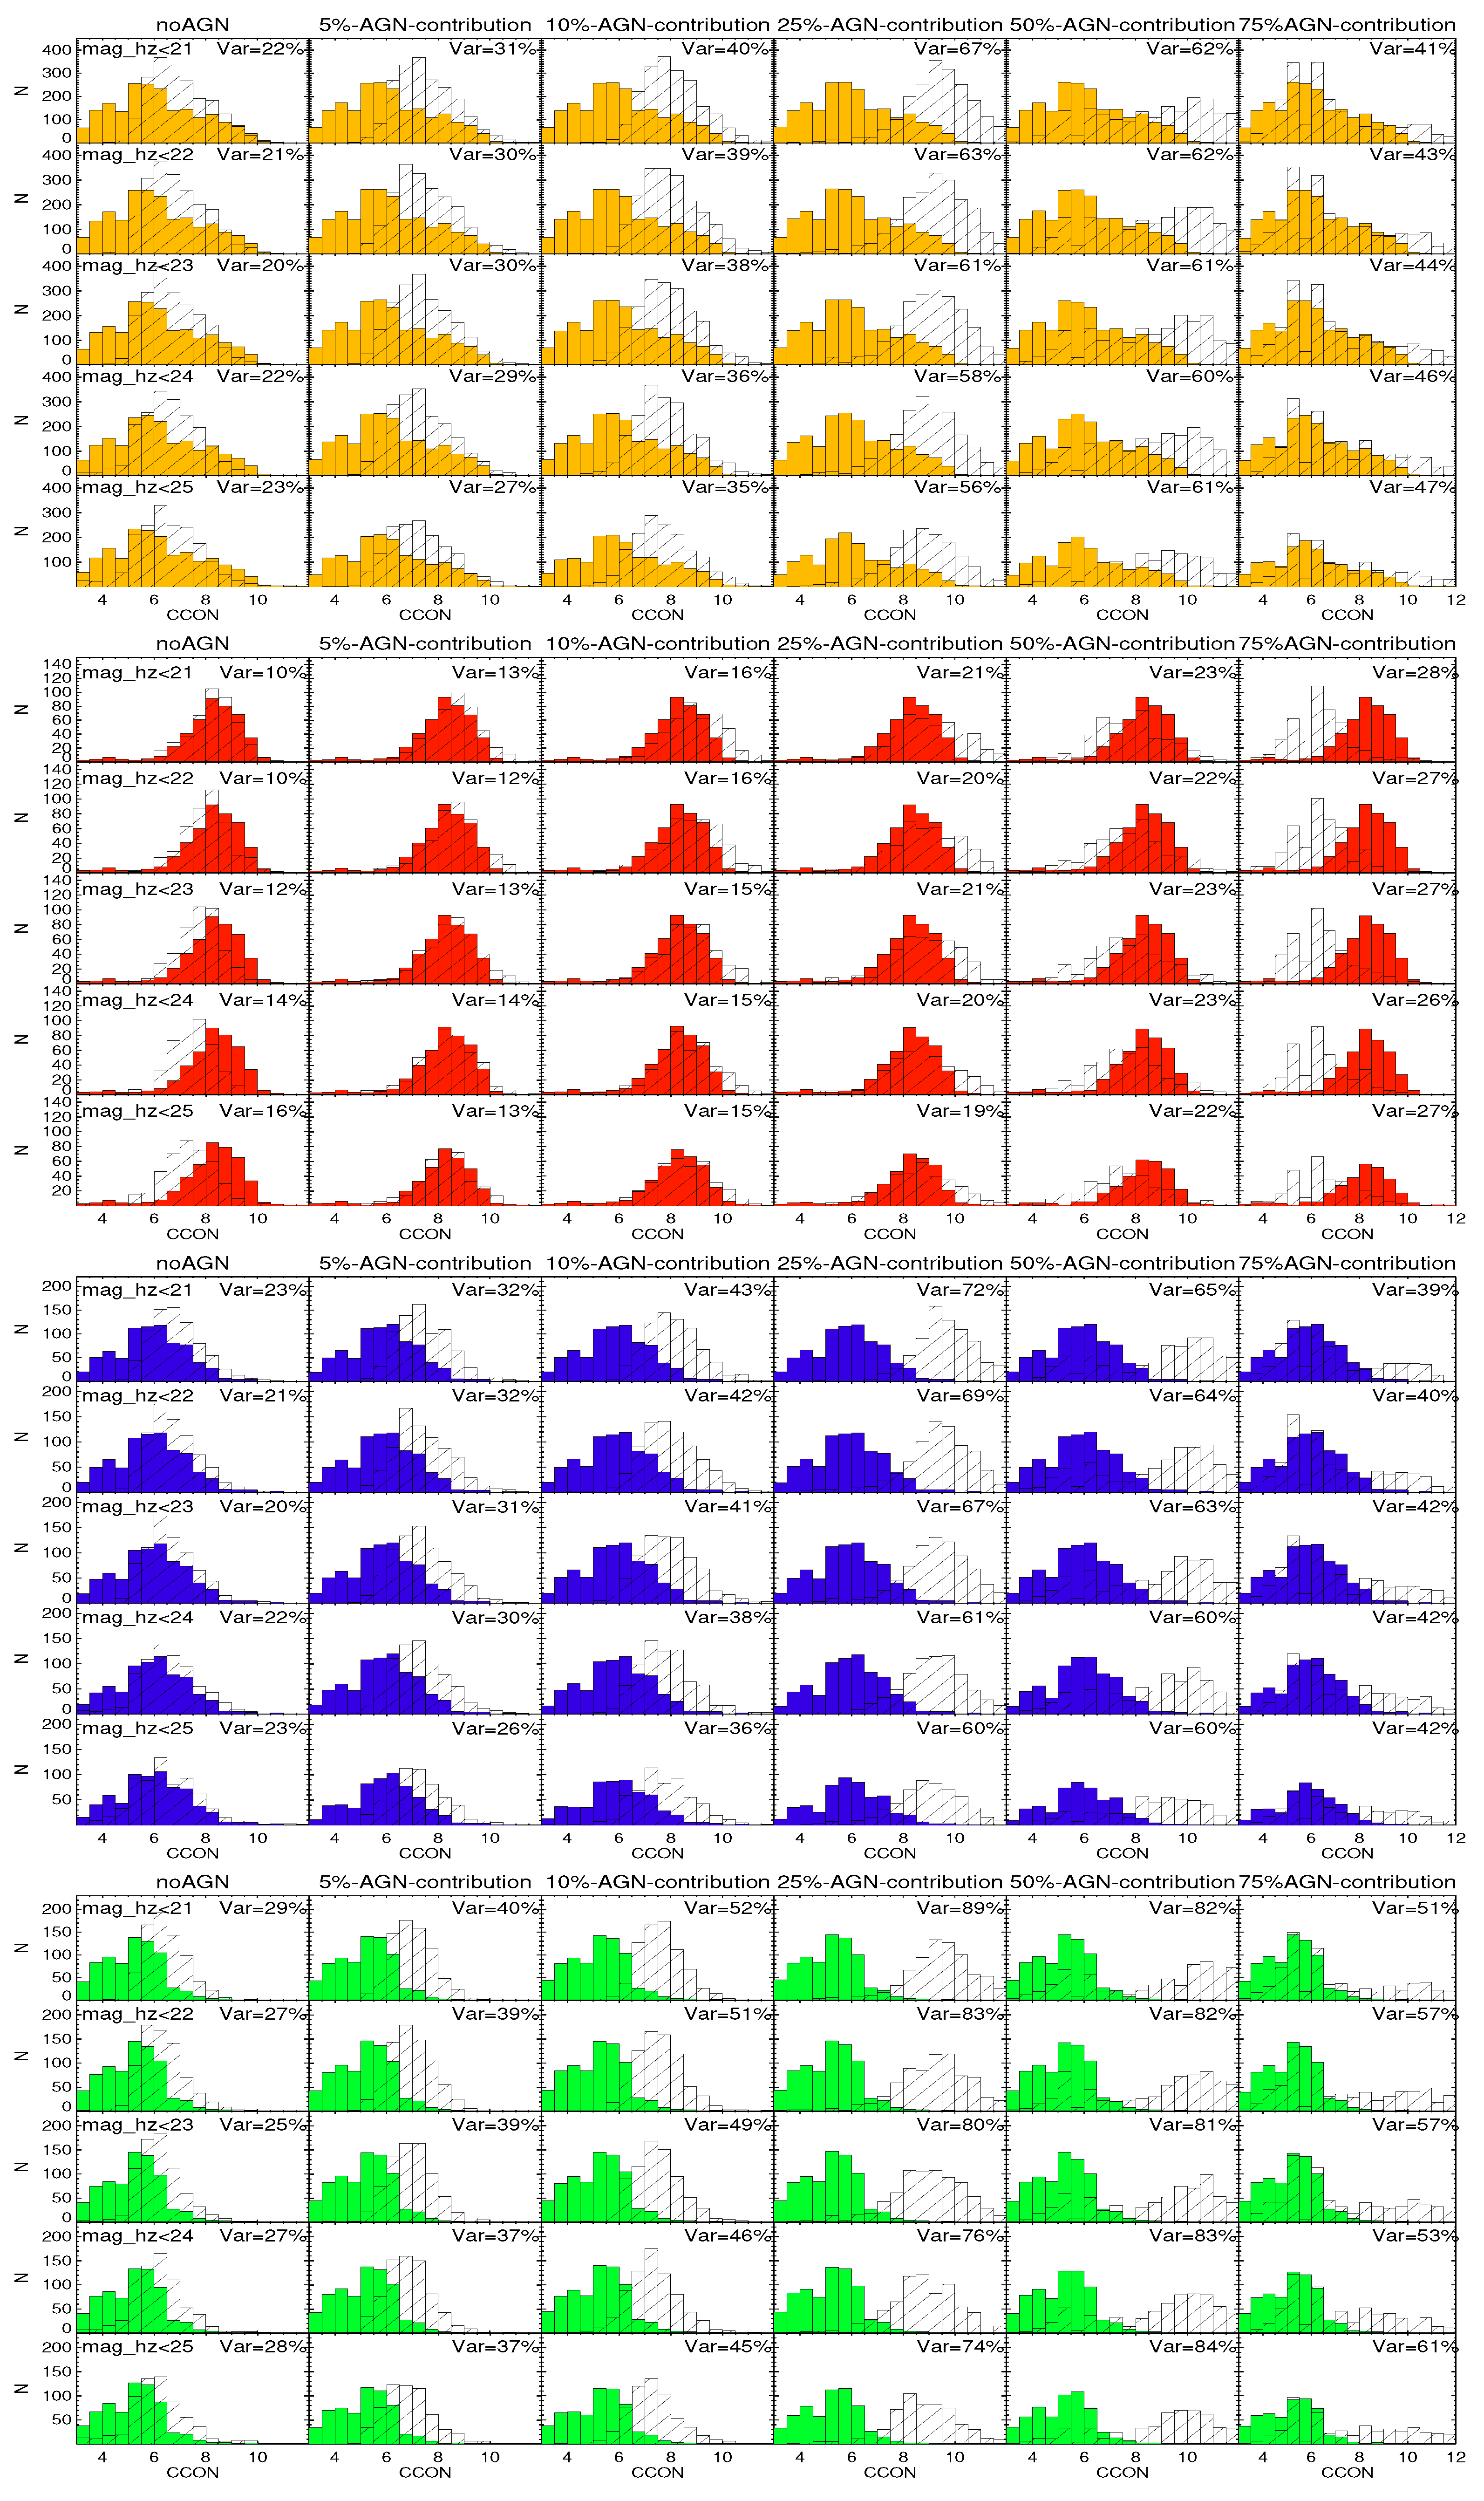
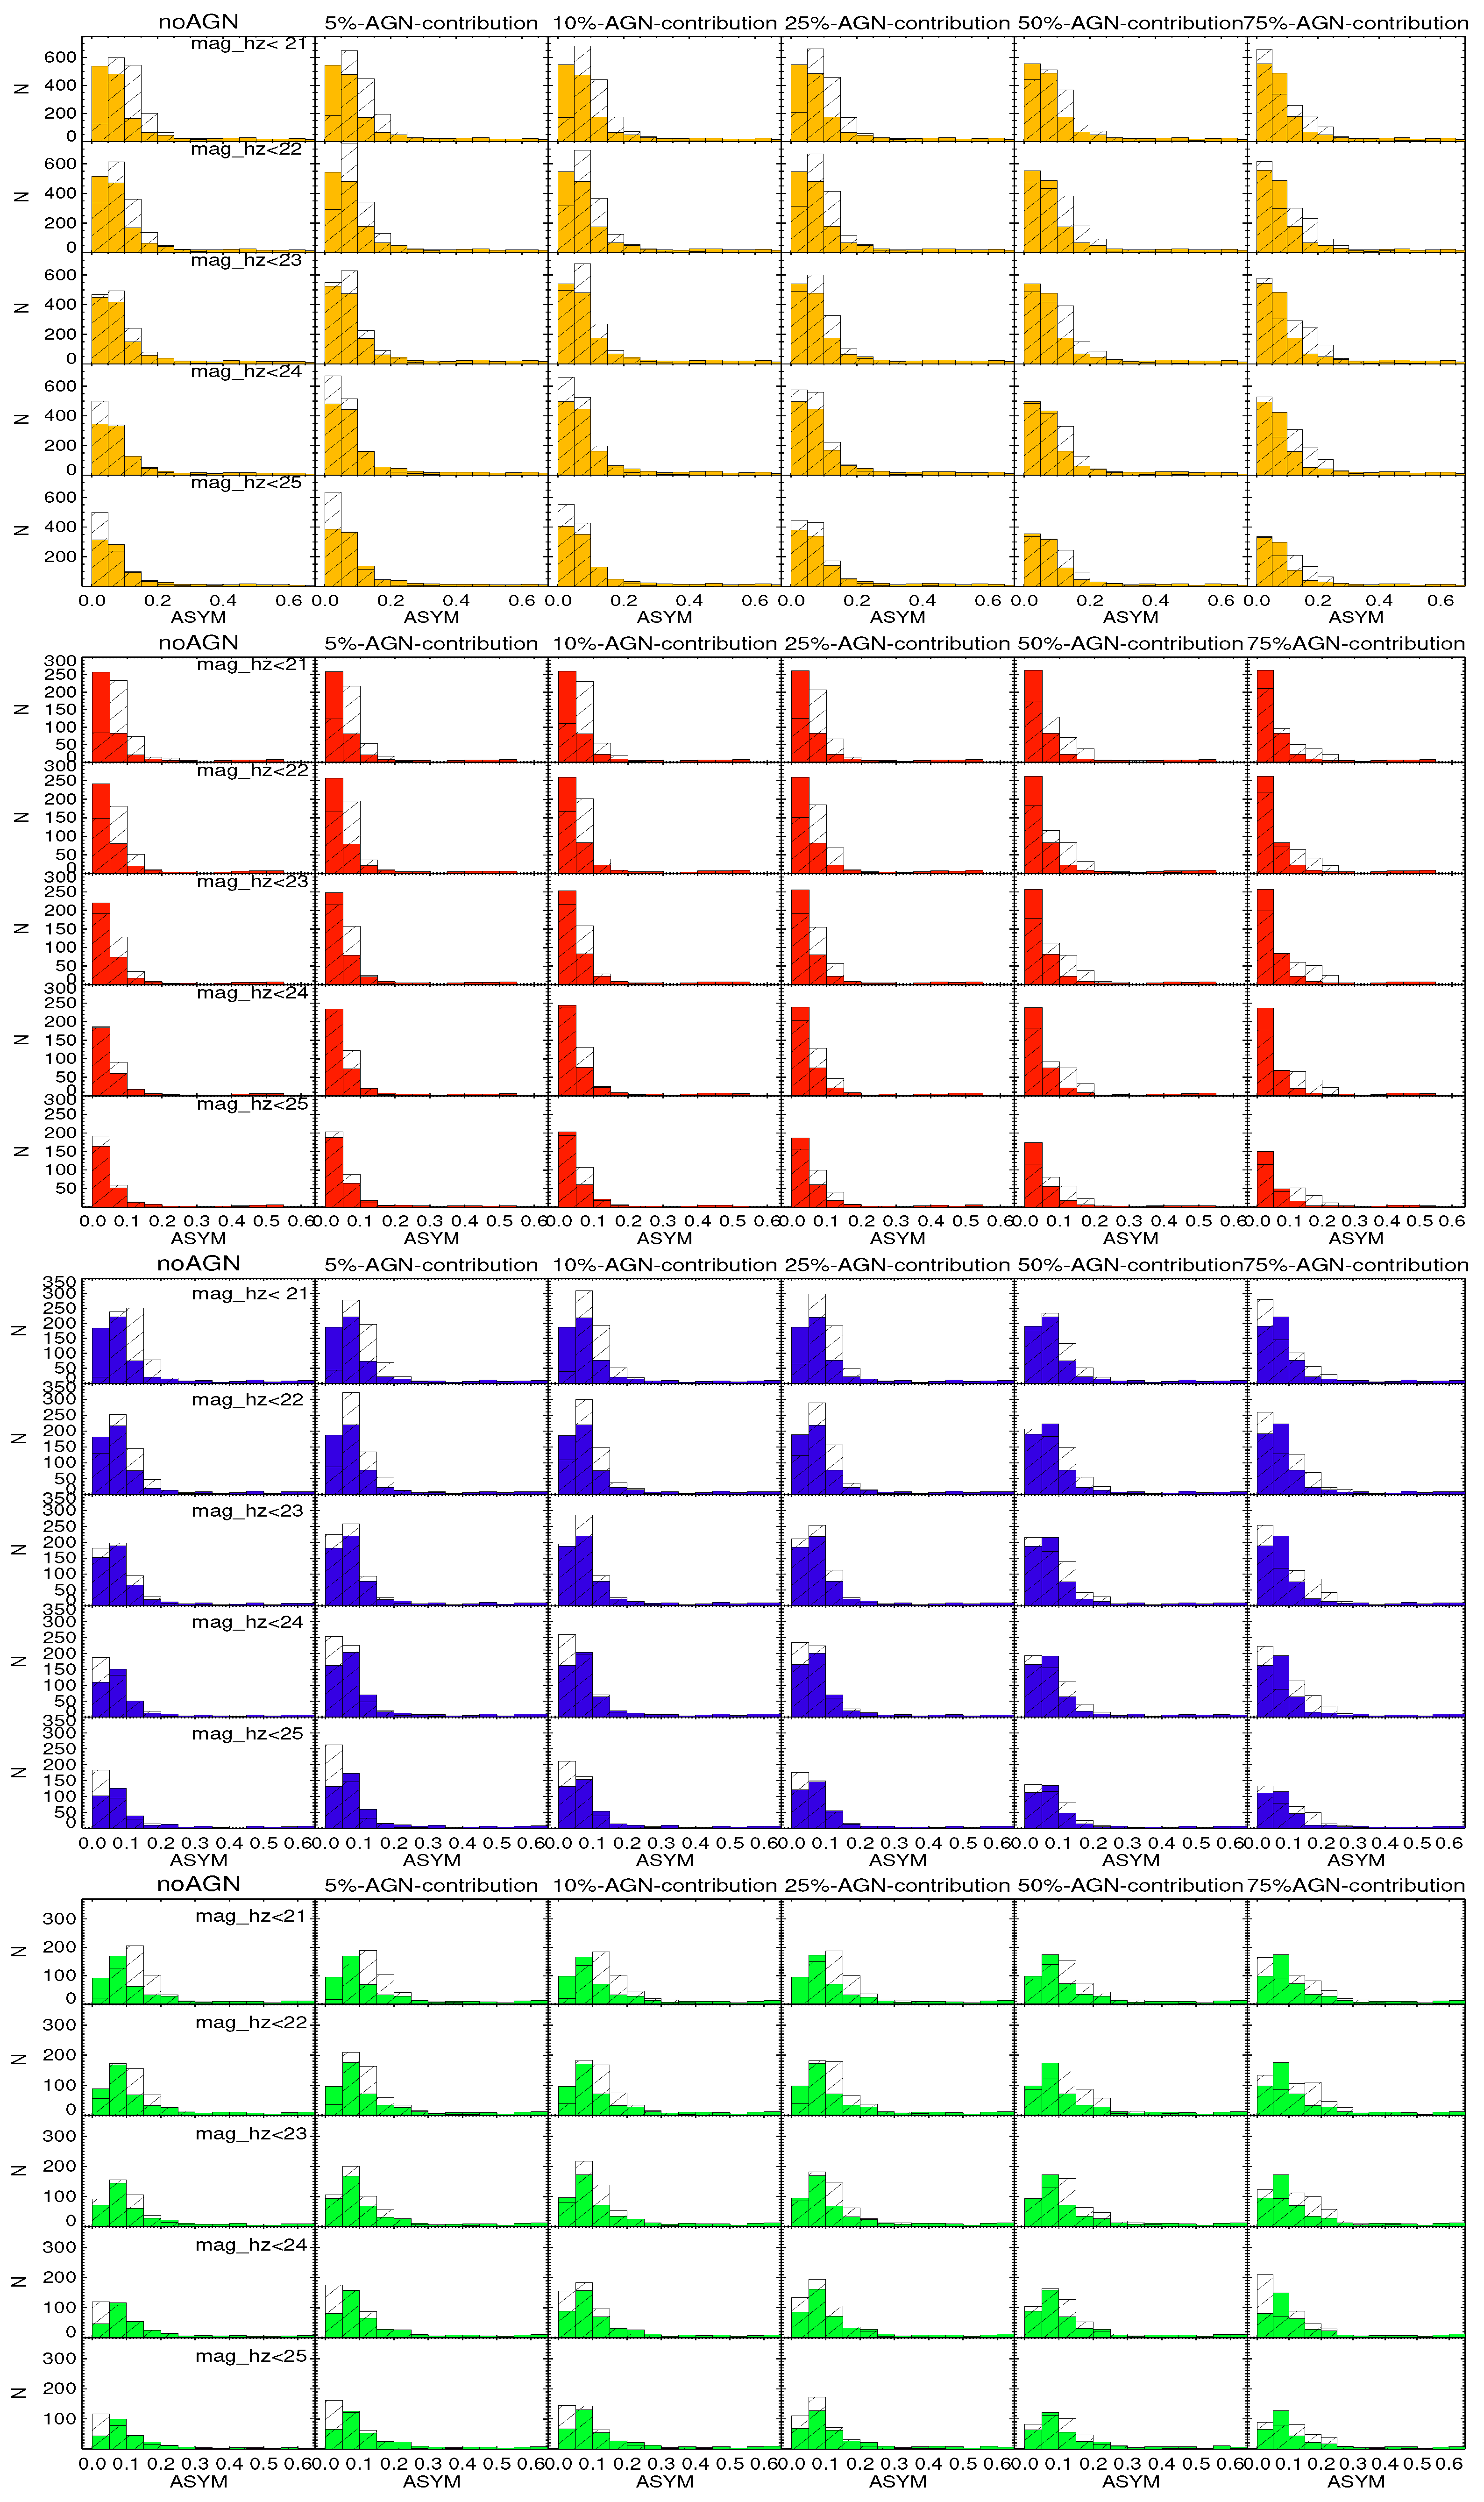
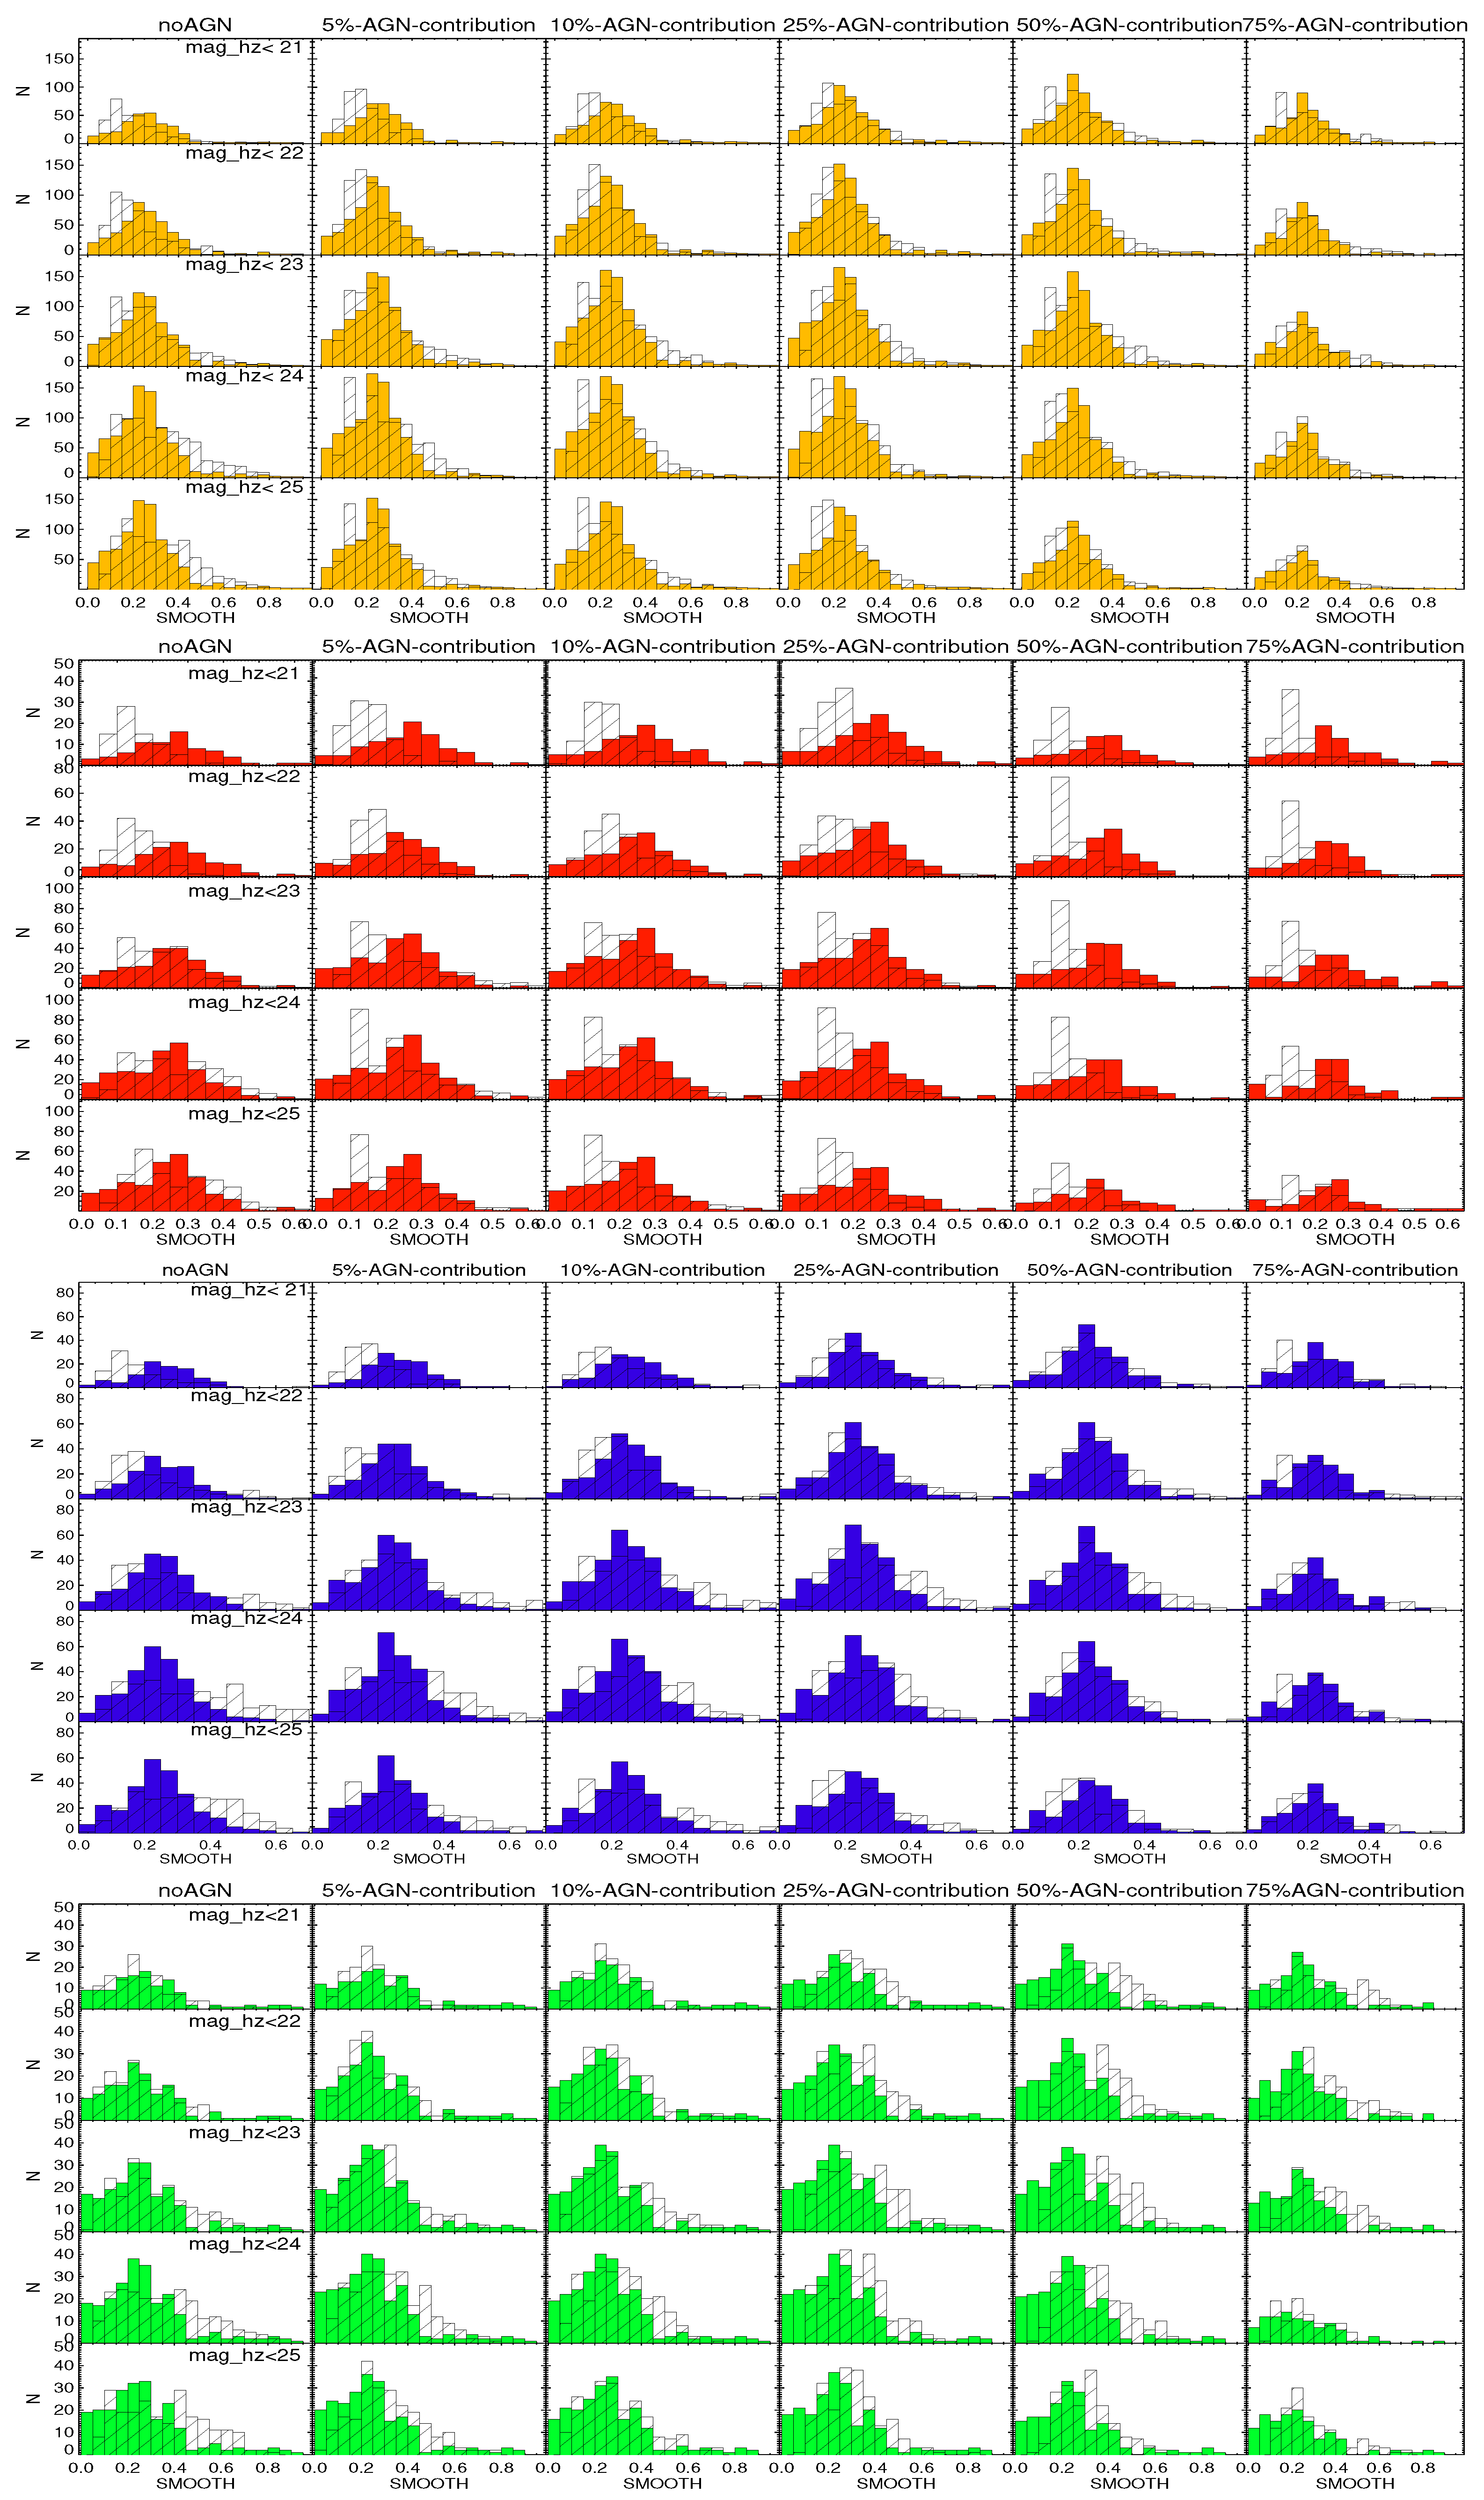
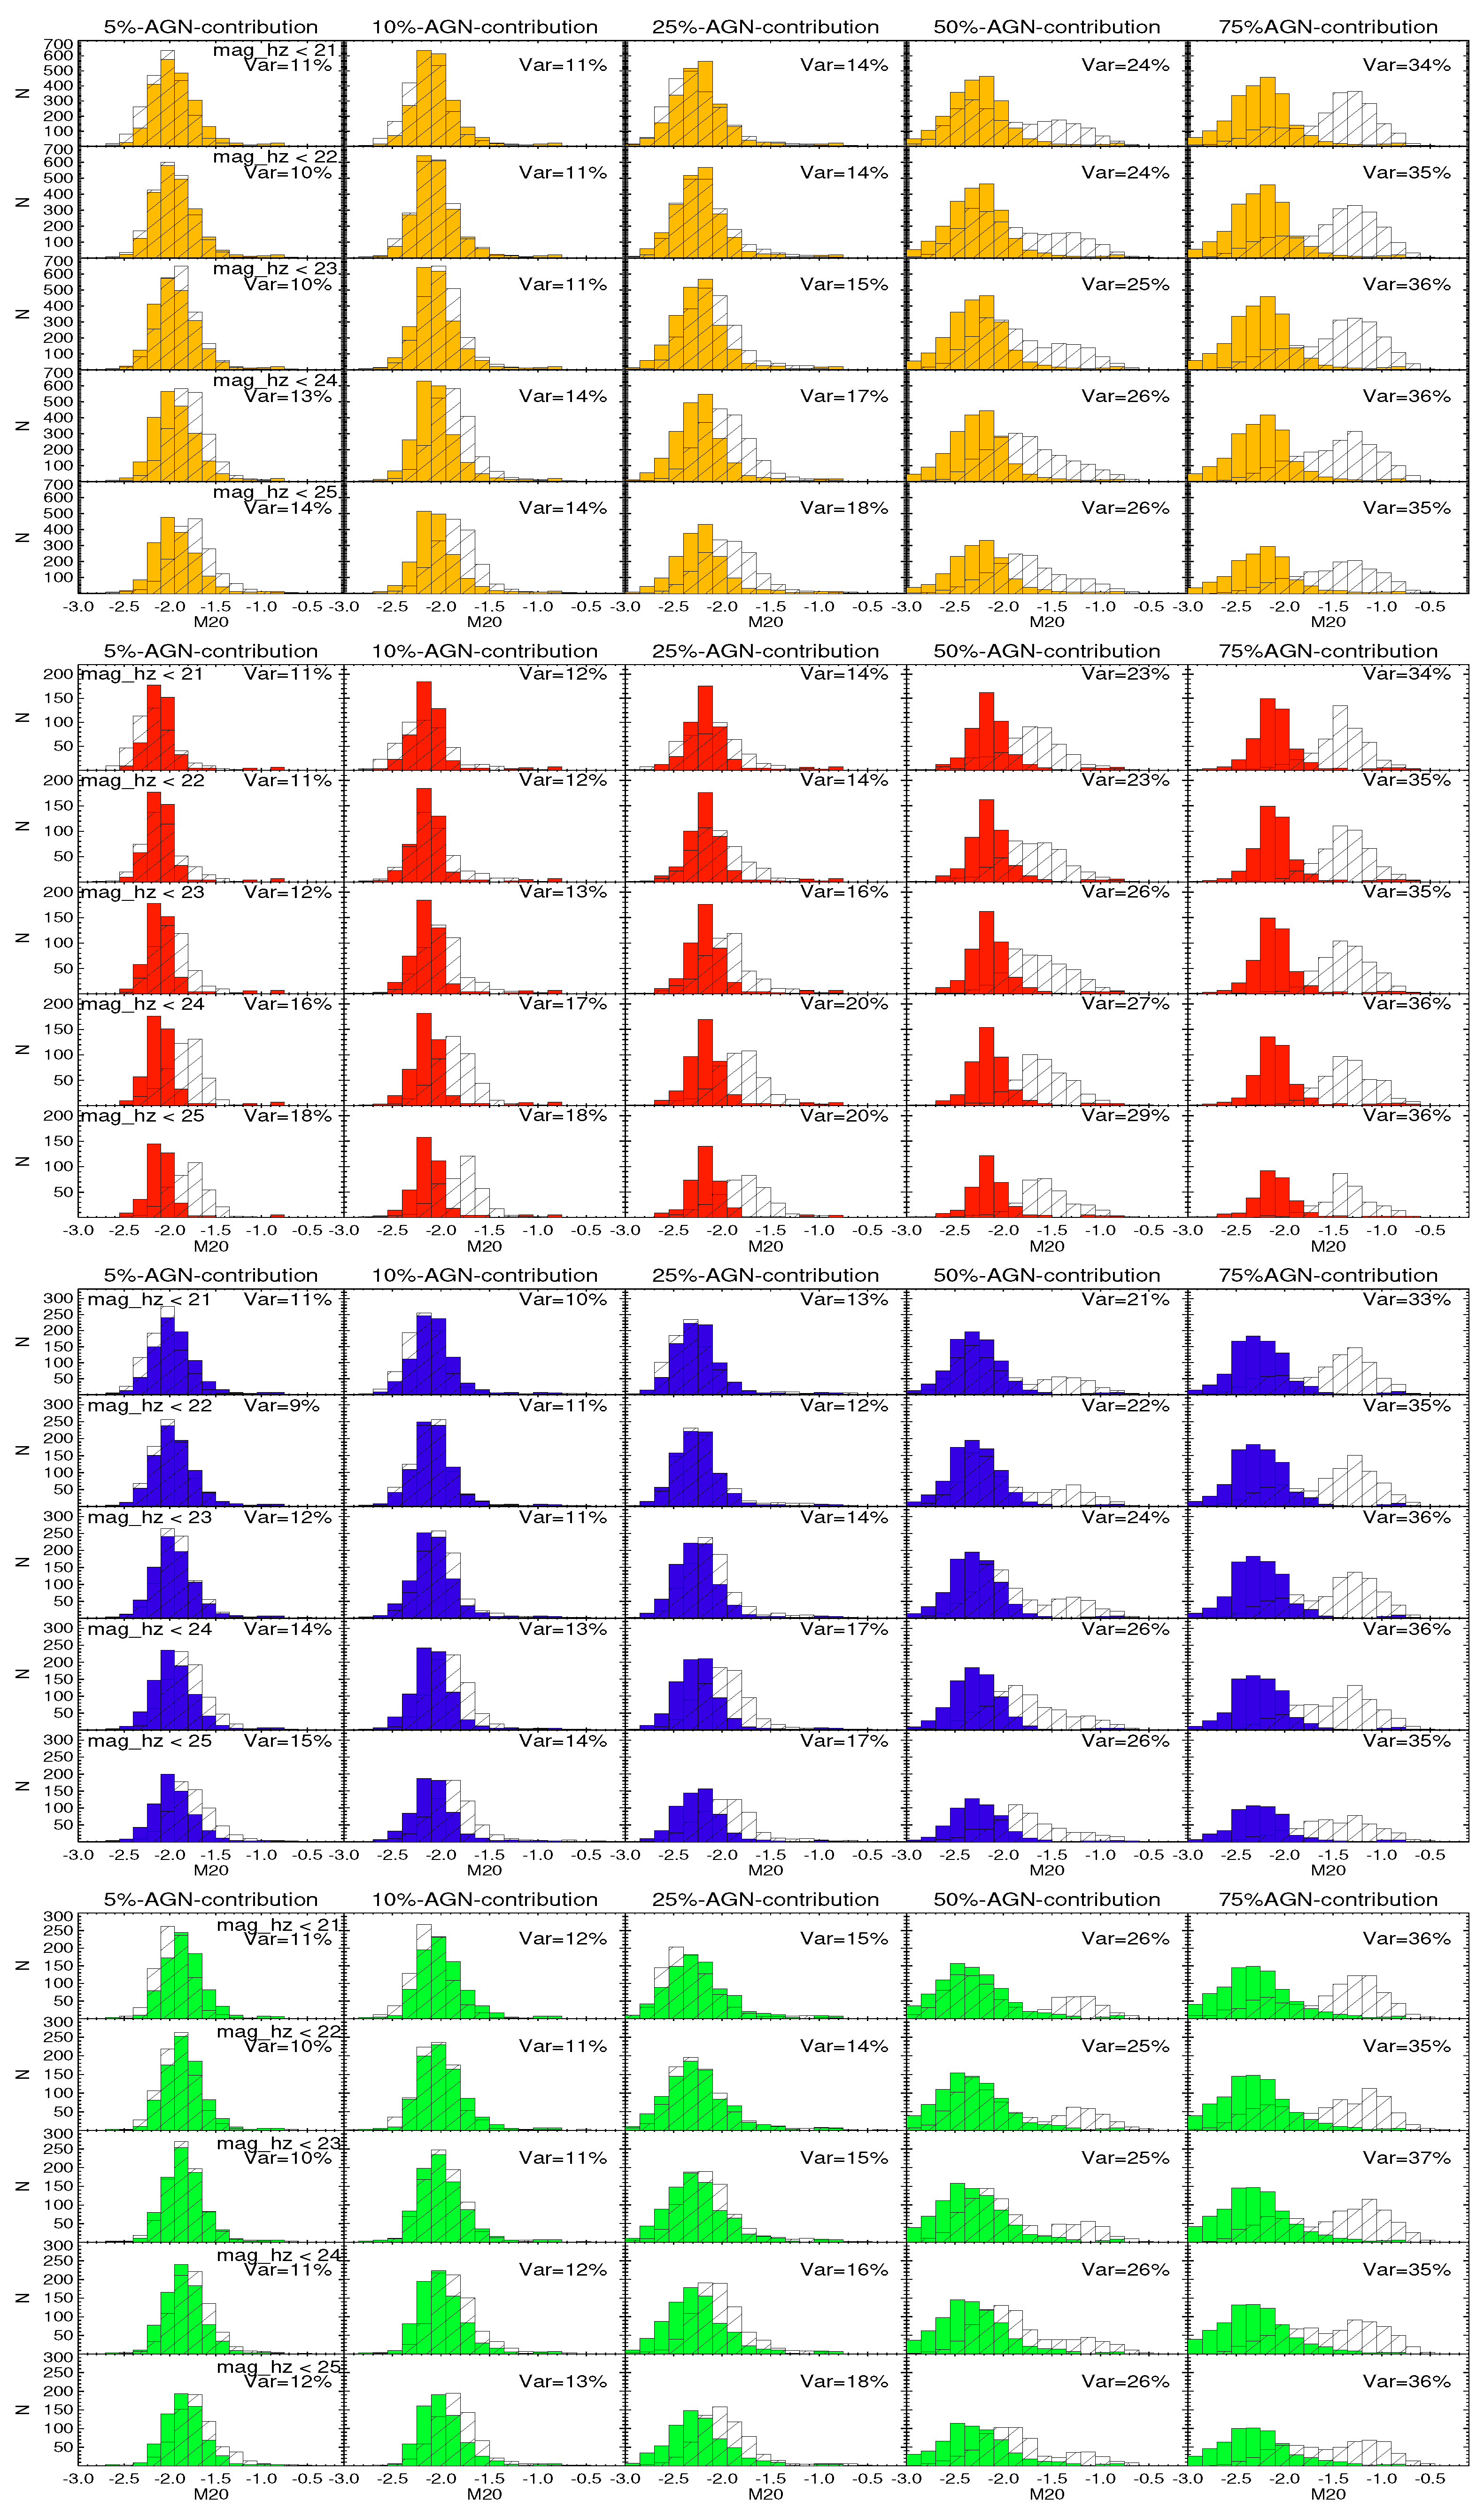
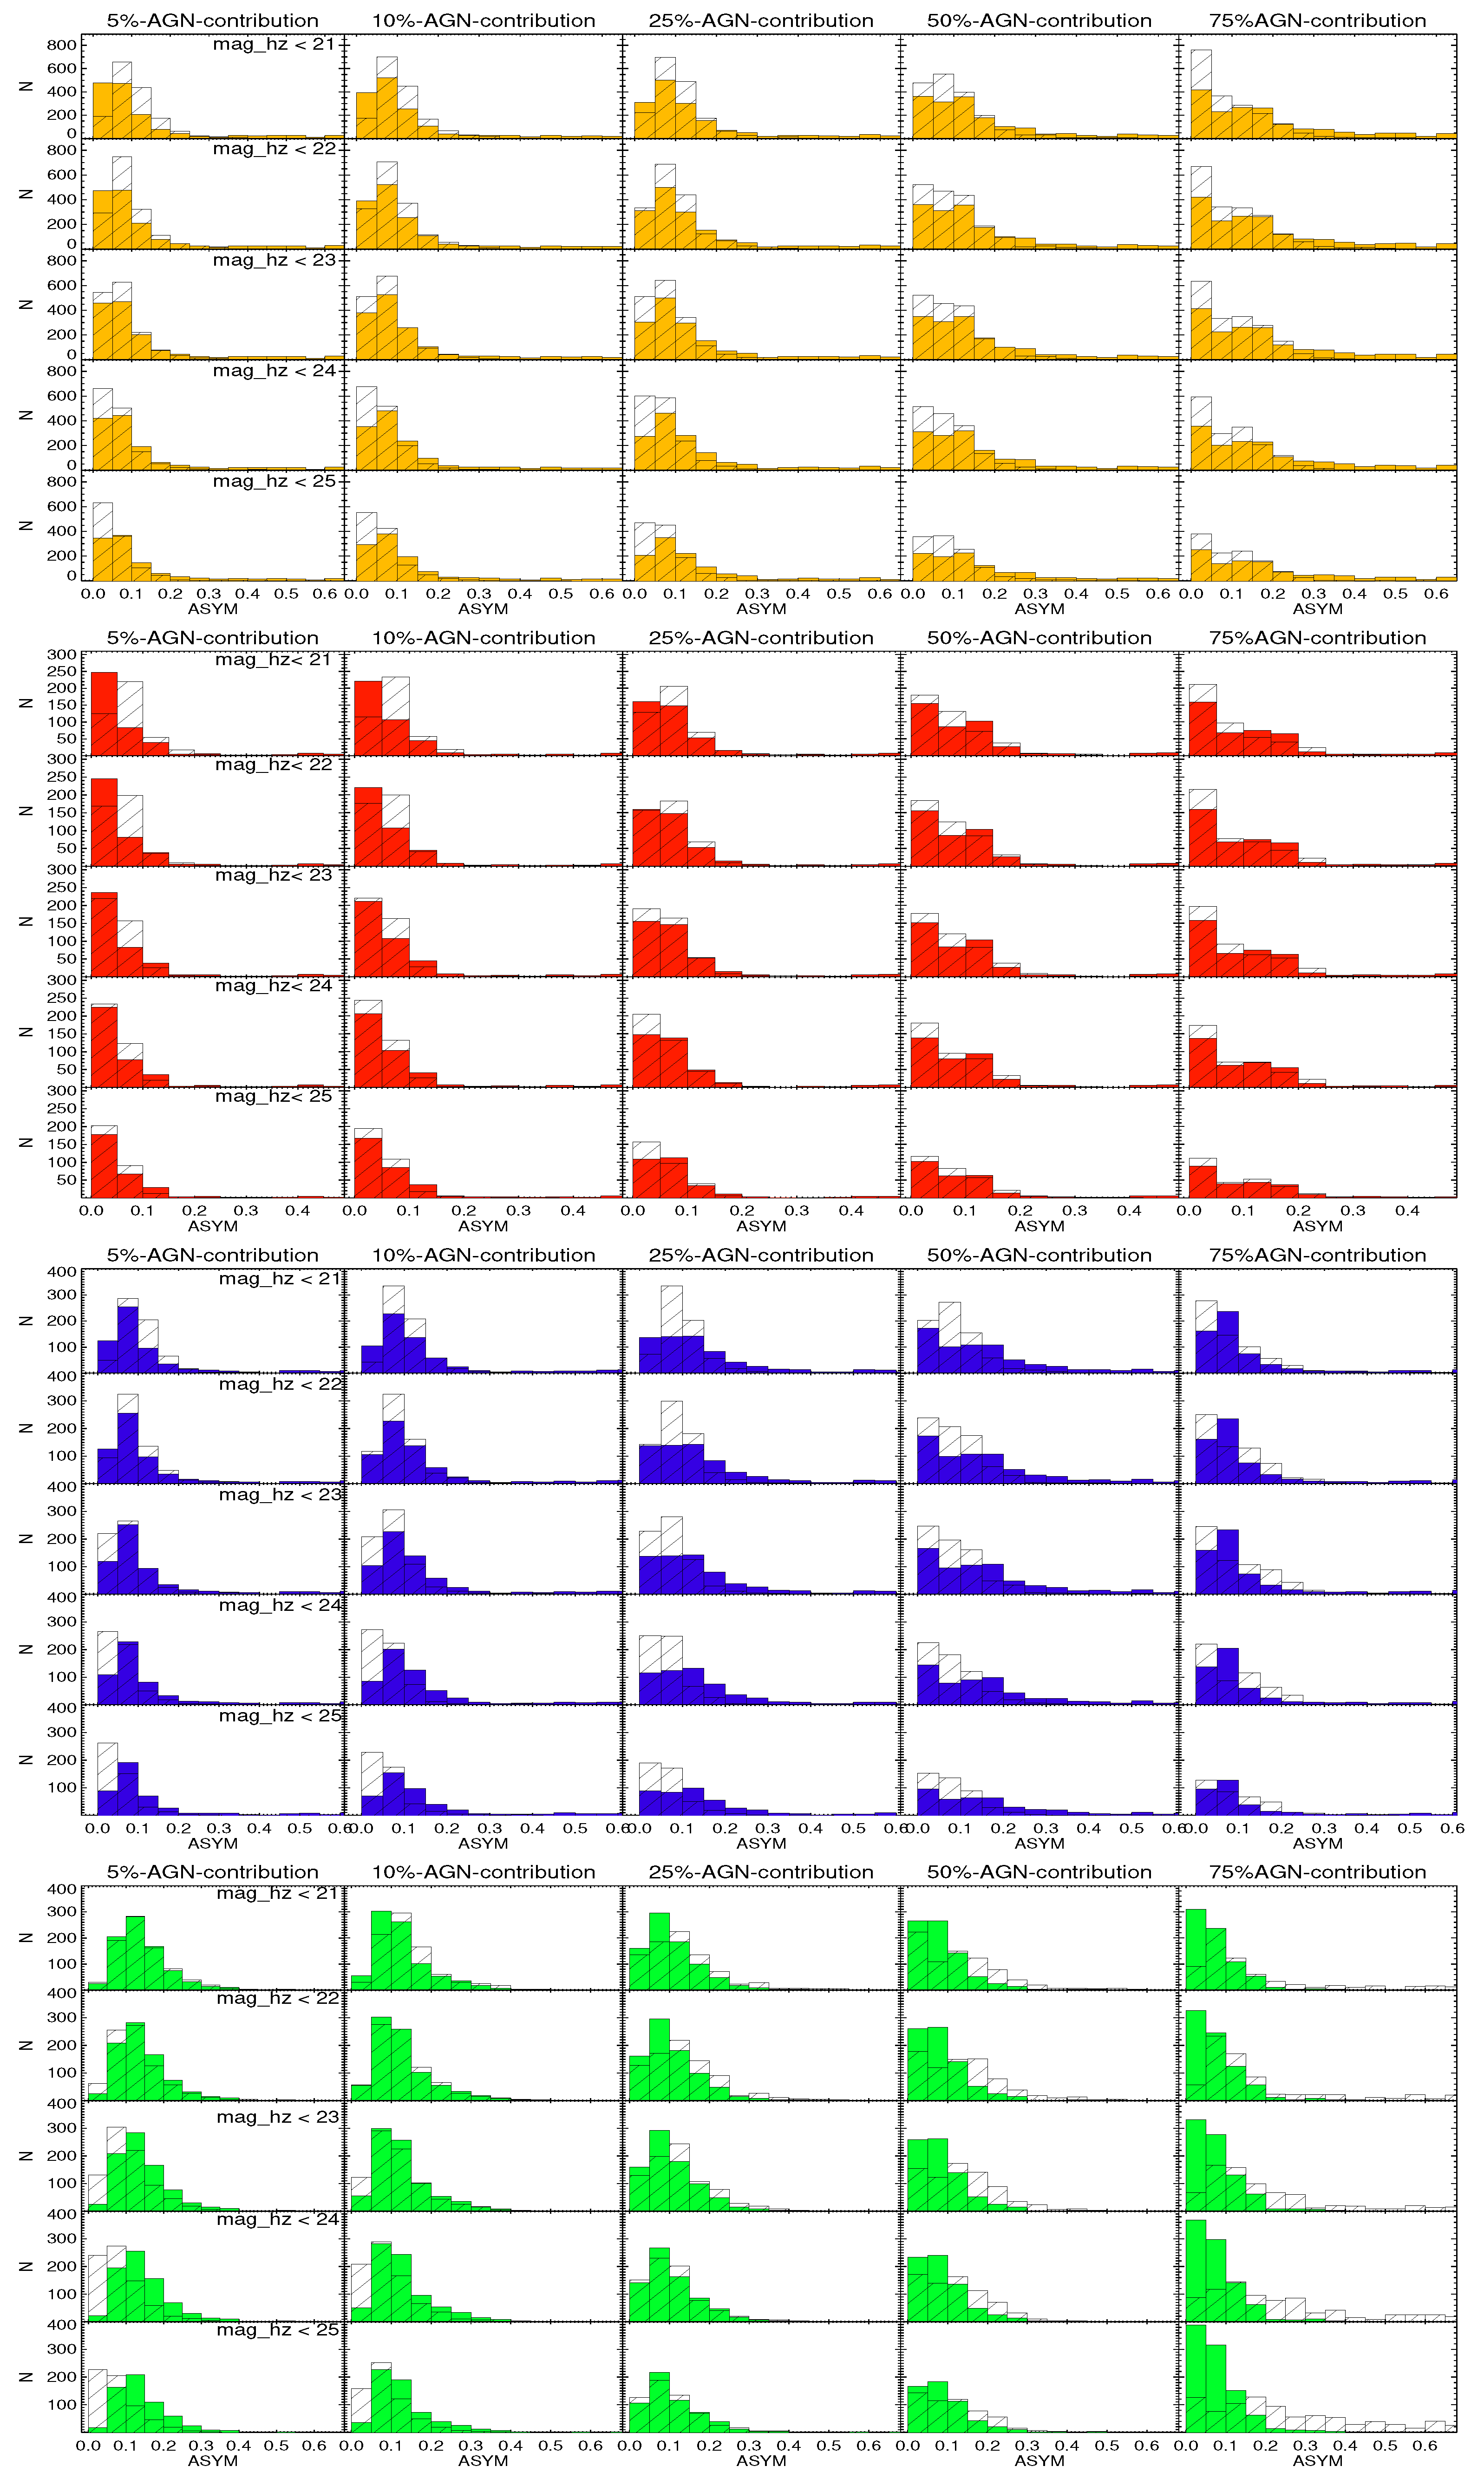
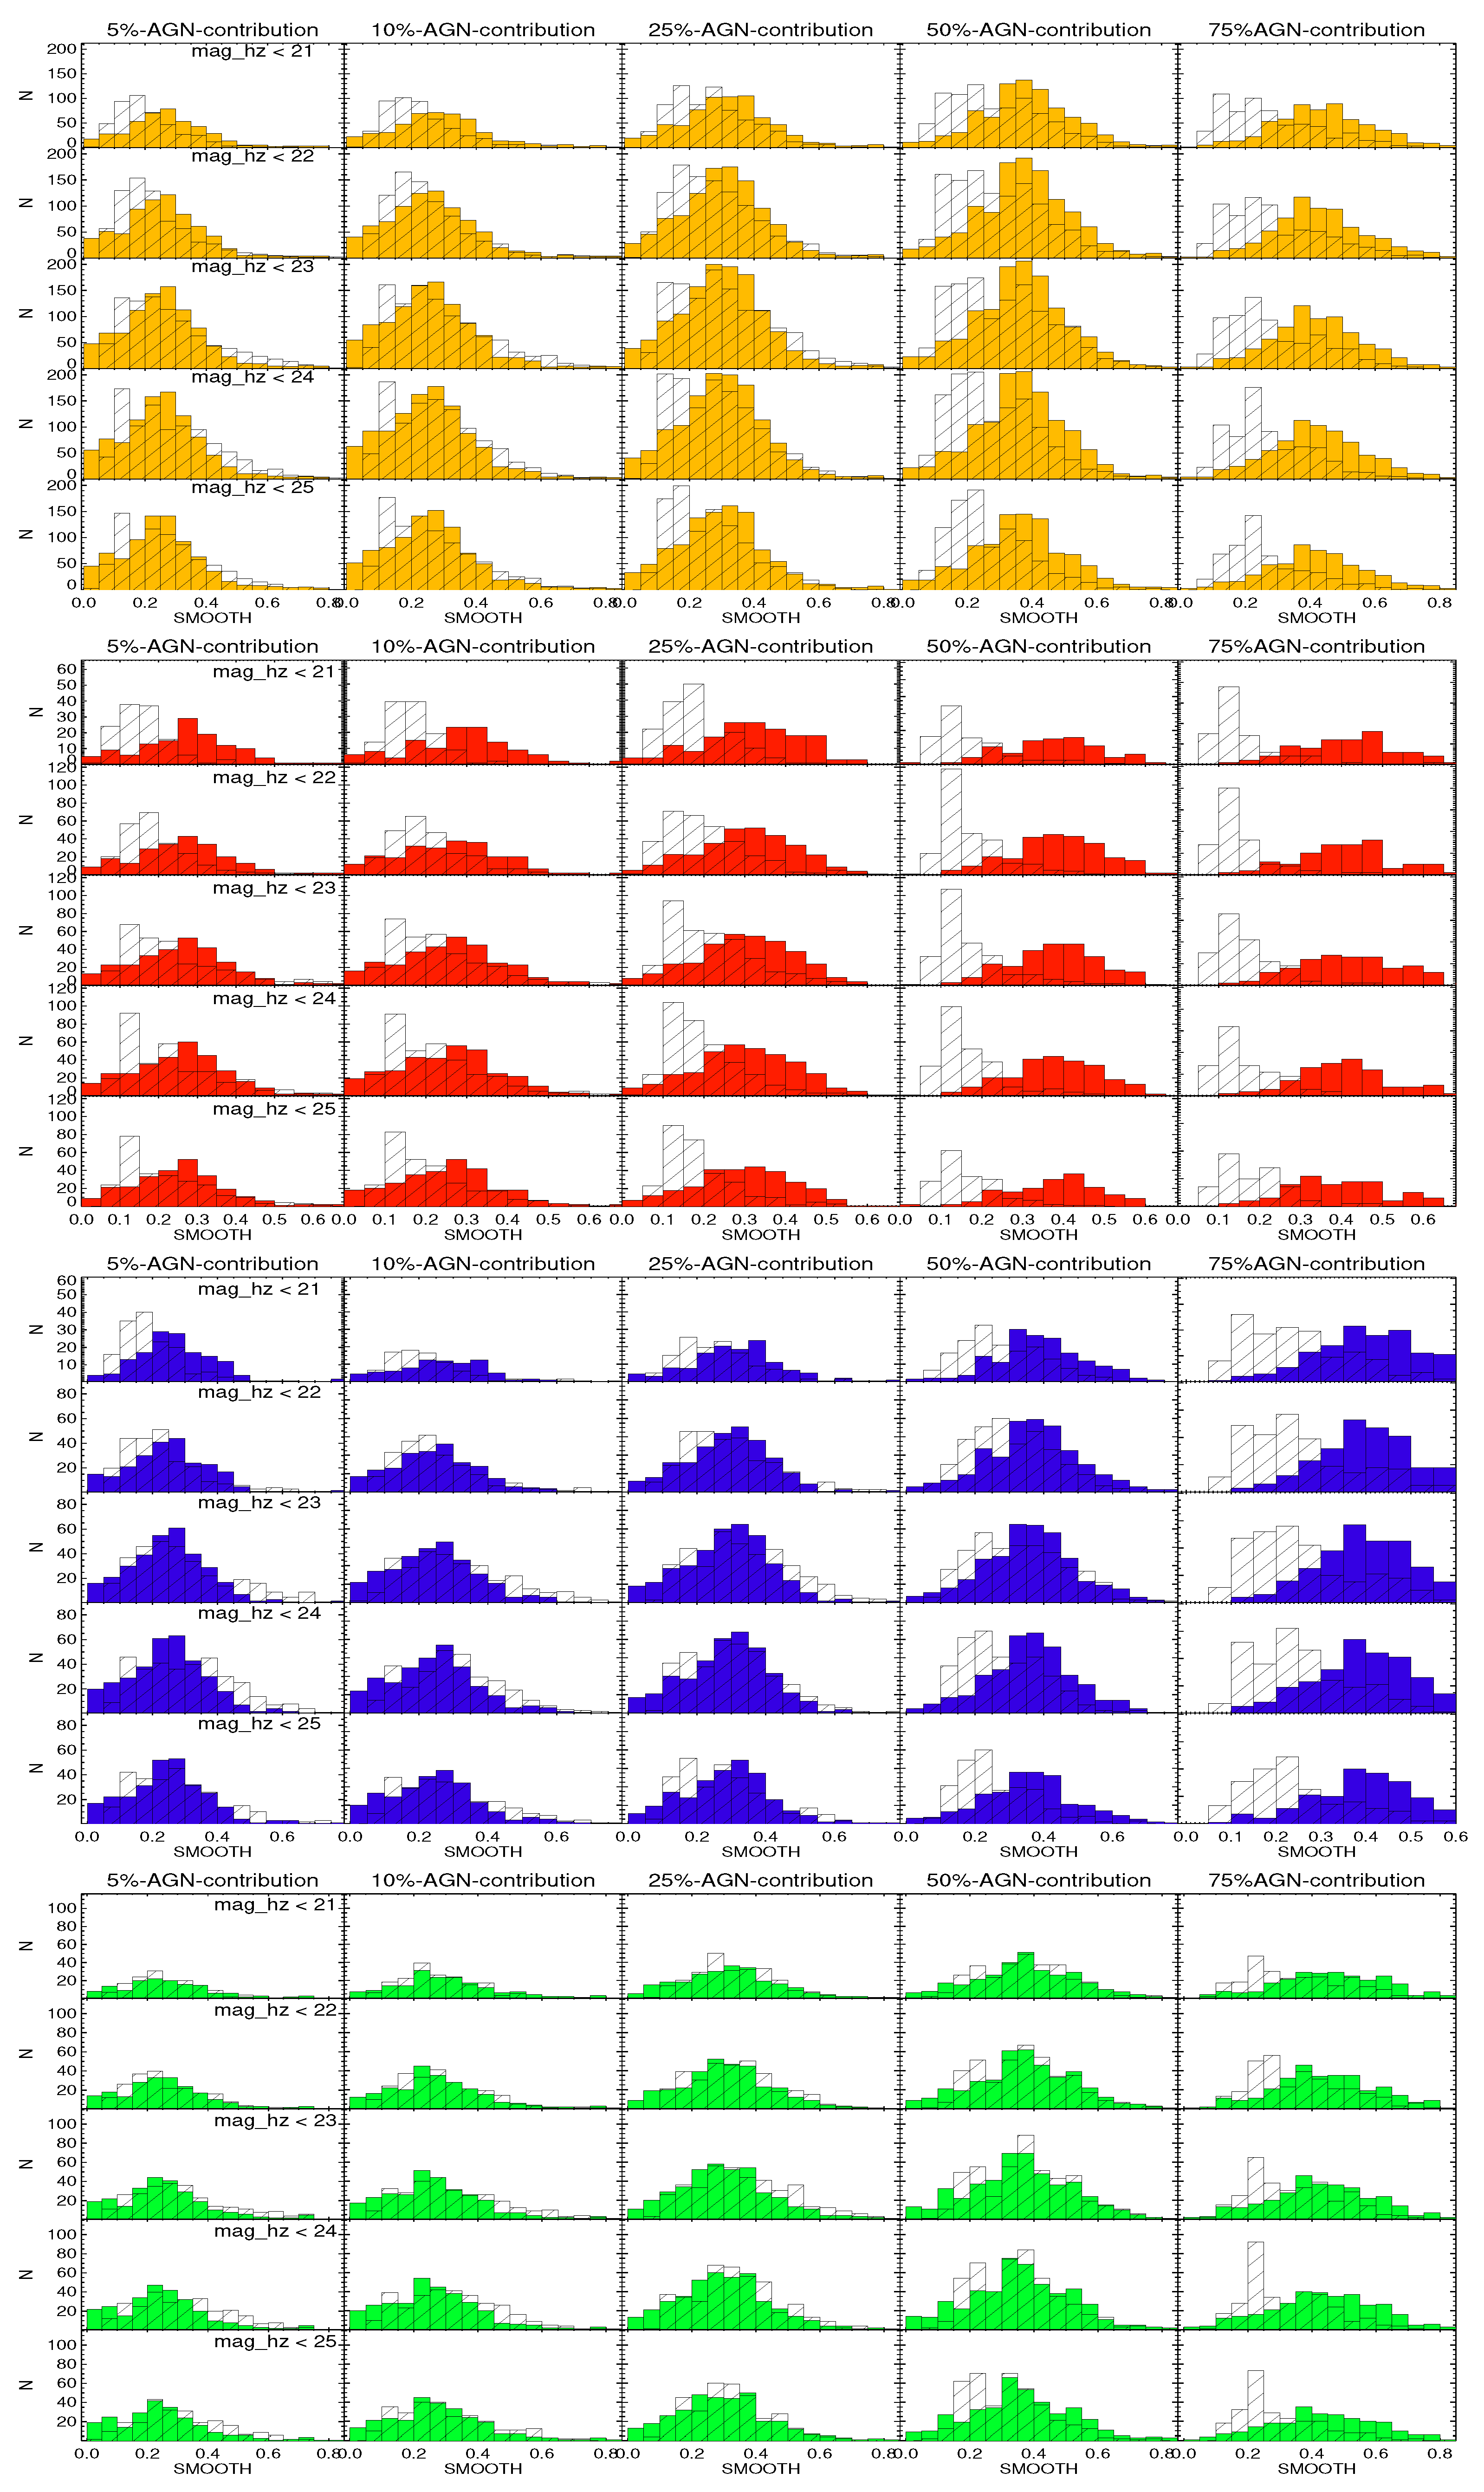
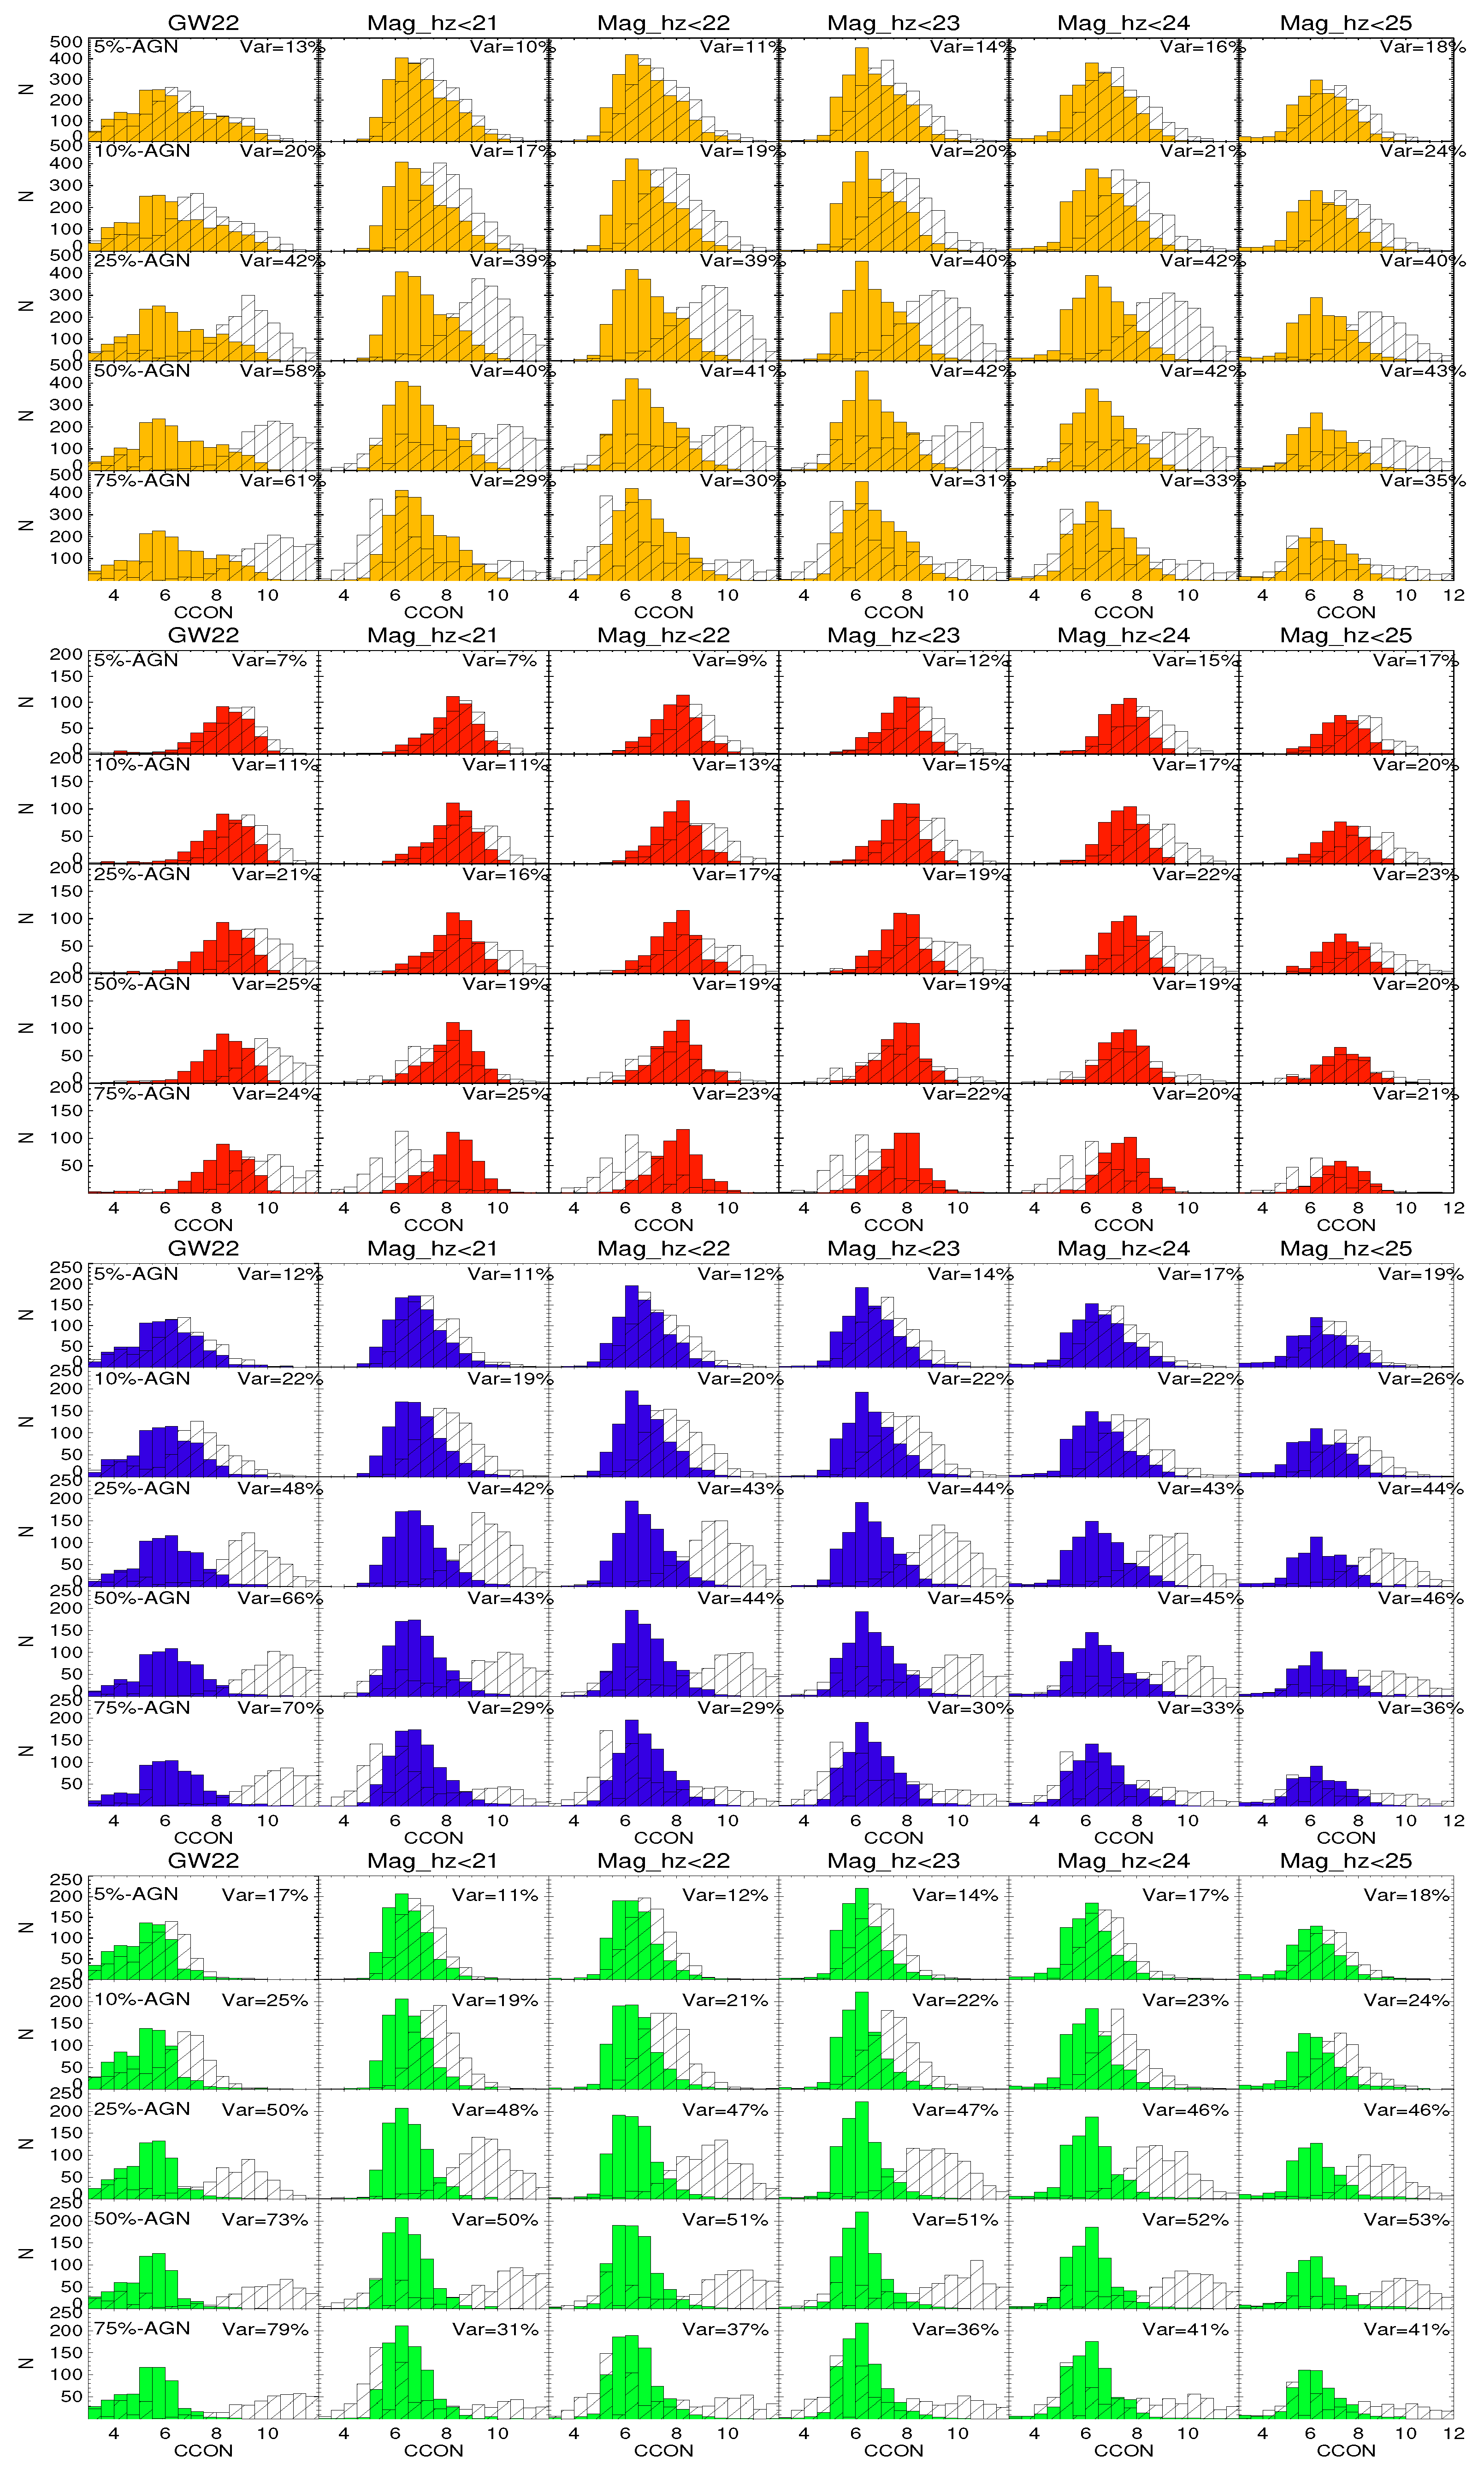
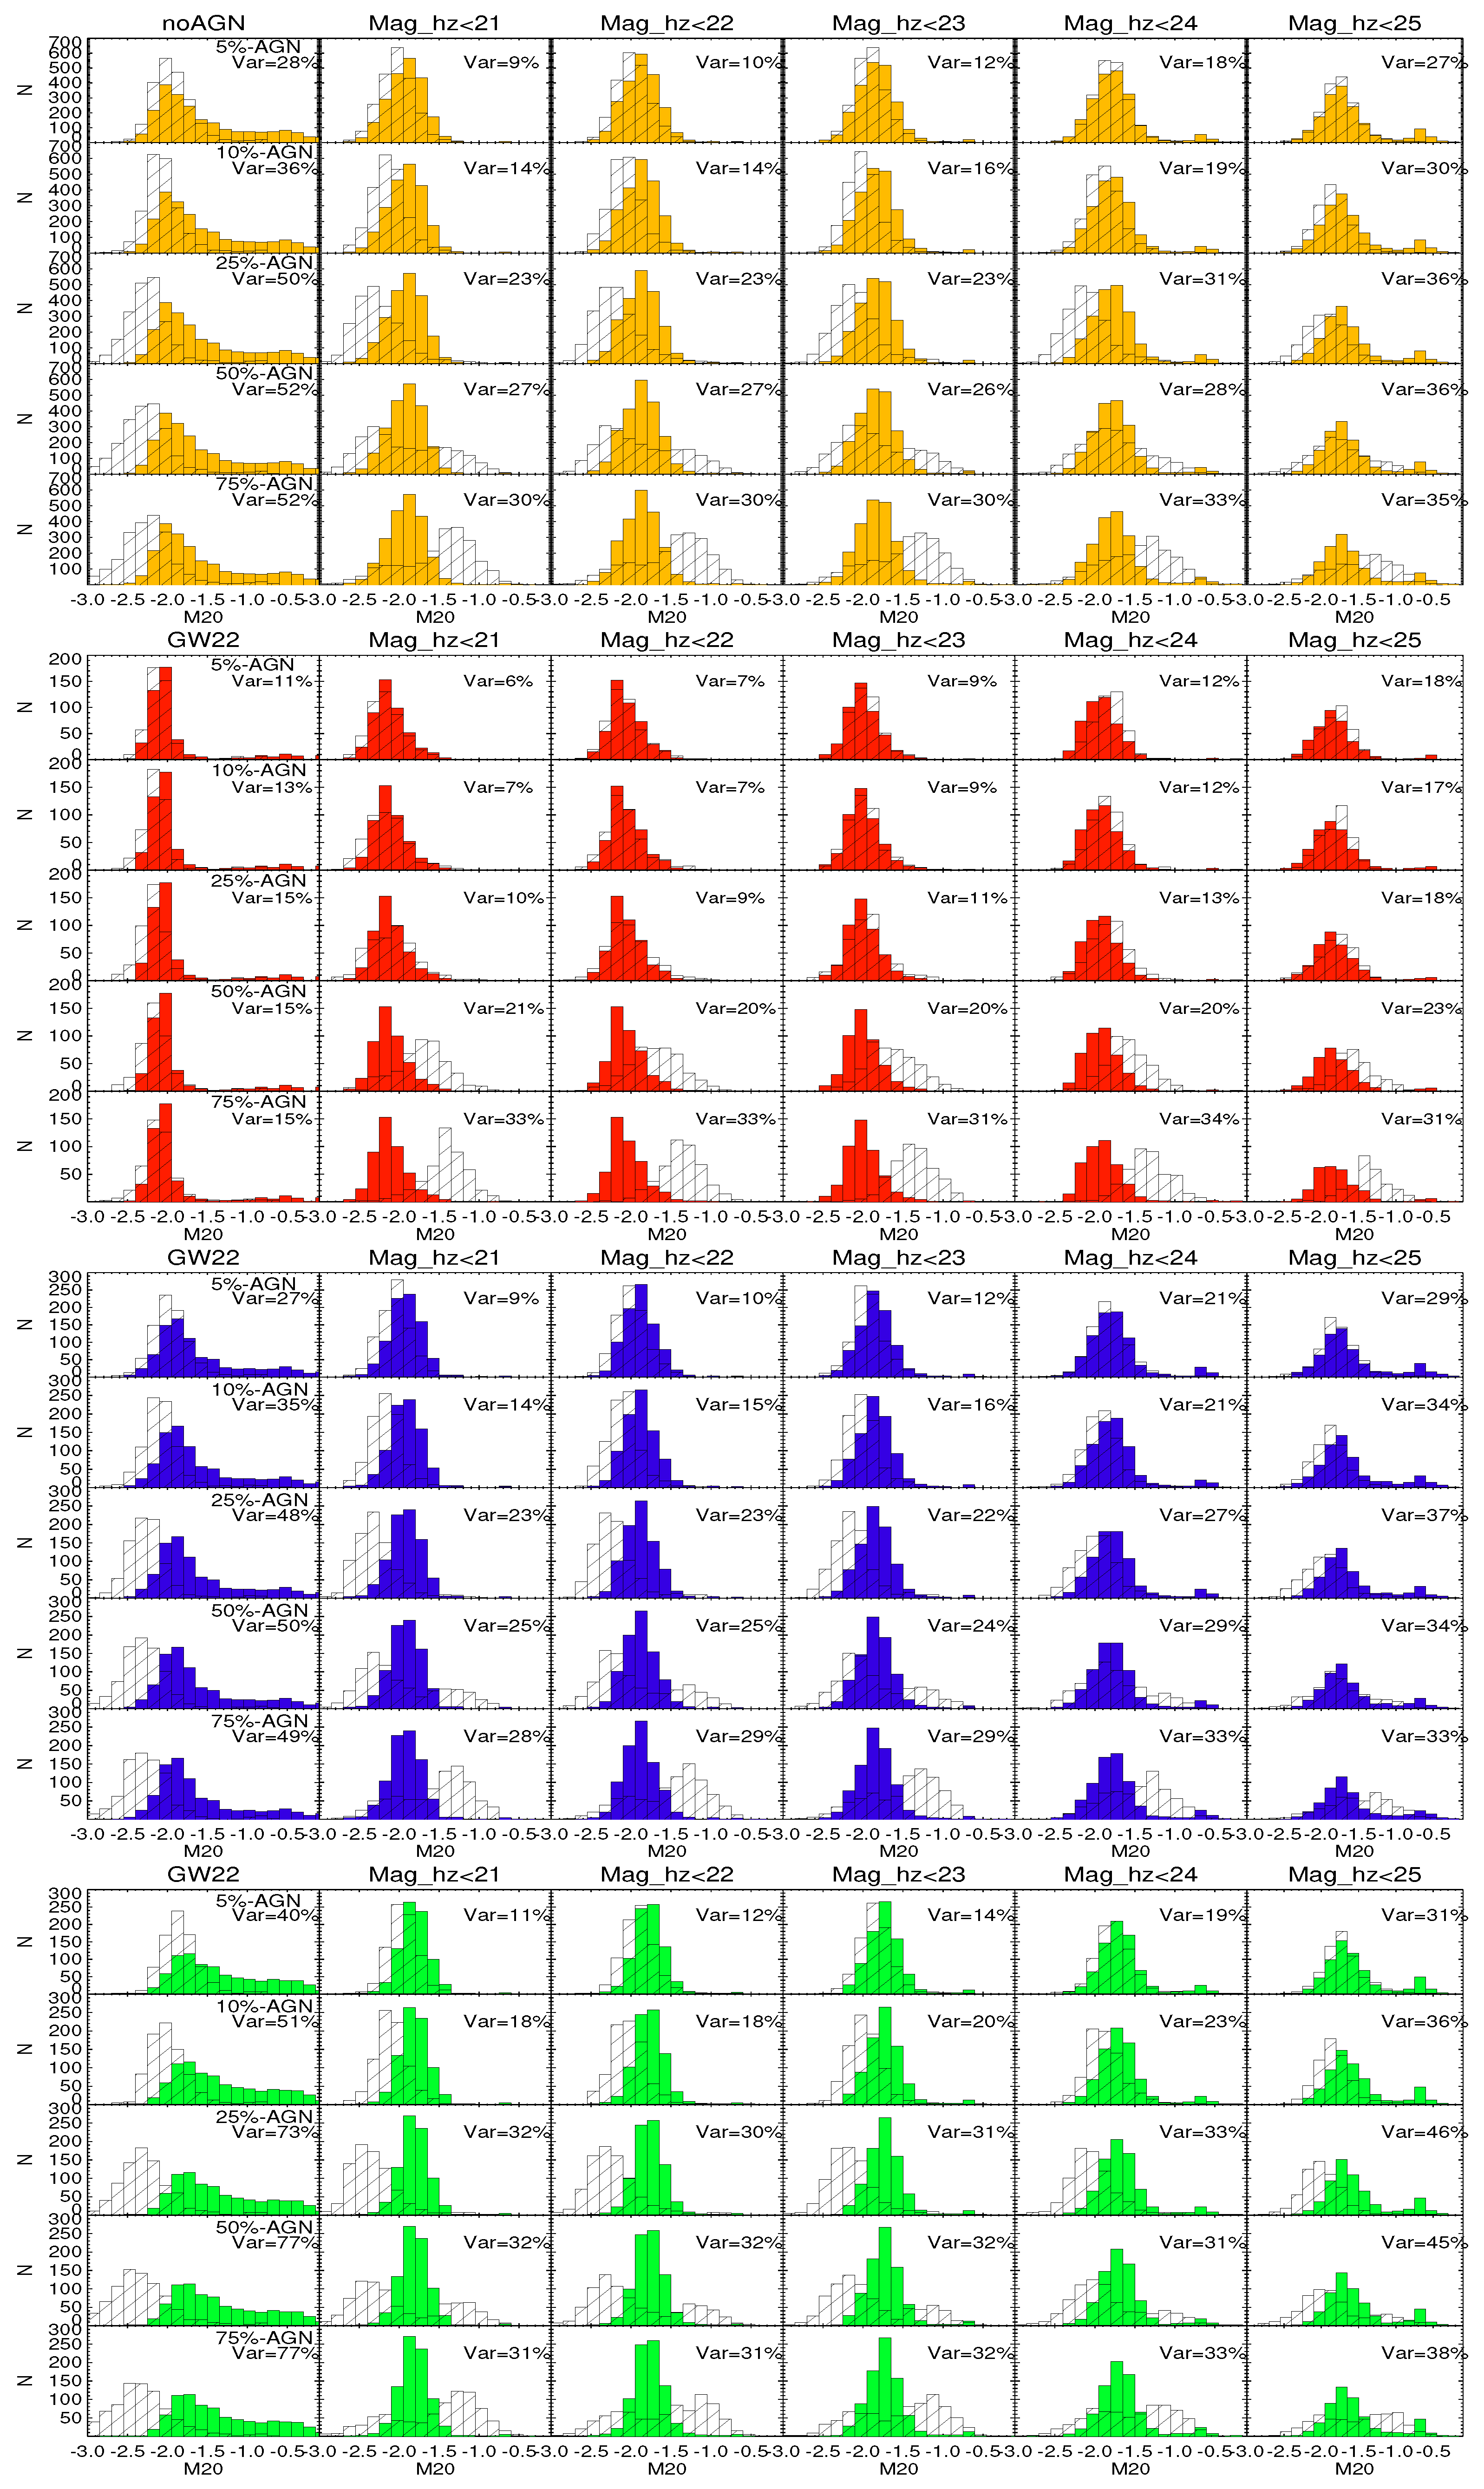
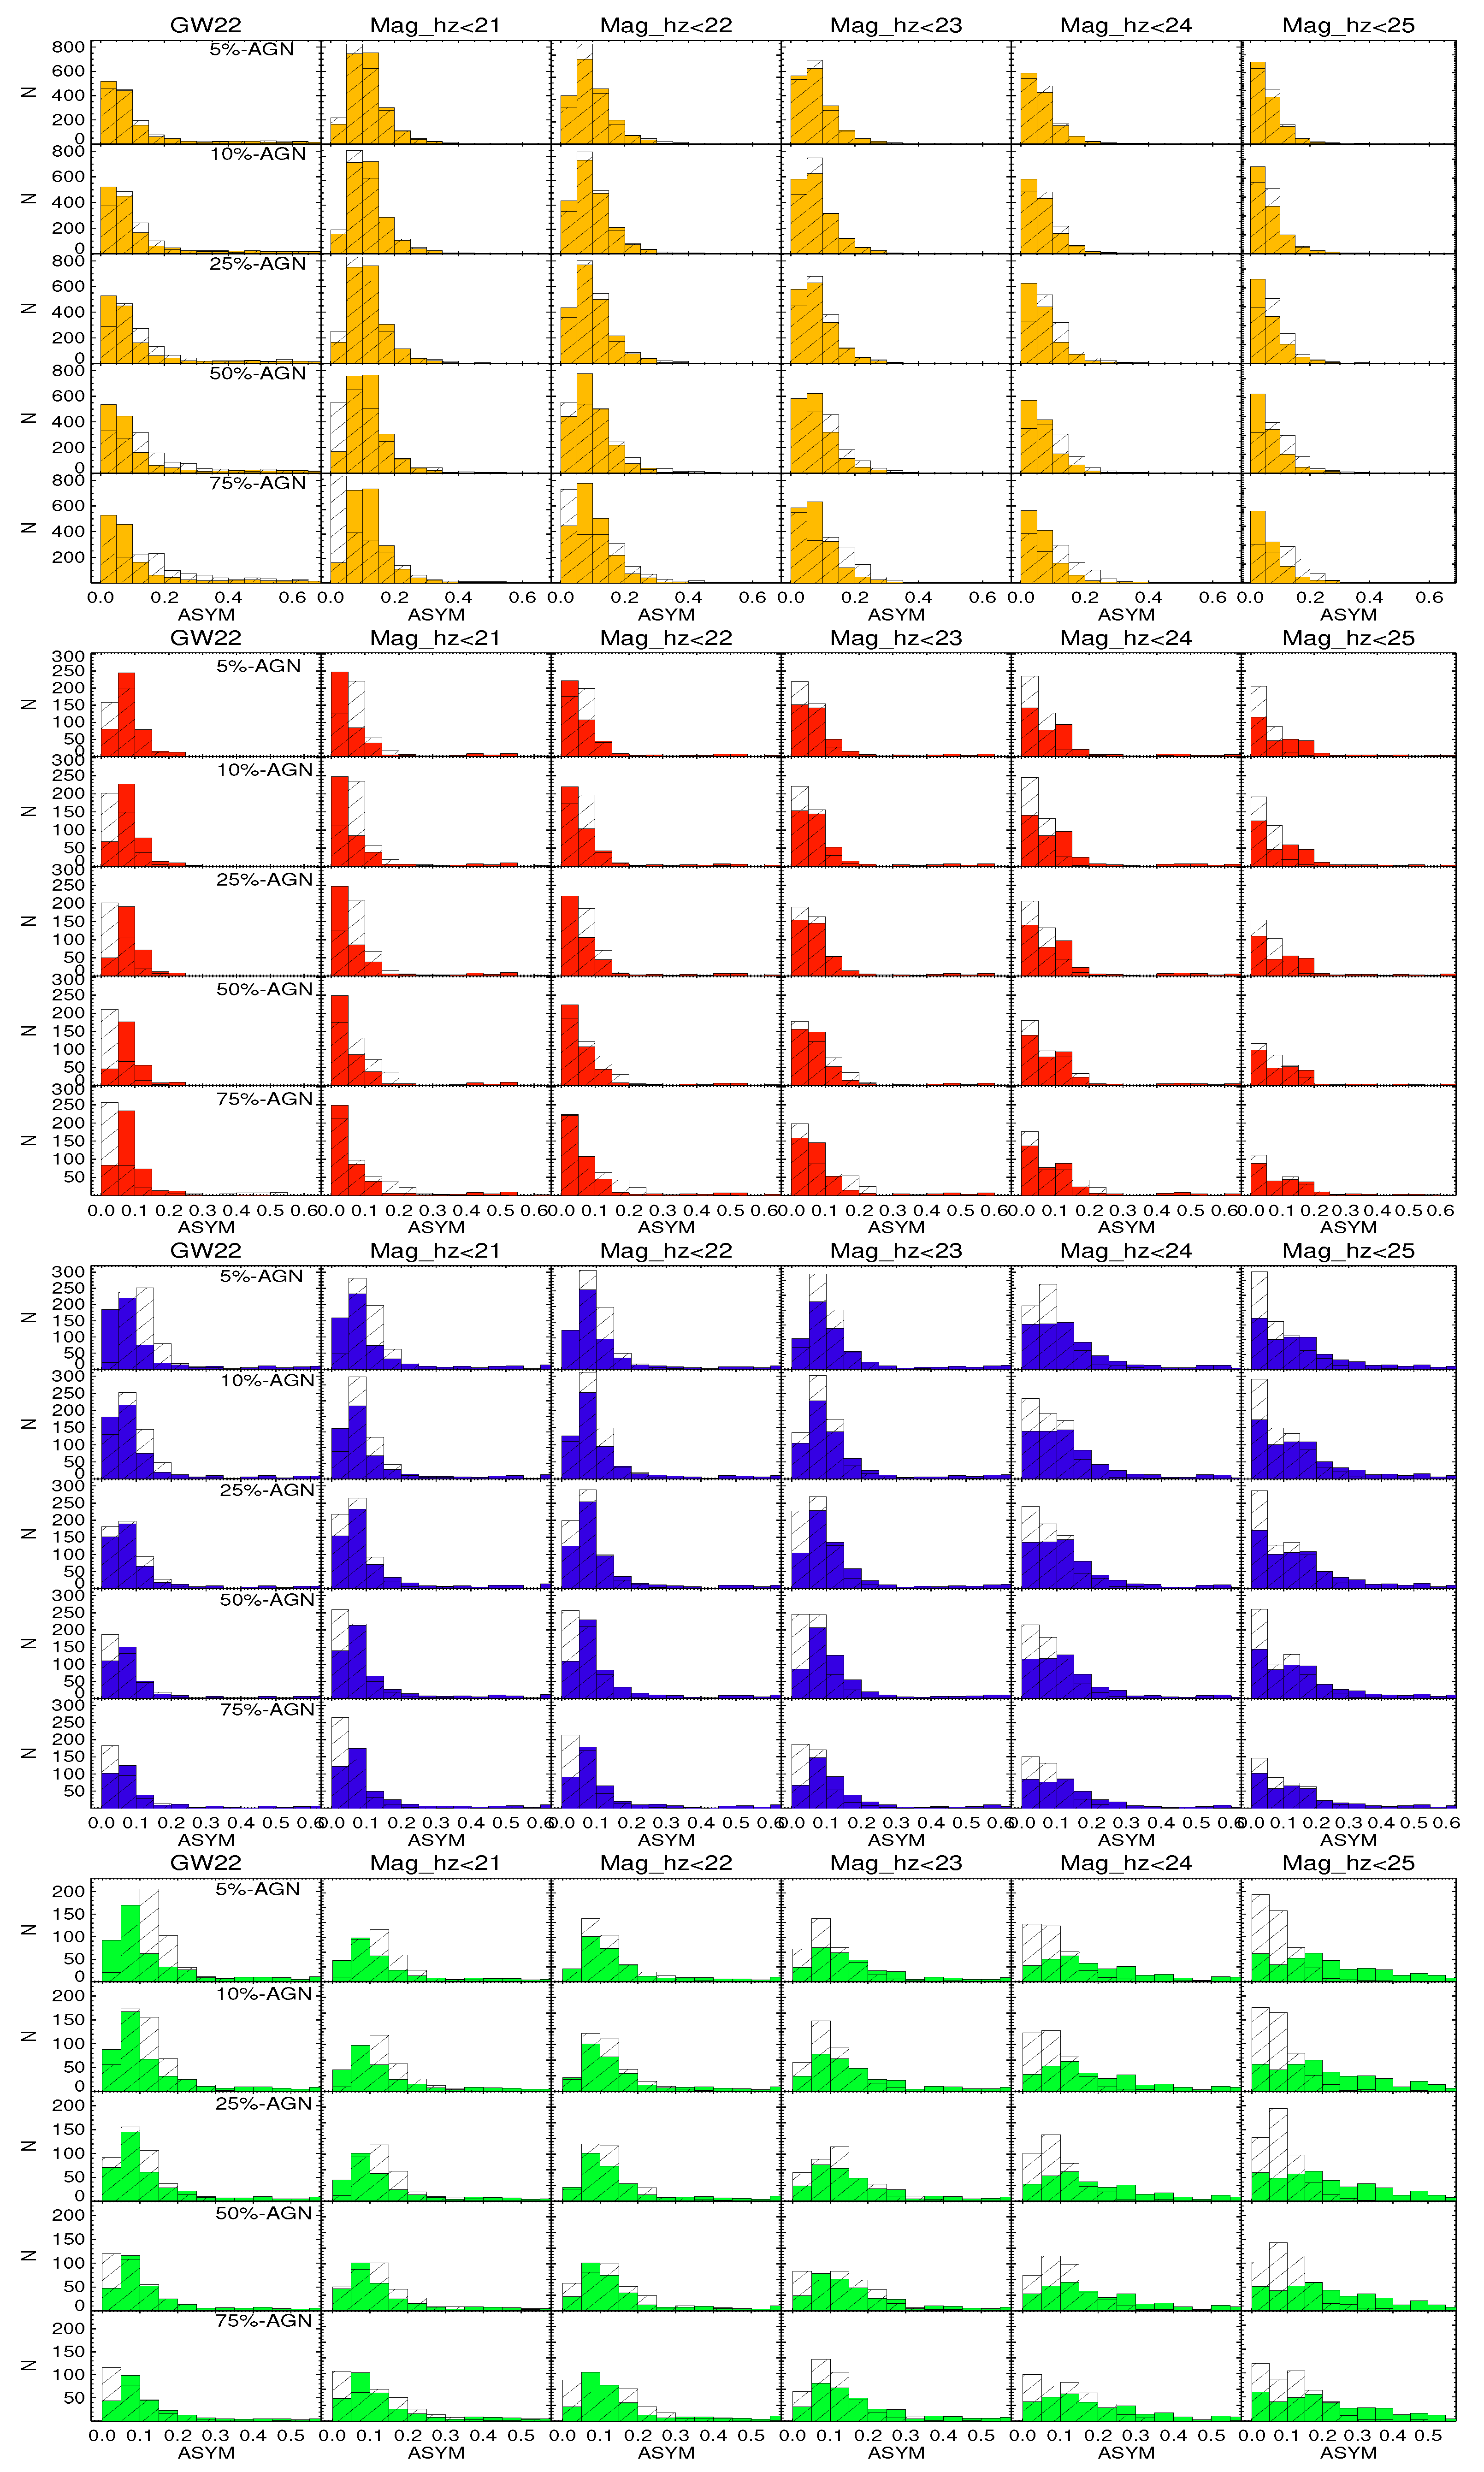
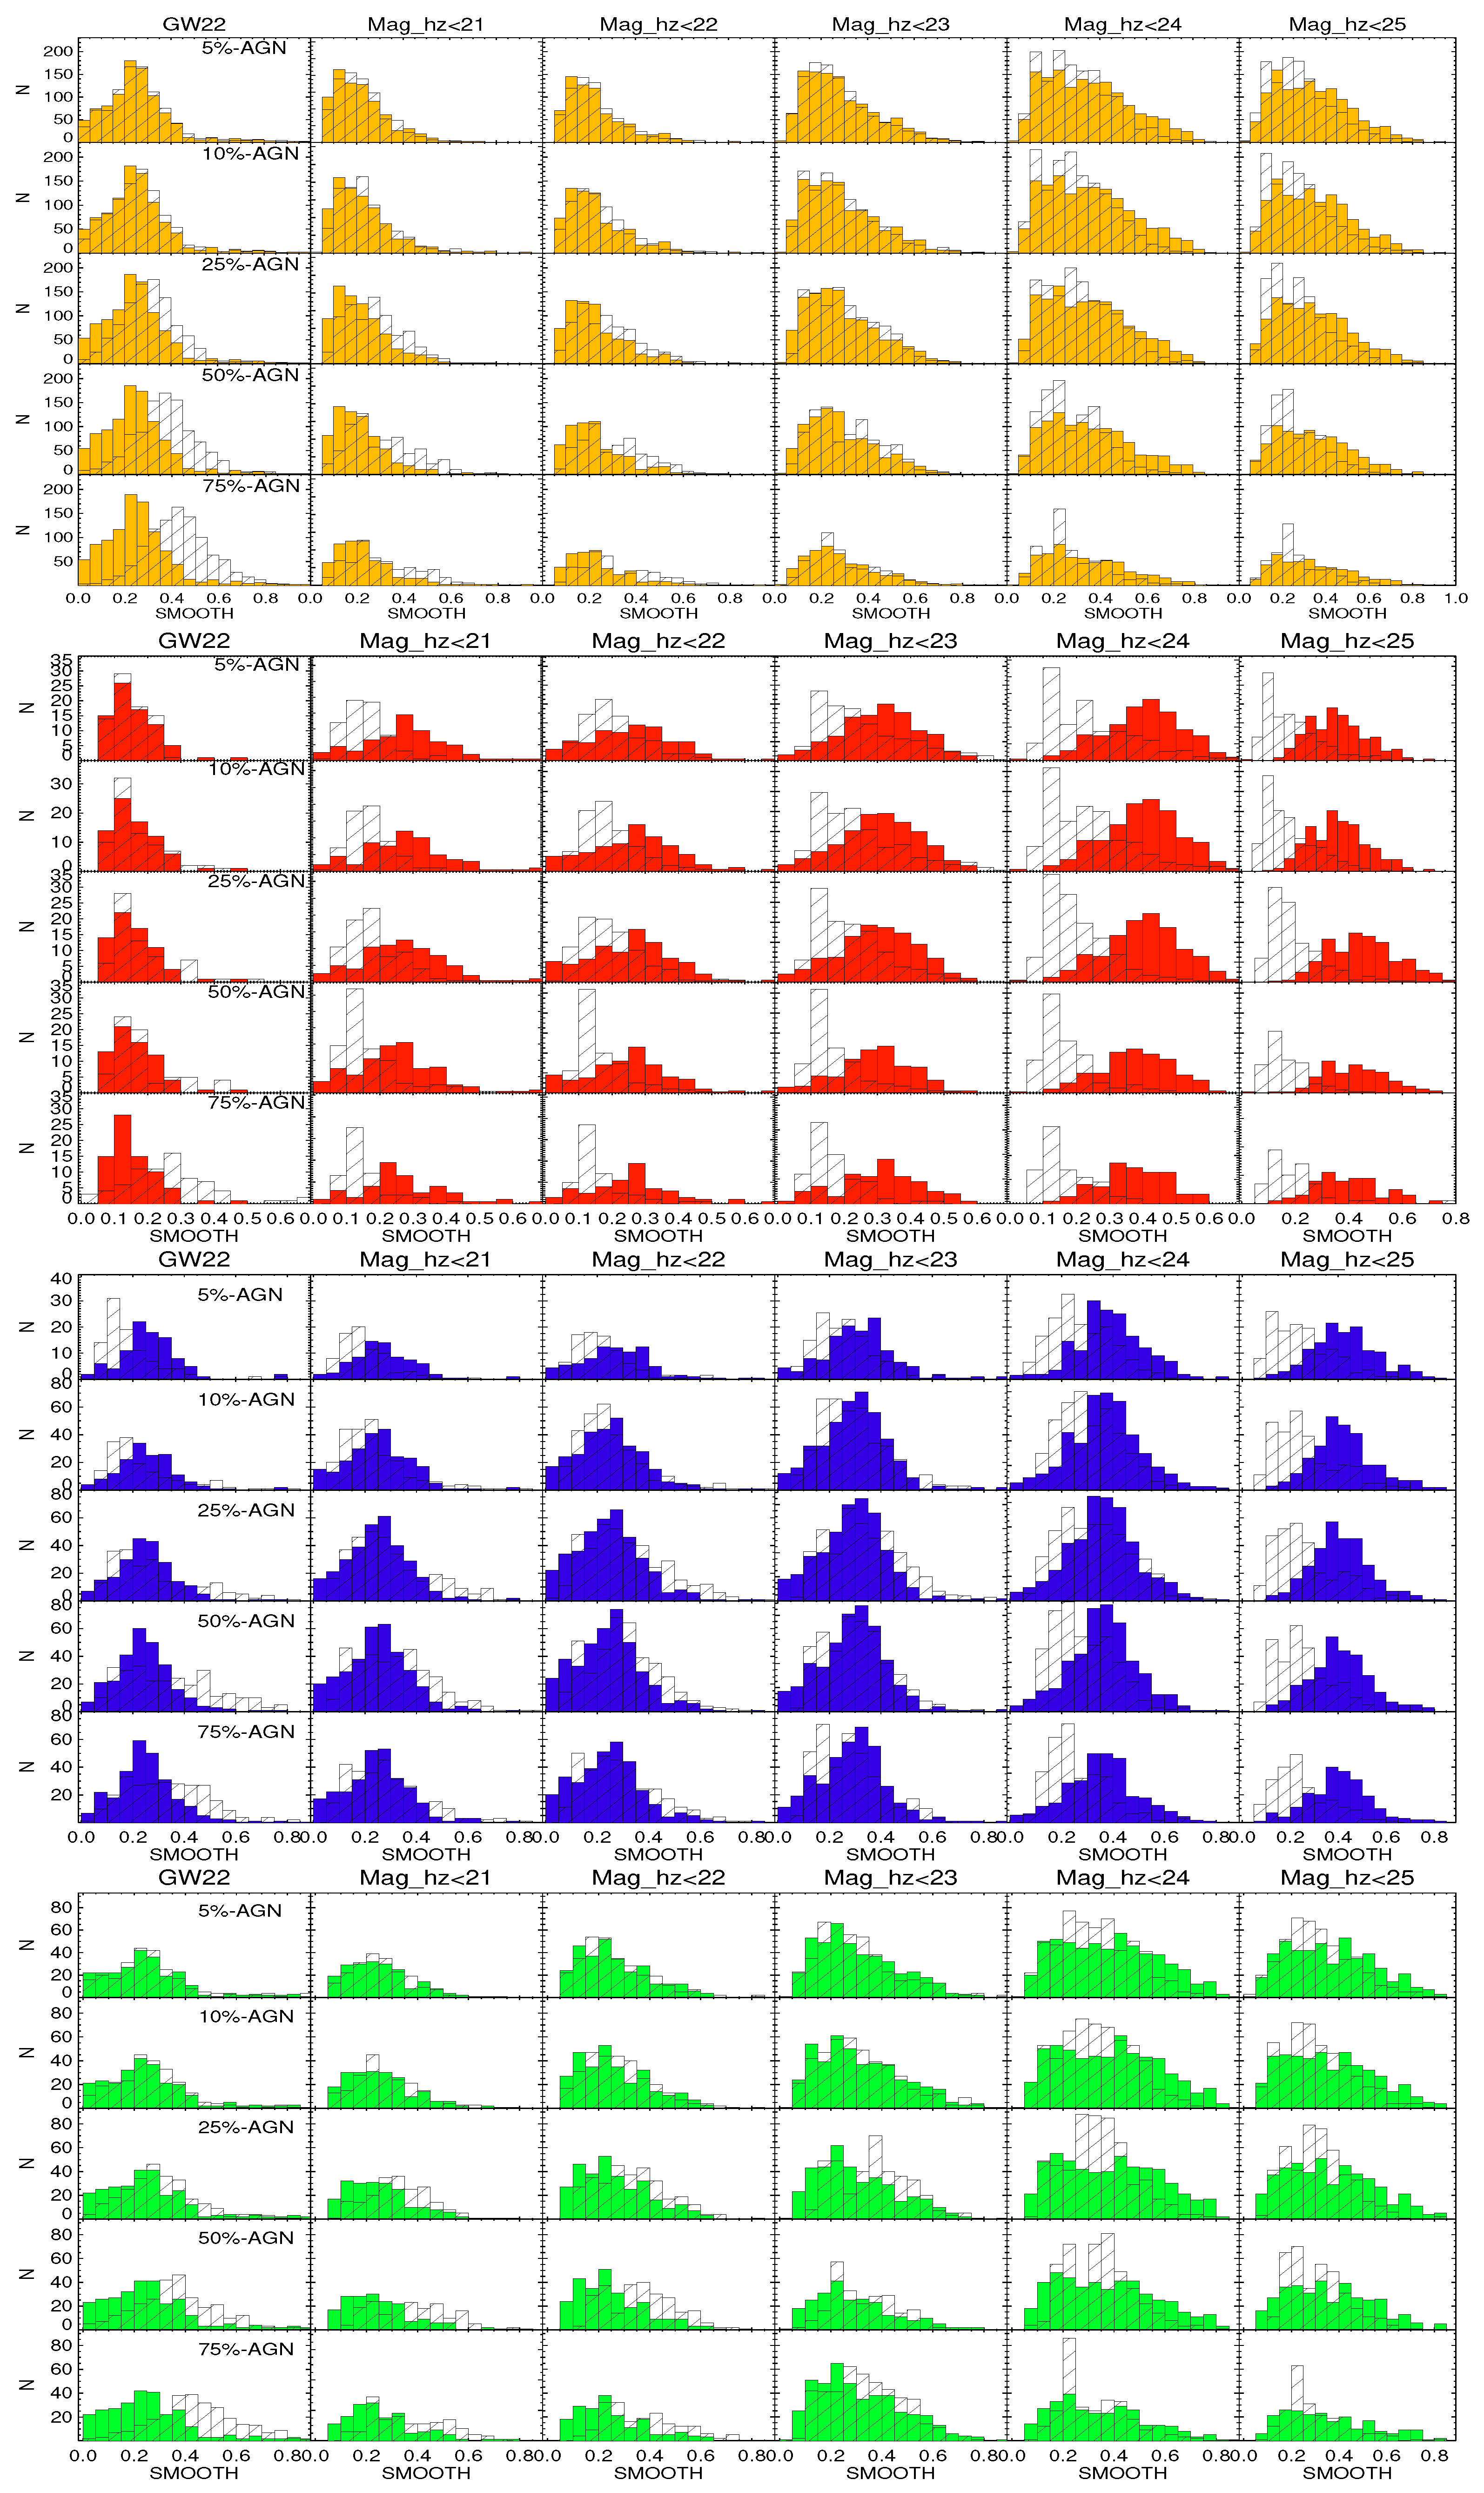
The detailed comparison of the distributions of CABR, GINI, CCON, M20, ASYM, and SMOOTH parameters measured for real and simulated galaxies can be seen in Figure A1, Figure A2, Figure A3, Figure A4, Figure A5 and Figure A6, respectively. For each parameter, we performed all comparisons for a total sample (in orange) of galaxies (regardless of their morphological type), and for three morphological types (early in red, early-spirals in blue, and late-spirals in green), as defined in Section 2, to determine the extent to which the different morphological types are sensitive to the magnitude, redshift, and AGN contribution. In all figures, the filled (colored) histograms show the reference distribution for all comparisons, in this case of the original sample at z ∼ 0 without any AGN added. The open histograms show the simulated galaxies in COSMOS-like conditions, moved to higher redshift and fainter magnitudes from 21 to 25 (rows from top to bottom), with no added AGN (first columns) and with 5 added AGN contributions of 5%, 10%, 25%, 50%, and 75% (from the second to the last columns, respectively).
In all comparisons, we measured the variance (Var) between the parameters obtained for a real non-simulated sample and in COSMOS-like conditions without and with AGN added, to quantify the level of change and to what extent the parameters are affected by the magnitude, redshift, and AGN contribution. The variance is measured as:
V a r [ % ] = 100 / N t o t i ( a b s ( ( P s i m i P o r i g i ) / P o r i g i ) ) ,
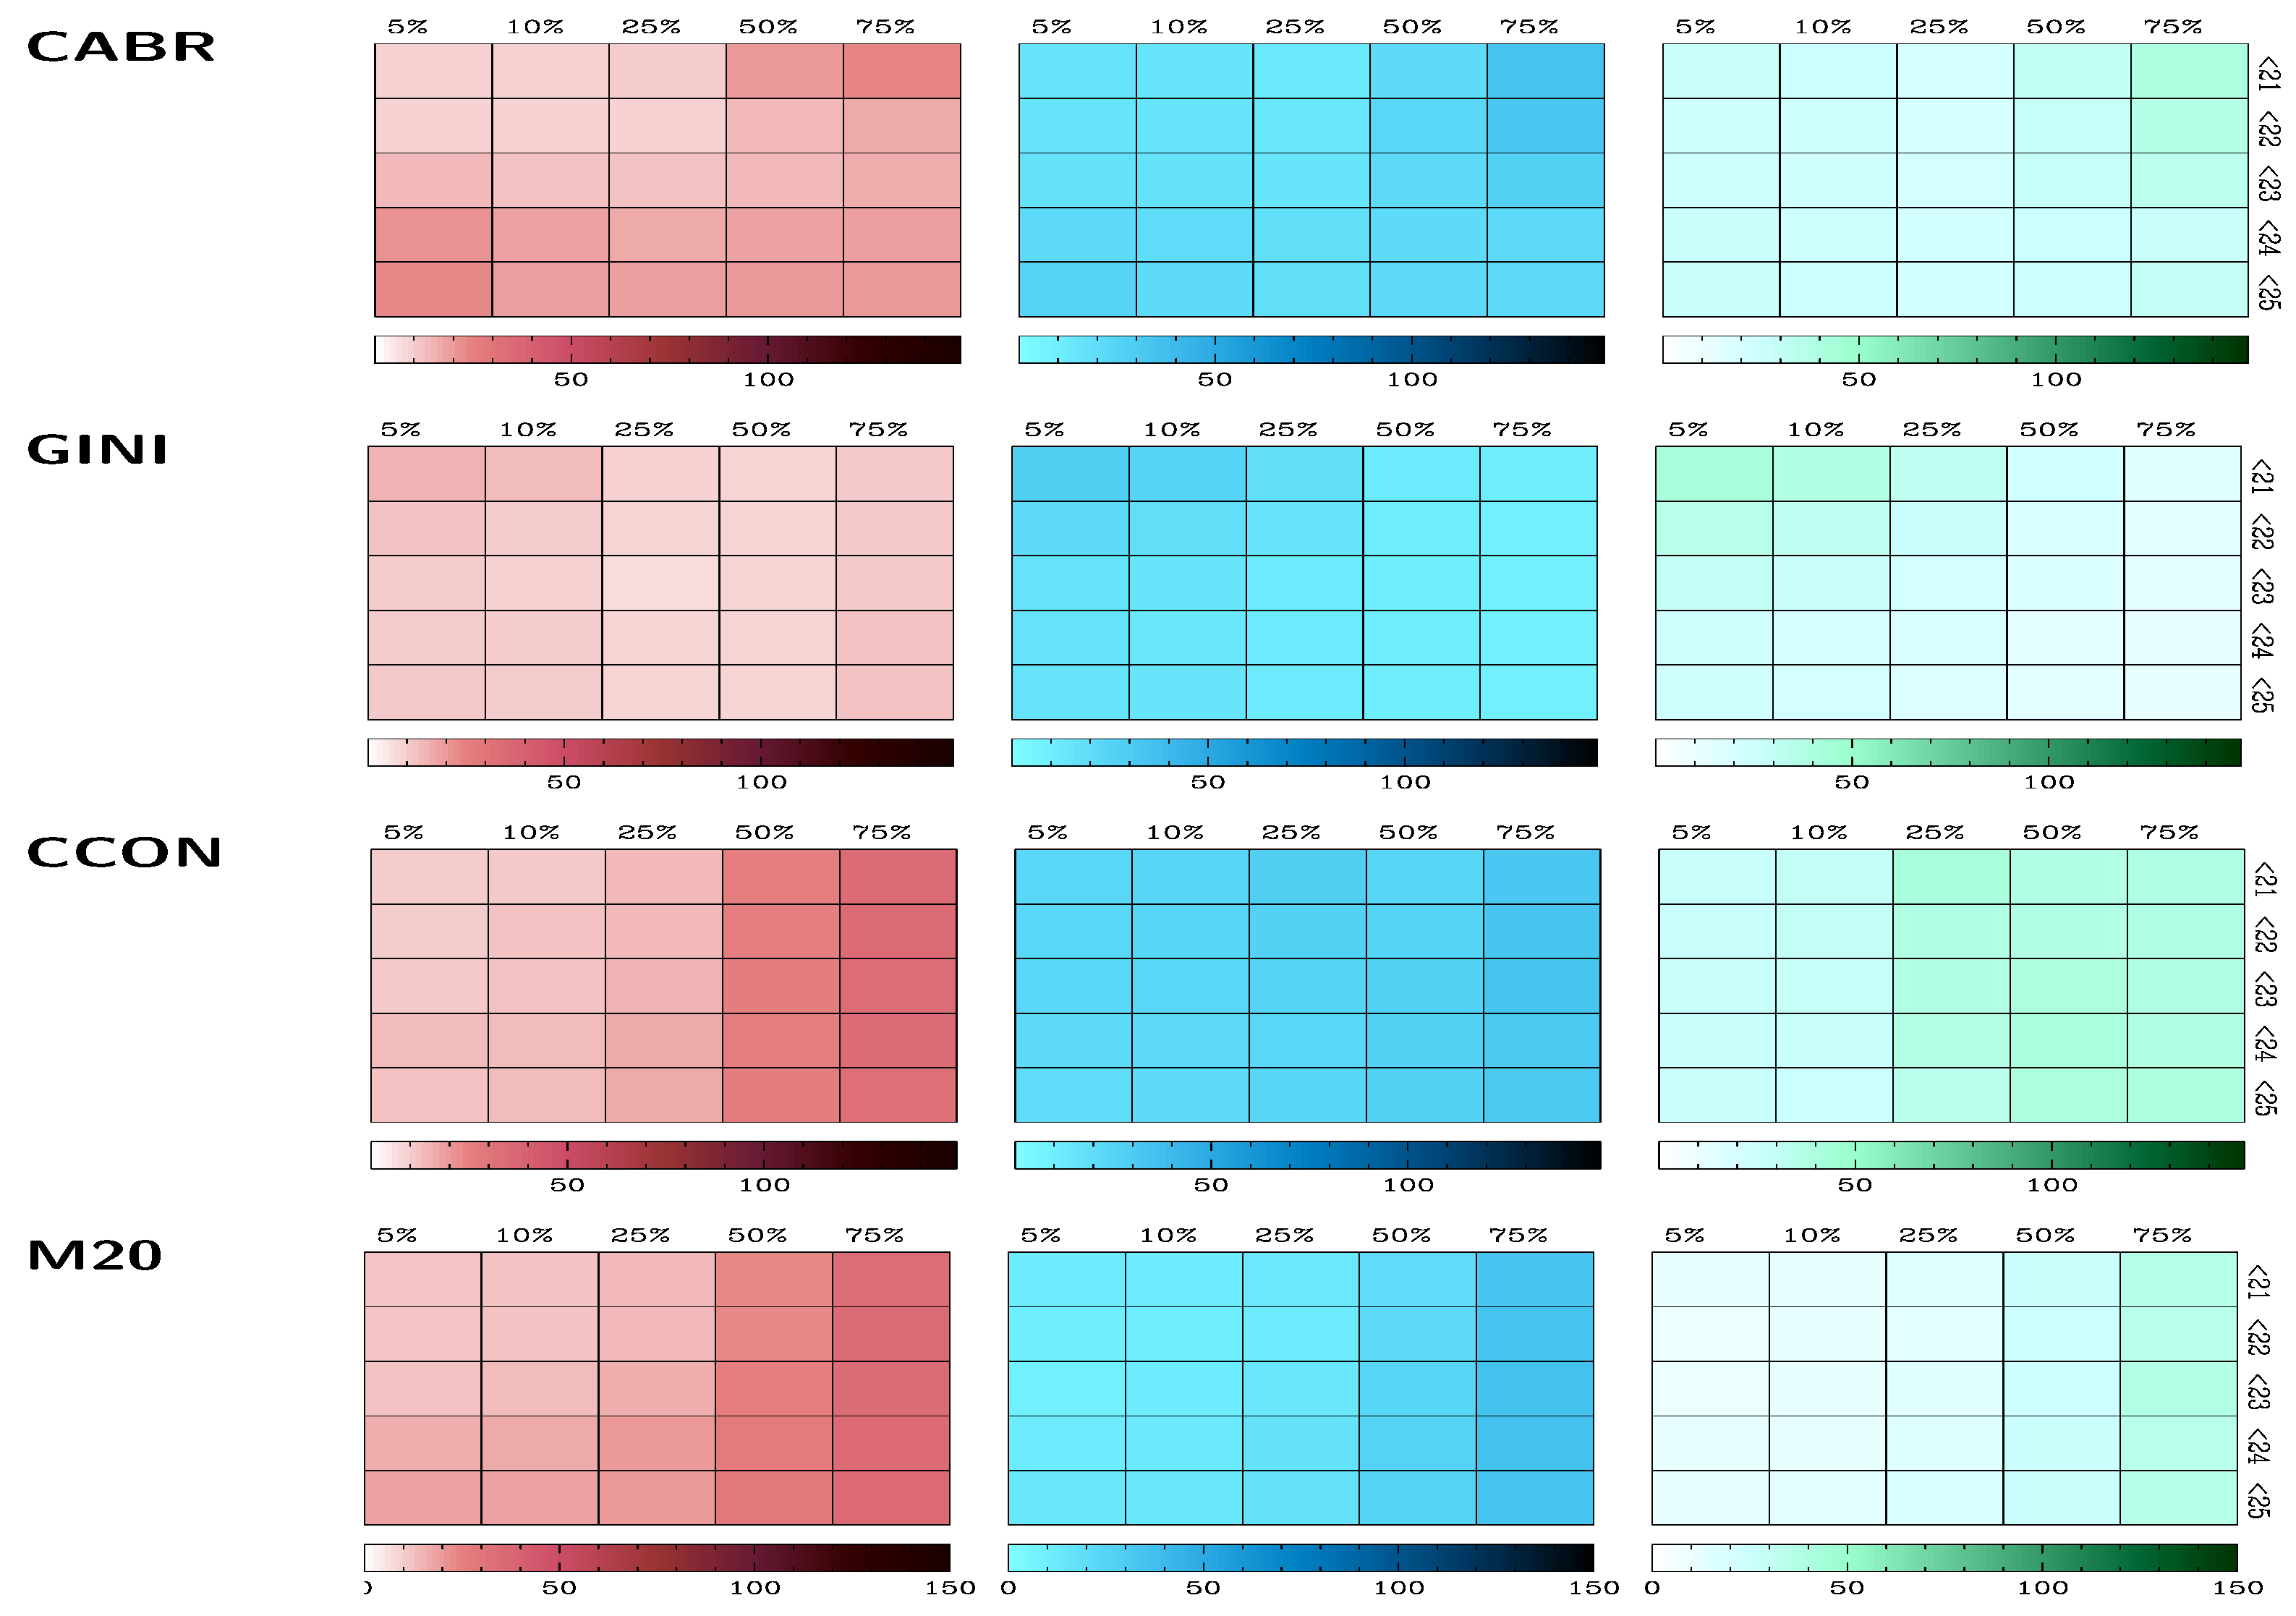
where P s i m i and P o r i g i are the values of the corresponding simulated and original parameters of individual galaxies, respectively, while N t o t is the total number of galaxies for which the parameter has been measured. In line with [38,53], we consider that parameters are significantly affected by AGN contribution and/or magnitude/redshift when Var is ≥20%. Figure 4 shows the variance in the CABR, GINI, CCON, and M20 parameters (from top to bottom), of early (left, red), early-spiral (centre, blue), and late-spiral (right, green) galaxies between the original sample at z ∼ 0 with no AGN added and in COSMOS-like conditions with AGN contribution between 0% and 75% (from left to right in each subplot) and high-redshift magnitudes (mag_hz) from mag _ hz < 21 to mag _ hz < 25 (from top to bottom in each subplot). The measured Var values are also indicated in each graph in Appendix A. Note that Equation (1) has difficulties when dealing with very low parameter values close to 0, as is often the case for the ASYM and SMOOTH parameters. For these two parameters, the variances are not included in the figures, but they are discussed below and in Section 5.
Figure 4. Change (Var) in CABR, GINI, CCON, and M20 parameters (from top to bottom) when comparing the original sample at z ∼ 0 with no AGN added and the simulated sample at COSMOS-like conditions without AGN and with five AGN contributions added from 5% to 75% (from left to right in each panel), at mag _ hz < 21, mag _ hz < 22, mag _ hz < 23, m a g _ h z mag _ hz < 24, and mag _ hz < 25 (from top to bottom rows in each panel). The comparison is given for early-type (left, in red), early-spiral (centre, in blue), and late-spiral (right, in green) galaxies. For the ASYM and SMOOTH parameters, the variances are not included in the figure, but they are discussed in the text (see Section 4.1 and Section 5).
Galaxies 13 00084 g004
In general, the number of sources of all morphological parameters is decreasing from brighter to fainter magnitudes and from lower to higher AGN added contributions, as it becomes more difficult to measure morphological parameters. In the case of the concentration parameters (CABR, GINI, CCON, and M20), in general, >90% of the sources have well-measured parameters, except for the faintest magnitudes of mag _ hz < 24 and mag _ hz < 25, and for the largest added AGN contributions of 50% and 75%, when the number of sources with measured parameters drops to 60–70% of the total sample, with spirals being more affected than early-type galaxies. On the other hand, the measurements of the ASYM and SMOOTH parameters are more complicated. When considering the total sample at z ∼ 0 with no AGN added, we only obtained reliable values for 75% and 45% of the sources, respectively. These numbers are as low as 50% and 20%, respectively, under COSMOS-like conditions when considering the faintest magnitudes and the largest AGN contributions.
For comparison, we show the impact of magnitude and redshift without adding any AGN contribution. This is represented in the first columns of Figure 4, and corresponds to the case of normal galaxies in COSMOS-like conditions. We can see that only the early-type galaxies are not affected in COSMOS-like conditions, showing for all the parameters Var ≲ 20%, while spiral galaxies (both early and late) are significantly affected in the case of all 5 magnitude/redshift limits, showing the change in all parameters above 20%. The results obtained here are in agreement with those of [37], where the effect of resolution and survey depth has been studied in three different surveys, including COSMOS. In both works, the same trends were obtained for all parameters with similar variances for all morphological types. In this work, we can also see that the morphological parameters of normal galaxies are more affected by magnitude and redshift in COSMOS-like conditions than active galaxies, as discussed in Section 5.
Here we briefly discuss the impact of magnitude, redshift, and AGN, all combined, on the six morphological parameters, as shown in Figure 4, Figure A1, Figure A2, Figure A3, Figure A4, Figure A5 and Figure A6:
CABR. In Figure 4 (top panels), it can be seen that this parameter is the most affected compared to other morphological parameters. On average, when considering the total sample of galaxies, early-types, and early-spirals, the variance in the parameter is significant in all magnitude and redshift conditions when the contribution of the AGN is equal to or larger than 25%, 50%, and 75%, respectively. For late-spirals, the CABR parameter undergoes significant changes above 20% in all magnitudes, redshifts, and AGN conditions. Figure A1 shows that the distribution of CABR after the simulations can move in both directions, towards higher and lower values compared to the non-simulated sample. Taking into account the definition of CABR, as described in Section 3, it can be interpreted that, when the parameter is shifted towards higher values the contribution of the AGN, increasing the flux within the inner radius, has the dominant effect compared to the impact of the magnitude and redshift, which is dimming the light in the galaxy, in particular in the outer regions. Similarly, when it is shifted towards lower values, it means that the magnitude and redshift have more impact on the CABR than the added AGN itself. We can observe that for 50% and 75% of the AGN added, the AGN contribution plays a dominant role independently of the magnitude and redshift. This means that if more light is added to the central part of the galaxy, according to the CABR definition, its values will increase. For 5–25% added AGN, AGN plays the dominant role up to mag_hz < 22, as the central light of the galaxy within 30% of the galaxy radius is less affected than the rest of the galaxy. At fainter magnitude limits (23 and above), the impact of the magnitude and redshift on the CABR becomes a dominant effect, affecting light in the entire galaxy.
GINI. This is the least affected parameter, with the lowest values of variance, as can be seen in Figure 4 (middle top panels). Even so, the total sample of galaxies and early-spirals will be significantly affected when the AGN contribution is equal to or larger than 25%, regardless of the magnitude and redshift limits. Again, late-spirals will be significantly affected in all cases, similarly to the CABR. On the other hand, the GINI parameter for early-types in all cases will suffer variations below 20%. The tendency of GINI to shift towards higher or lower values compared to the original sample is similar to that of CABR, but with smaller shifts. This is due to the difference in the definition of GINI and CABR, in which, although both are concentration parameters, CABR is much more sensitive to the concentration of light in the central part of the galaxy than GINI.
CCON. This parameter will undergo significant changes of more than 20%, in all cases of the total sample, due to the impact magnitude, redshift, and AGN on spiral galaxies, both early and late, as shown in Figure 4 (middle bottom panels). The early-types will be significantly affected only when the added contribution from the AGN is greater than 25%. In general, the change in the CCON parameter for the simulated sample will be towards higher values. However, for 50% and 75% of added AGN in the early-types and early-spirals (75% of AGN added for late-spirals), because the definition of CCON is the radius ratio and not the flux ratio, as in the case of CABR, the distribution of the simulated sample will start to change the trend towards lower concentrations in the simulated sample, compared to the lower AGN contributions. This effect is more pronounced in early-type galaxies, which, in general, have higher central concentrations and CCON values and are therefore more affected.
M20. This parameter will also undergo significant changes of more than 20%, in all cases of the total sample, early- and late-spirals, as shown in Figure 4 (bottom panels). In early-type galaxies, the variations in M20 are around 20% up to the added contribution of AGN of 25%. For AGN contributions above this value, M20 is more affected, with variations exceeding 30%.
ASYM. We found similar distributions of ASYM between simulated and original samples in most cases of magnitude, redshift, and AGN (see Figure A5). However, this parameter is very sensitive to noise, as has already been studied and discussed in [37]. Similar results were reported in other studies (e.g., [33,72,73]). Therefore, we do not suggest its use except in combination with other morphological parameters.
SMOOTH. We find larger changes in the distribution of this parameter in early-type galaxies than in spiral galaxies, but towards lower values, as can be seen in Figure A6. This parameter is not convenient to use due to the very small number of sources for which it can be measured, as mentioned above.

4.2. Impact of Magnitude and Redshift on the Morphological Parameters of Active Galaxies

We compared the measurements of six morphological parameters after adding an AGN contribution of 5% to 75% to the total flux, using the original sample at z ∼ 0 and simulated sample in COSMOS-like conditions. This corresponds to the case of measurement and comparison of the morphological parameters of active galaxies at z ∼ 0 and higher redshifts, and it can help us to better understand the effect of magnitude and redshift on different morphological parameters when classifying AGN host galaxies. Overall, among the three types of analysis conducted in Section 4.1, Section 4.2 and Section 4.3, we find the lowest changes in morphological parameters. These analyses are represented in Appendix B.
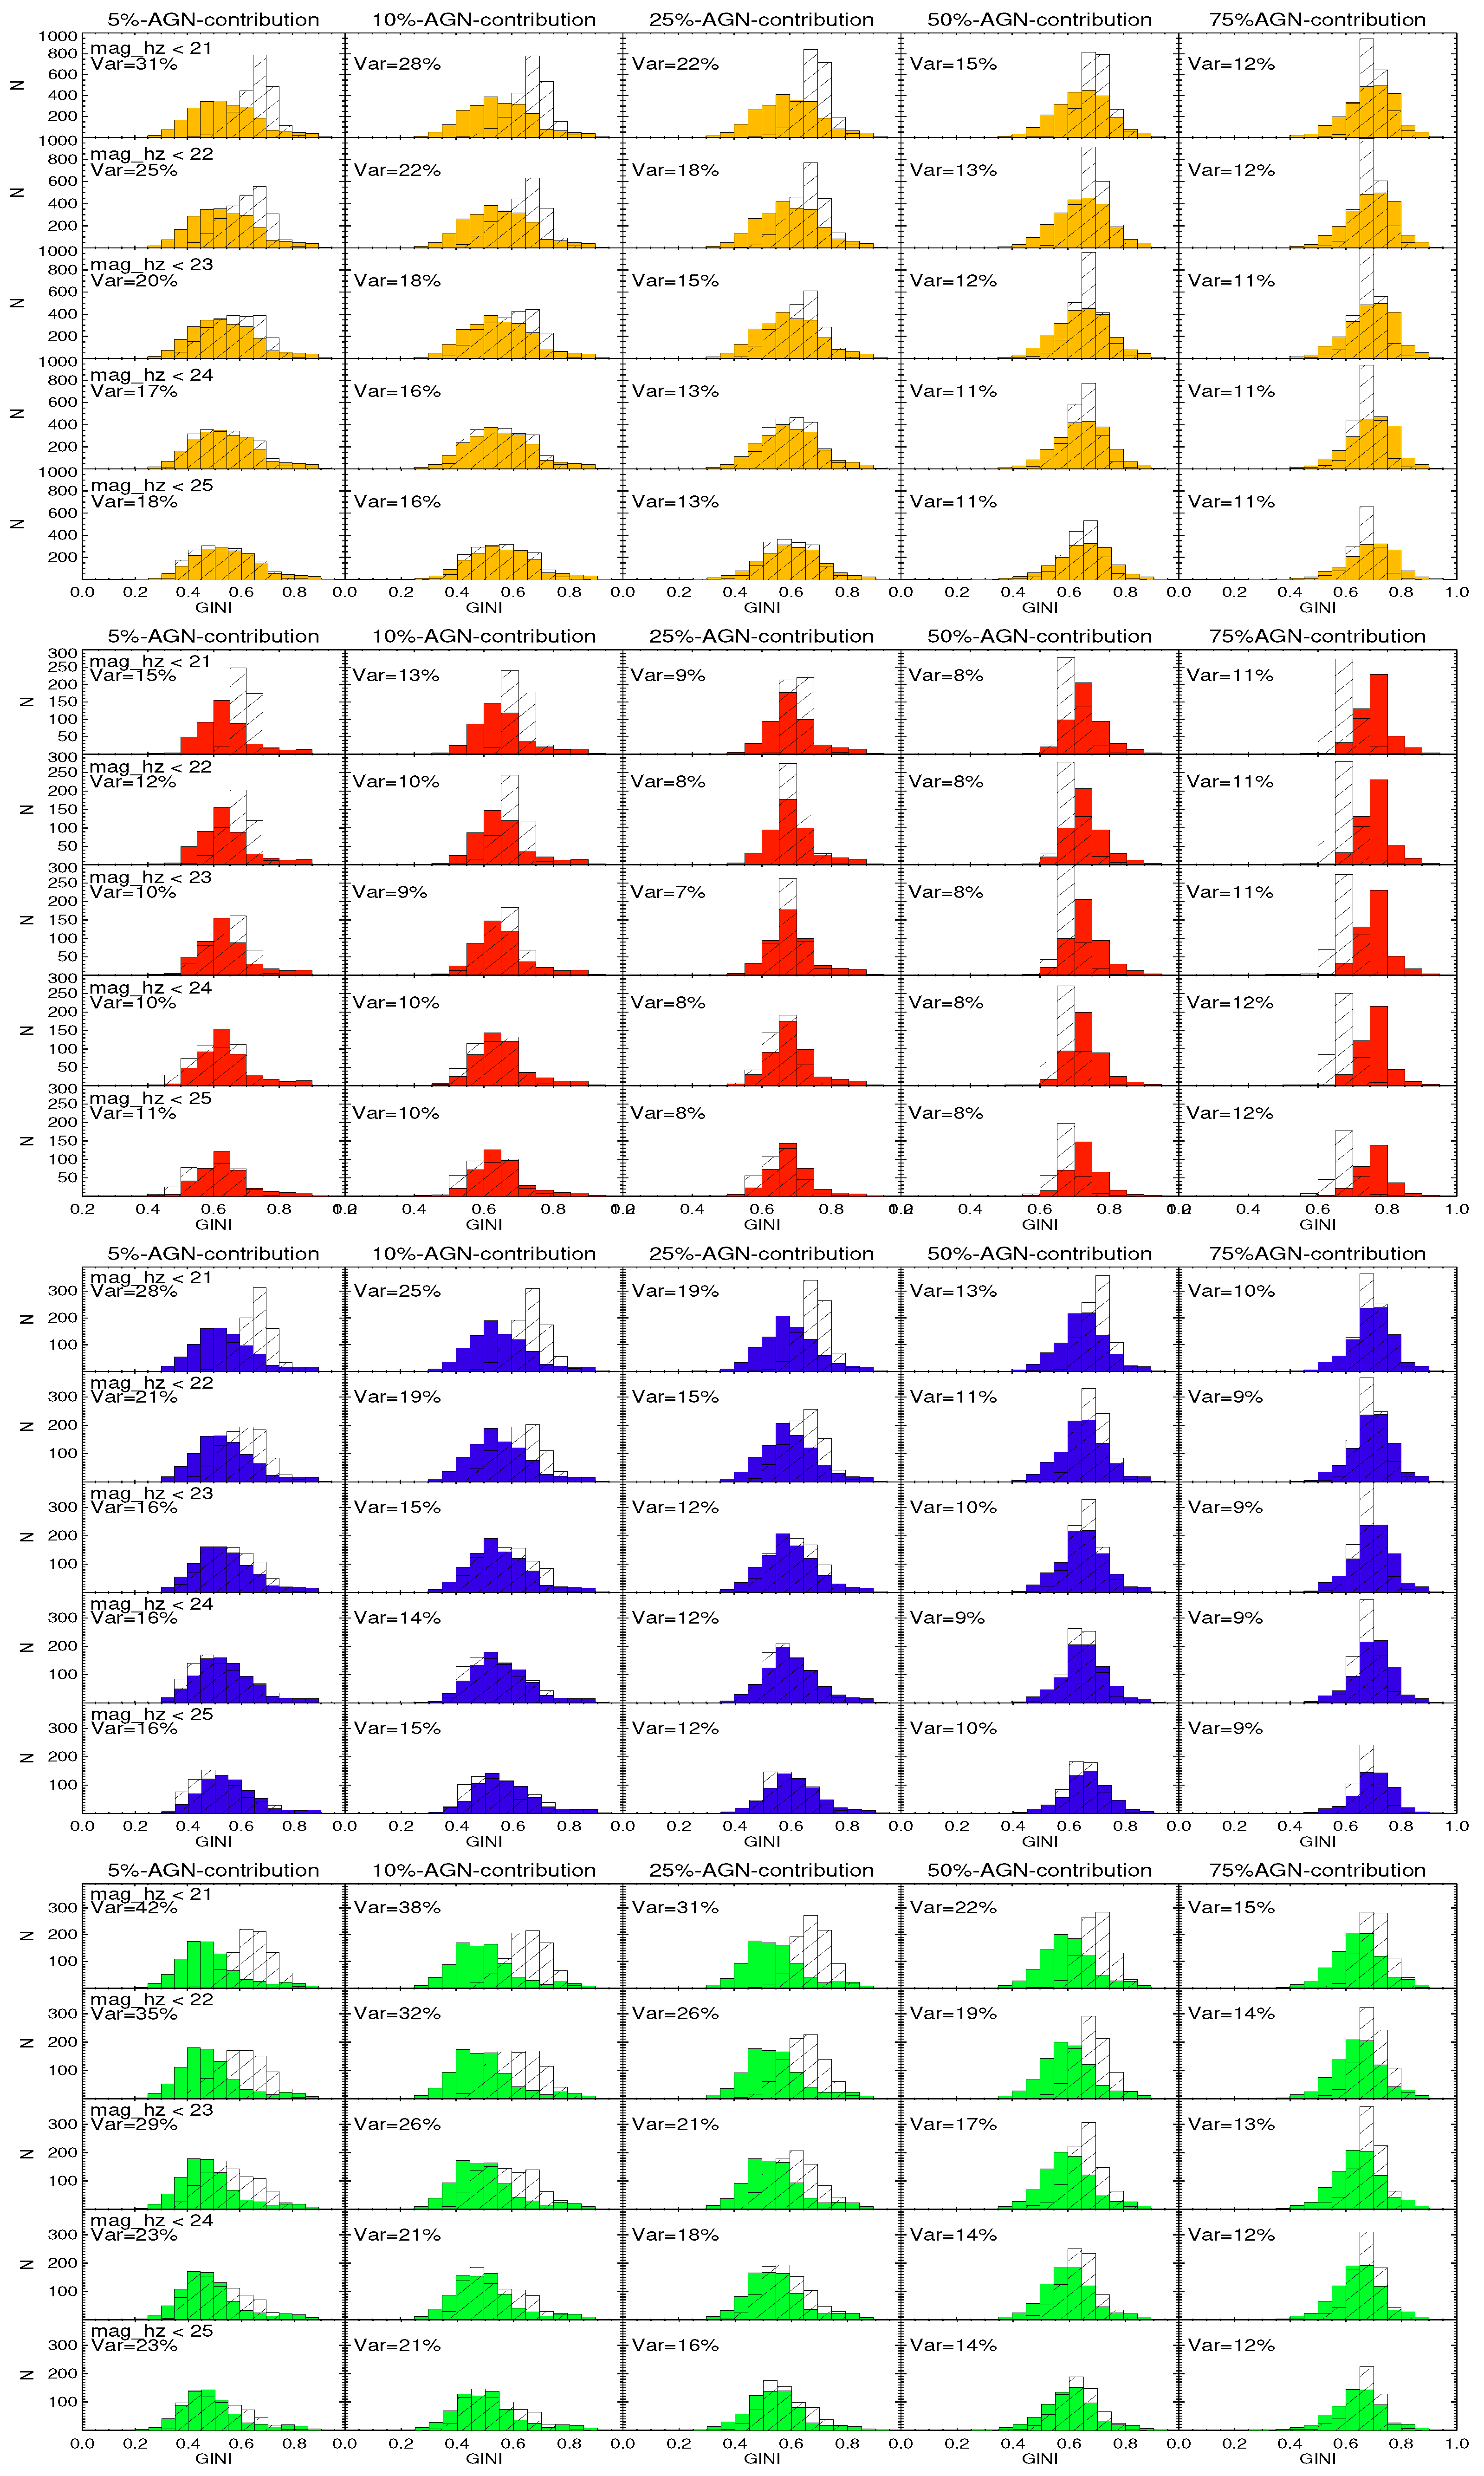
Figure A7, Figure A8, Figure A9, Figure A10, Figure A11 and Figure A12 show the distribution of CABR, GINI, CCON, M20, ASYM, and SMOOTH, respectively, of simulated active galaxies at z ∼ 0 (filled and colored histograms) and under COSMOS-like conditions (open histograms), or the direct impact of magnitude and redshift on the AGN host-galaxy classification. The different panels show the same analysis for different magnitudes and redshifts (top to bottom) and AGN contributions (left to right), as indicated in each panel. The different colors again examine different types of galaxies as described in Section 4.1.
The variances have been measured similarly as in Section 4.1, where now P s i m i and P o r i g i are the values of the morphological parameters of individual galaxies, corresponding to the simulated active galaxies in COSMOS-like conditions and simulated active galaxies at z ∼ 0, respectively. The obtained variances are shown in Figure 5, while the obtained results are briefly summarised here for each parameter and are discussed more in Section 5:
CABR. Up to 50% of the AGN added, the effect of magnitude and redshift is up to ∼20% for all morphological types (with slightly higher values of up to 30% for late-spirals), as can be seen in Figure 5 (top panels). The change in variance, towards lower values of CABR, increases with magnitude, as expected (except for the AGN contribution of 75%). The highest measured CABR values are obtained at mag_hz < 21, when the outskirts of a galaxy are the ones mainly affected, leading to higher CABR values. On the other hand, at mag_hz < 25 the brightness of the entire galaxy is affected, giving generally lower CABR values than at z ∼ 0. The most significant impact of magnitude and redshift on active galaxies is observed for 75% of the AGN added contribution, being around 20% for early-type galaxies, 20–35% for early-spirals, and 30–40% for late-spirals.
GINI. Again, this is the most stable of all parameters, as can be seen in Figure 5 (middle top panels). In this case, for active galaxies with an AGN contribution of 25–75%, the impact of the magnitude and redshift on GINI is ≲20% for all morphological types (except when the AGN contribution is 25% for late-spirals and mag_hz < 23, then the variance is up to 30%). In early-type galaxies, the difference is insignificant for less luminous active galaxies, with AGN contributions of 5% and 10%. In the case of spirals, at magnitudes of ≤21 and ≤22 that mainly affect the disc, active galaxies at higher redshift will show higher GINI values with a variance of ∼15–30% for early-spirals and ∼30–40% for late-spirals. As the magnitude limit increases, which affects the brightness of the entire galaxy, the variance will decrease in both early and late spiral galaxies.
CCON. The impact of the magnitude and redshift on the CCON concentration index in early-type active galaxies will be insignificant (<20%), up to an AGN contribution of 25%. These differences become significant (20–35%) for a 50% and 75% AGN contribution (see Figure 5, middle bottom panels). For the spiral active galaxies, the variance is significant in all cases, varying between 20 and 30% and 20 and 40% in the cases of early- and late-spiral galaxies, respectively. In all cases, as the magnitude limit increases, affecting a larger and larger fraction of the galaxy light, the CCON parameter of galaxies in COSMOS-like conditions will move towards lower values.
M20. The behavior of this parameter at z 0 and in COSMOS-like conditions is shown in Figure 5 (bottom panels) for all morphological types. In all cases, the impact of the magnitude and redshift is insignificant (<20%) for all morphological types when the AGN contribution is up to 25%. The variances become significant (20–36%) at 50% and 75% AGN contribution.
ASYM and SMOOTH. The results and conclusions of these two parameters, shown in Figure A11 and Figure A12, respectively, are similar to those discussed in the previous section.

4.3. Impact of AGN on the Morphological Parameters of Intermediate-Redshift Galaxies in COSMOS-like Conditions

Finally, we compared the six morphological parameters obtained in COSMOS-like conditions before and after adding the AGN contribution in the center of galaxies, from 5 to 75%. With this analysis, we can better understand the impact of AGN on morphological parameters at higher redshifts, in COSMOS-like conditions. These analyses are represented in Appendix C.
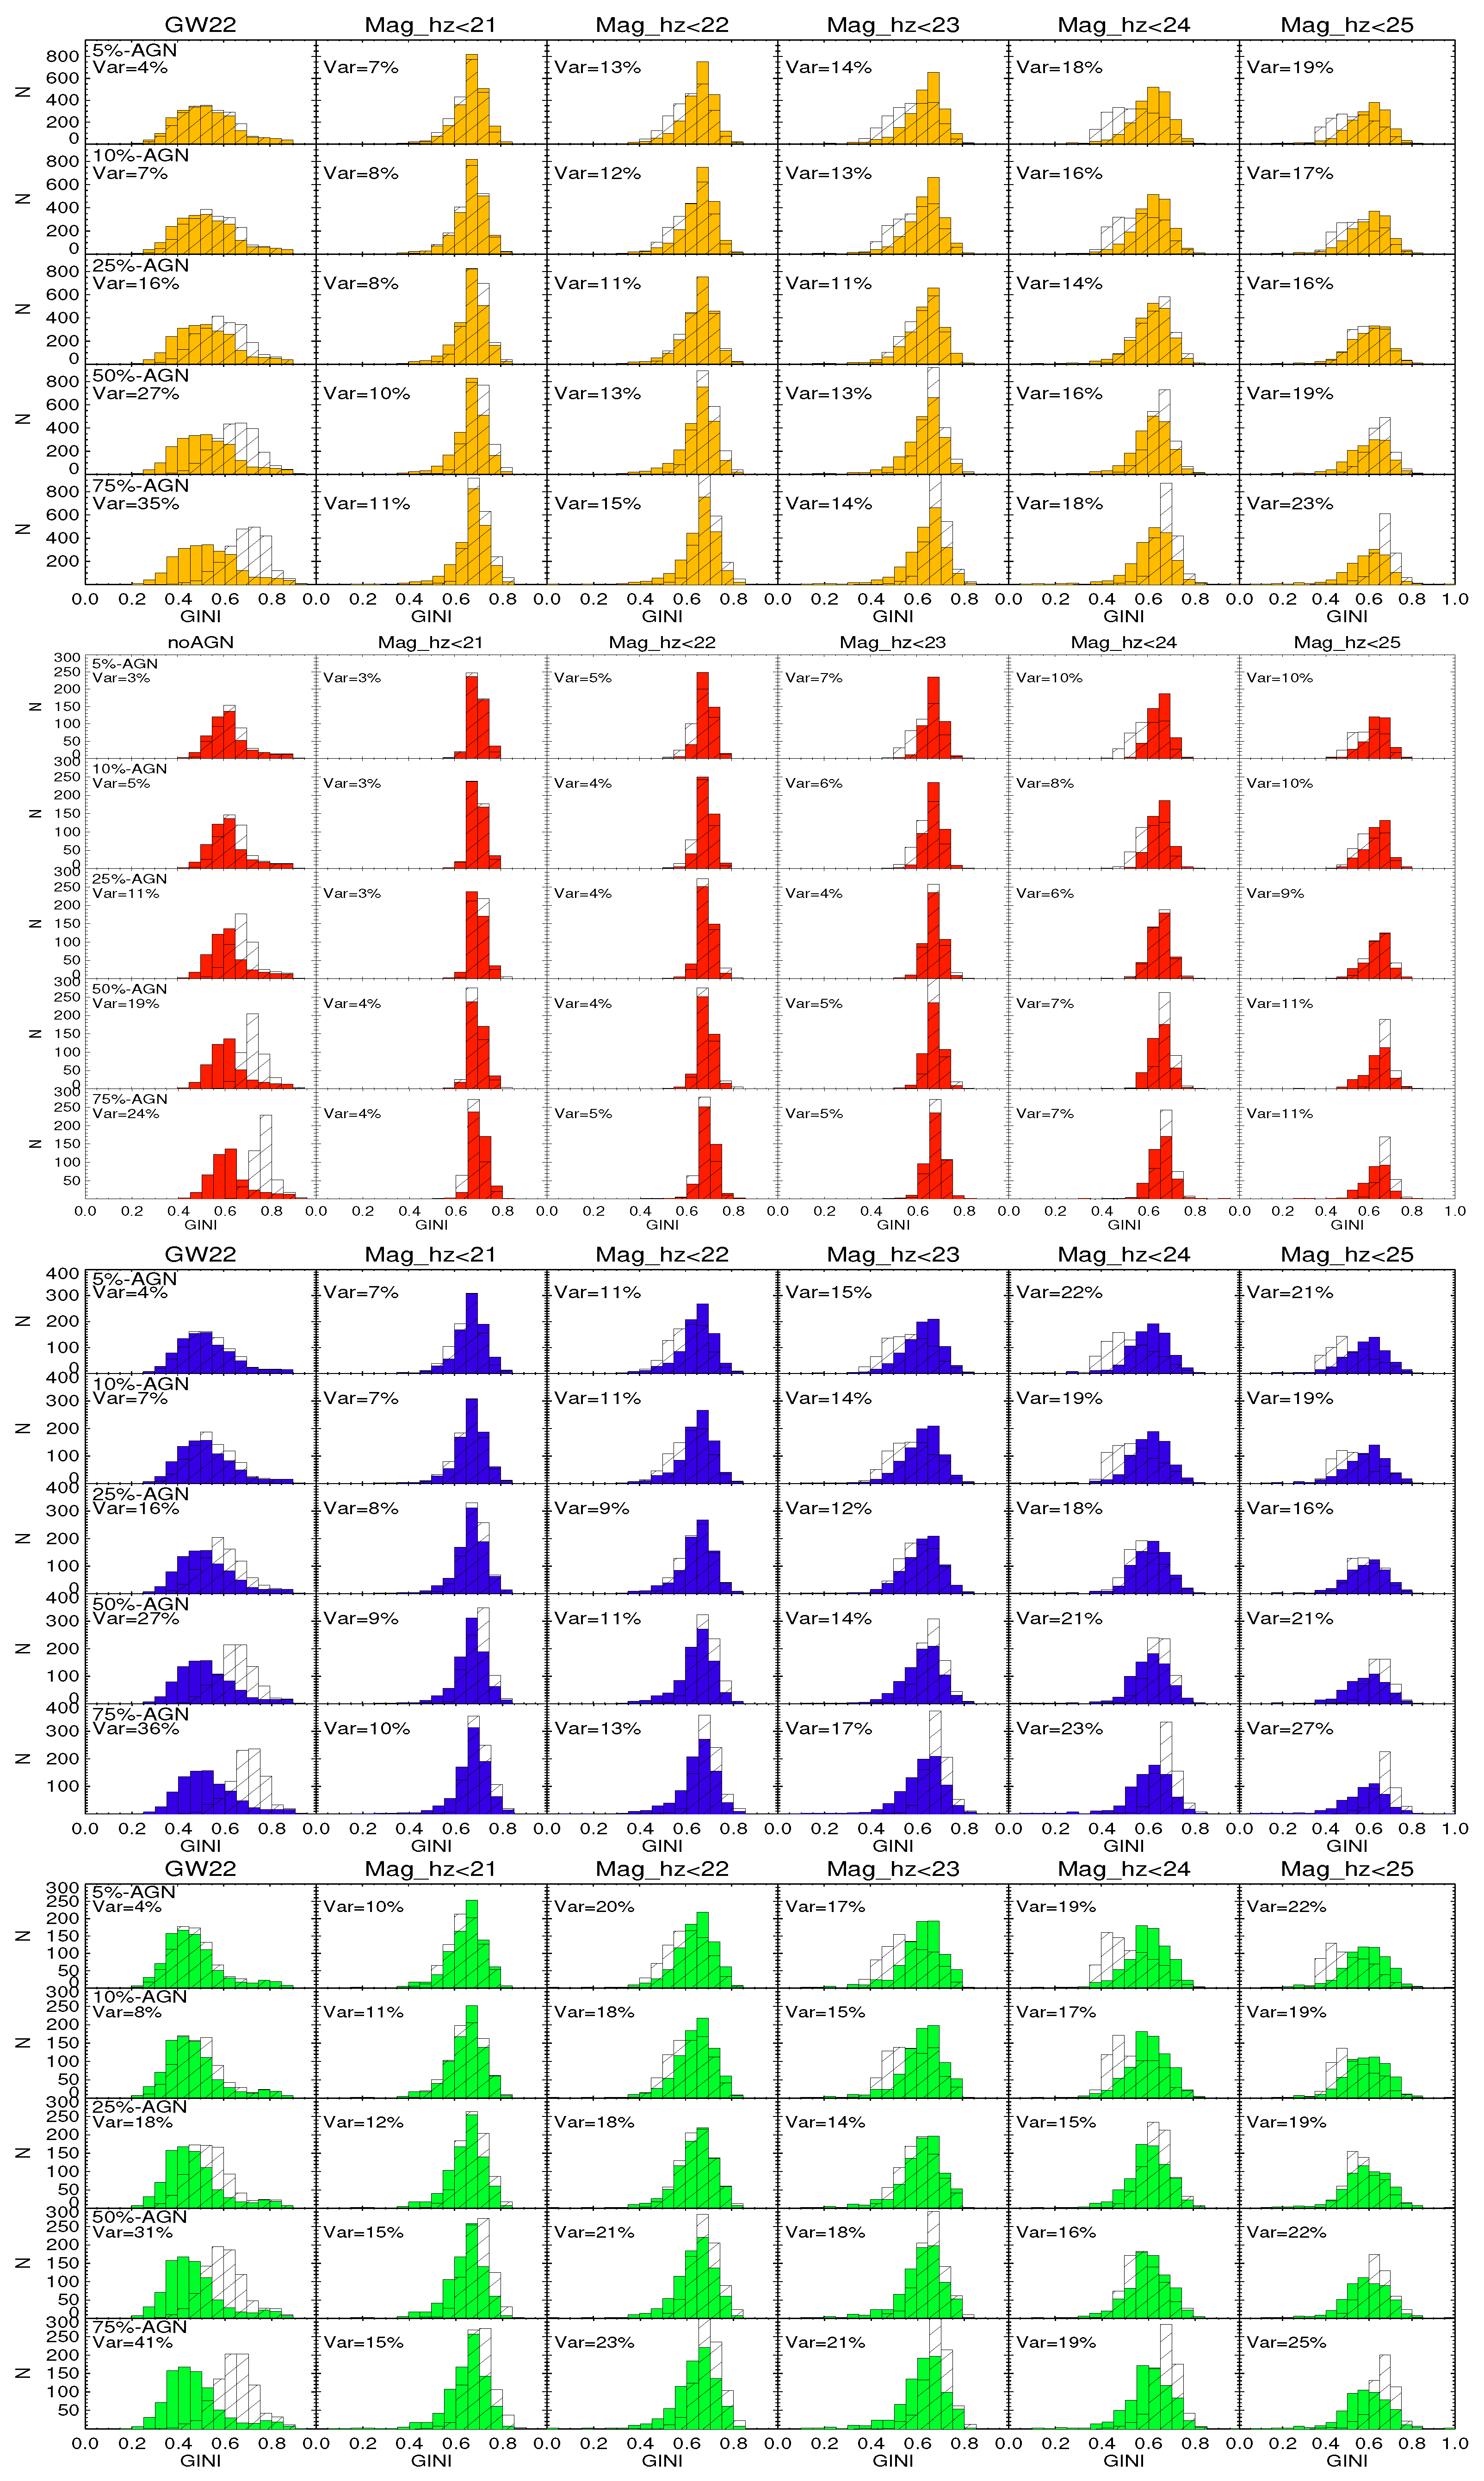
Figure A13, Figure A14, Figure A15, Figure A16, Figure A17 and Figure A18 show the distribution of CABR, GINI, CCON, M20, ASYM, and SMOOTH, respectively, of simulated non-AGN galaxies in COSMOS-like conditions (filled and colored histograms) and simulated galaxies with added AGN contribution in COSMOS-like conditions (open histograms), or the direct impact of AGN on the classification of its host galaxy at higher redshift. The different panels show the same analysis for different AGN contributions (top–bottom) and magnitudes and redshifts (left–right), as indicated in each panel. The different colors again examine different types of galaxies as described in Section 4.1. In addition, we use for comparison the results of [38] (GW22, first column in all Figures of Appendix C), where the same analysis has been carried out at z ∼ 0.
We again measured the variance in the morphological parameters similar to Equation (1), using in this case, the values of the parameters of individual galaxies in COSMOS-like conditions without ( P o r i g i ) and with ( P s i m i ) added AGN contribution. The variance values are shown in Figure 6 for all conditions and the three morphological types, similar to Figure 4 and Figure 5. In all GW22 comparison columns (the first columns in all Figures), the variance is measured between the parameters of individual galaxies obtained at z ∼ 0 without ( P o r i g i ) and with ( P s i m i ) AGN added, as in [38]. As shown in our previous work, at z ∼ 0 for all parameters, the effect of AGN becomes significant, and in most cases ≥ 20%, when the AGN contribution to the total flux is equal to or greater than 25%. We obtain the same results in this work as at z ∼ 0.
Please note that the meaning of the rows and columns in Figures of Appendix C and in Figure 6 is intentionally different, to mark different types of analysis.
Figure 6. Same as in Figure 4, but with the variance measured when comparing samples in COSMOS-like conditions without and with AGN added. The first column (GW22) shows the same comparison, but at z ∼ 0, as measured in [38].
Galaxies 13 00084 g006
Following the analysis in Section 4.1, here we find the second largest variances in morphological parameters, as shown in Figure 6. Our main findings on the effect of AGN on morphological parameters of galaxies in COSMOS-like conditions are as follows:
CABR. In general, there are no significant differences up to the added AGN contribution of 25%, in the case of the early-type and early-spiral galaxies, as shown in Figure 6 (top panels). For the larger contributions from the AGN, of 50% and 75%, the variance becomes significant (above 20%). In the case of late-spirals, the CABR parameter will be significantly affected in almost all cases except for the lowest AGN contributions of 5–10% and magnitude limits of mag_hz < 22. In this analysis, the AGN contribution dominates, and therefore, in almost all cases, the values of CABR after adding the AGN at the center of a galaxy tend to shift towards higher values, due to the definition of the CABR parameter.
GINI. This is again the most stable parameter showing in almost all cases the variance of <20%, regardless of morphological type, as seen in Figure 6 (top bottom panels). This means that, similar to what we found in [38] that AGN does not have a significant impact on GINI at z ∼ 0, is also true for galaxies at higher redshift, when comparing non-active and active galaxies in COSMOS-like conditions.
CCON. For early-type galaxies, the change in variance is ≤20% in almost all cases except in 75% added AGN contribution, as shown in Figure 6 (middle bottom panels). In spiral galaxies, this parameter will undergo significant changes above 40%, where the added AGN contribution is >25%, and 20–25% changes for 10% added AGN. Only in the case of 5% added AGN, the variance in CCON is insignificant. Once again, we are observing the complex changes in behavior of the CCON parameter, as in Section 4.1 and Section 4.3, and its change from higher values to lower values depending on the AGN contribution, compared to the reference sample in COSMOS-like conditions without AGN added. For all morphologies, up to the AGN contribution of 25%, the simulated sample with AGN shows higher values than the reference sample without AGN added. When the AGN contribution is 50% and 75%, CCON will move to lower values at all magnitudes, as most of the flux is now accumulated within the very small radii.
M20. In early-type galaxies, this parameter will now go through significant changes only when the added AGN contribution is >50%, as shown in Figure 6 (bottom panels). In spiral galaxies, the variance is significant for AGN added contribution of ≥25% at all magnitudes, and at the highest magnitude limits of mag_24 < 24 and mag_24 < 25 when AGN contribution is 5% and 10%.
The ASYM and SMOOTH parameters are shown in Figure A17 and Figure A18, respectively. They show a similar behavior to that discussed in Section 4.1.

4.4. Morphological Diagrams

In this section, we analyzed some of the morphological diagrams commonly used in previous studies to distinguish among different types of galaxies (e.g., [1,8,12,27,28,29,30,33,34,35,37,38,39,53,74]. The main objective is to understand the effect of magnitude, redshift, and AGN together on the morphological diagrams and the final morphological classification. We want to see to what extent commonly used morphological diagrams can be used in the classification of active galaxies at higher redshifts (and fainter magnitudes).
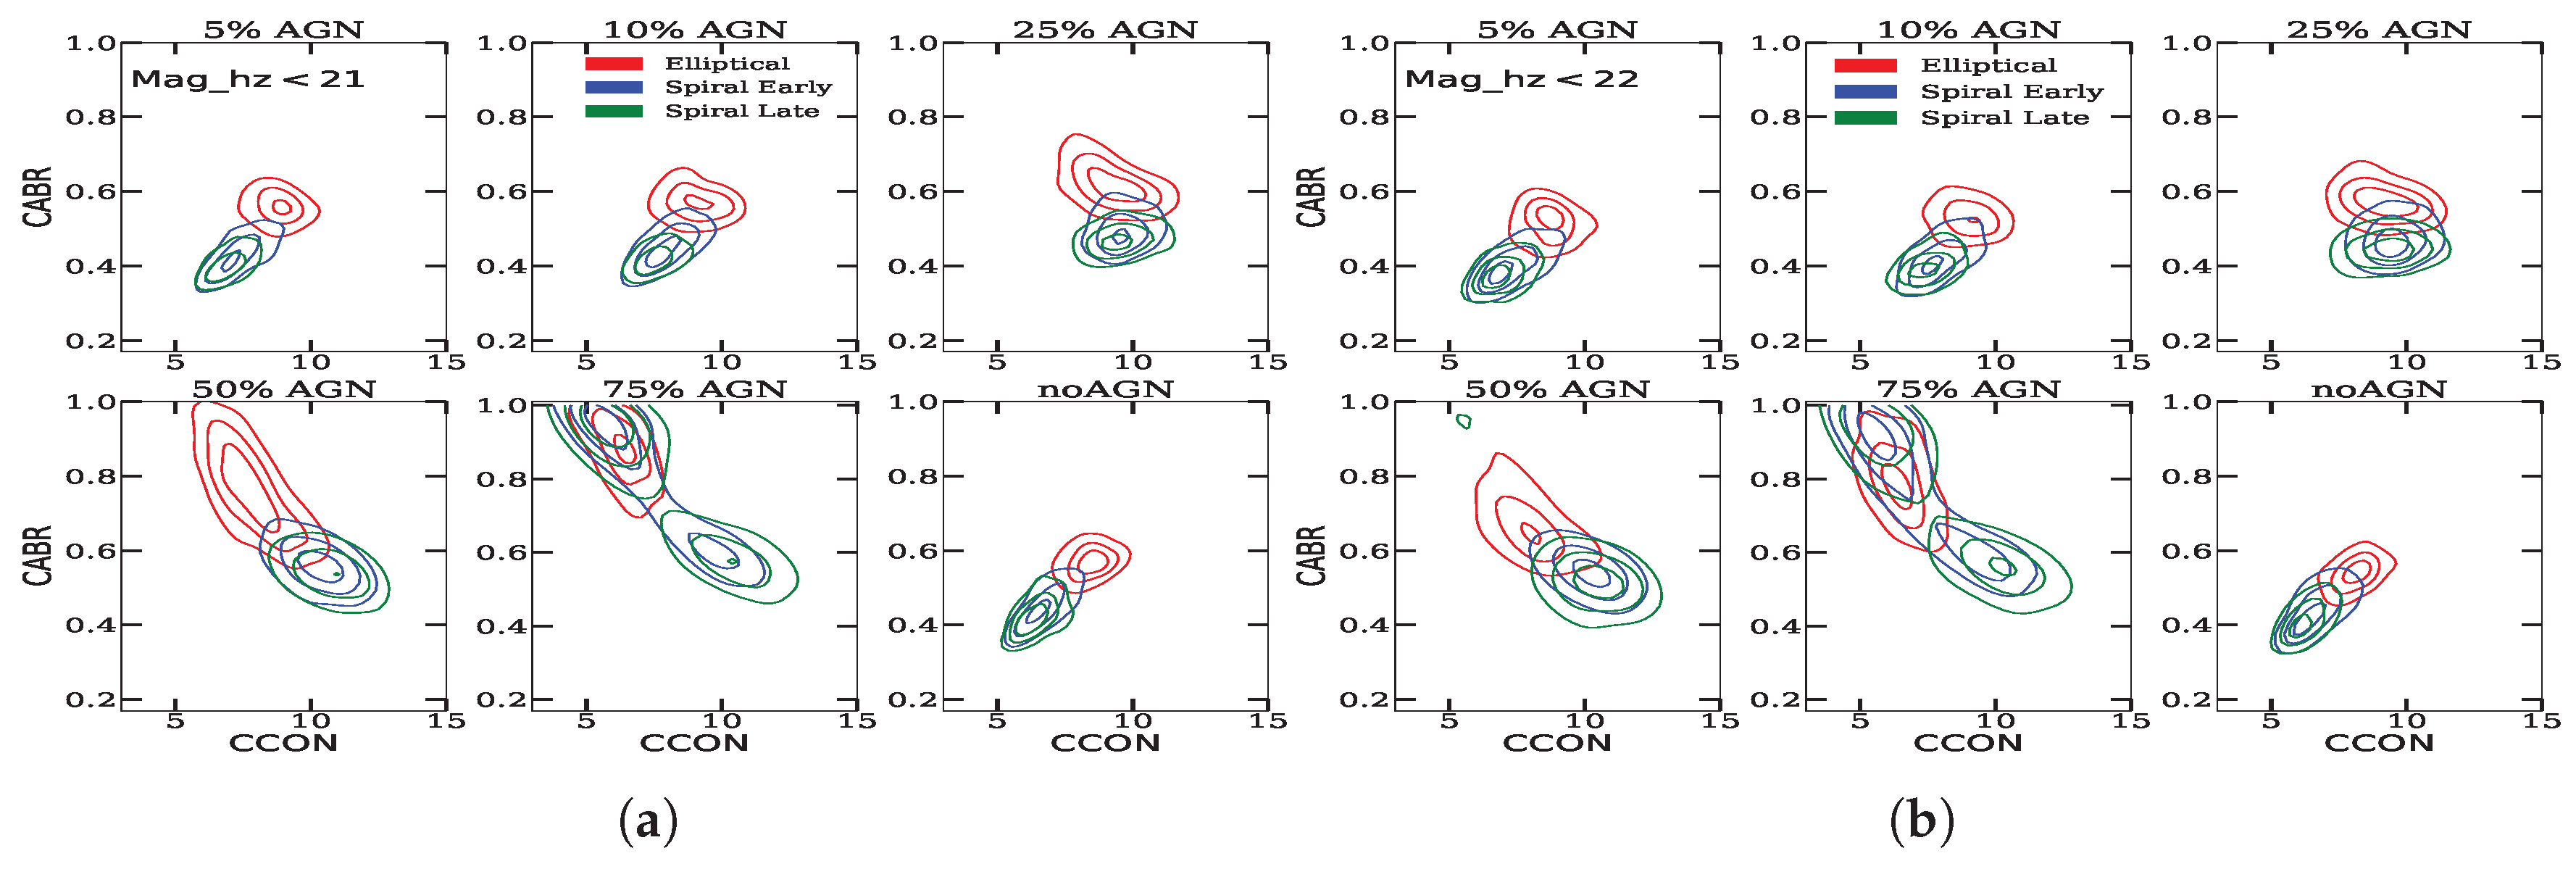
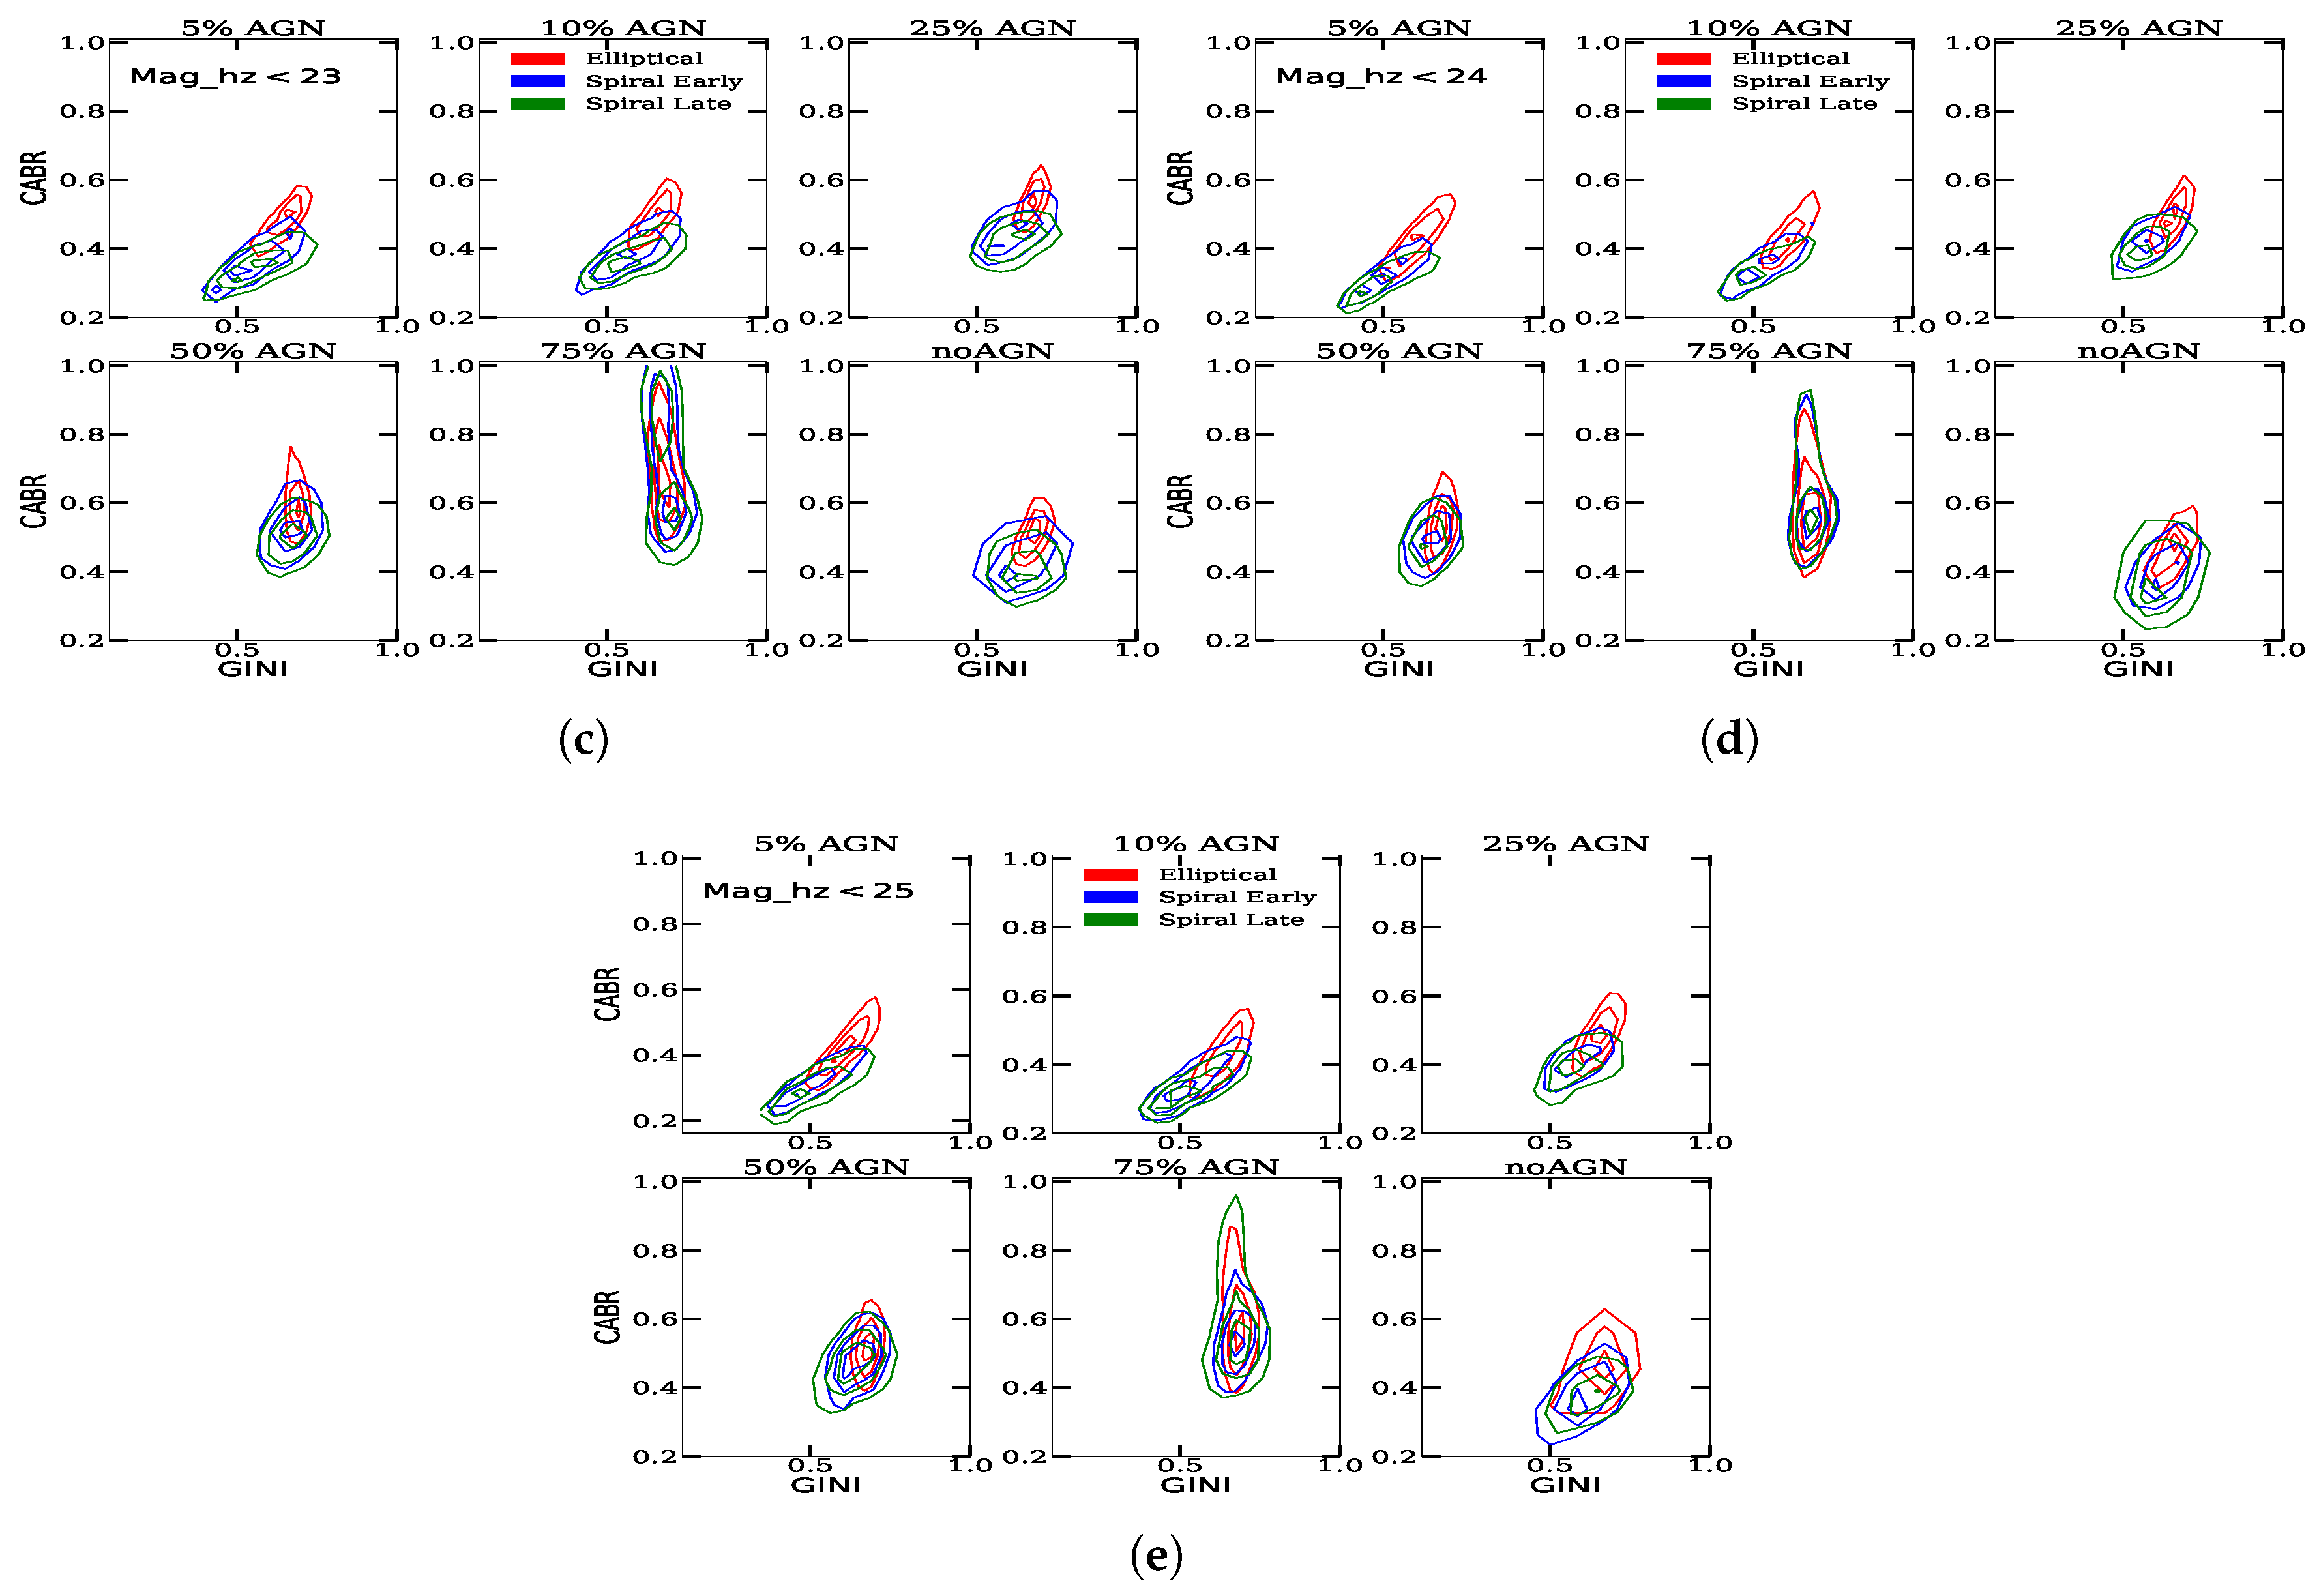
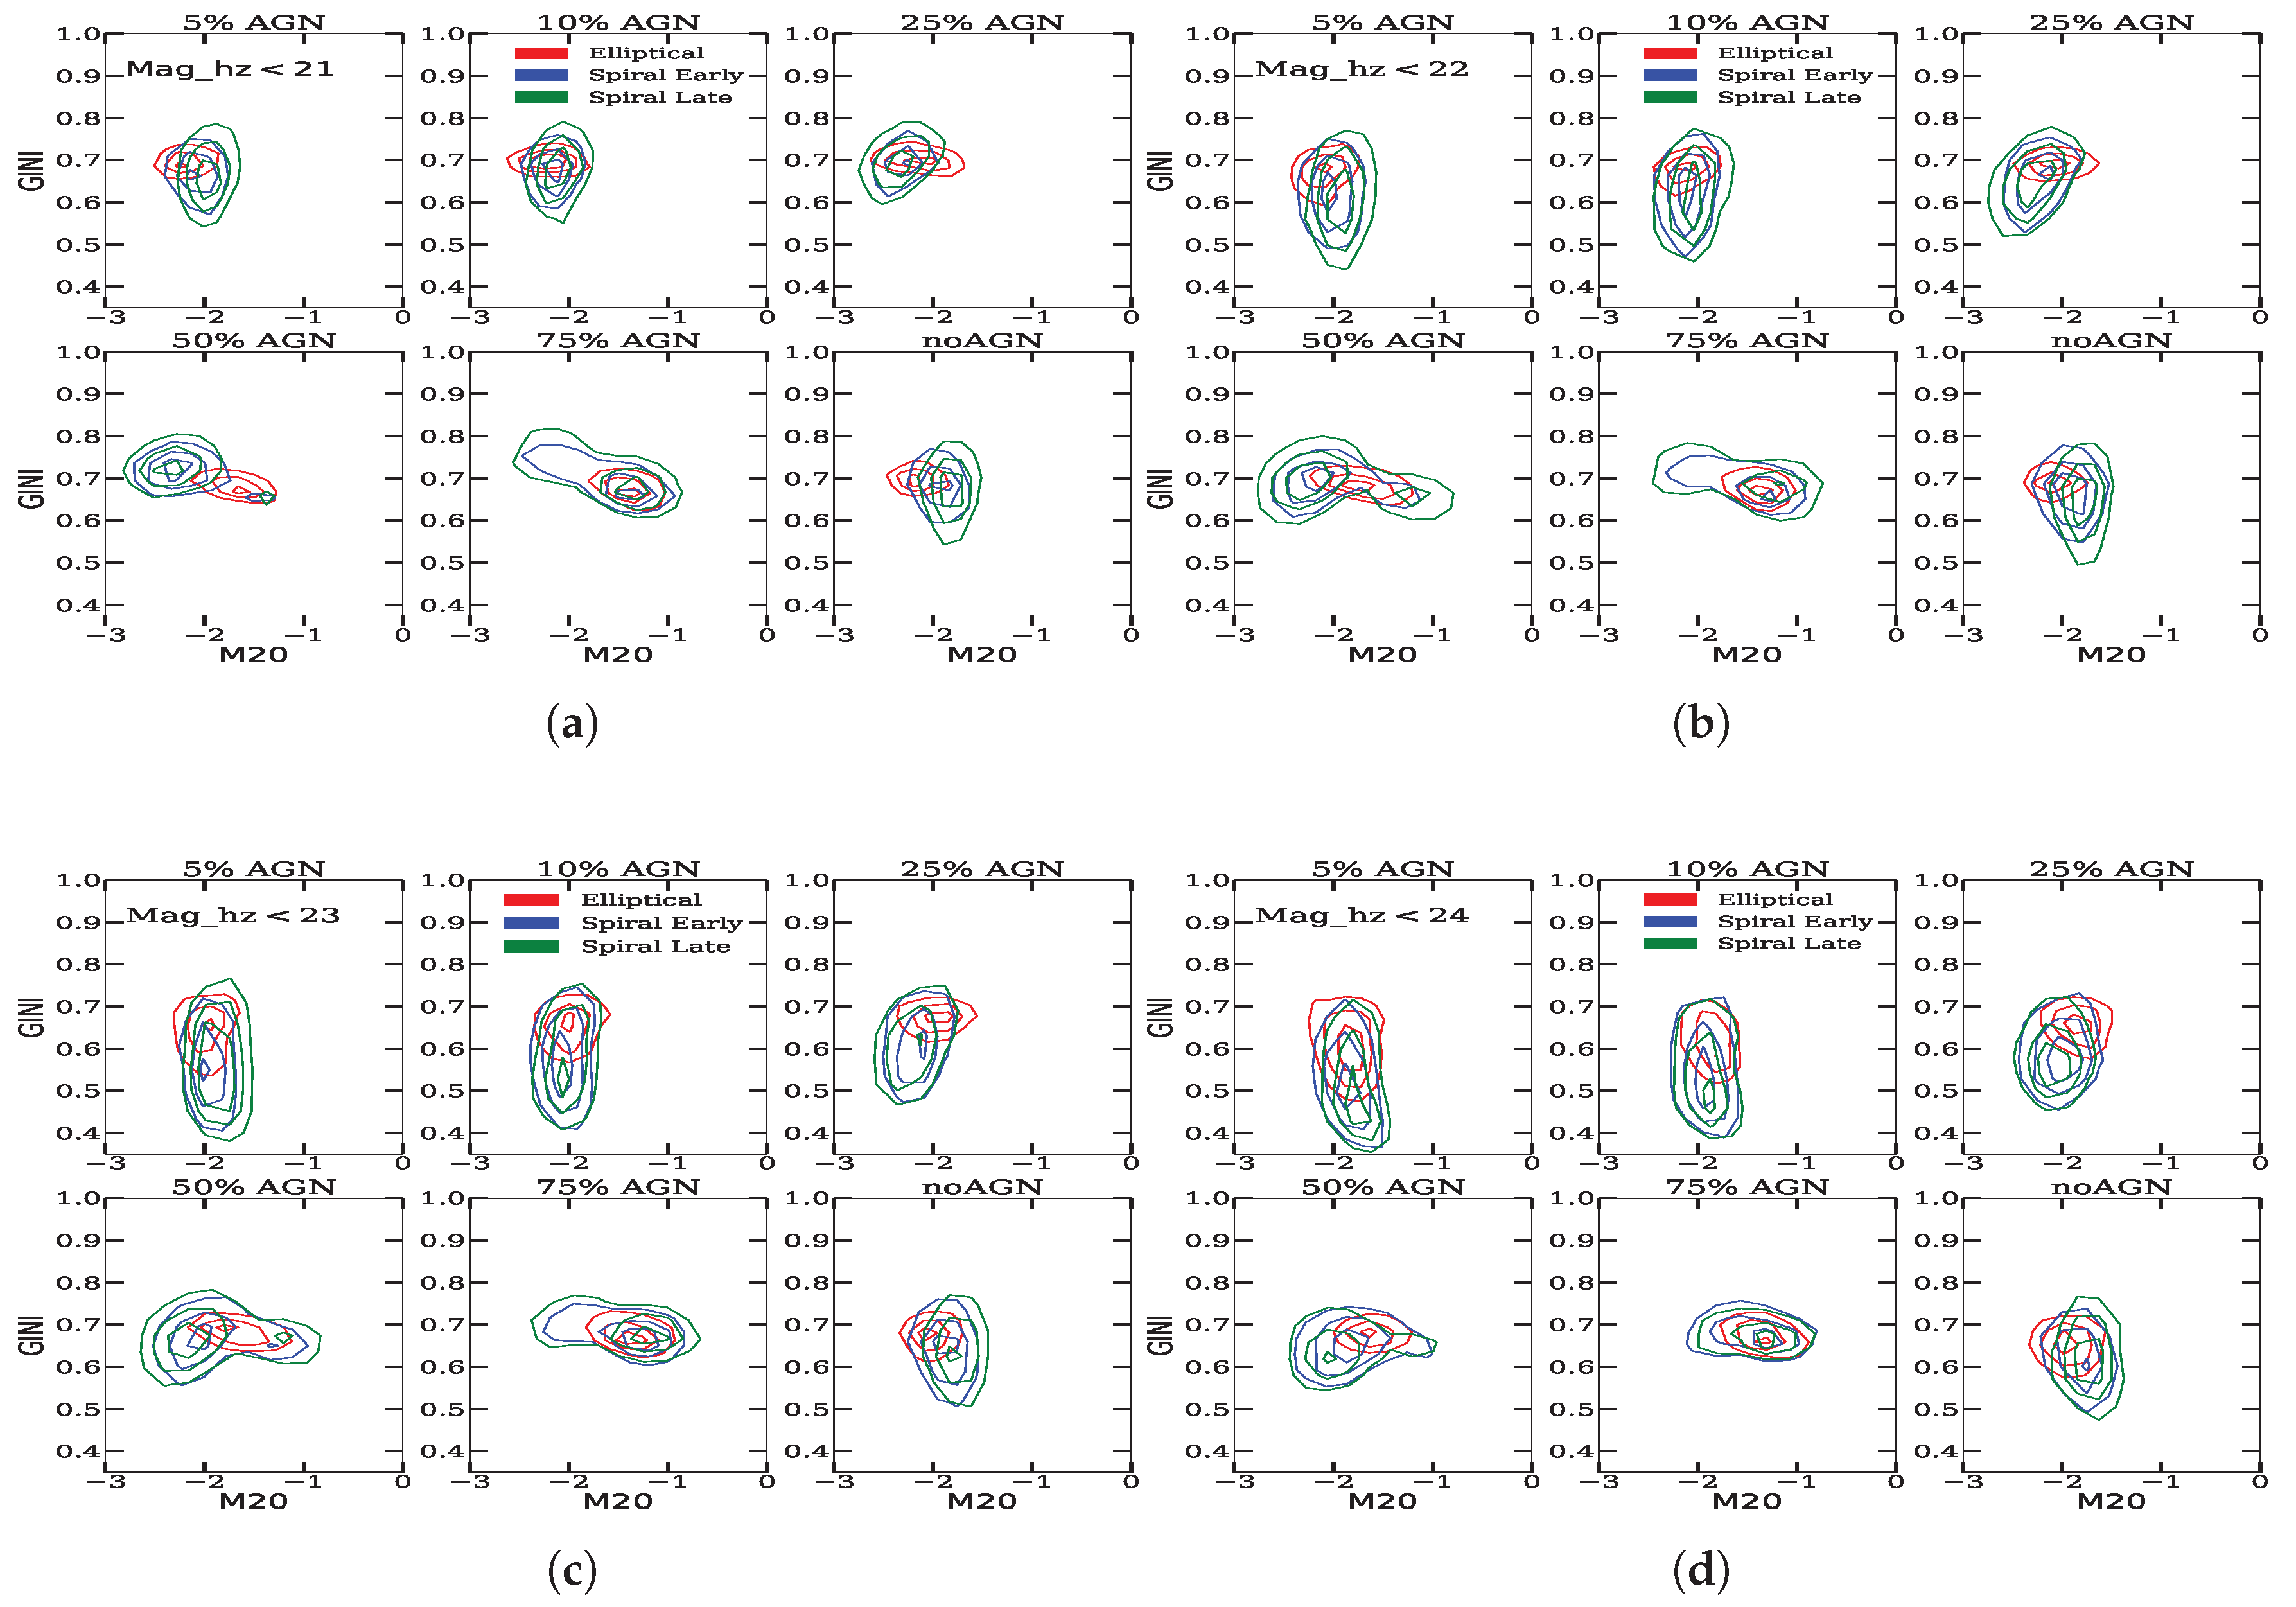
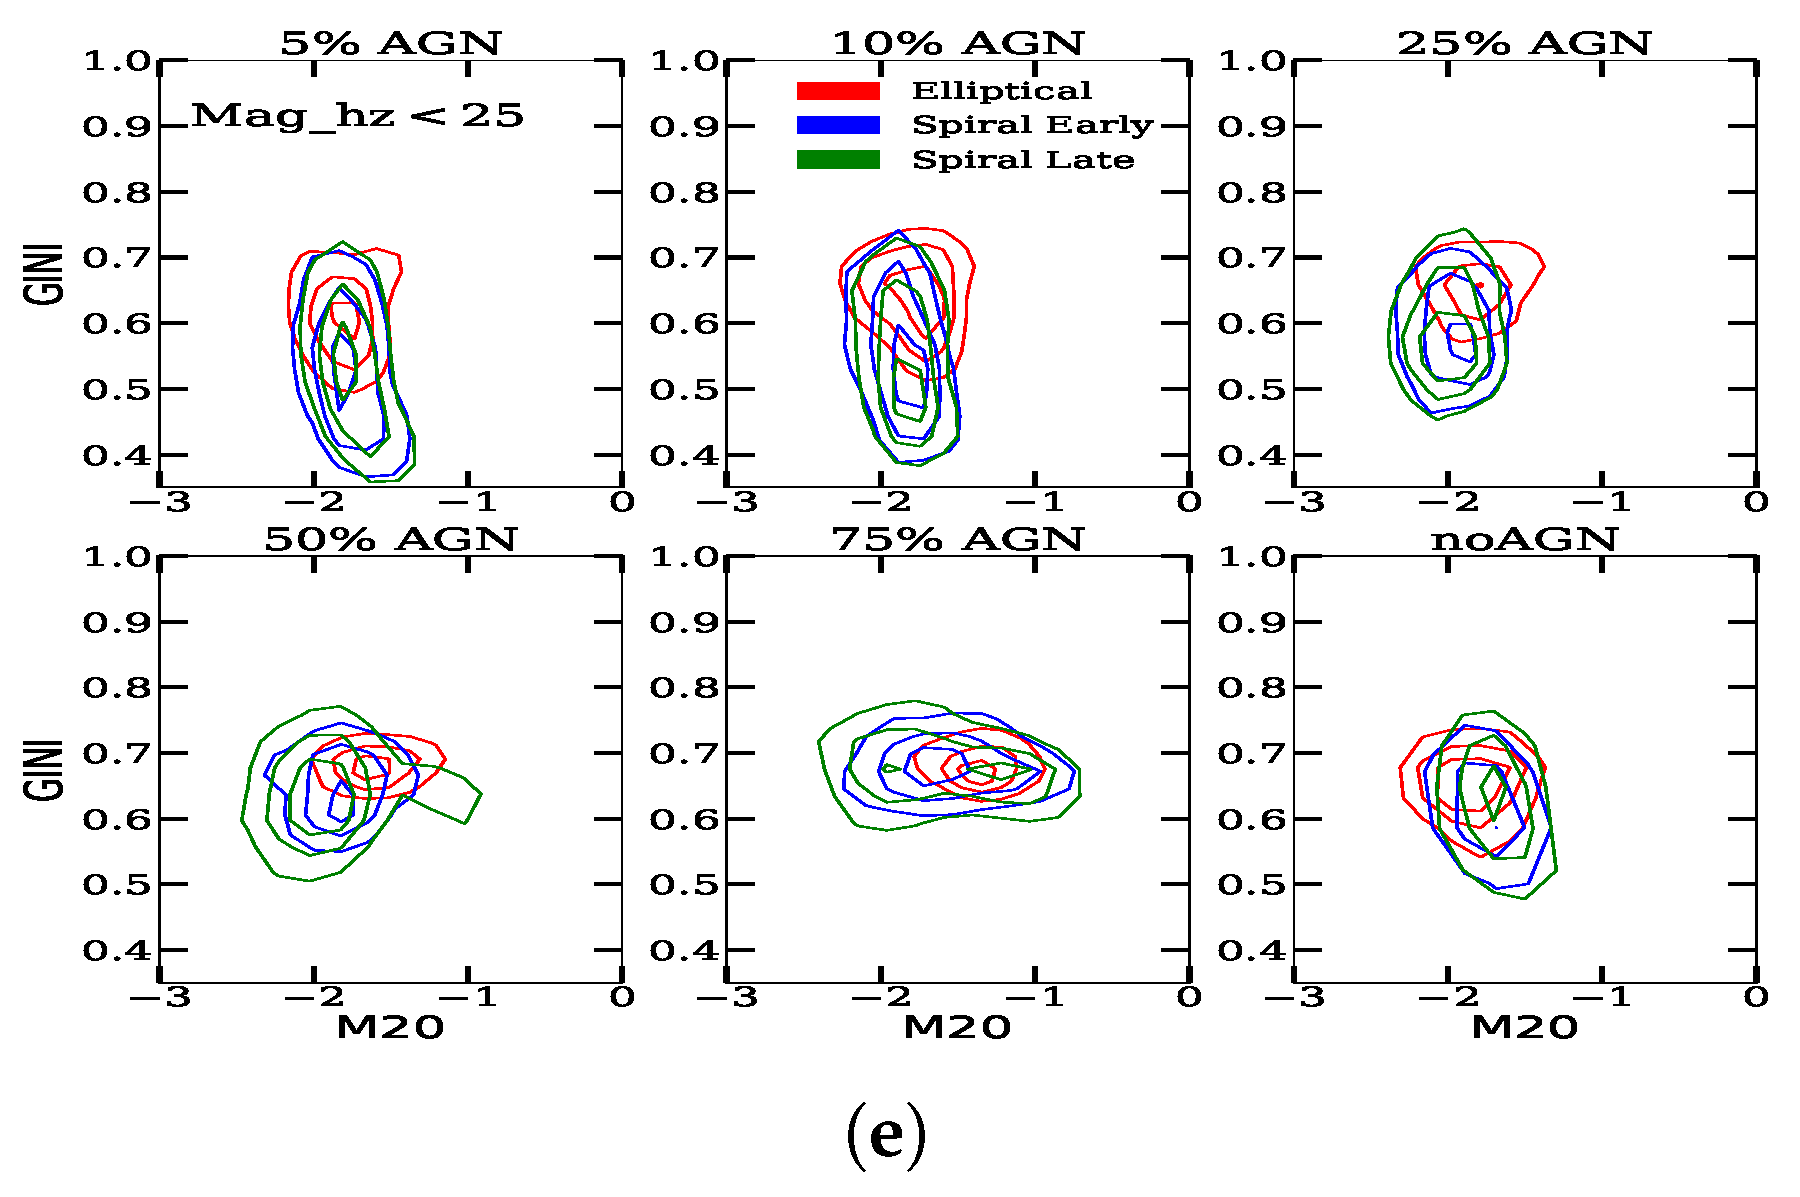
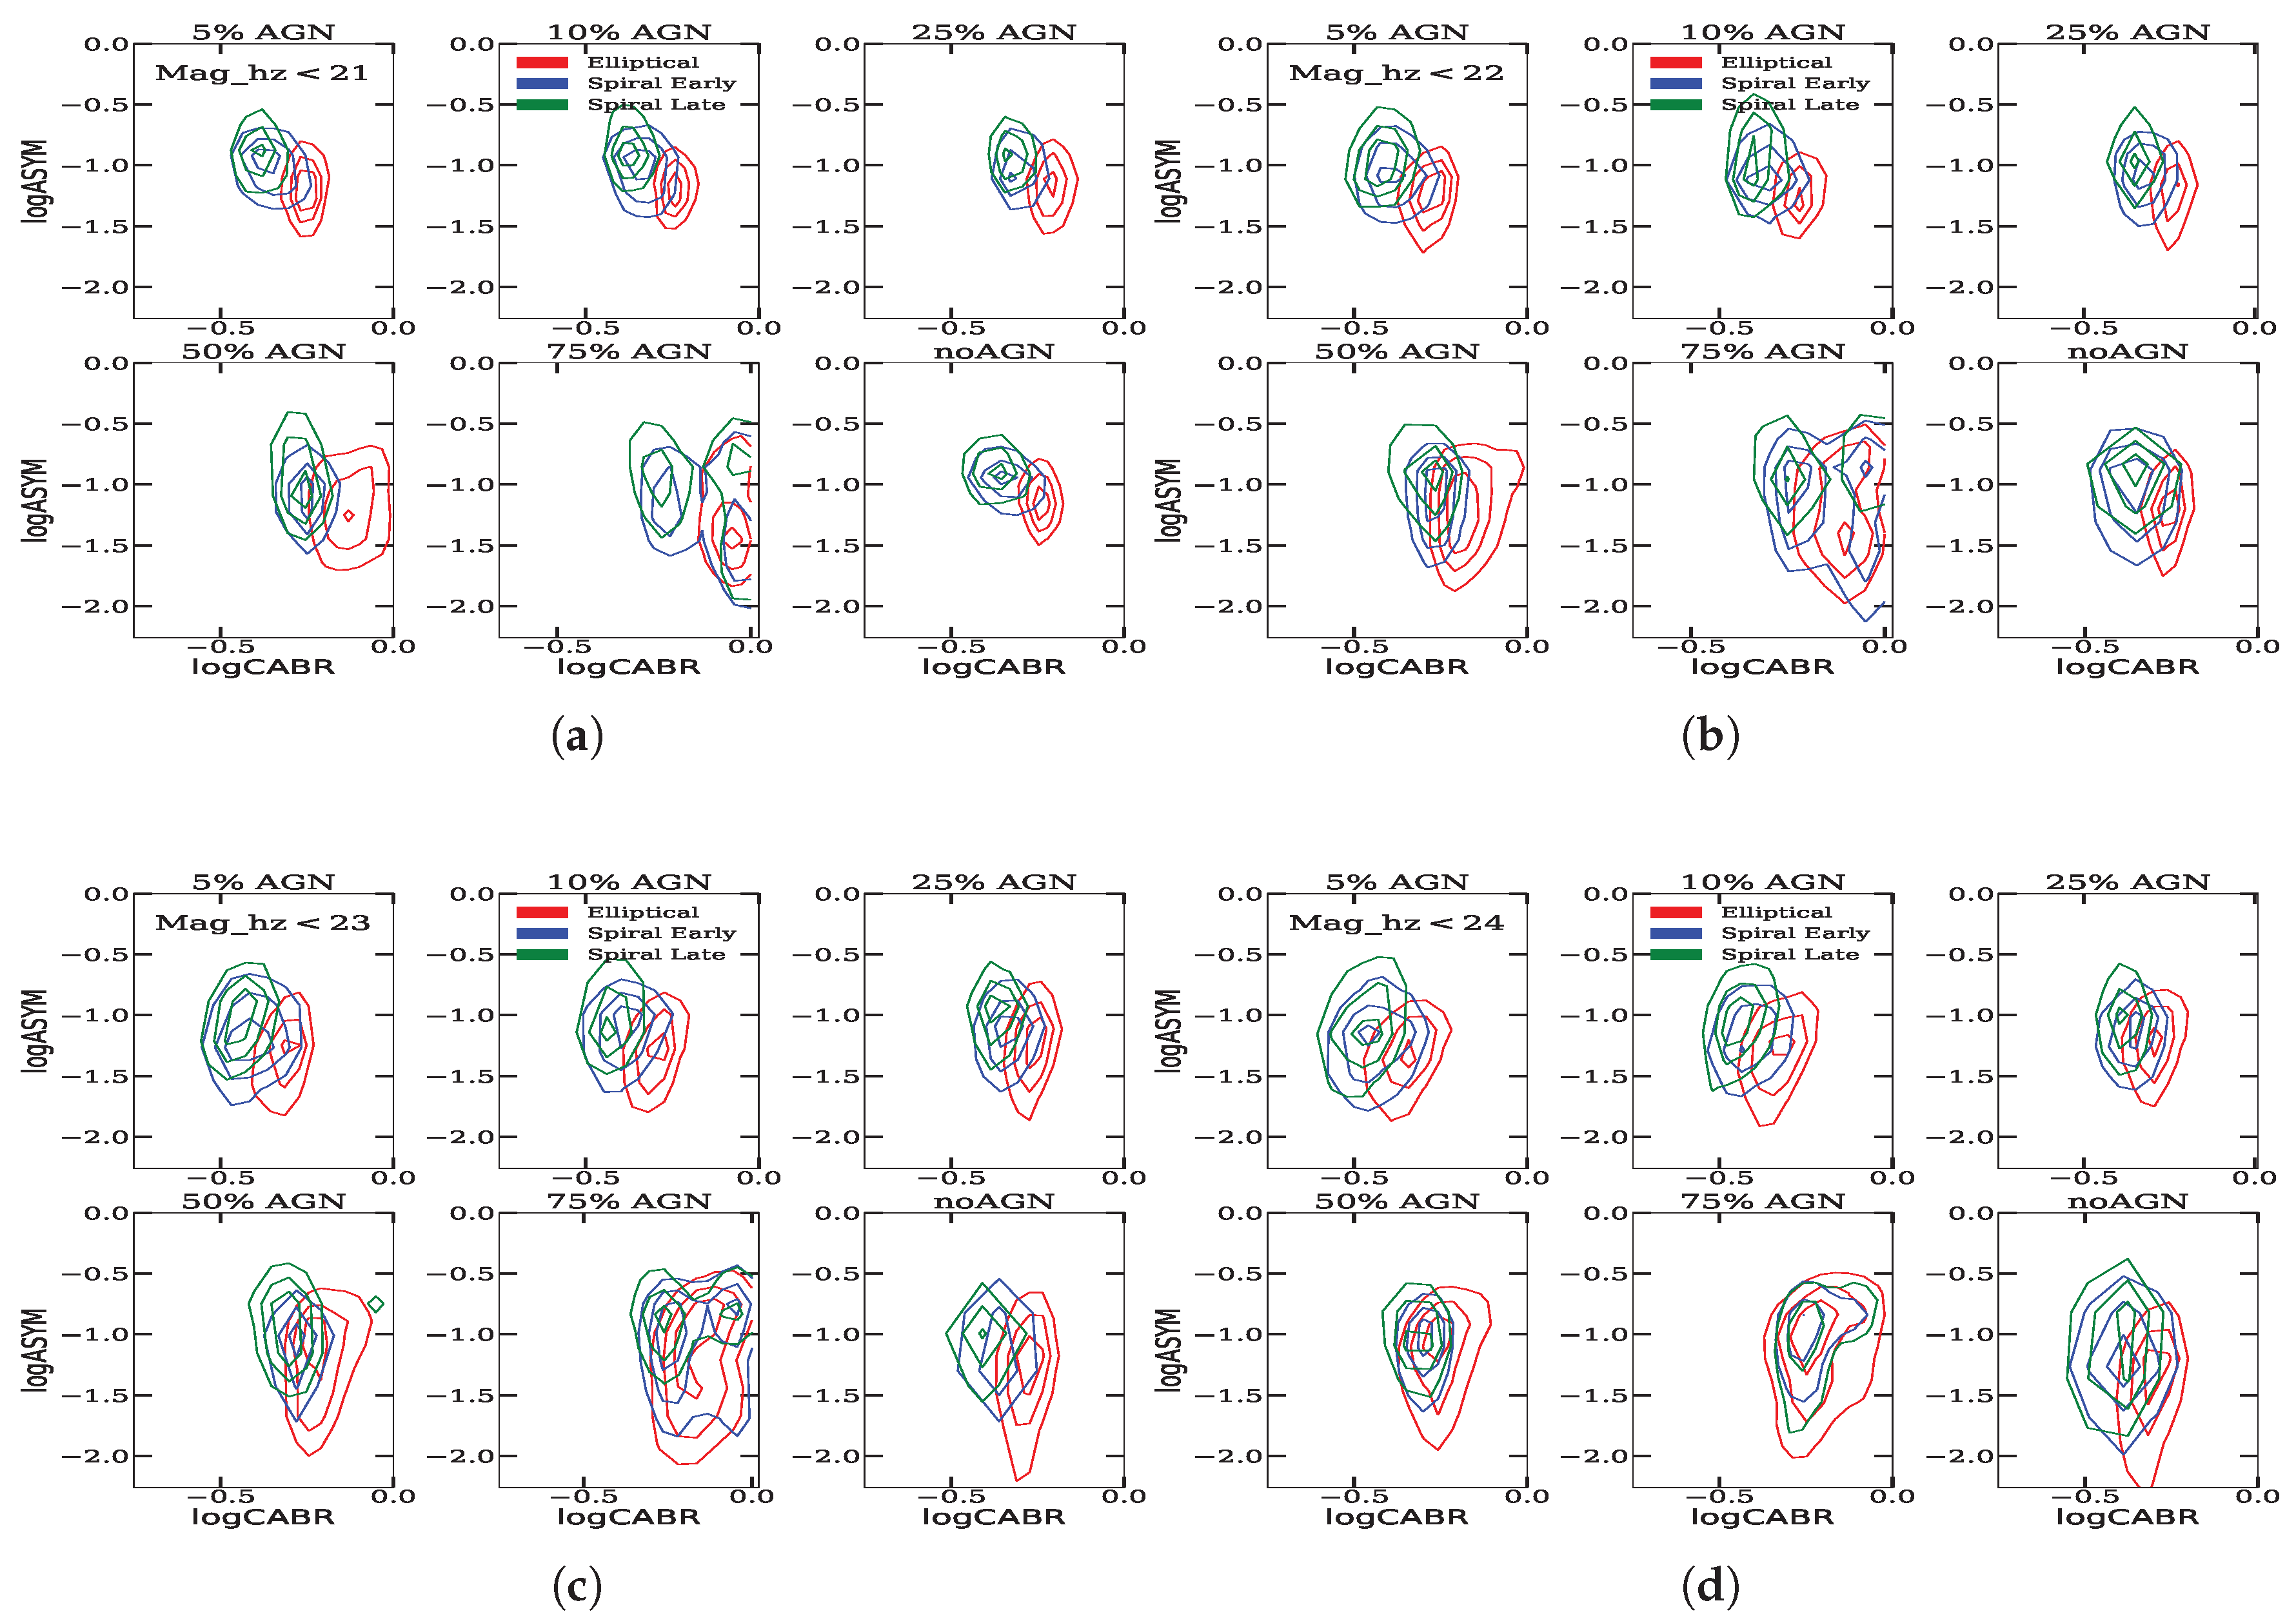
We analyze some of the most commonly used diagrams, such as CABR vs. CCON (see Figure 7), CABR vs. GINI (see Figure 8), GINI vs. M20 (see Figure 9), and ASYM vs. CABR (see Figure 10) using the simulated sample in COSMOS-like conditions, with 5–75% added AGN contribution, as indicated in the panels, and at z ∼ 0 with no AGN added (bottom right panel in all Figures). Each Figure has five plots (a–e), corresponding to 5 simulated magnitude limits (from mag_hz < 21 to mag_hz < 25). Each plot consists of 6 panels, which show the distribution of galaxies with added AGN of 5% (top, left), 10% (top, middle), 25% (top, right), 50% (bottom, left), 75% (bottom, middle), and without AGN added (bottom, right). The different colored contours correspond to different types of galaxies, such as early (red contours), early-spiral (blue), and late-spiral (green).

5. Discussion

In this section, we discuss the results obtained in this work, presented in Section 4.1, Section 4.2, Section 4.3 and Section 4.4. We present the results obtained for the six morphological parameters and the analyzed morphological diagrams, for the total sample, early-type galaxies, early-spirals, and late-spirals.
Of the three types of analyses carried out in Section 4.1, Section 4.2 and Section 4.3, we find that the greatest impact on morphological parameters occurs when considering the effect of magnitude, redshift, and AGN together, discussed in Section 4.1. Next, we measure the largest variations of the morphological parameters in the third case study, when AGN is added under COSMOS-like conditions, as explained in Section 4.3. Finally, the lowest variances were measured in the second case analyzed in Section 4.2 when comparing simulated active galaxies under local-like (at z ∼ 0) and COSMOS-like conditions. This indicates that, in general, the AGN influences the morphological properties of galaxies more than the magnitude/redshift effect. In addition, we find that in most cases significant changes in the morphological parameters start to occur with an AGN contribution > 25% and a magnitude mag_hz ≥ 23 (z > 1) in COSMOS-like conditions. This is an overall observation, but the numbers change slightly depending on the conditions analyzed and the morphological type of the galaxy, as shown above in Section 4. We also find that in the case of all three types of analysis, all morphological parameters of spiral galaxies are more affected than in early-type galaxies. Furthermore, late-spirals are more affected by magnitude, redshift, and AGN contribution than early-spirals. This is not surprising and has already been reported in [38]. Spiral galaxies, in particular late-spirals, have weaker bulges, and introducing an added AGN as a central component will affect all morphological parameters. In addition, the light in the disc will be more affected by the magnitude and redshift effect than in the case of early-type galaxies, which will lead to a larger change in the morphological parameters. Difficulties in the classification of late-type galaxies compared to early-type galaxies have already been observed in the past when classifying a large sample of galaxies (e.g., [1,39]), and when studying the effect of resolution and survey depth on the morphological classification of galaxies (e.g., [37], and references therein). Similarly, we find that the morphological parameters in normal galaxies are more affected by the magnitude and redshift than in active galaxies when comparing galaxies in local-like (at z ∼ 0) and COSMOS-like conditions. Again, this is not surprising, since AGN host galaxies are brighter and have concentrated light in the central part of the galaxy, they will be, by definition, less sensitive to the effect of magnitude and redshift, especially when it comes to concentration parameters.
Of all the parameters, GINI is the most stable on the magnitude and redshift effects and the contribution of AGN in all three cases analyzed and in the case of both early- and late-type galaxies (for more details on variances, see Section 4). We found the same result at z ∼ 0 in our previous study by [38]. The GINI coefficient emerges as the most robust morphological parameter, likely due to its inherent insensitivity to variations in spatial resolution and flux distribution. Unlike other concentration or asymmetry indices, which depend on the precise spatial distribution of light, the Gini coefficient measures only the difference in pixel flux values. This makes it less susceptible to redshift-induced PSF smoothing or AGN-driven central point sources. Being normalised by the total flux, it remains stable even when a bright AGN contaminates the nuclear region, as long as the light distribution of the underlying galaxy remains relatively unchanged. This parameter was commonly used in previous studies to separate early-type and spiral galaxies (e.g., [1,8,12,39]), to trace sub-structures in galaxies (e.g., [75]), mergers and interacting galaxies (e.g., [35,76]), strong-lensed galaxies (e.g., [77]). Some studies suggest that it can trace the overall structure of a galaxy better than any other morphological parameter (e.g., [78]). On the other hand, GINI may depend strongly on the signal-to-noise ratio and on the choice of the aperture within which it is measured (e.g., [37,75]). After GINI, the light concentration parameter that shows the lowest variance is M20, followed by CCON, and finally, CABR is the most affected. The last two parameters are particularly sensitive to the central light distribution, especially CABR, and therefore any additional light added in the central part of the galaxy will influence them directly. For ASYM, as in [38], we do not find significant changes when adding the AGN contribution, as this parameter is not sensitive to the light in the central part of the galaxy. However, as already reported in [8,37,73], this parameter is sensitive to noise and is measured for a smaller sample of galaxies (as mentioned in Section 4), and shall therefore be used in combination with other parameters to classify normal and active galaxies. Similar results have been seen previously in [72], suggesting that ASYM is extremely dependent on imaging properties, both resolution and depth. The SMOOTH parameter is the most difficult to measure in the case of both early-type and spiral galaxies. As shown in Section 4, this parameter is only measured in 20–45% of the galaxies, depending on the magnitude and redshift limit and AGN added contribution. Therefore, we do not find this parameter efficient in classifying active galaxies at higher redshifts. This is in agreement with the previous studies (e.g., [33,35]) and also our previous work [37], where we studied the impact of magnitude and redshift on normal galaxies, suggesting that SMOOTH is especially sensitive to all, noise, spatial resolution, and data depth, in comparison to other parameters.
We observe complex behavior of the parameters, shifting between higher and lower values in comparison to the reference sample as the magnitude and redshift limits and the AGN contribution change, as can be seen in Appendices Appendix A, Appendix B and Appendix C. In general, this depends on the definition of the parameters. The CABR parameter is the most sensitive to these changes. It is followed by the CCON concentration parameter, in particular at 50% and 75% of the added contribution of AGN when the distribution of the simulated samples changes completely, indicating that most of the total flux in the galaxy accumulates within a very small radius. This complex behavior of the parameters has already been seen in [37] for normal galaxies when studying only the impact of magnitude and redshift. However, when the AGN contribution is added, the behaviors become even more complex.
As already shown in [37,38], not necessarily a larger variation means that a parameter is less suitable for morphological classification, as commonly various parameters are used in classification, often simultaneously (e.g., [1,8,39,40,79]). We also see the same in this work. We analyzed several morphological diagrams to evaluate how redshift, magnitude, and AGN contribution together influence the classification of galaxies. When using the CABR vs. CCON diagram, most early- and late-type galaxies can be separated up to the AGN contribution of 50% if the mag_hz is <22, as seen in Figure 7. A stronger mixing starts at mag_hz < 23. Above that, galaxies can be distinguished between early- and late-types only for AGN contributions of 5%–10%. If the AGN contribution is 75% and above, there is a strong mix of types at all magnitudes, and galaxies can not differ from each other. Similar trends are observed in the CABR vs. GINI morphological diagram shown in Figure 8, but with slightly worse separations in all cases, including cases without any added AGN contribution. Although not shown in this paper, we find the worst separation between early- and late-type galaxies when using the GINI vs. CCON diagram, starting from lower AGN contributions of 10% at all magnitude limits. GINI vs. M20 diagram has been commonly used in the literature to identify galaxy mergers and peculiar (disturbed) galaxies [35,76,80,81], in addition to classifying early- and late-types (e.g., [33,82], and references therein). However, in this work, we do not find this diagram to be effective in separating early- and late-type galaxies when dealing with AGN hosts at higher redshift in COSMOS-like conditions, as shown in Figure 9. Under each case of magnitude and redshift limit and independently of the AGN contribution, we find that early- and late-type galaxies occupy similar areas in the diagram. Therefore, we do not recommend using this diagram alone when dealing with morphological classification of active galaxies in COSMOS-like conditions. This is not entirely surprising, and is in line with the results of [37], where in three surveys analyzed with different survey depths, this diagram proved to be ineffective in separating the different morphological types. Finally, CABR vs. ASYM diagrams (see Figure 10) show a reasonable separation between early- and late-type galaxies up to mag_hz < 23 and AGN contribution of 25%. At fainter magnitude limits and higher AGN contributions of 50% and 75%, there is a higher contamination between morphological types. This diagram is commonly used in previous studies to classify both normal and active early- and late-type galaxies (e.g., [1,8,12,40,73,83]). In addition, the ASYM parameter was recently used in combination with the CCON parameter to classify post-starburst galaxies [84]. To summarize, we find CABR vs. CCON and CABR vs. ASYM to be the most efficient in the classification of AGN host galaxies at higher redshift in COSMOS-like conditions, in particular up to mag_hz < 22 and AGN contribution of ≤25%, followed by the CABR vs. GINI diagram. We do not recommend using the GINI vs. M20 diagram to classify active galaxies in COSMOS-like conditions.

6. Conclusions

In this work, we studied how the AGN can affect morphological parameters of galaxies under COSMOS-like conditions when dealing with fainter magnitudes and an intermediate redshift of z ∼ 2. The main objective of this study is to quantify the impact of magnitude, redshift, and AGN on six commonly used morphological parameters, Abraham concentration index (CABR), Gini coefficient (GINI), Conselice-Bershady concentration index (CCON), M20 moment of light (M20), asymmetry (ASYM) and smoothness (SMOOTH) in COSMOS-like conditions. We add 5–75% AGN contribution to the centre of local galaxies from the SDSS survey with known morphology and move them to intermediate redshifts and fainter magnitudes corresponding to a sample of galaxies in the COSMOS field.
We performed three types of analysis on the total sample, early-type, early-spiral, and late-spiral galaxies, studying: (1) the combined impact of magnitude, redshift, and AGN on morphological parameters, (2) the impact of magnitude and redshift on the morphological parameters of active galaxies, and (3) the impact of AGN on the morphological parameters of intermediate-redshift galaxies in COSMOS-like conditions. In all analyses, we quantified the variance in morphological parameters for different magnitude/redshift conditions and AGN contribution. Our main findings are as follows:
  • The greatest impact on morphological parameters is when considering the combined effect of magnitude, redshift and AGN. Combined, these effects affect morphological parameters of spiral galaxies more than early-type galaxies.
  • The impact of the magnitude/redshift will affect the morphological parameters of active galaxies less than those of normal galaxies in COSMOS-like conditions. In general, in most cases, for an AGN contribution to the total flux of up to 50%, the impact of magnitude/redshift on the morphological parameters of active galaxies is <20%, being higher at fainter magnitudes.
  • If the AGN contribution to the total galaxy flux is ≥50%, the AGN effect dominates the impact on all morphological parameters compared to the effect of magnitude/redshift in the case of all morphological types. For AGN contributions of <50%, the AGN will have a dominant effect up to g < 23, while at fainter magnitudes the impact of the magnitude/redshift will play a more important role in the change of morphological parameters than an AGN. The impact of AGN in combination with magnitude/redshift on morphological parameters under COSMOS-like conditions is particularly complex for spiral galaxies, compared to early-type galaxies, which are, in general, less affected.
  • In general, in COSMOS-like conditions up to intermediate redshift of z ∼ 2 all four concentration parameters will undergo significant changes of >20% for >25% of the added AGN, similar to what we found previously at z ∼ 0, affecting spiral galaxies more than early-types and, in particular, late-spirals.
  • We find that GINI is the most stable in terms of the effect of both AGN and magnitude/redshift, followed by the M20 moment of light, CCON, and finally CABR. ASYM and SMOOTH are very sensitive to the noise and image properties, and are measured for a much smaller fraction of the total sample.
  • Finally, we find CABR vs. CCON and CABR vs. ASYM to be the most efficient diagrams in the classification of AGN host galaxies at higher redshift in COSMOS-like conditions, in particular up to mag_hz < 22 and AGN contribution of ≤25%, followed by the CABR vs. GINI diagram. We do not recommend using the GINI vs. M20 diagram to classify active galaxies in COSMOS-like conditions.
While our analysis focuses on the detailed behaviour of morphological parameters under AGN contamination and magnitude/redshift effects, the broader implications are directly relevant to galaxy evolution studies, as galaxy structure is a key property for understanding the complete physics of galaxies and thus morphological classification is essential in galaxy studies. Specifically, with the conclusions and recommendations given above, our study defines the limits for the reliable use of different concentration and galaxy shape indices, and diagnostic diagrams to identify structural features in galaxies where resolution is limited and AGN activity is prevalent. These results are especially important for understanding the role of AGN feedback in galaxy morphology, the connection between AGN and their host galaxy, and the classification of active galaxies in current and future large deep-field and all-sky surveys, where PSF variation and flux contamination are inevitable. Furthermore, by covering the full range of AGN contamination possibilities (5%-75%), our results can be applied to both type-1 and type-2 AGN. This is especially important at higher redshift, where the fraction of AGN, and in particular type-1 AGN, is higher. Finally, by clarifying which parameters remain robust across all conditions analysed, our study improves the selection of reliable morphological diagnostics to trace the evolution of galaxies over cosmic time.

Author Contributions

T.G.-W. was responsible for the main analysis and paper edition. M.P. and J.M. participated in the analysis, discussion, and drafting of the paper. J.P. was responsible for the development of the code for the simulation of AGN contribution and statistical analysis. I.M. contributed to the development of Figure 4, Figure 5 and Figure 6. A.M. supported the coding in Python. S.T.M. participated in the general discussion. All authors have read and agreed to the published version of the manuscript.

Funding

T.G.-W. acknowledges the support from Bule Hora University under the Ministry of Science and Higher Education. T.G.-W., M.P. and S.T. acknowledge financial support from the Space Science and Geospatial Institute (SSGI) under the Ethiopian Ministry of Innovation and Technology (MInT). S.T. acknowledges the financial support from Jimma University. T.G.-W., J.M., M.P. and I.M. acknowledge the support given through the grant CSIC I-COOP 2017, COOPA20168. A.M. acknowledges support from the National Research Foundation of South Africa and financial support from the Swedish International Development Cooperation Agency (SIDA) through the International Science Programme (ISP)-Uppsala University to the University of Rwanda through the Rwanda Astrophysics, Space and Climate Science Research Group (RASCSRG). M.P., J.M., J.P. and I.M.P. acknowledge the support from the Spanish Ministerio de Ciencia e Innovación-Agencia Estatal de Investigación through projects PID2019-106027GB-C41, PID2022-140871NB-C21, and AYA2016-76682C3-1-P, and the State Agency for Research of the Spanish MCIU through the Center of Excellence Severo Ochoa award to the Instituto de Astrofísica de Andalucía (CEX2021-001131-S funded by MCIN/AEI/10.13039/501100011033).

Data Availability Statement

In support of this study, no new data were generated or analysed. The data used in this article can be obtained from the public sources cited in the article (or references therein).

Acknowledgments

We thank the anonymous referees for accepting to review this paper and for providing constructive and valuable comments that improved the manuscript. In this work, we made use of the Virtual Observatory Tool for OPerations on Catalogues And Tables (TOPCAT) (Version 4.8-5) and Python (Version 3.12.x).

Conflicts of Interest

The authors declare no conflicts of interest.

Abbreviations

The following abbreviations are used in this manuscript:
ACSAdvanced Camera for Surveys
AGNActive Galactic Nuclei
ASYMasymmetry index
BPTBaldwin–Phillips–Terlevich diagram
CABRAbraham concentration index
CCONConselice–Bershady concentration index
galSVMgalaxy Support Vector Machine
GINIGINI coefficient
IRAFImage Reduction and Analysis Facility
LINERLow-Ionization Nuclear Emission-line Region
magmagnitude
M20M20 moment of light
SDSSSloan Digital Sky Survey
SVMsupport vector machine
TOPCATTool for OPerations on Catalogues Furthermore, Tables

Appendix A. Comparing the Local Sample (No AGN) with COSMOS-like Samples (Without and with AGN Added)
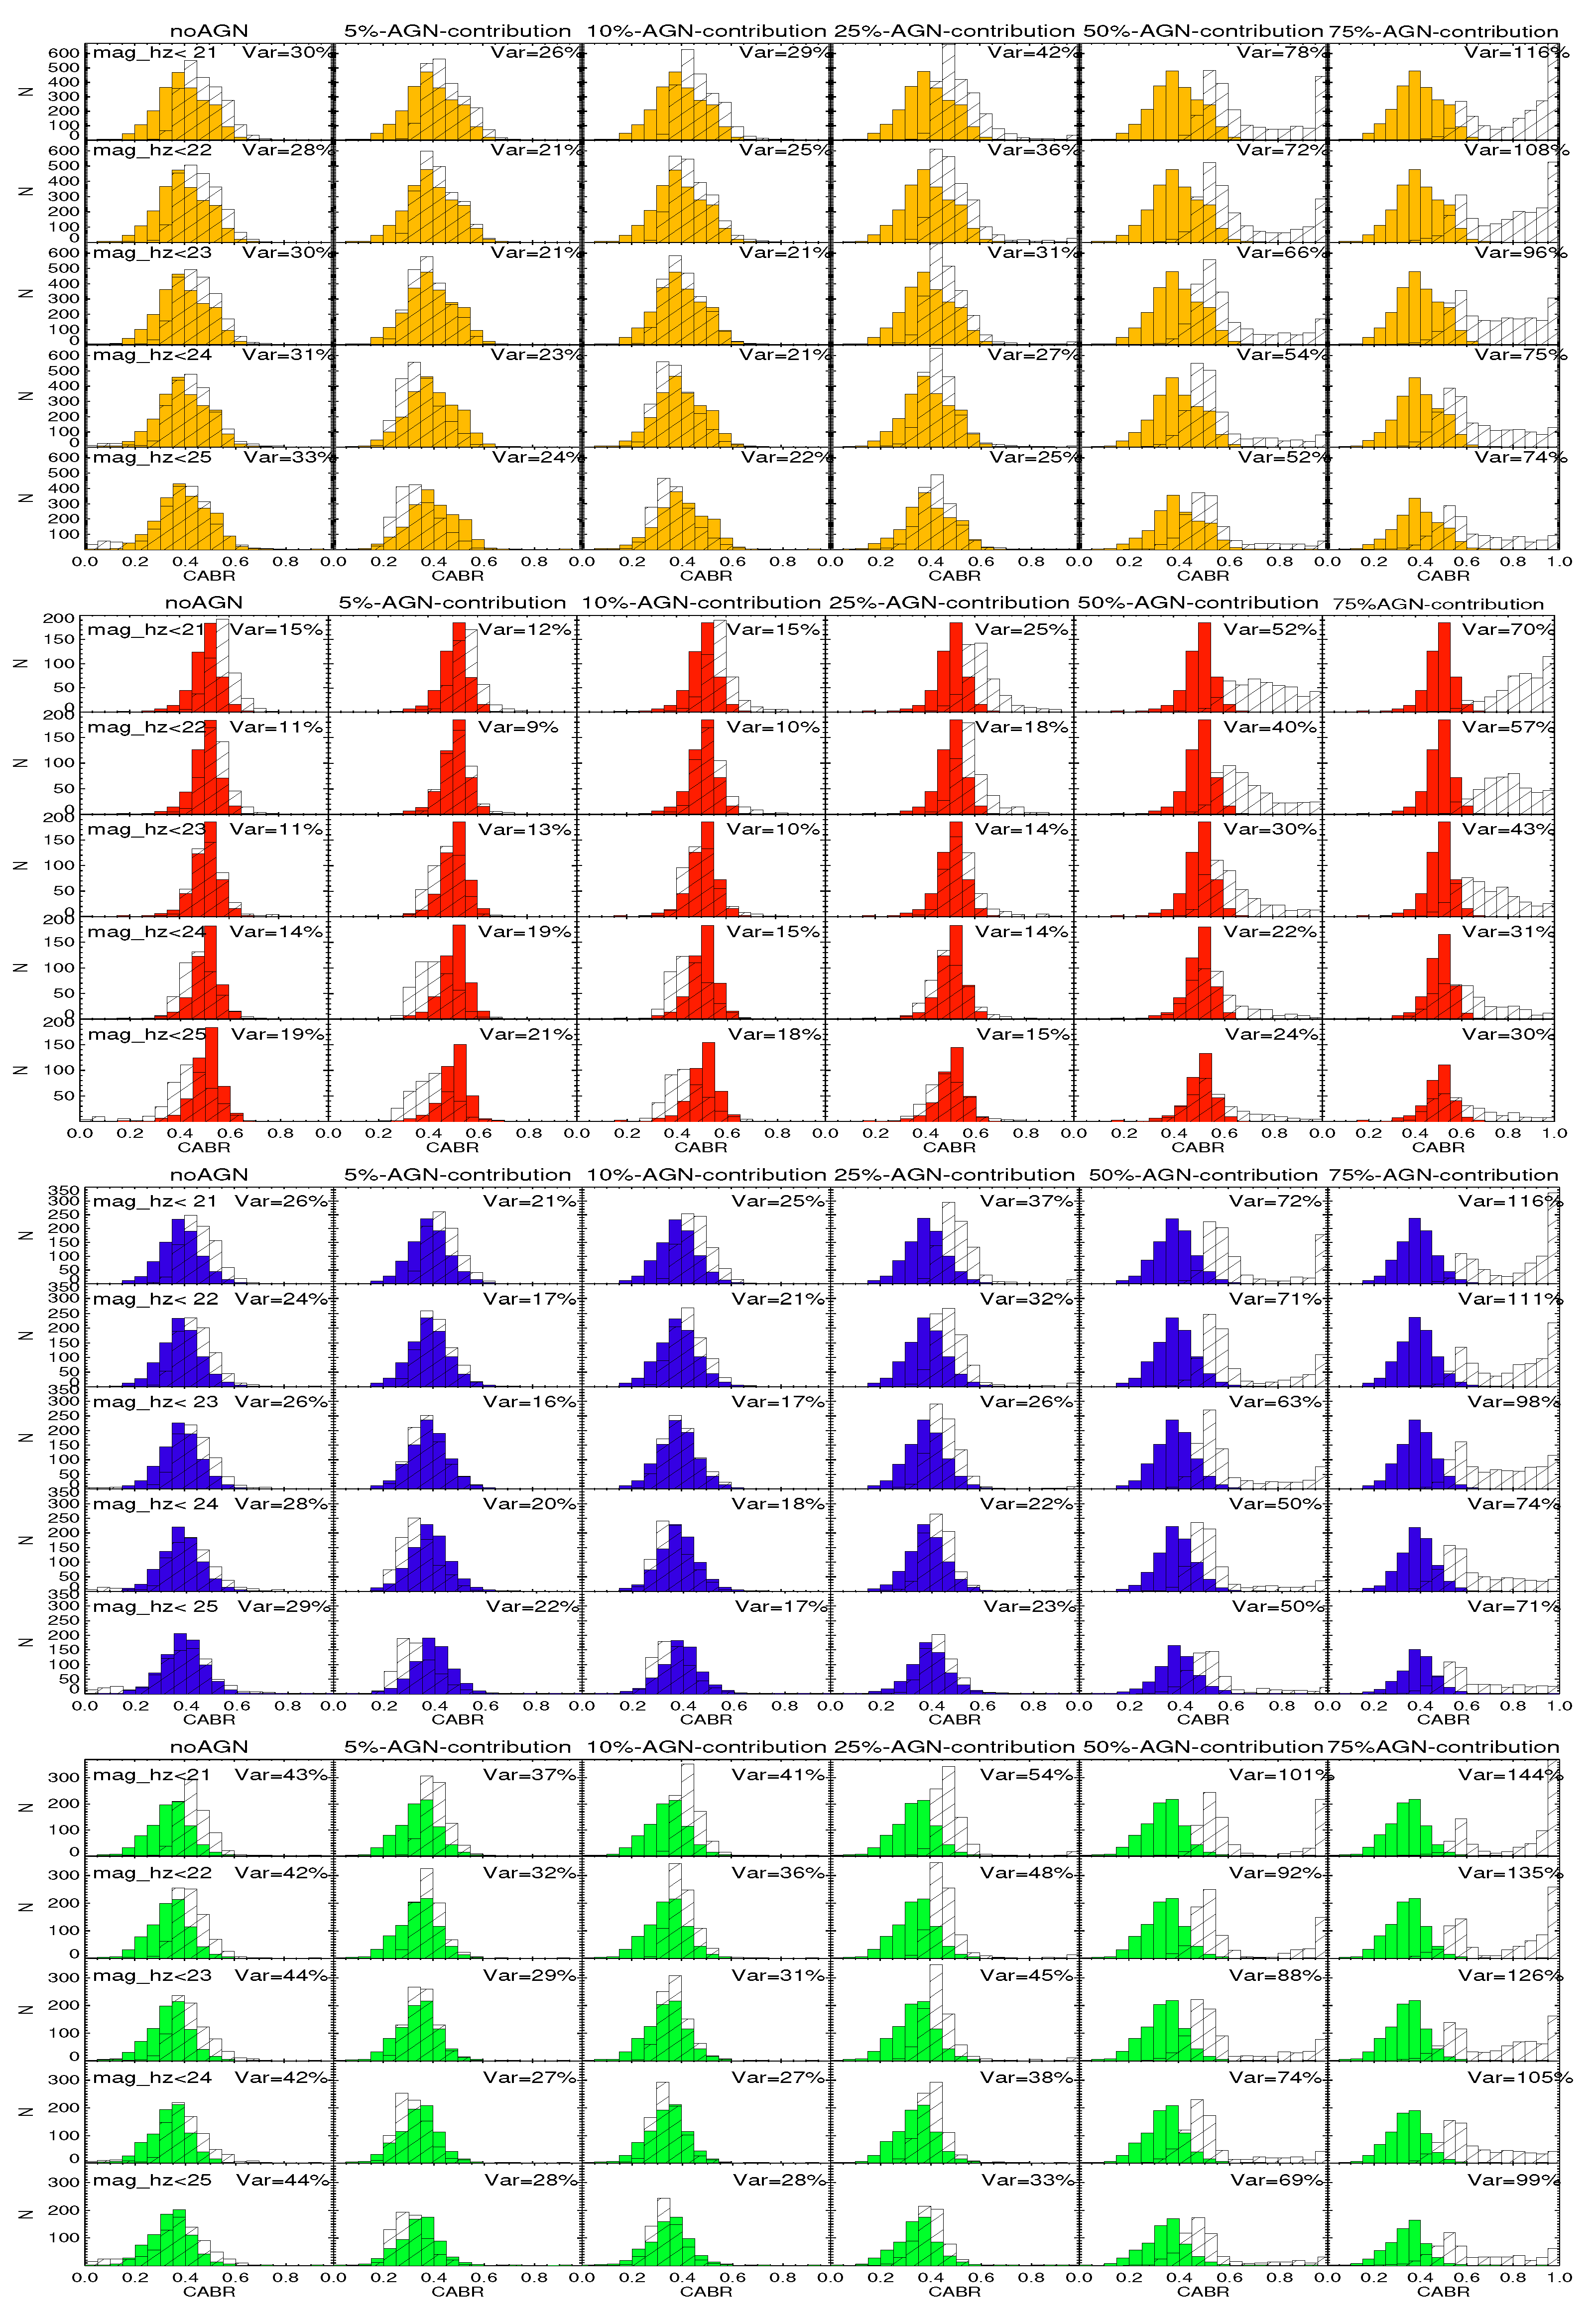
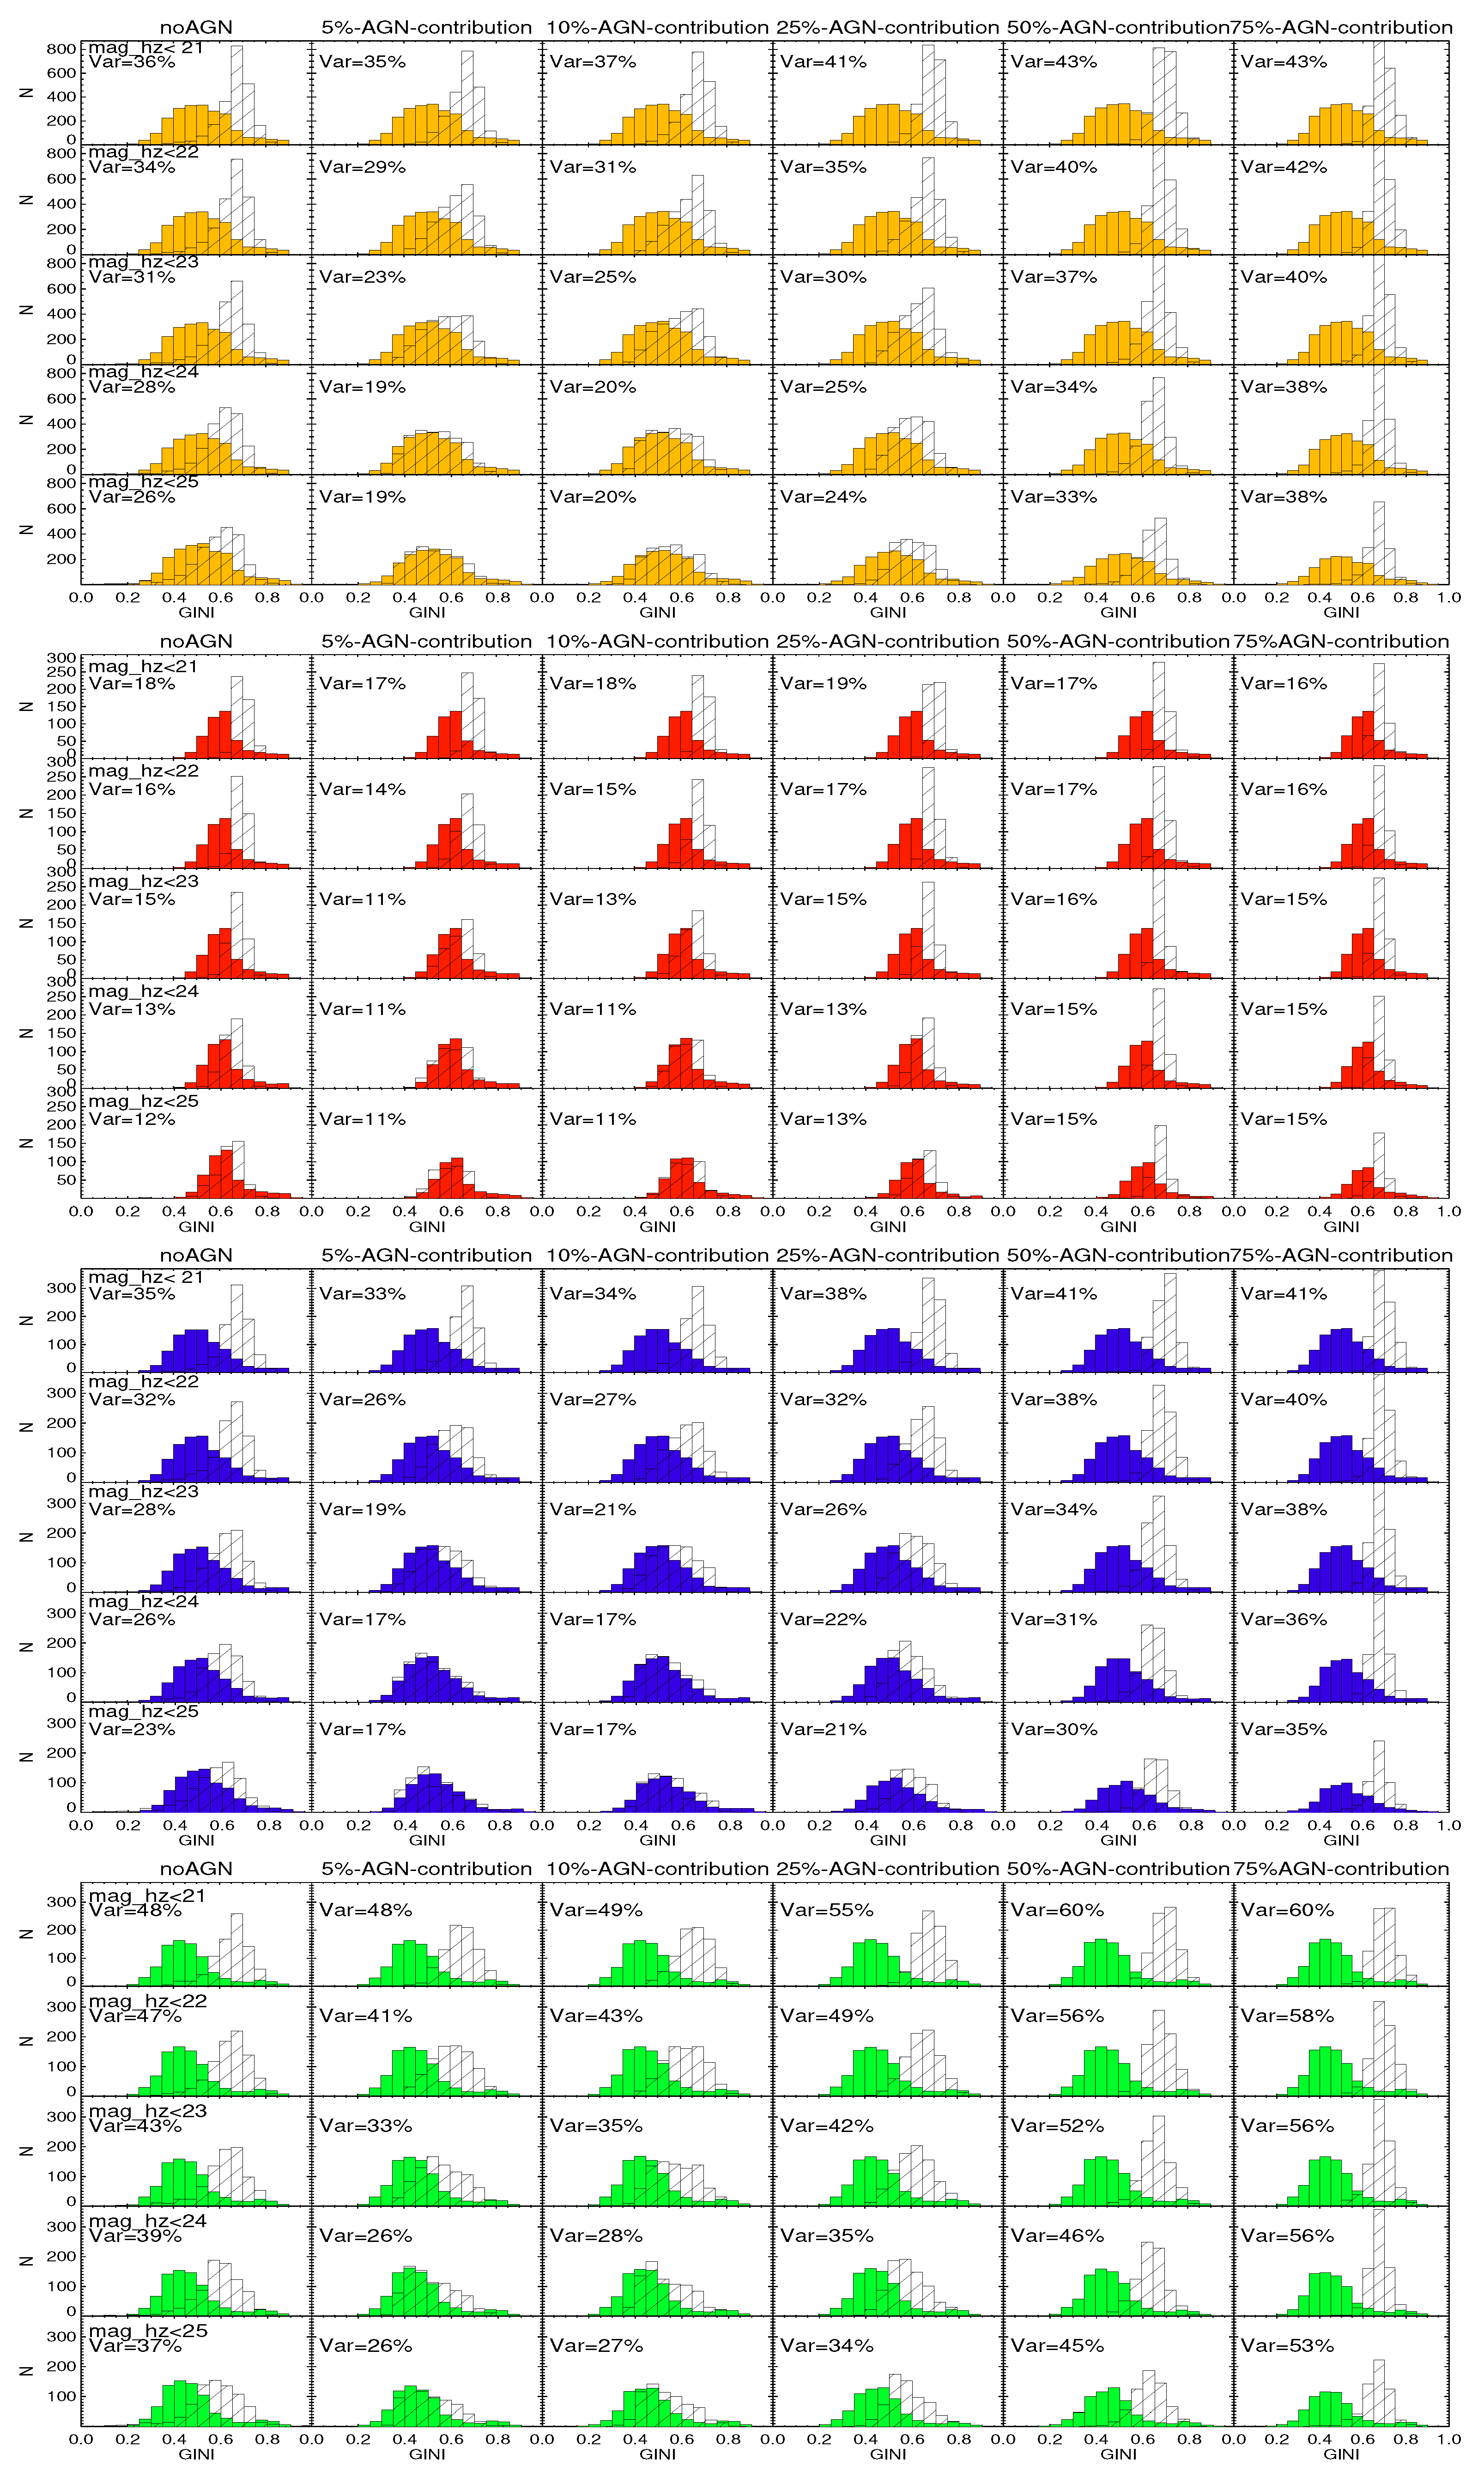
Figure A1. Comparison between the values of CABR for the original sample at z ∼ 0 without any added AGN contributions (filled histograms) and the simulated sample (opened histograms) moved to higher redshifts and fainter magnitudes from 21 to 25 (from top to bottom rows) without AGN (first columns) and for five AGN contributions added from 5% to 75% (second to last columns). From top to bottom, the distributions of the total sample (yellow colour), early-type (red), early-spiral (blue) and late-spiral (green) galaxies are shown.
Galaxies 13 00084 g0a1
Figure A2. Same as Figure A1, but for the GINI parameter.
Galaxies 13 00084 g0a2
Figure A3. Same as Figure A1, but for the CCON parameter.
Galaxies 13 00084 g0a3
Figure A4. Same as Figure A1, but for the M20 moment of light.
Galaxies 13 00084 g0a4
Figure A5. Same as Figure A1, but for the ASYM parameter.
Galaxies 13 00084 g0a5
Figure A6. Same as Figure A1, but for the SMOOTHness parameter.
Galaxies 13 00084 g0a6

Appendix B. Comparing the Local-like AGN Sample with the COSMOS-like AGN Sample
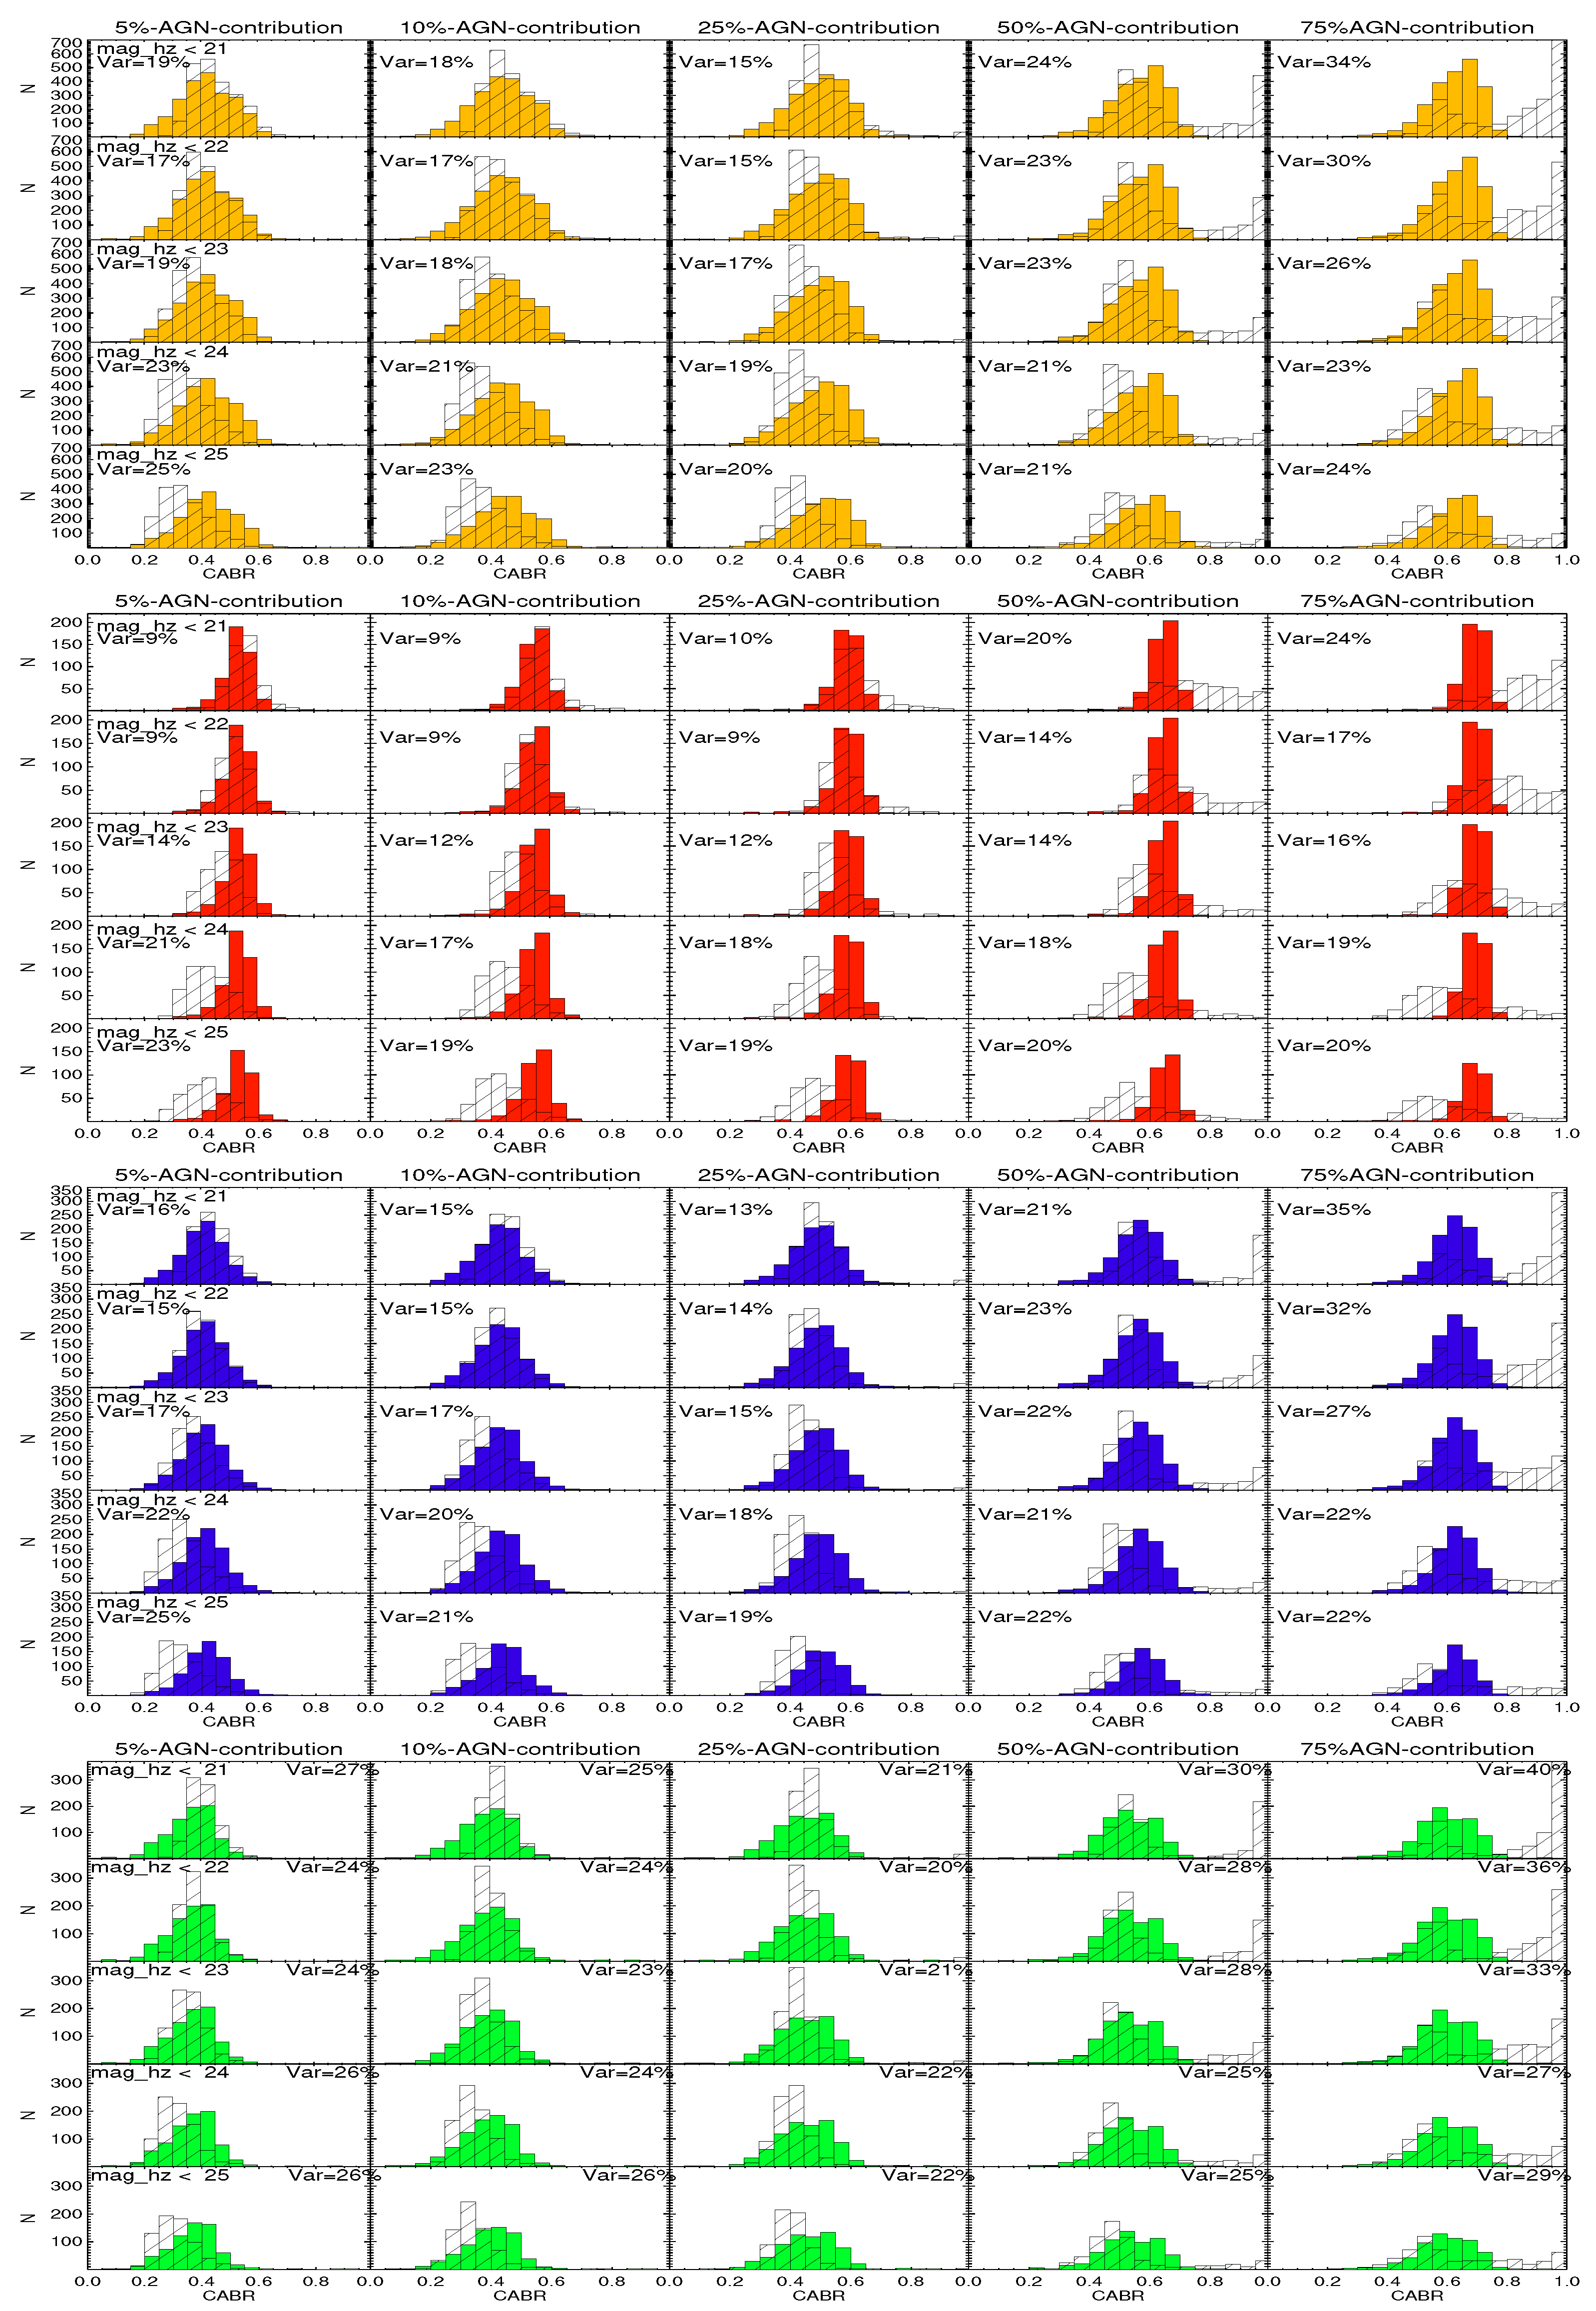
Figure A7. The comparison of the CABR parameter measured after adding the AGN (from 5–75%, columns 2 to 5, respectively) to the images of the original sample at z ∼ 0 (filled histograms), and to the sim ulated images (open histograms) after taking into account higher redshifts and 5 different magnitude cuts from 21 to 25 (first to the fifth row, respectively). From top to bottom, the distributions of the total sample (yellow), early-type galaxies (red), early-spirals (blue), and late-spirals (green) are shown, respectively.
Galaxies 13 00084 g0a7
Figure A8. Same as Figure A7, but for the GINI parameter.
Galaxies 13 00084 g0a8
Figure A9. Same as Figure A7, but for the CCON parameter.
Galaxies 13 00084 g0a9
Figure A10. Same as Figure A7, but for the M20 moment of light.
Galaxies 13 00084 g0a10
Figure A11. Same as Figure A7, but for the ASYM parameter.
Galaxies 13 00084 g0a11
Figure A12. Same as Figure A7, but for the SMOOTHness parameter.
Galaxies 13 00084 g0a12

Appendix C. Comparing the COSMOS-like Sample with and Without AGN
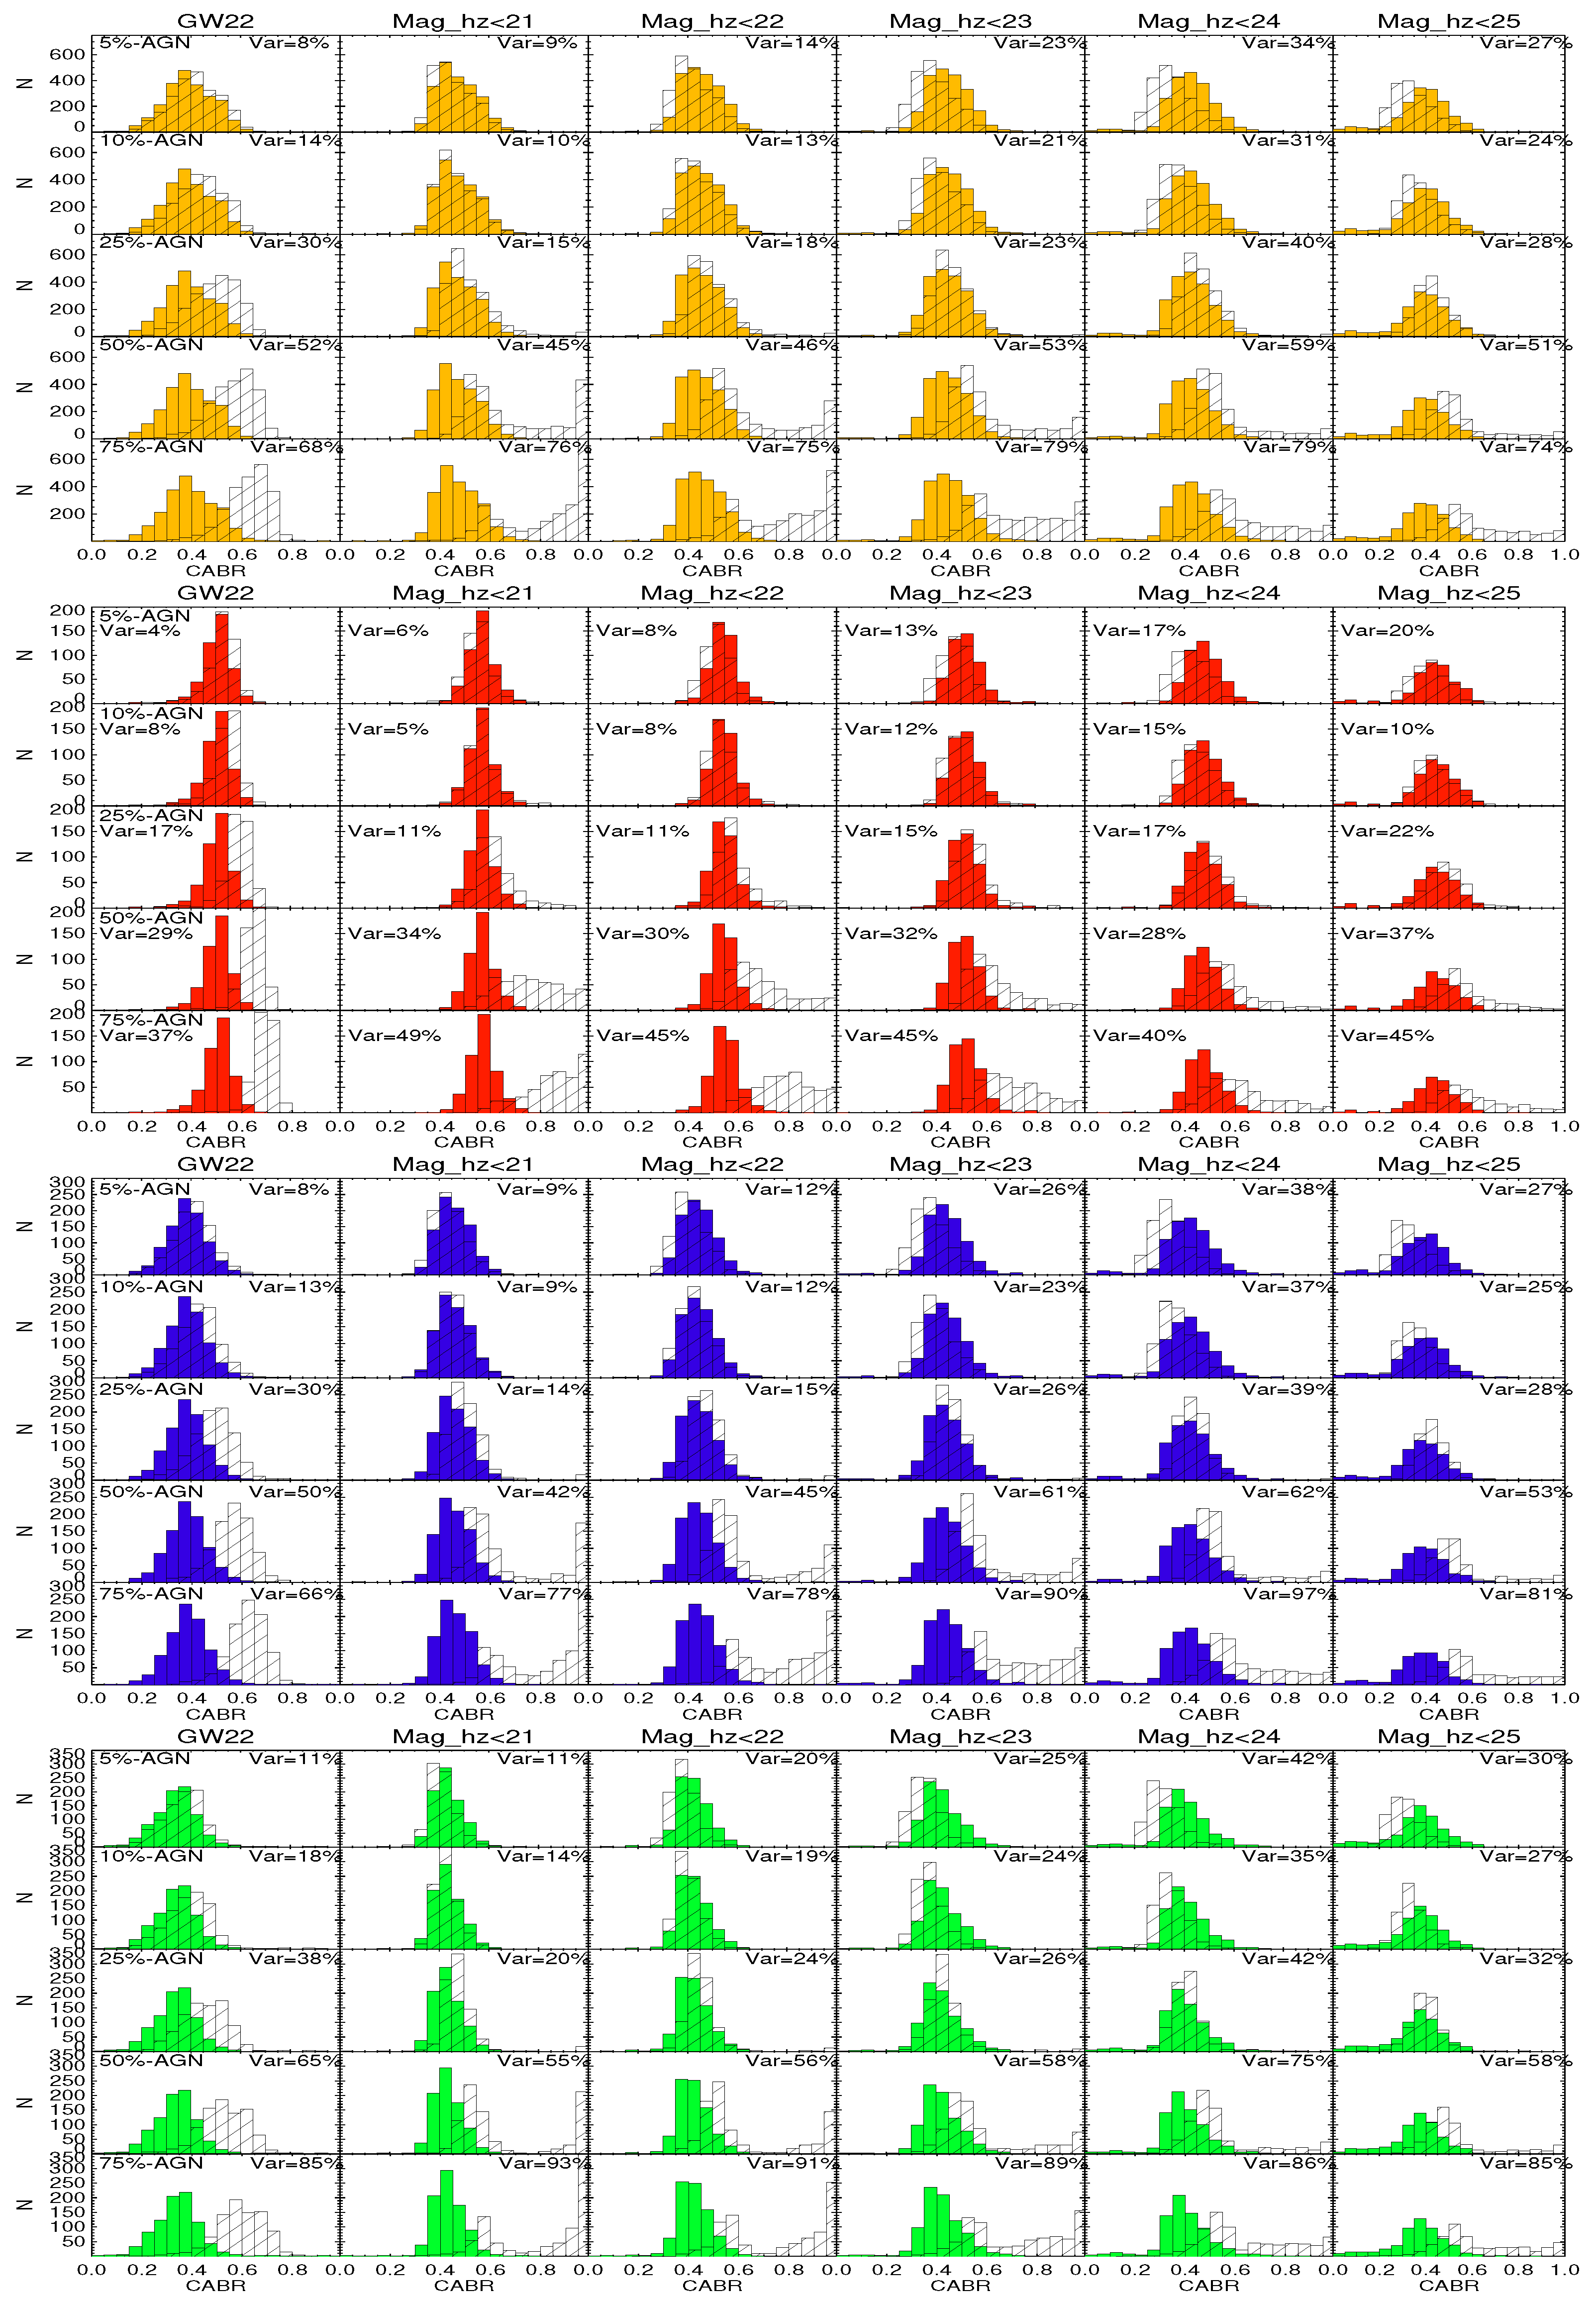
Figure A13. The comparison of CABR between the original sample at z ∼ 0 without (filled histograms) and with (open histograms) added AGN contribution of 5% to 75% (top to bottom rows, respectively) using the original sample at z ∼ 0 (first columns) and the simulated samples moved to fainter magnitudes from 21 to 25 (columns 2 to 6, respectively). From top to bottom, the distributions of the total sample (yellow), early-type galaxies (red), early-spirals (blue), and late-spirals (green) are shown, respectively.
Galaxies 13 00084 g0a13
Figure A14. Same as Figure A13, but for the GINI parameter.
Galaxies 13 00084 g0a14
Figure A15. Same as Figure A13, but for the CCON parameter.
Galaxies 13 00084 g0a15
Figure A16. Same as Figure A13, but for the M20 moment of light.
Galaxies 13 00084 g0a16
Figure A17. Same as Figure A13, but for the ASYM parameters.
Galaxies 13 00084 g0a17
Figure A18. Same as Figure A13, but for the SMOOTH parameters.
Galaxies 13 00084 g0a18

Note

1
https://www.mpa.mpa-garching.mpg.de/SDSS/ (accessed on 31 October 2008).

References

  1. Beyoro-Amado, Z.; Pović, M.; Sánchez-Portal, M.; Tessema, S.B.; Bongiovanni, A.; Cepa, J.; Cervińo, M.; González-Serrano, J.I.; Nadolny, J.; Pérez Garcia, A.M.; et al. A morphological study of galaxies in ZwCl0024+1652, a galaxy cluster at redshift z ∼ 0.4. Mon. Not. R. Astron. Soc. 2019, 485, 1528. [Google Scholar] [CrossRef]
  2. Conselice, C.J. The evolution of galaxy structure over cosmic time. Annu. Rev. Astron. Astrophys. 2014, 52, 291–337. [Google Scholar] [CrossRef]
  3. Dimauro, P.; Daddi, E.; Shankar, F.; Cattaneo, A.; Huertas-Company, M.; Bernardi, M.; Caro, F.; Dupke, R.; Häußler, B.; Johnston, E.; et al. Coincidence between morphology and star formation activity through cosmic time: The impact of the bulge growth. Mon. Not. R. Astron. Soc. 2022, 513, 256–281. [Google Scholar] [CrossRef]
  4. Gabor, J.M.; Impey, C.D.; Jahnke, K.; Simmons, B.D.; Trump, J.R.; Koekemoer, A.M.; Brusa, M.; Cappelluti, N.; Schinnerer, E.; Smolčić, V.; et al. Active Galactic Nucleus Host Galaxy Morphologies in COSMOS. Astrophys. J. 2009, 691, 705–722. [Google Scholar] [CrossRef]
  5. Mei, S.; Hatch, N.A.; Amodeo, S.; Afanasiev, A.V.; De Breuck, C.; Stern, D.; Cooke, E.A.; Gonzalez, A.H.; Noirot, G.; Rettura, A.; et al. Morphology-density relation, quenching, and mergers in CARLA clusters and protoclusters at 1.4 < z < 2.8. Astron. Astrophys. 2023, 670, A58. [Google Scholar] [CrossRef]
  6. Pović, M.; Sánchez-Portal, M.; Pérez García, A.M.; Bongiovanni, A.; Cepa, J.; Alfaro, E.; Castaneda, H.; Lorenzo, M.F.; Gallego, J.; González-Serrano, J.I.; et al. OTELO Survey: Deep BVRI Broadband Photometry of the Groth Strip. II. Optical Properties of X-Ray Emitters. Astrophys. J. 2009, 706, 810. [Google Scholar] [CrossRef]
  7. Pović, M.; Sánchez-Portal, M.; Pérez García, A.M.; Bongiovanni, A.; Cepa, J.; Lorenzo, M.F.; Lara-López, M.A.; González-Serrano, J.I.; Alfaro, E.J. On the Anticorrelation Between Galaxy Light Concentration and X-ray-to-Optical Flux Ratio. Astrophys. J. 2009, 702, L51. [Google Scholar] [CrossRef]
  8. Pović, M.; Huertas-Company, M.; Aguerri, J.A.L.; Márquez, I.; Masegosa, J.; Husillos, C.; Molino, A.; Cristóbal-Hornillos, D.; Perea, J.; Benítez, N.; et al. The ALHAMBRA survey: Reliable morphological catalogue of 22 051 early- and late-type galaxies. Mon. Not. R. Astron. Soc. 2013, 435, 3444–3461. [Google Scholar] [CrossRef]
  9. Pović, M.; Pérez García, A.M.; Sánchez-Portal, M.; Bongiovanni, A.; Cepa, J.; Lorenzo, M.F.; Lara-López, M.A.; Gallego, J.; Ederoclite, A.; Márquez, I.; et al. X-ray luminosity functions of different morphological and X-ray type AGN populations. Astron. Nachrichten 2013, 334, 288–299. [Google Scholar] [CrossRef]
  10. Lintott, C.J.; Schawinski, K.; Slosar, A.; Land, K.; Bamford, S.; Thomas, D.; Raddick, M.J.; Nichol, R.C.; Szalay, A.; Andreescu, D.; et al. Galaxy Zoo: Morphologies derived from visual inspection of galaxies from the Sloan Digital Sky Survey. Mon. Not. R. Astron. Soc. 2008, 389, 1179–1189. [Google Scholar] [CrossRef]
  11. Buta, R.J. Galaxy Morphology. In Planets, Stars and Stellar Systems; Springer: Dordrecht, The Netherlands, 2013; pp. 1–89. [Google Scholar]
  12. Mahoro, A.; Pović, M.; Nkundabakura, P.; Nyiransengiyumva, B.; Väisänen, P. Star formation in far-IR AGN and non-AGN galaxies in the green valley-II. Morphological analysis. Mon. Not. R. Astron. Soc. 2019, 485, 452–463. [Google Scholar] [CrossRef]
  13. Nair, P.B.; Abraham, R.G. A catalog of detailed visual morphological classifications for 14,034 galaxies in the sloan digital sky survey. Astrophys. J. Suppl. Ser. 2010, 186, 427–456. [Google Scholar] [CrossRef]
  14. Simmons, B.D.; Lintott, C.; Willett, K.W.; Masters, K.L.; Kartaltepe, J.S.; Häußler, B.; Kaviraj, S.; Krawczyk, C.; Kruk, S.J.; McIntosh, D.H.; et al. Galaxy Zoo: Quantitative visual morphological classifications for 48,000 galaxies from CANDELS. Mon. Not. R. Astron. Soc. 2017, 464, 4420–4447. [Google Scholar] [CrossRef]
  15. Willett, K.W.; Galloway, M.A.; Bamford, S.P.; Lintott, C.J.; Masters, K.L.; Scarlata, C.; Simmons, B.D.; Beck, M.; Cardamone, C.N.; Cheung, E.; et al. Galaxy Zoo: Morphological classifications for 120, 000 galaxies in HST legacy imaging. Mon. Not. R. Astron. Soc. 2017, 464, 4176–4203. [Google Scholar] [CrossRef]
  16. Zywucka, N.; Koziel Wierzbowska, D.; Goyal, A. Catalogue with visual morphological classification of 32,616 radio galaxies with optical hosts. Proc. Int. Astron. Union 2021, 356, 361–363. [Google Scholar]
  17. Jiménez-Teja, Y.; Benítez, N. A New Tool for Image Analysis Based on Chebyshev Rational Functions: CHEF Functions. Astrophys. J. 2012, 745, 150. [Google Scholar] [CrossRef]
  18. Nadolny, J.; Bongiovanni, Á.; Cepa, J.; Cerviño, M.; García, A.M.P.; Pović, M.; Martínez, R.P.; Sánchez-Portal, M.; de Diego, J.A.; Pintos-Castro, I.; et al. The OTELO survey as a morphological probe. Last ten Gyr of galaxy evolution. The mass-size relation up to z = 2. Astron. Astrophys. 2021, 647, A89. [Google Scholar] [CrossRef]
  19. Peng, C.Y.; Ho, L.C.; Impey, C.D.; Rix, H.-W. Detailed Structural Decomposition of Galaxy Images. Astrophys. J. 2002, 124, 266–293. [Google Scholar] [CrossRef]
  20. Peng, C.Y.; Ho, L.C.; Impey, C.D.; Rix, H.-W. Detailed Decomposition of Galaxy Images. II. Beyond Axisymmetric Models. Astron. J. 2010, 139, 2097–2129. [Google Scholar] [CrossRef]
  21. Sersic, J.L. The southern barred spiral NGC 2442. Astron. Astrophys. Suppl. Ser. 1993, 98, 21–27. [Google Scholar]
  22. Simard, L.; Mendel, J.T.; Patton, D.R.; Ellison, S.L.; McConnachie, A.W. A Catalog of Bulge+disk Decompositions and Updated Photometry for 1.12 Million Galaxies in the Sloan Digital Sky Survey. Astrophys. J. Suppl. Ser. 2011, 196, 11. [Google Scholar] [CrossRef]
  23. Cutler, S.E.; Whitaker, K.E.; Mowla, L.A.; Brammer, G.B.; van der Wel, A.; Marchesini, D.; van Dokkum, P.G.; Momcheva, I.G.; Song, M.; Akhshik, M.; et al. Diagnosing DASH: A catalogue of structural properties for the COSMOS-DASH survey. Astrophys. J. 2022, 925, 34. [Google Scholar] [CrossRef]
  24. Vika, M.; Bamford, S.P.; Häußler, B.; Rojas, A.L. MegaMorph multi-wavelength measurement of galaxy structure: Physically meaningful bulge-disc decomposition of galaxies near and far. Mon. Not. R. Astron. Soc. 2014, 444, 3603–3621. [Google Scholar] [CrossRef]
  25. Chugunov, I.V.; Marchuk, A.A.; Mosenkov, A.V.; Savchenko, S.S.; Shishkina, E.V.; Chazov, M.I.; Nazarova, A.E.; Skryabina, M.N.; Smirnova, P.I.; Smirnov, A.A. Galaxies decomposition with spiral arms-I: 29 galaxies from S4G. Mon. Not. R. Astron. Soc. 2024, 527, 9605. [Google Scholar] [CrossRef]
  26. Marchuk, A.A.; Chugunov, I.V.; Gontcharov, G.A.; Mosenkov, A.V.; Il’in, V.B.; Savchenko, S.S.; Smirnov, A.A.; Poliakov, D.M.; Seguine, J.; Chazov, M.I. Galaxies decomposition with spiral arms-II. A multiwavelength case study of M51. Mon. Not. R. Astron. Soc. 2024, 528, 1276–1295. [Google Scholar] [CrossRef]
  27. Abraham, R.G.; Bergh, S.; Glazebrook, K.; Ellis, R.S.; Santiago, B.X.; Surma, P.; Griffiths, R.E. The Morphologies of Distant Galaxies. II. Classifications from the Hubble Space Telescope Medium Deep Survey. Astrophys. J. Suppl. Ser. 1996, 107, 1. [Google Scholar] [CrossRef]
  28. Abraham, R.G.; Valdes, F.; Yee, H.K.C.; van den Bergh, S. The Morphologies of Distant Galaxies. I. an Automated Classification System. Astrophys. J. 1994, 432, 75. [Google Scholar] [CrossRef]
  29. Conselice, C.J.; Bershady, M.A.; Dickinson, M.; Papovich, C. A Direct Measurement of Major Galaxy Mergers at z ≤ 3. Astron. J. 2003, 126, 1183. [Google Scholar] [CrossRef]
  30. Conselice, C.J.; Bershady, M.A.; Jangren, A. The asymmetry of galaxies: Physical morphology for nearby and high-redshift galaxies. Astrophys. J. 2000, 529, 886–910. [Google Scholar] [CrossRef]
  31. Huertas-Company, M.; Rouan, D.; Tasca, L.; Soucail, G.; Le Fèvre, O. A robust morphological classification of high-redshift galaxies using support vector machines on seeing-limited images. I. Method description. Astron. Astrophys. 2008, 478, 971–980. [Google Scholar] [CrossRef]
  32. Mukundan, K.; Nair, P.; Bailin, J.; Li, W. Automating galaxy morphology classification using k-nearest neighbours and non-parametric statistics. Mon. Not. R. Astron. Soc. 2024, 533, 292–312. [Google Scholar] [CrossRef]
  33. Nersesian, A.; Zibetti, S.; D’eUgenio, F.; Baes, M. Non-parametric galaxy morphology from stellar and nebular emission with the CALIFA sample. Astron. Astrophys. 2023, 673, A63. [Google Scholar] [CrossRef]
  34. Abraham, R.G.; van den Bergh, S.; Nair, P. A new approach to galaxy morphology. I. Analysis of the Sloan Digital Sky Survey early data release. Astrophys. J. 2003, 588, 218. [Google Scholar] [CrossRef]
  35. Lotz, J.M.; Primack, J.; Madau, P. A New Nonparametric Approach to Galaxy Morphological Classification. Astron. J. 2004, 128, 163–182. [Google Scholar] [CrossRef]
  36. Bershady, M.A.; Jangren, A.; Conselice, C.J. Structural and photometric classification of galaxies. I. Calibration based on a nearby galaxy sample. Astron. J. 2000, 119, 2645. [Google Scholar]
  37. Pović, M.; Márquez, I.; Masegosa, J.; Perea, J.; Olmo, A.; Simpson, C.; Aguerri, J.A.L.; Ascaso, B.; Jiménez-Teja, Y.; López-Sanjuan, C.; et al. The impact from survey depth and resolution on the morphological classification of galaxies. Mon. Not. R. Astron. Soc. 2015, 453, 1644–1668. [Google Scholar] [CrossRef]
  38. Getachew-Woreta, T.; Pović, M.; Masegosa, J.; Perea, J.; Beyoro-Amado, Z.; Márquez, I. Effect of AGN on the morphological properties of their host galaxies in the local Universe. Mon. Not. R. Astron. Soc. 2022, 514, 607. [Google Scholar] [CrossRef]
  39. Pintos-Castro, I.; Pović, M.; Sanchez-Portal, M.I.; Cepa, J.; Altieri, B.; Bongiovanni, Á.; Duc, P.A.; Ederoclite, A.; Oteo, I.; García, A.M.P.; et al. Multi-wavelength landscape of the young galaxy cluster RXJ 1257.2+4738 at z = 0.866. II. Morphological properties. Astron. Astrophys. 2016, 529, A108. [Google Scholar] [CrossRef]
  40. Pović, M.; Sánchez-Portal, M.; Pérez García, A.M.; Bongiovanni, A.; Cepa, J.; Huertas-Company, M.; Lara-López, M.A.; Lorenzo, M.F.; Ederoclite, A.; Alfaro, E.; et al. AGN-host galaxy connection: Morphology and colours of X-ray selected AGN at z ≤ 2. Astron. Astrophys. 2012, 541, A118. [Google Scholar] [CrossRef]
  41. Çakir, U.; Buck, T. MEGS: Morphological Evaluation of Galactic Structure-Principal component analysis as a galaxy morphology model. Astron. Astrophys. 2024, 691, 320. [Google Scholar] [CrossRef]
  42. Cavanagh, M.K.; Bekki, K.; Groves, B.A. Morphological classification of galaxies with deep learning: Comparing 3-way and 4-way CNNs. Mon. Not. R. Astron. Soc. 2021, 506, 659–676. [Google Scholar] [CrossRef]
  43. Cheng, X.-P.; An, T.; Frey, S.; Hong, X.Y.; He, X.; Kellermann, K.I.; Lister, M.L.; Lao, B.Q.; Li, X.F.; Mohan, P.; et al. Compact Bright Radio-loud AGNs. III. A Large VLBA Survey at 43 GHz. Astrophys. J. Suppl. Ser. 2020, 247, 57. [Google Scholar] [CrossRef]
  44. de Diego, J.A.; Nadolny, J.; Bongiovanni, Á.; Cepa, J.; Pović, M.; García, A.M.P.; Torres, C.P.P.; Lara-López, M.A.; Cerviño, M.; Martínez, R.P.; et al. Galaxy classification: Deep learning on the OTELO and COSMOS databases. Astron. Astrophys. 2020, 638, 134. [Google Scholar] [CrossRef]
  45. de Diego, J.A.; Nadolny, J.; Bongiovanni, Á.; Cepa, J.; Lara-López, M.A.; Gallego, J.; Cerviño, M.; Sánchez-Portal, M.; González-Serrano, J.I.; Alfaro, E.J.; et al. Nonsequential neural network for simultaneous, consistent classification, and photometric redshifts of OTELO galaxies. Astron. Astrophys. 2021, 655A, 56. [Google Scholar] [CrossRef]
  46. Domínguez Sánchez, H.; Margalef, B.; Bernardi, M.; Huertas-Company, M. SDSS-IV DR17: Final release of MaNGA PyMorph photometric and deep-learning morphological catalogues. Mon. Not. R. Astron. Soc. 2022, 509, 4024–4036. [Google Scholar] [CrossRef]
  47. Martin, G.; Kaviraj, S.; Hocking, A.; Read, S.C.; Geach, J.E. Galaxy morphological classification in deep-wide surveys via unsupervised machine learning. Mon. Not. R. Astron. Soc. 2020, 491, 1408–1426. [Google Scholar] [CrossRef]
  48. Sazonov, S.; Gilfanov, M.; Medvedev, P.; Yao, Y.; Khorunzhev, G.; Semena, A.; Sunyaev, R.; Burenin, R.; Lyapin, A.; Meshcheryakov, A.; et al. First tidal disruption events discovered by SRG/eROSITA: X-ray/optical properties and X-ray luminosity function at z < 0.6. Astron. Astrophys. 2021, 649, 1. [Google Scholar]
  49. Urrutia-Viscarra, F.; Méndez-Abreu, J.; de Souza, R.S.; Smith, A.B.; Johnson, C.D.; Lee, E.F.; Martínez-González, P.; Chen, H.-L.; O’Connell, R.W.; Thompson, K.L.; et al. The Impact of AGN Feedback on Galaxy Formation: A Multi-Wavelength Study. Astrophys. J. 2023, 935, 125–145. [Google Scholar]
  50. Vavilova, I.B.; Dobrycheva, D.V.; Vasylenko, M.Y.; Elyiv, A.A.; Melnyk, O.V.; Khramtsov, V. Machine learning technique for morphological classification of galaxies from the SDSS. I. Photometry-based approach. Astron. Astrophys. 2021, 648, A122. [Google Scholar] [CrossRef]
  51. Dubois, Y.; Peirani, S.; Pichon, C.; Devriendt, J.; Gavazzi, R.; Welker, C.; Volonteri, M. HORIZON-AGN simulation: Morphological diversity of galaxies promoted by AGN feedback. Mon. Not. R. Astron. Soc. 2016, 463, 3948–3964. [Google Scholar] [CrossRef]
  52. Kauffmann, G.; Heckman, T.M.; Tremonti, C.; Brinchmann, J.; Charlot, S.; White, S.D.M.; Ridgway, S.E.; Brinkmann, J.; Fukugita, M.; Hall, P.B.; et al. The host galaxies of active galactic nuclei. Mon. Not. R. Astron. Soc. 2003, 346, 1055–1077. [Google Scholar] [CrossRef]
  53. Pierce, C.M.; Lotz, J.M.; Primack, J.R.; Rosario, D.J.V.; Griffith, R.L.; Conselice, C.J.; Faber, S.M.; Koo, D.C.; Coil, A.L.; Salim, S.; et al. The effects of an active galactic nucleus on host galaxy colour and morphology measurements. Mon. Not. R. Astron. Soc. 2010, 405, 718–734. [Google Scholar] [CrossRef]
  54. Pierce, C.M.; Lotz, J.M.; Laird, E.S.; Lin, L.; Nandra, K.; Primack, J.R.; Faber, S.M.; Barmby, P.; Park, S.Q.; Willner, S.P.; et al. AEGIS: Host Galaxy Morphologies of X-Ray-selected and Infrared-selected Active Galactic Nuclei at 0.2 ≤z < 1.2. Astrophys. J. 2007, 660, L19–L22. [Google Scholar]
  55. Choi, Y.; Woo, J.; Park, C. Environmental Dependence of Active Galactic Nucleus Activity. I. The Effects of Host Galaxy. Astrophys. J. 2009, 699, 1679–1689. [Google Scholar] [CrossRef]
  56. Hickox, R.C.; Jones, C.; Forman, W.R.; Murray, S.S.; Kochanek, C.S.; Eisenstein, D.; Jannuzi, B.T.; Dey, A.; Brown, M.J.I.; Stern, D.; et al. Host Galaxies, Clustering, Eddington Ratios, and Evolution of Radio, X-Ray, and Infrared-Selected AGNs. Astrophys. J. 2009, 696, 891–919. [Google Scholar] [CrossRef]
  57. Cardamone, C.N.; Urry, C.M.; Schawinski, K.; Treister, E.; Brammer, G.; Gawiser, E. Dust-corrected colors reveal bimodality in the host-galaxy colors of active galactic nuclei at z ∼ 1. Astrophys. J. 2010, 721, L38–L42. [Google Scholar] [CrossRef]
  58. Trump, J.R.; Sun, M.; Zeimann, G.R.; Luck, C.; Bridge, J.S.; Grier, C.J.; Hagen, A.; Juneau, S.; Montero-Dorta, A.; Rosario, D.J.; et al. The biases of optical line-ratio selection for active galactic nuclei and the intrinsic relationship between black hole accretion and galaxy star formation. Astrophys. J. 2015, 811, 26. [Google Scholar] [CrossRef]
  59. Scoville, N. Merging Galaxies in COSMOS and Galaxy Evolution. Astron. Astrophys. 2010, 215, 33802. [Google Scholar]
  60. Parekh, V.; Heyden, K.v.; Ferrari, C.; Angus, G.; Holwerda, B. Morphology parameters: Substructure identification in X-ray galaxy clusters. Astron. Astrophys. 2015, 575, A127. [Google Scholar] [CrossRef]
  61. Baldwin, J.A.; Phillips, M.M.; Terlevich, R. Classification parameters for the emission-line spectra of extragalactic objects. Publ. Astron. Soc. Pac. 1981, 93, 5. [Google Scholar] [CrossRef]
  62. Mosleh, M.; Williams, R.J.; Franx, M. On The Robustness of z = 0-1 Galaxy Size Measurements Through Model and Non-Parametric Fits. Astrophys. J. 2013, 777, 117. [Google Scholar] [CrossRef]
  63. Scoville, N.; Aussel, H.; Brusa, M.; Capak, P.; Carollo, C.M.; Elvis, M.; Giavalisco, M.; Guzzo, L.; Hasinger, G.; Impey, C.; et al. The cosmic evolution survey (COSMOS): Overview. Astrophys. J. Suppl. Ser. 2007, 172, 1–8. [Google Scholar] [CrossRef]
  64. Koekemoer, A.M.; Aussel, H.; Calzetti, D.; Capak, P.; Giavalisco, M.; Kneib, J.; Leauthaud, A.; Le Fevre, O.; McCracken, H.J.; Massey, R.; et al. The COSMOS Survey: Hubble Space Telescope Advanced Camera for Surveys Observations and Data Processing. Astrophys. J. Suppl. Ser. 2007, 172, 196–202. [Google Scholar] [CrossRef]
  65. Leauthaud, A.; Massey, R.; Kneib, J.P.; Rhodes, J.; Johnston, D.E.; Capak, P.; Heymans, C.; Ellis, R.S.; Koekemoer, A.M.; Le Fevre, O.; et al. Weak gravitational lensing with COSMOS: Galaxy selection and shape measurements. Astrophys. J. Suppl. Ser. 2007, 172, 219–238. [Google Scholar] [CrossRef]
  66. Ilbert, O.; Capak, P.; Salvato, M.; Aussel, H.; McCracken, H.J.; Sanders, D.B.; Scoville, N.; Kartaltepe, J.; Arnouts, S.; Floc’h, E.L.; et al. Cosmos Photometric Redshifts with 30-Bands for 2-deg 2. Astrophys. J. 2009, 690, 1236. [Google Scholar] [CrossRef]
  67. Chang, C.C.; Lin, C.J. LIBSVM: A library for support vector machines. ACM Trans. Intell. Syst. Technol. (TIST) 2011, 2, 27. [Google Scholar] [CrossRef]
  68. Bertin, E.; Arnouts, S. SExtractor: Software for source extraction. Astron. Astrophys. Suppl. Ser. 1996, 117, 393. [Google Scholar] [CrossRef]
  69. Moffat, A.F.J. A Theoretical Investigation of Focal Stellar Images in the Photographic Emulsion and Application to Photographic Photometry. Astron. Astrophys. 1969, 3, 455. [Google Scholar]
  70. Mountrichas, G.; Ruiz, A.; Georgantopoulos, I.; Pouliasis, E.; Akylas, A.; Drigga, E. AGN populations in the local Universe: Their alignment with the main sequence, stellar population characteristics, accretion efficiency, and the impact of AGN feedback. Astron. Astrophys. 2024, 688, A79. [Google Scholar] [CrossRef]
  71. Durodola, E.; Pacucci, F.; Hickox, R.C. Exploring the AGN Fraction of a Sample of JWST’s Little Red Dots at 5 < z < 8: Overmassive Black Holes Are Strongly Favored. Astrophys. J. 2025, 985, 2. [Google Scholar]
  72. Sazonova, E.; Morgan, C.; Balogh, M.; Alatalo, K.; Benavides, J.A.; Bluck, A.; Brough, S.; Busa, I.; Demarco, R.; Donevski, D.; et al. RMS asymmetry: A robust metric of galaxy shapes in images with varied depth and resolution. Open J. Astrophys. 2024, 7, 77. [Google Scholar] [CrossRef]
  73. Zhao, Y.; Li, Y.A.; Shangguan, J.; Zhuang, M.-Y.; Ho, L.C. The Relation between Morphological Asymmetry and Nuclear Activity in Low-redshift Galaxies. Astrophys. J. 2022, 925, 70. [Google Scholar] [CrossRef]
  74. Tarsitano, F.; Hartley, W.G.; Amara, A.; Bluck, A.; Bruderer, C.; Carollo, M.; Conselice, C.; Melchior, P.; Moraes, B.; Refregier, A.; et al. A catalogue of structural and morphological measurements for DES Y1. Mon. Not. R. Astron. Soc. 2018, 481, 2018–2040. [Google Scholar] [CrossRef]
  75. Lisker, T. Is the Gini Coefficient a Stable Measure of Galaxy Structure? Astrophys. J. Suppl. Ser. 2008, 179, 319–325. [Google Scholar] [CrossRef]
  76. Lotz, J.M.; Jonsson, P.; Cox, T.J.; Primack, J.R. Galaxy merger morphologies and time-scales from simulations of equal-mass gas-rich disc mergers. Mon. Not. R. Astron. Soc. 2008, 391, 1137–1162. [Google Scholar] [CrossRef]
  77. Florian, M.K.; Gladders, M.D.; Li, N.; Sharon, K. The Gini Coefficient as a Tool for Image Family Identification in Strong Lensing Systems with Multiple Images. Astrophys. J. 2016, 816, L23. [Google Scholar] [CrossRef]
  78. Zamojski, M.A.; Schiminovich, D.; Rich, R.M.; Mobasher, B.; Koekemoer, A.M.; Capak, P.; Taniguchi, Y.; Sasaki, S.S.; McCracken, H.J.; Mellier, Y.; et al. Deep GALEX Imaging of the COSMOS HST Field: A First Look at the Morphology of z≤0.7 Star-forming Galaxies. Astrophys. J. Suppl. Ser. 2007, 172, 468. [Google Scholar] [CrossRef]
  79. Aguilar-Argüello, G.; Fuentes-Pineda, G.; Hernńdez-Toledo, H.M.; Martínez-Vázquez, L.A.; Vázquez-Mata, J.A.; Brough, S.; Demarco, R.; Ghosh, A.; Jiménez-Teja, Y.; Martin, G.; et al. Morphological classification of galaxies through structural and star formation parameters using machine learning. Mon. Not. R. Astron. Soc. 2025, 537, 876. [Google Scholar] [CrossRef]
  80. Hung, C.-L.; Sanders, D.B.; Casey, C.M.; Koss, M.; Larson, K.L.; Lee, N.; Li, Y.; Lockhart, K.; Shih, H.-Y.; Barnes, J.E.; et al. A Comparison of the Morphological Properties between Local andz ∼1 Infrared Luminous Galaxies: Are Local and High-z (U)LIRGs Different? Astrophys. J. 2014, 791, 63. [Google Scholar] [CrossRef]
  81. Yao, Y.; Song, J.; Kong, X.; Fang, G.; Zhang, H.X.; Chen, X. Evolution of Nonparametric Morphology of Galaxies in the JWST CEERS Field at z≃ 0.8–3.0. Astrophys. J. 2023, 954, 113. [Google Scholar] [CrossRef]
  82. Zaazou, Y.; Bihlo, A.; Tricco, T.S. Mapping galaxy images across ultraviolet, visible and infrared bands using generative deep learning. arXiv 2025, arXiv:2501.15149. [Google Scholar] [CrossRef]
  83. Xu, X.; Peletier, R.F.; Awad, P.; Raj, M.A.; Smith, R. Asymmetry at low surface brightnesses as an indicator of environmental processes in the Fornax cluster. Astron. Astrophys. 2025, 695, 219. [Google Scholar] [CrossRef]
  84. Himoto, K.G.; Kajisawa, M. Central concentration of asymmetric features in post-starburst galaxies at z 0.8. Mon. Not. R. Astron. Soc. 2023, 519, 4110–4127. [Google Scholar] [CrossRef]
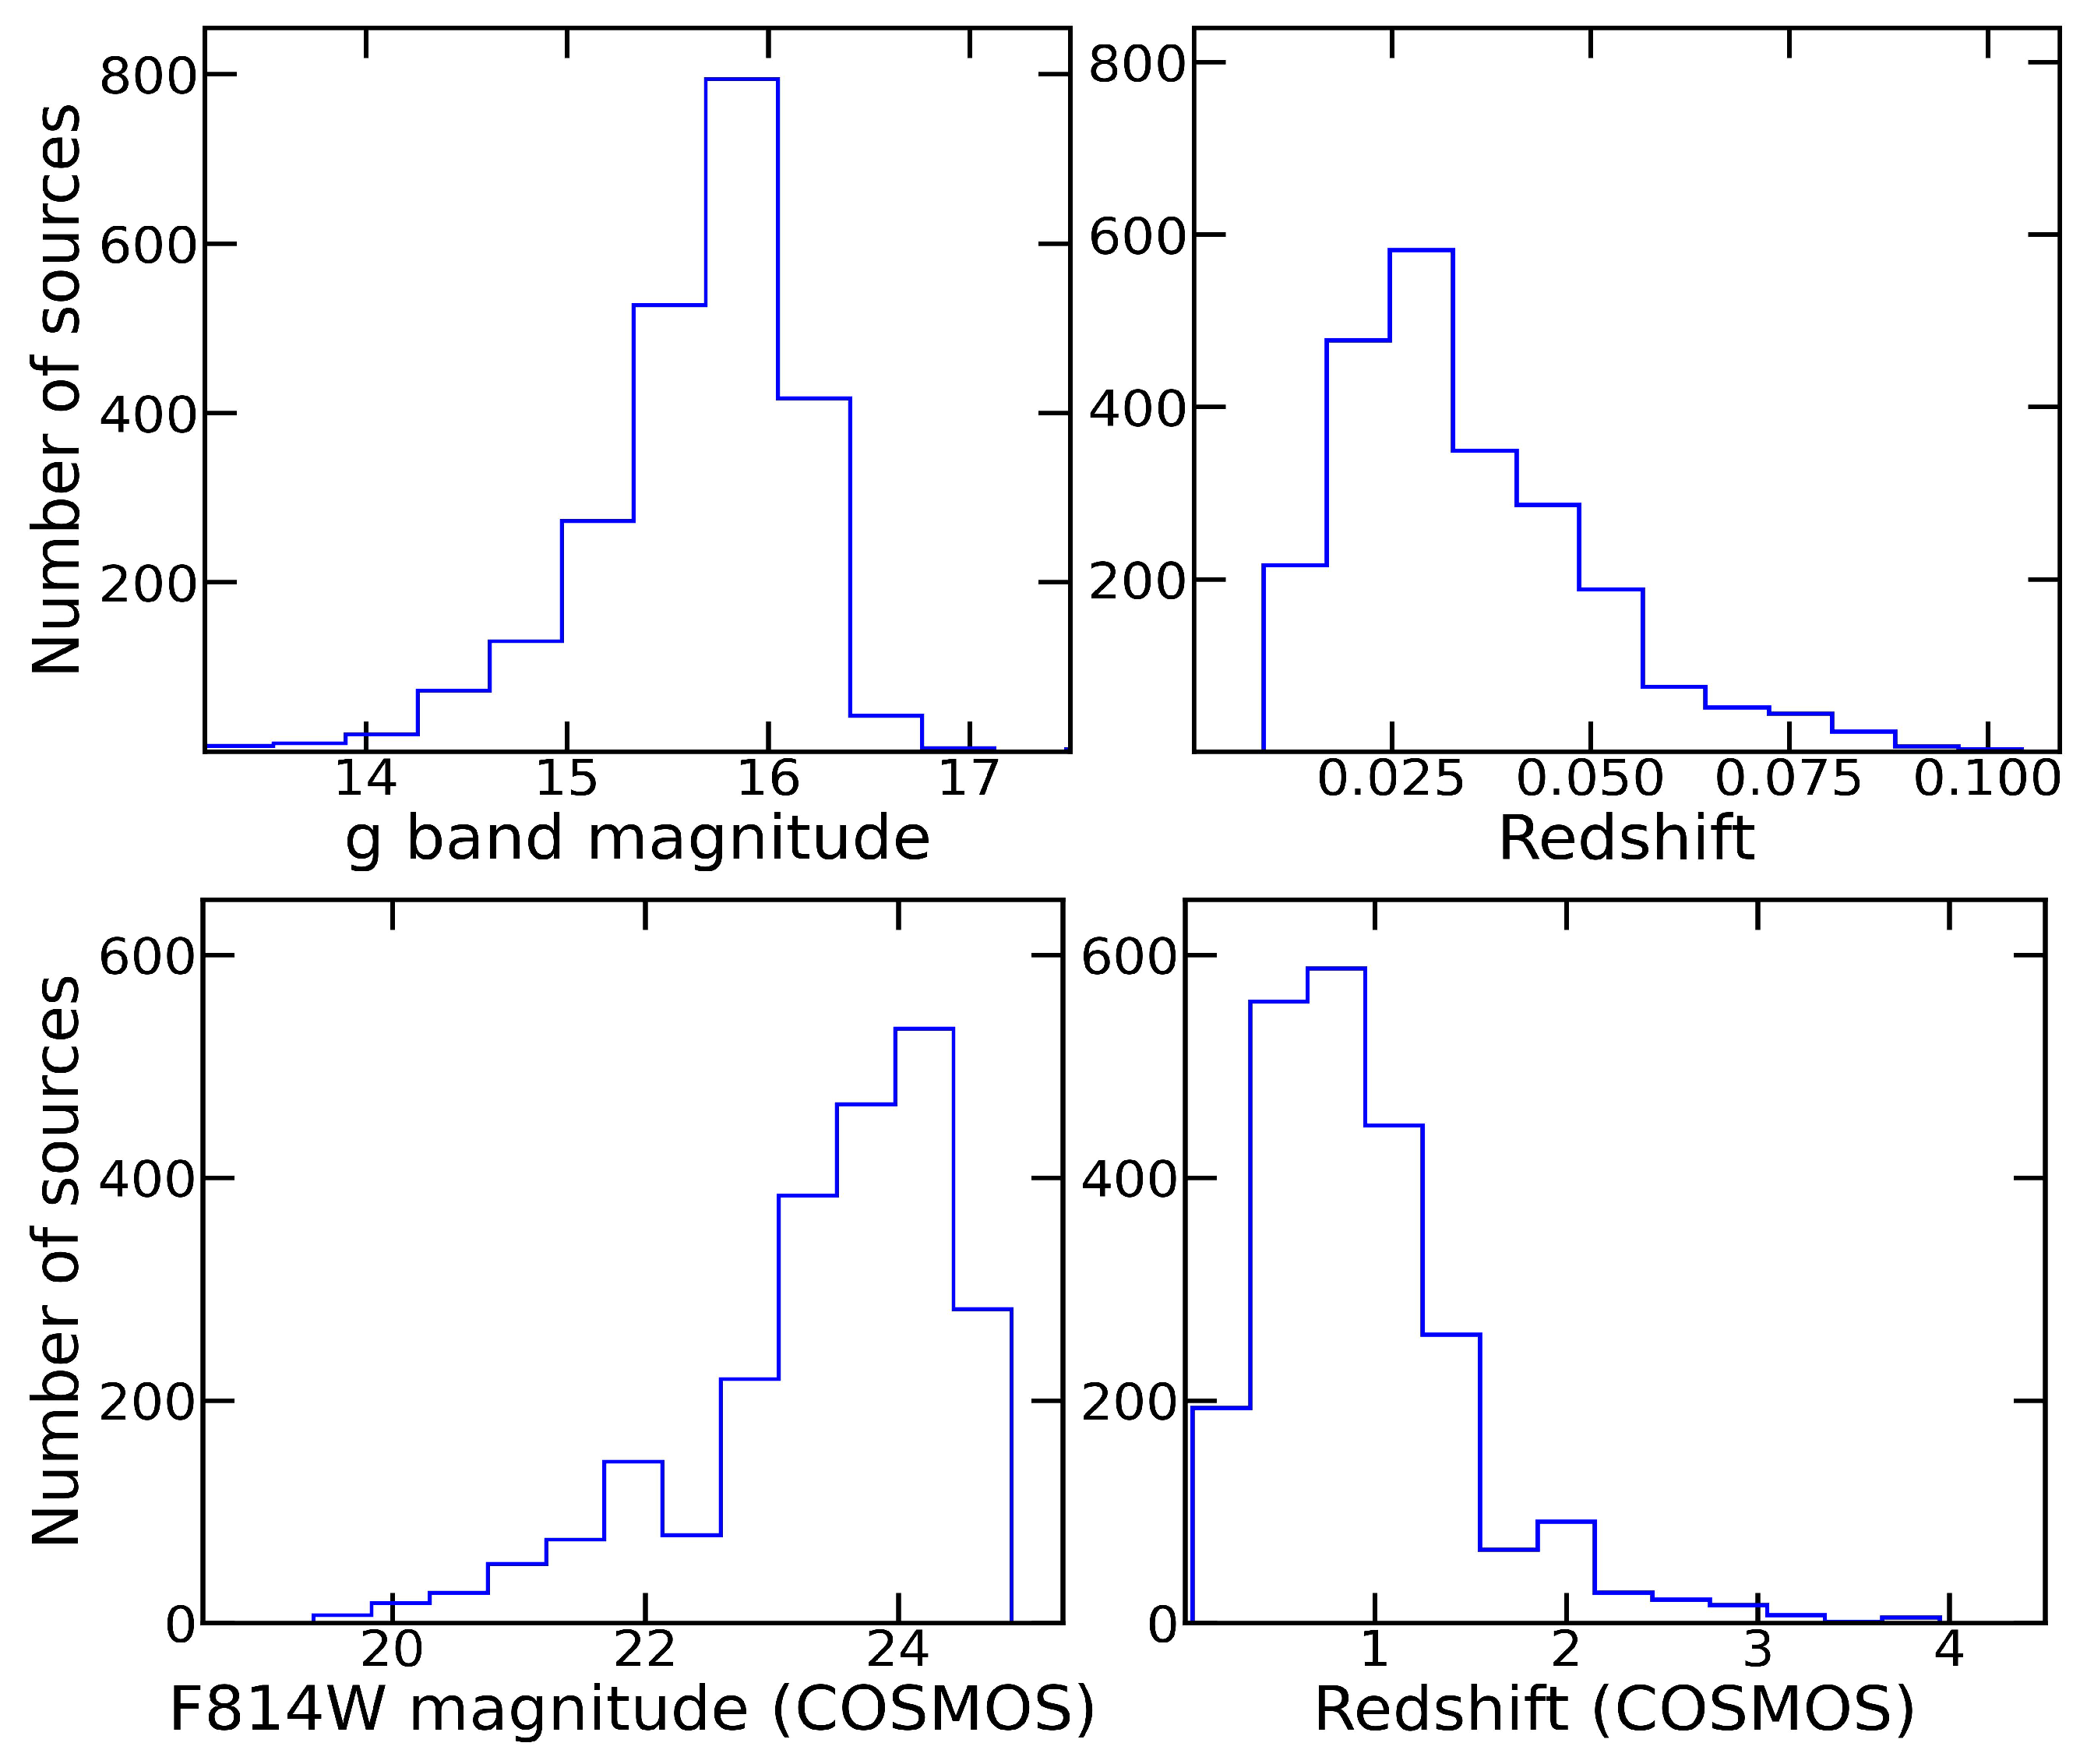
Figure 1. Top: The g-band magnitude (left) and redshift (right) distributions for the selected sample of non-active local galaxies. Bottom: The F814W magnitude (left) and redshift (right) of the used COSMOS sample.
Galaxies 13 00084 g001
Figure 2. The simulated magnitude (left plot per magnitude limit) and redshift (right plot per magnitude limit) distributions of the non-AGN local galaxies after moving them to higher redshift to represent the distribution of galaxies in the COSMOS field at F814W ≤ 21 (top left plots), F814W ≤ 22 (top right plots), F814W ≤ 23 (middle left plots), F814W ≤ 24 (middle right plots), and F814W ≤ 25 (bottom plots).
Galaxies 13 00084 g002
Figure 3. Summary of analysis and comparisons carried out in Section 4.1, Section 4.2 and Section 4.3.
Galaxies 13 00084 g003
Figure 5. Same as in Figure 4, but with the variance measured when comparing samples at z ∼ 0 and under COSMOS-like conditions with AGN added in both cases.
Galaxies 13 00084 g005
Figure 7. Relation between CABR and CCON morphological parameters for a simulated sample moved to fainter magnitudes of mag_hz < 21 (a), mag_hz < 22 (b), mag_hz < 23 (c), mag_hz < 24 (d), and mag_hz < 25 (e). For each panel (ae), we present the distribution of early-type (red contours), early-spiral (blue contours), and late-spiral (green contours) galaxies, with parameters measured after adding AGN contribution of 5% (top, left), 10% (top, middle), 25% (top, right), 50% (bottom, left), 75% (bottom, middle), and without AGN added (bottom, right).
Galaxies 13 00084 g007aGalaxies 13 00084 g007b
Figure 8. Same as Figure 7, but showing the relation between CABR and GINI morphological parameters for a simulated sample moved to fainter magnitudes of mag_hz < 21 (a), mag_hz < 22 (b), mag_hz < 23 (c), mag_hz < 24 (d), and mag_hz < 25 (e). For each panel (ae), colours for morphological type are the same that in Figure 7.
Galaxies 13 00084 g008aGalaxies 13 00084 g008b
Figure 9. Same as Figure 7, but showing the relation between GINI and M20 morphological parameters for a simulated sample moved to fainter magnitudes of mag_hz < 21 (a), mag_hz < 22 (b), mag_hz < 23 (c), mag_hz < 24 (d), and mag_hz < 25 (e). For each panel (ae), colours for morphological type are the same that in Figure 7.
Galaxies 13 00084 g009aGalaxies 13 00084 g009b
Figure 10. Same as Figure 7, but showing the relation between logASYM and logCABR. morphological parameters for a simulated sample moved to fainter magnitudes of mag_hz < 21 (a), mag_hz < 22 (b), mag_hz < 23 (c), mag_hz < 24 (d), and mag_hz < 25 (e). For each panel (ae), colors for morphological type are the same that in Figure 7.
Galaxies 13 00084 g010aGalaxies 13 00084 g010b
Disclaimer/Publisher’s Note: The statements, opinions and data contained in all publications are solely those of the individual author(s) and contributor(s) and not of MDPI and/or the editor(s). MDPI and/or the editor(s) disclaim responsibility for any injury to people or property resulting from any ideas, methods, instructions or products referred to in the content.