Abstract
This paper presents the results of the photometric and spectral monitoring of the galaxy NGC 3516, which is an active galactic nucleus (AGN) of type Sy with a changing look. Observations were carried out at the Fesenkov Astrophysical Institute (FAI, Almaty, Kazakhstan) and the Shamakhy Astrophysical Observatory (ShAO, Shamakhy, Azerbaijan). Spectral monitoring of this galaxy in the wavelength range 4000–7000 Å began in 2020, while photometric observations have been conducted since 2014. During the observation period, estimates of the galaxy’s brightness in the B, V and filters were obtained, as well as measurements of the emission line and continuum fluxes. The light curve shows increased brightness of NGC 3516 in 2016 and 2019. The increase of emission line fluxes of H and H and continuum began in 2019 and continued until spring 2020, when these characteristics reached their maximal values. A powerful X-ray flare took place on 1 April 2020. A new phase of brightening began in 2021 and has continued until 2025. After reaching their maxima in 2020, the emission fluxes of H and H decreased by a factor of 1.5–2 and remained at a low level until 2022–2023, when they began to increase again. Medium-resolution spectra obtained on 20 April 2020, with the 1-meter “West” telescope (TSHAO) were used to study the broad components of the H and H emission line profiles. Model calculations showed that the broad profile of the H line consists of a central unshifted component and two (blue and red) components shifted symmetrically relative to the central component by a velocity of km . The H emission line was relatively weak, so the radial velocity of its components was determined with a large uncertainty: km .
1. Introduction
NGC 3516 is a Seyfert galaxy of spectral type Sy , with spectral variability first detected in 1968 [1,2]. The variability in the H line and the first measurement of the time delay of line variations relative to the continuum were first reported in 1973 [3]. NGC 3516 has permitted FeII lines and forbidden [OIII] lines, but they are much narrower compared to those in spectra of typical Sy galaxies. In the work by De Rosa et al. (2018) [4], the black hole masses were determined using continuum-H reverberation mapping. In particular, measurements were obtained for the galaxy NGC 3516, based on observations conducted in January–February 2012 with a cadence of 1 day. The analysis used the fluxes of the broad H emission line and the continuum at = 5100 Å. Spectral calibration was performed using the [OIII] emission line. The time lag values measured in 2012 were found to be twice as short, and the continuum luminosity was four times lower compared to the results from 2007 [5]. Spectral features of galaxy NGC 3516 are variable and an increase of coronal lines [6] as well as a strong asymmetry in the profiles of broad lines are observed [7].
NGC 3516 from 1996 to 2018 exhibited clear variability in both the continuum and the broad emission lines [2]. A minimum of activity was recorded in 2014, when the broad lines almost disappeared. This possibly indicates the presence of an obscuring region in NGC 3516 and is supported by absorption in the ultraviolet and X-ray [8,9,10]. The profiles of the broad H and H lines in NGC 3516 show a complex structure with features in the wings of the line profiles and an enhanced peak, indicating the complexity of the Broad Line Region (BLR). The time delays between changes in the continuum and the broad emission lines allowed the estimation of the central black hole mass, , which is consistent with previous calculations [4,11].
Popovic et al. (2023) [7] discovered a very complex structure of the BLR during the active phase of NGC 3516 by looking at broad and strong emission lines. There is a distinct disk-like BLR that contributes to the enhancement of the flux in the wings of the broad lines, as well as an additional Intermediate Line Region (ILR) that enhances the intensity in the core of the line. During the high-activity phase, the ILR emission is located near the center of the line, although in some cases, it is slightly red-shifted. In the low-activity phase (i.e., type 2 phase), the ILR component is significantly blue-shifted, indicating gas outflow.
To analyze the variability of the broad emission line components as manifestations of dynamic processes in the inner regions of NGC 3516, we relied on previous studies by various researchers in this field. For the first time, the mass of the massive central body of the galaxy was estimated using echo mapping based on the measurement of the BLR size [12]. Urry and Padovani (1995) [13] used continuous temporal photometric data and spectral observations to determine the parameters of the BLR.
Despite numerous studies, the nature of the variability of NGC 3516 remains not fully understood. The main proposed scenarios include obscuration by dust along the line of sight [14] and intrinsic changes in the accretion disk. The present work provides new observational data that may be useful for further analysis.
2. Observatories, Telescopes and Equipment
The presented study used observational data obtained at Fesenkov Astrophysical Institute (Kazakhstan) and Nasreddin Tusi Shamakhy Astrophysical Observatory (Azerbaijan). Several instruments were employed for conducting photometric and spectral observations. The description and characteristics of the instruments used are presented in Table 1.

Table 1.
Characteristics of observational instruments.
2.1. Methodology of Photometric Analysis
During the photometric observations, images of the object were obtained sequentially in the B, V and filters with a time interval of approximately 10 s. Then, a new B, V, image series started again. The time interval between the start of the 1st, 2nd and subsequent series was about 1–2 min, depending on the exposure duration. The acquired frames were then corrected using calibration files: dark and flat. Standard stars with known B, V and magnitudes were selected within the frame near the object. Therefore, atmospheric extinction does not affect the results. Brightness measurements were performed using the MaximDL Pro V6 [15] software suite. For a measure of images of galaxy NGC 3516, an aperture of was used. The star GSC 04391 with coordinates RA: ::, Dec: :: and known brightness values , , [16] was chosen as the photometric standard. To convert instrumental magnitudes to the standard B, V and system, the corresponding systems of equations were applied [17]. Uncertainties of the photometric values depend on the signal-to-noise ratio, calibration accuracy and atmospheric conditions and do not exceed mag.
2.2. Methodology of Spectral Analysis
The data obtained from SHAO and FAI from 2020 to 2023 were used for the spectral analysis. The spectral data were fully reduced using the IRAF version 2.16 [18] software package. The reduction process included dark frame subtraction, wavelength calibration using a He–Ne–Ar lamp and one-dimensional spectrum extraction from the two-dimensional spectral images. An aperture extraction window ranging from 5 to 13 pixels was applied, depending on seeing conditions and signal-to-noise ratio. Flux calibration was performed using standard spectrophotometric stars [19], and atmospheric absorption was taken into account. To correct for absorption within our galaxy, the value of was taken from the NASA/IPAC Extragalactic Database (NED),1 based on the dust extinction maps by Schlafly and Finkbeiner [20]. Due to the low redshift of the object (), no additional correction for intergalactic absorption was applied. The final data also underwent absolute flux calibration and redshift correction, allowing for accurate measurement of emission line fluxes. In our work, we used the approximation of the broad components of H and H with the composite models, applying Gaussian and Voigt functions to describe the line profile shapes. Bayesian analysis and the Bayesian factor (see Appendix A) were utilized for selecting the most likely model. The nested sampling method was used to reach the models’ reliability and posterior distributions of the parameters, implemented in the DYNESTY package [21,22]. Non-informative uniform distributions were chosen as prior information for the parameters.
3. Results
3.1. Results of Photometric and Spectral Studies of the Galaxy NGC 3516
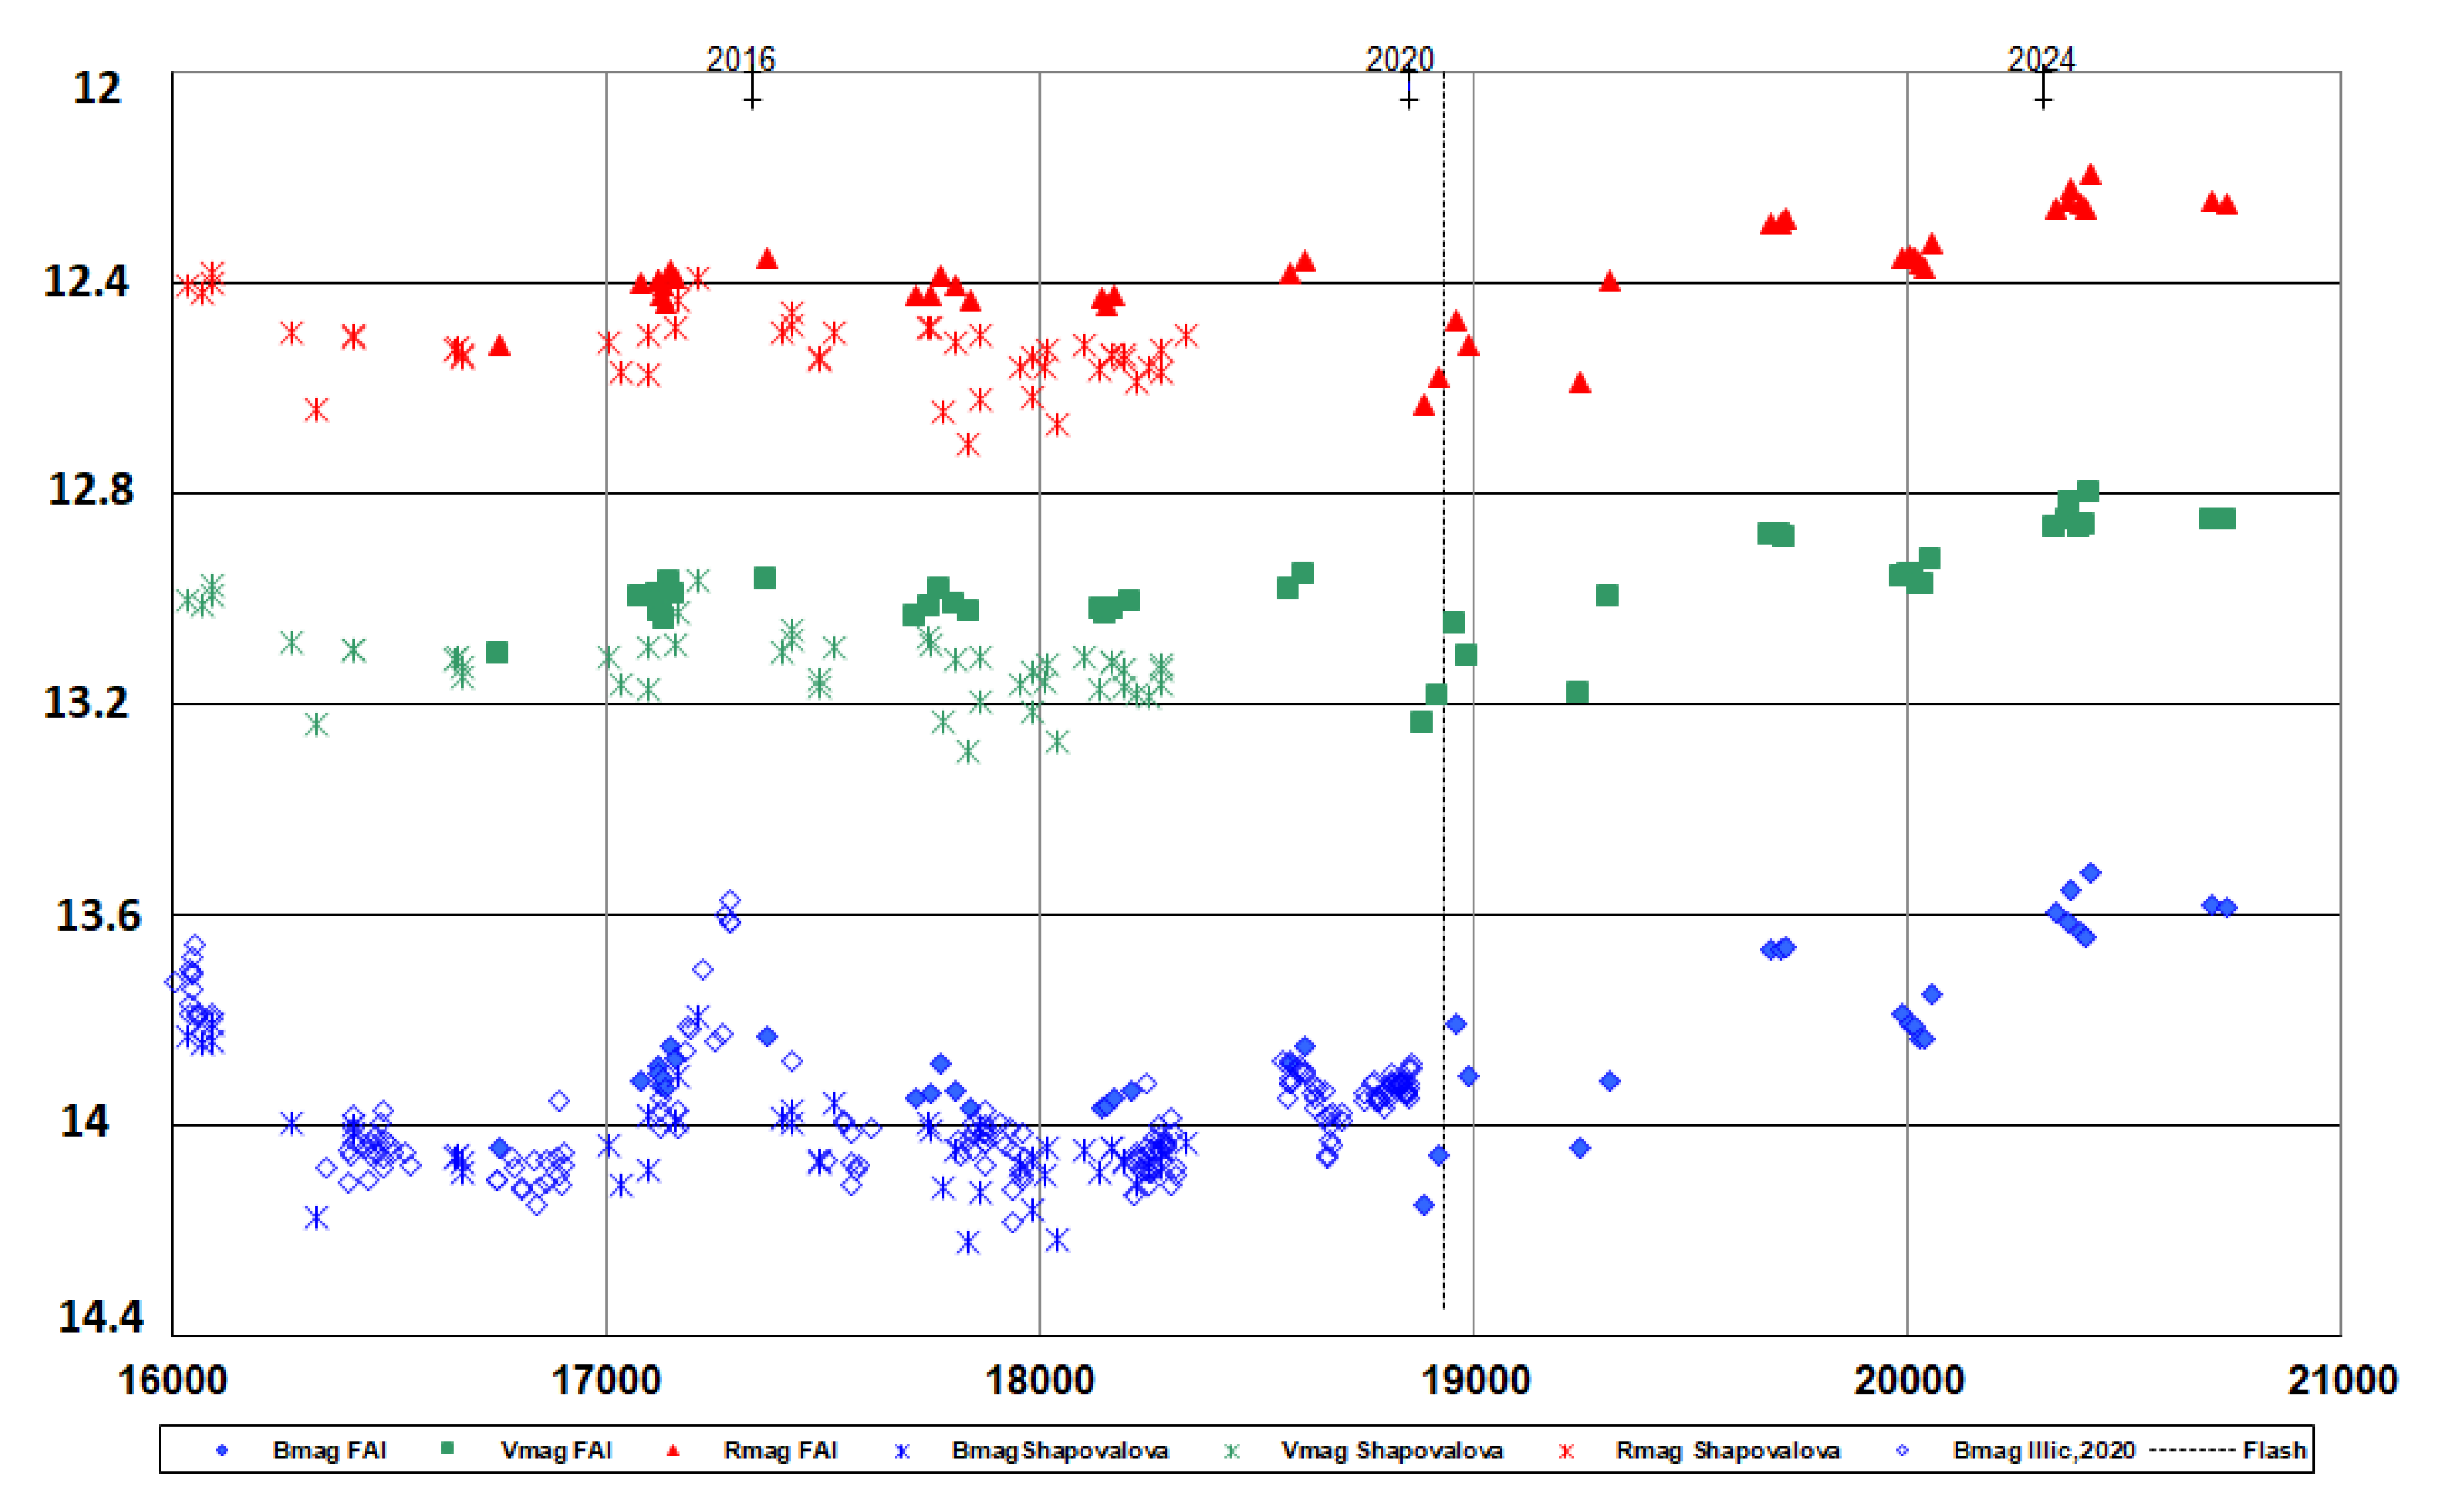
The light curve in Figure 1 presents the results of the measurements obtained between 2014 and 2025 and supplemented by the results from [2,6]. The errors of B, V, and magnitudes do not exceed mag.
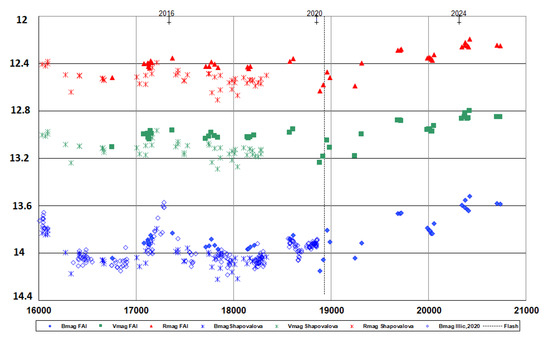
Figure 1.
Light curves of NGC 3516 in B (blue), V (green), (red) filters in 2014–2025. On the X-axis: Julian Date−2,440,000; on the Y-axis: apparent stellar magnitude. Empty squares denote data from [6], crosses denote data from [2], other points are FAI data. The vertical dotted line corresponds to the moment of reaching the maximum of the X-ray flare, published in [6,23,24].
The brightness of NGC 3516 fluctuated during 2019–2022 with the following amplitudes: mag, mag, mag. During the outburst, the X-ray flux peaked on 1 April 2020, showing the highest value recorded for NGC 3516 by the Neil Gehrels Swift Observatory [24]. According to our observations and the data presented in Figure 1, the optical brightness of the galaxy (in B, V and filters) began to increase in April 2020, shortly after the peak in the X-ray domain recorded on 1 April 2020. We note that the onset of the optical flare (18 April 2020) occurs with a characteristic delay relative to the X-ray maximum, which is consistent with the results reported by other authors [24]. At this stage, as seen in the plot, there is a rise in optical brightness up to mag in and – mag in B and V. However, immediately following the onset of this flare, a temporary drop in brightness of approximately mag is observed. Thus, the described pattern represents a complex brightness evolution, including both a rising phase and local fluctuations, which is typical for active nuclei of Seyfert galaxies.
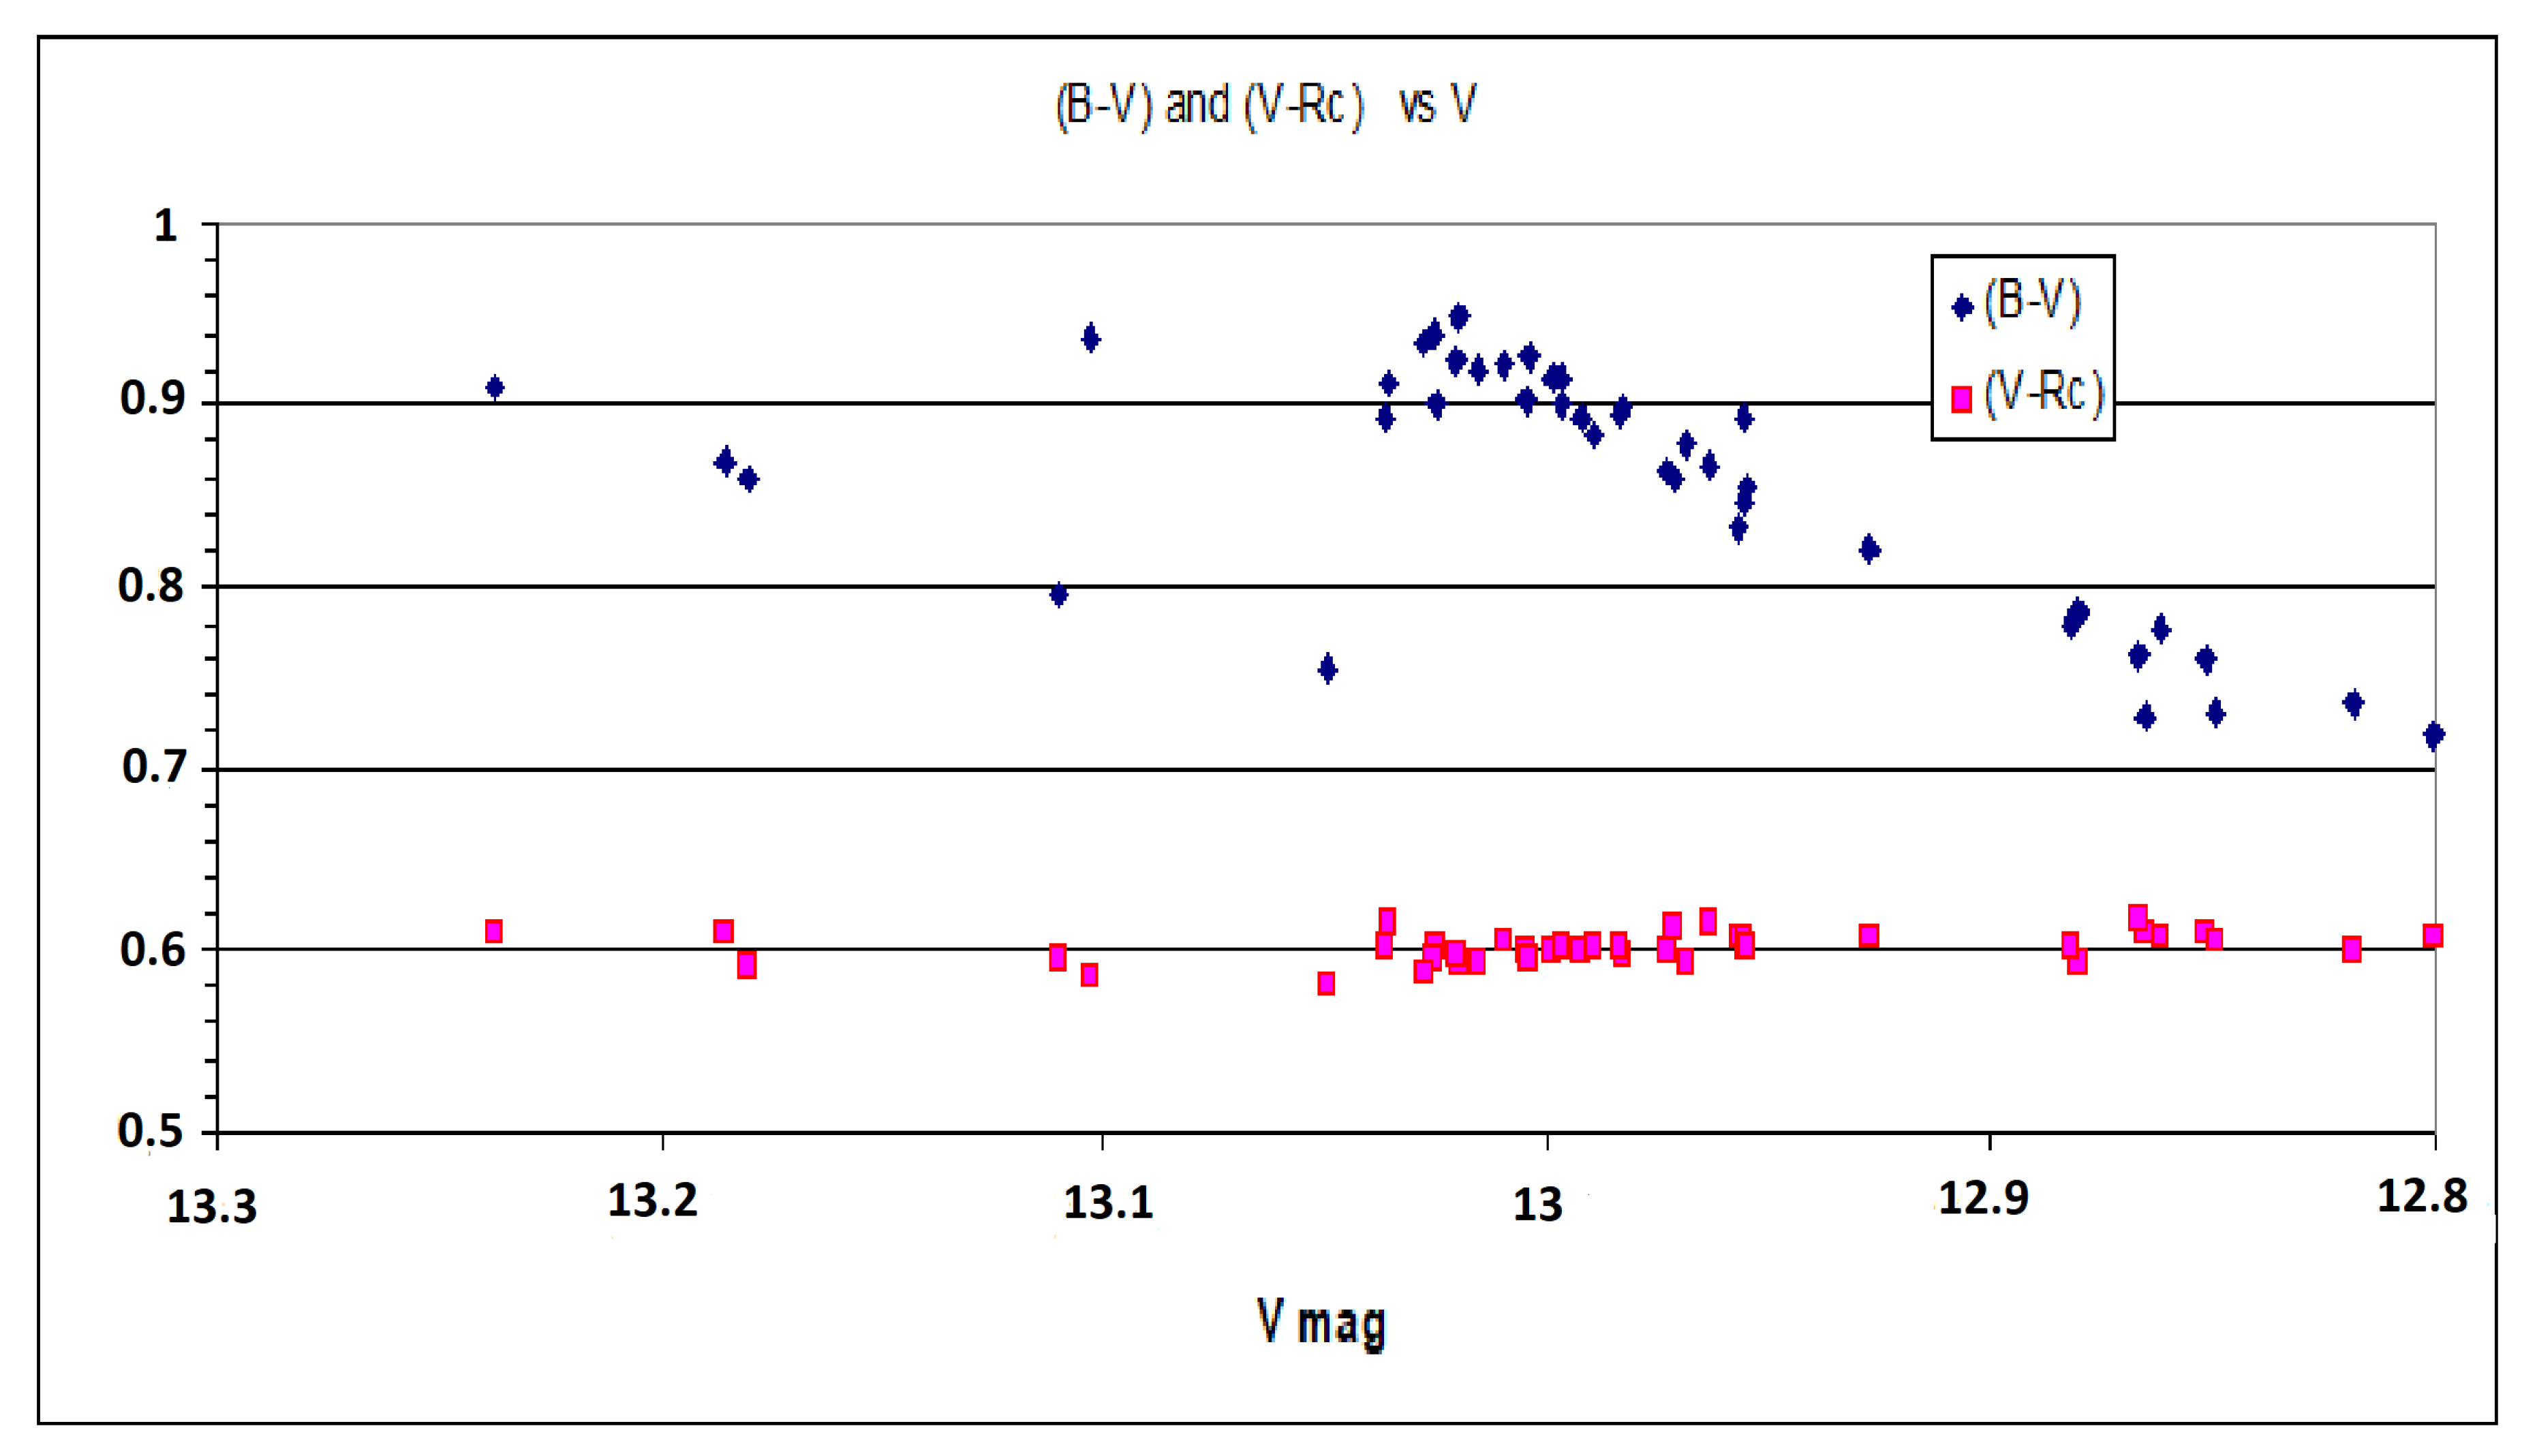
We analyzed the color variability of the object by plotting the dependence of and on the brightness in the V filter (see Figure 2). The plot shows a clear trend of decreasing with increasing brightness in the V filter, indicating the presence of a “bluer when brighter” (BWB) effect. This is characteristic of active galactic nuclei and indicates that the object becomes bluer as the brightness increases. At the same time, remains almost constant over the entire brightness interval, which confirms that the main contribution to the color change comes from the blue range.
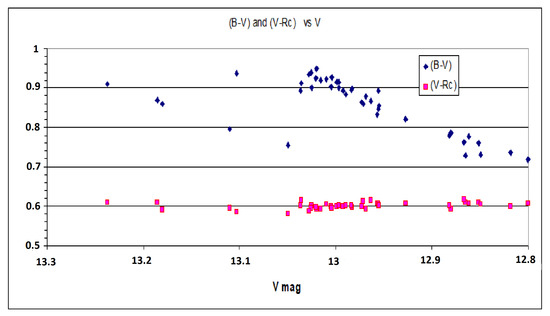
Figure 2.
Color-magnitude relations demonstrating the “bluer when brighter” effect in the NGC 3516.
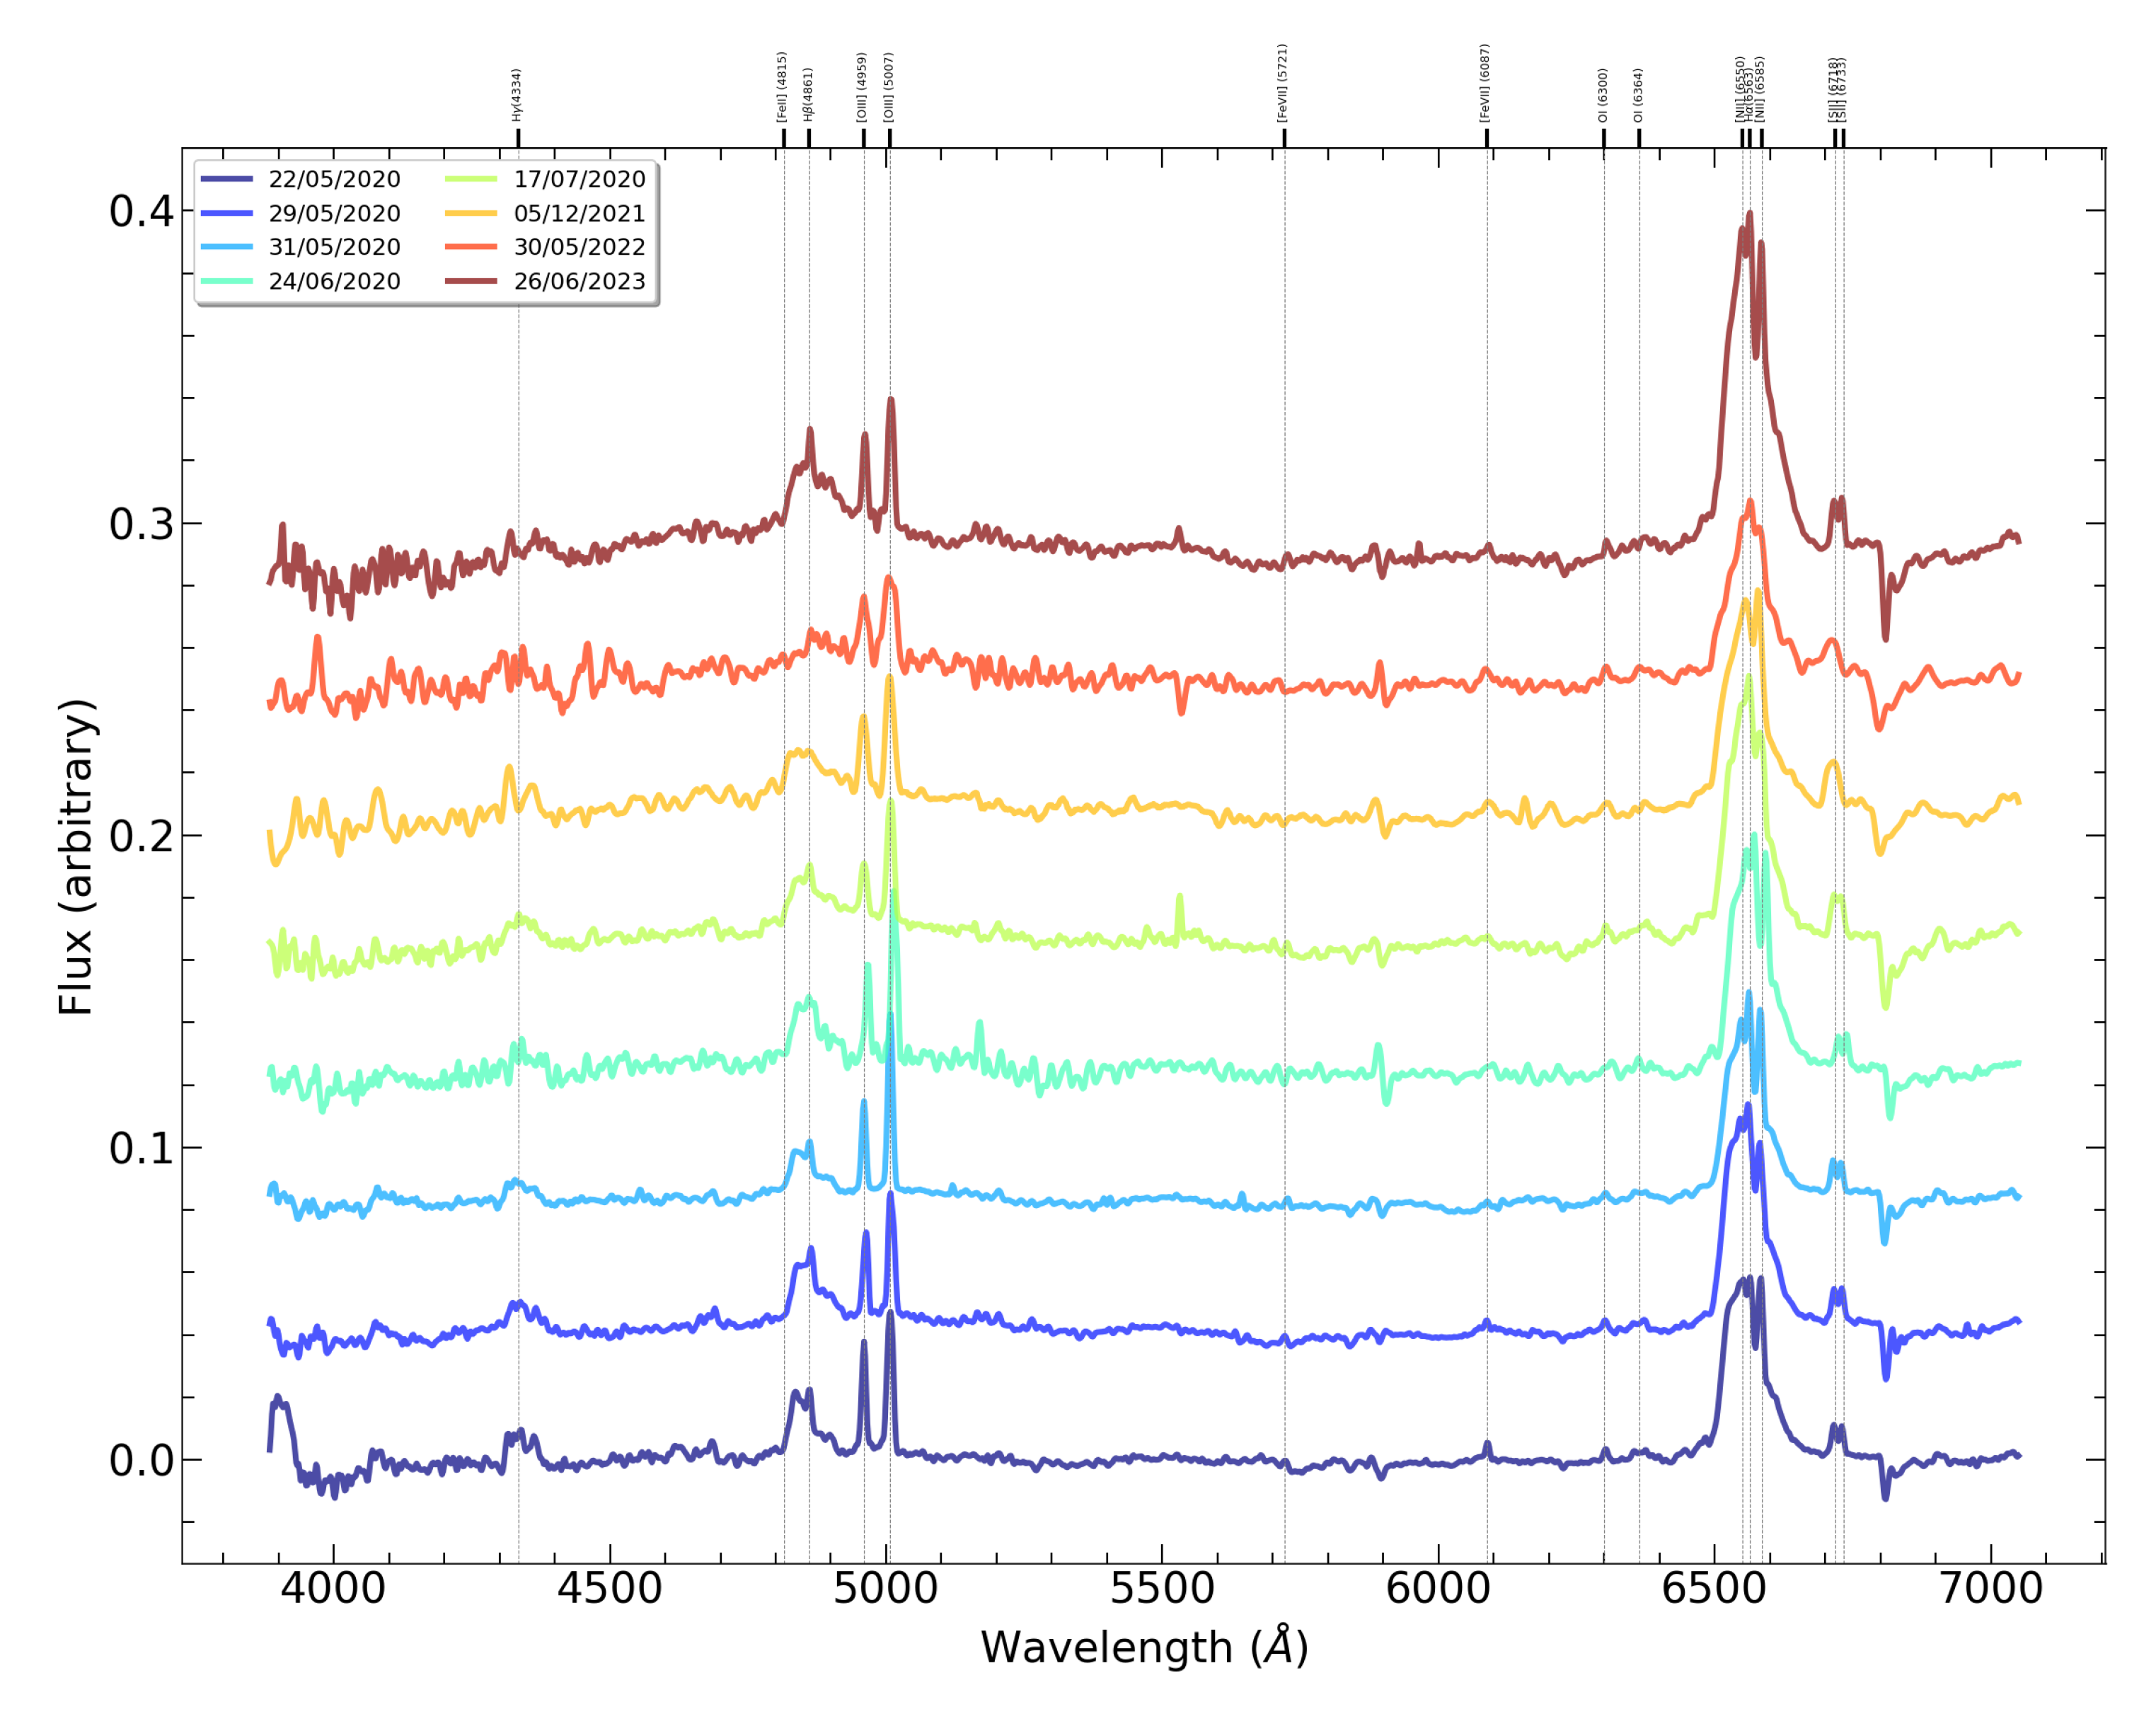
The spectra of NGC 3516 in the spectral range Å to Å are presented in arbitrary units and shifted along the Y-axis for profile comparison (Figure 3). It was noted that on 22 May 2020, the spectrum presents prominent narrow resolved emission lines [FeVII] 5721 Å, 6087 Å. These coronal emission lines probably originate from the inner region, and for their creation, most likely a hot X-ray wind is needed [25,26,27].
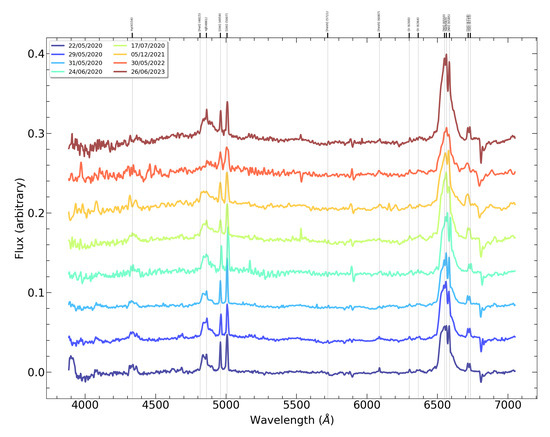
Figure 3.
Spectra of NGC 3516, in the spectral range from Å to Å during the period of 2020–2023. Spectra are normalized to the mean F[OIII] for comparison and are shifted along the Y-axis.
Table 2 includes data such as continuum fluxes, emission line fluxes and equivalent widths. The [SII] flux in Table 2 refers to the combined flux of the [SII] doublet lines at 6717 Å and 6731 Å.
Table 2.
Fluxes in the emission lines and continuum in the spectrum of NGC 3516.
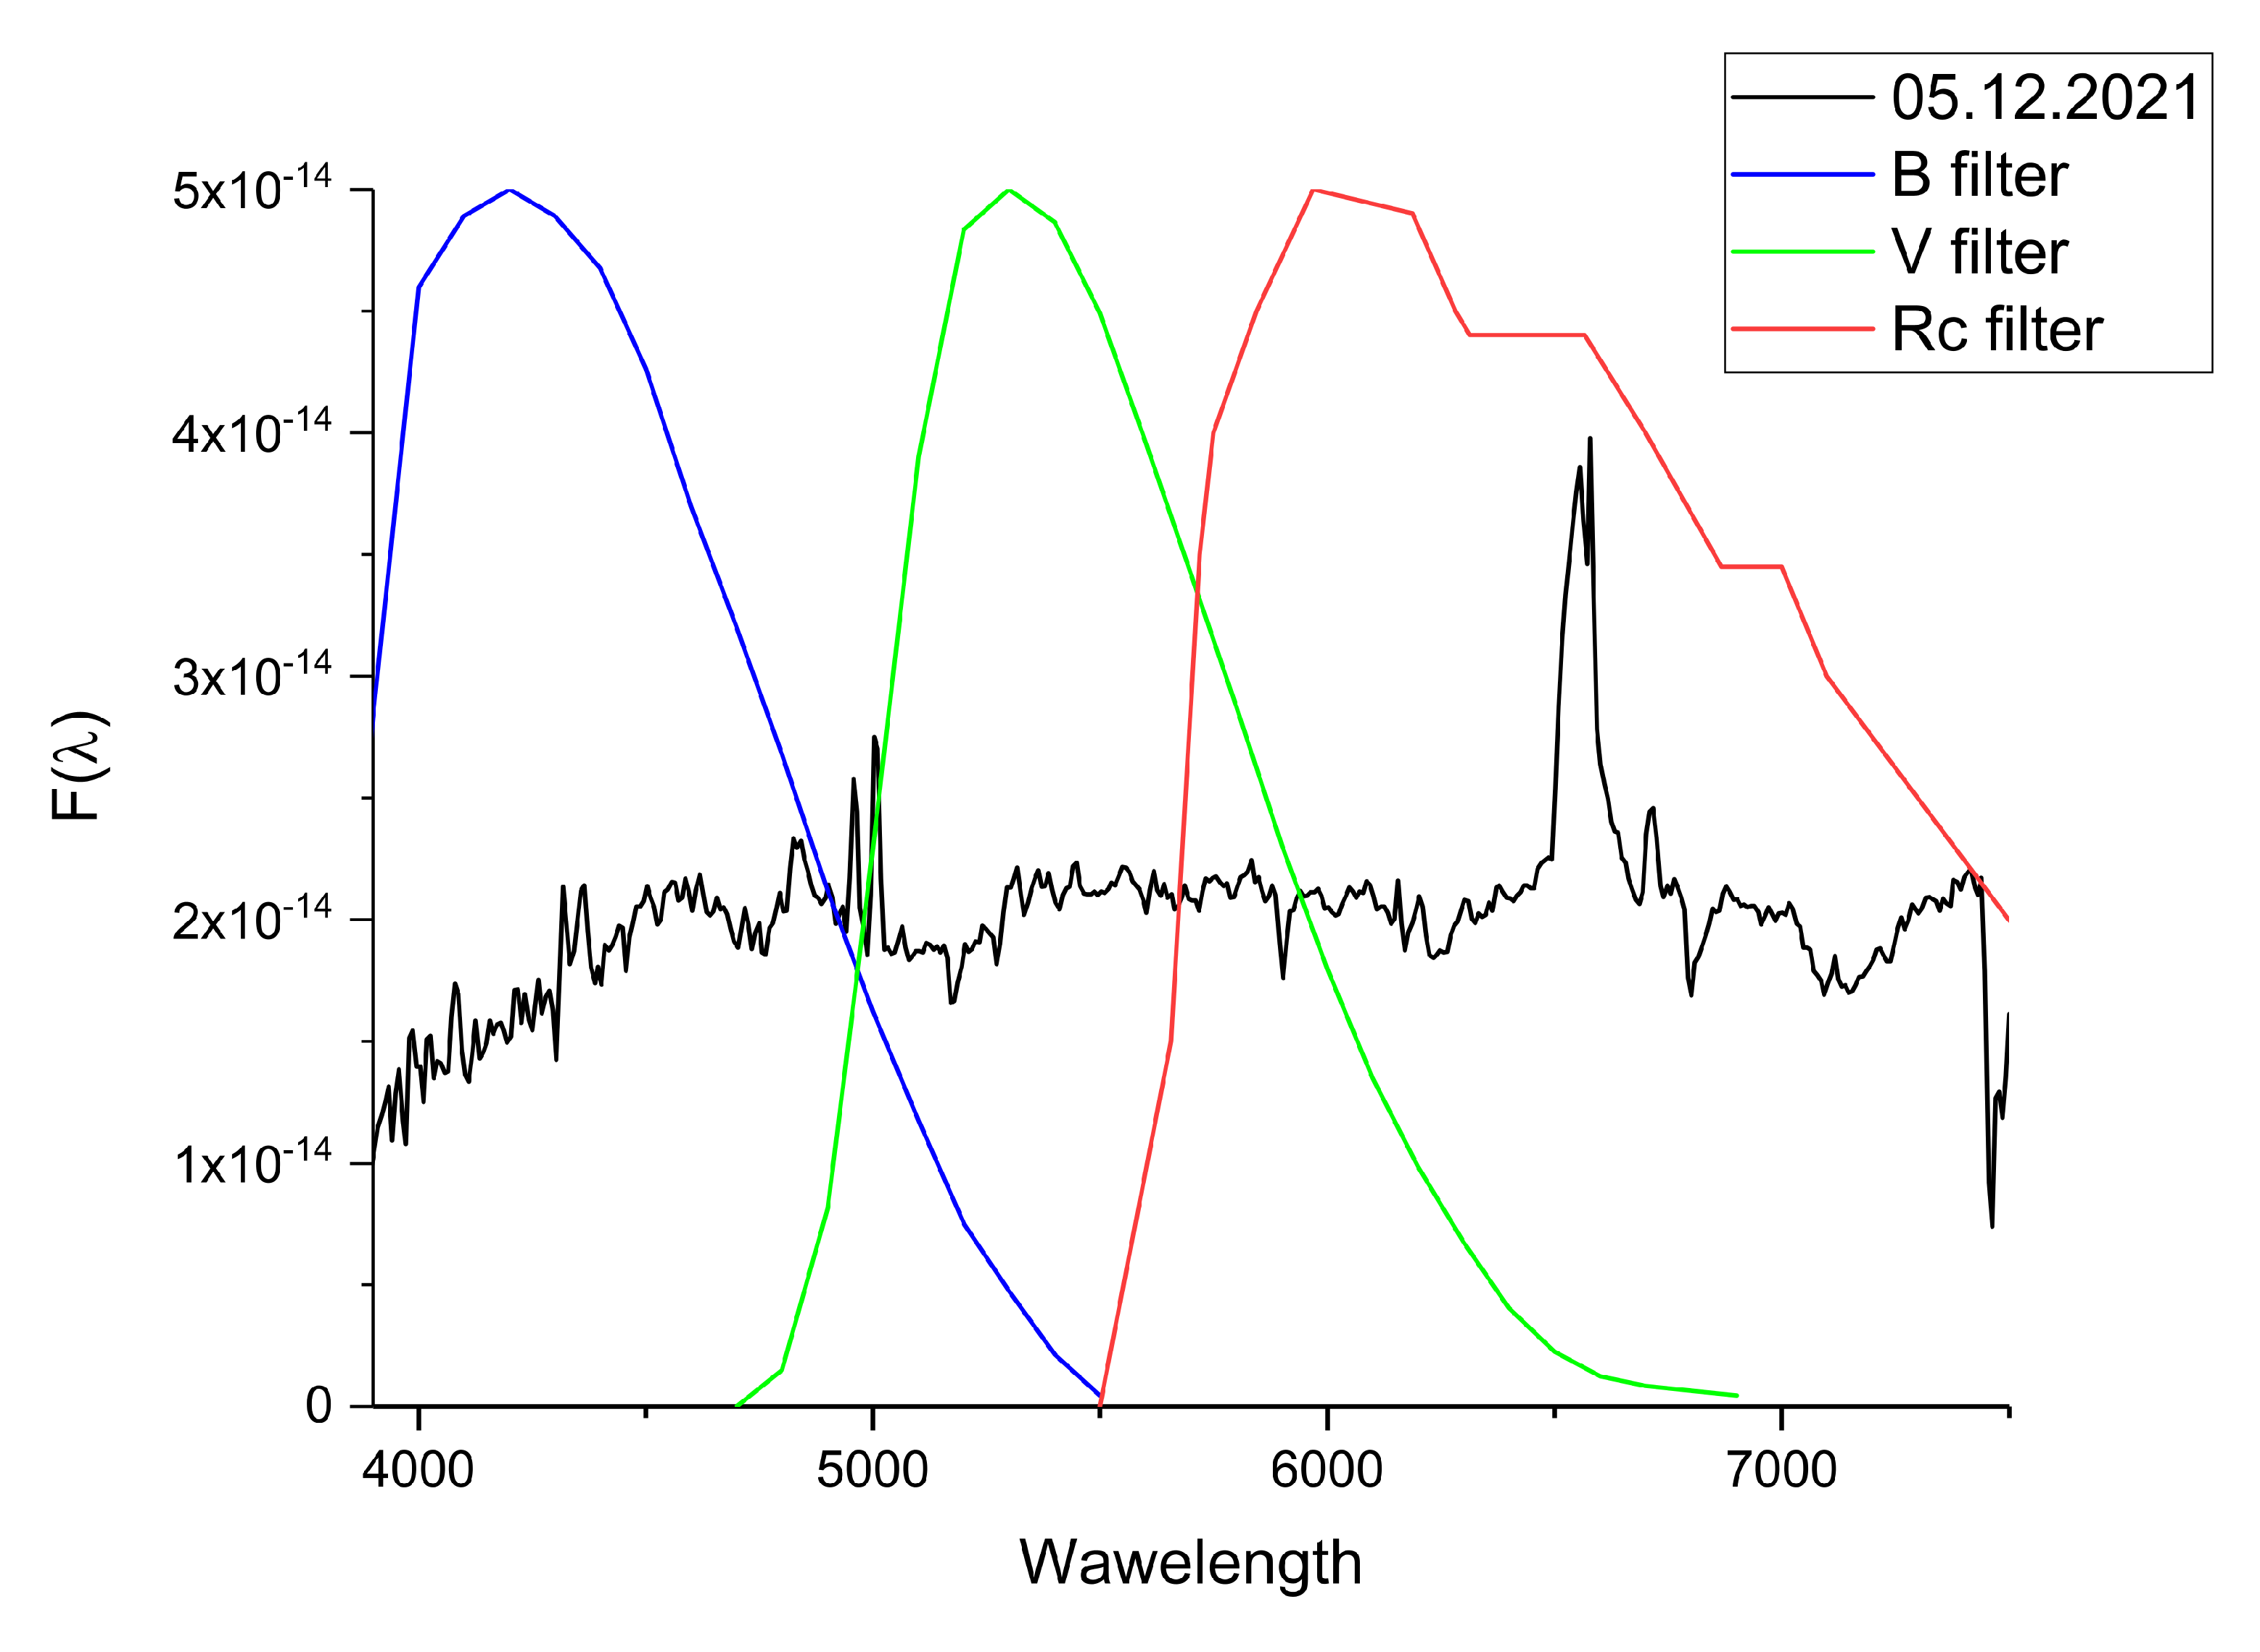
We added the transmission curves of the B, V and photometric filters over the spectrum of NGC 3516 observed on 5 December 2021, to show which emission lines can affect the brightness of an object in the filters used (see Figure 4). The emission line H 4861 Å falls within the B filter range, [OIII] 5007Å within the V filter and H 6563 Å together with the [SII] 6717 Å , 6731 Å doublet within the filter range.
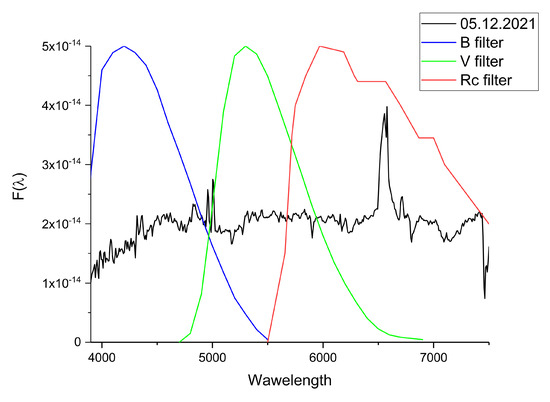
Figure 4.
Overlay of B, V and filters on the spectrum from 5 December 2021.
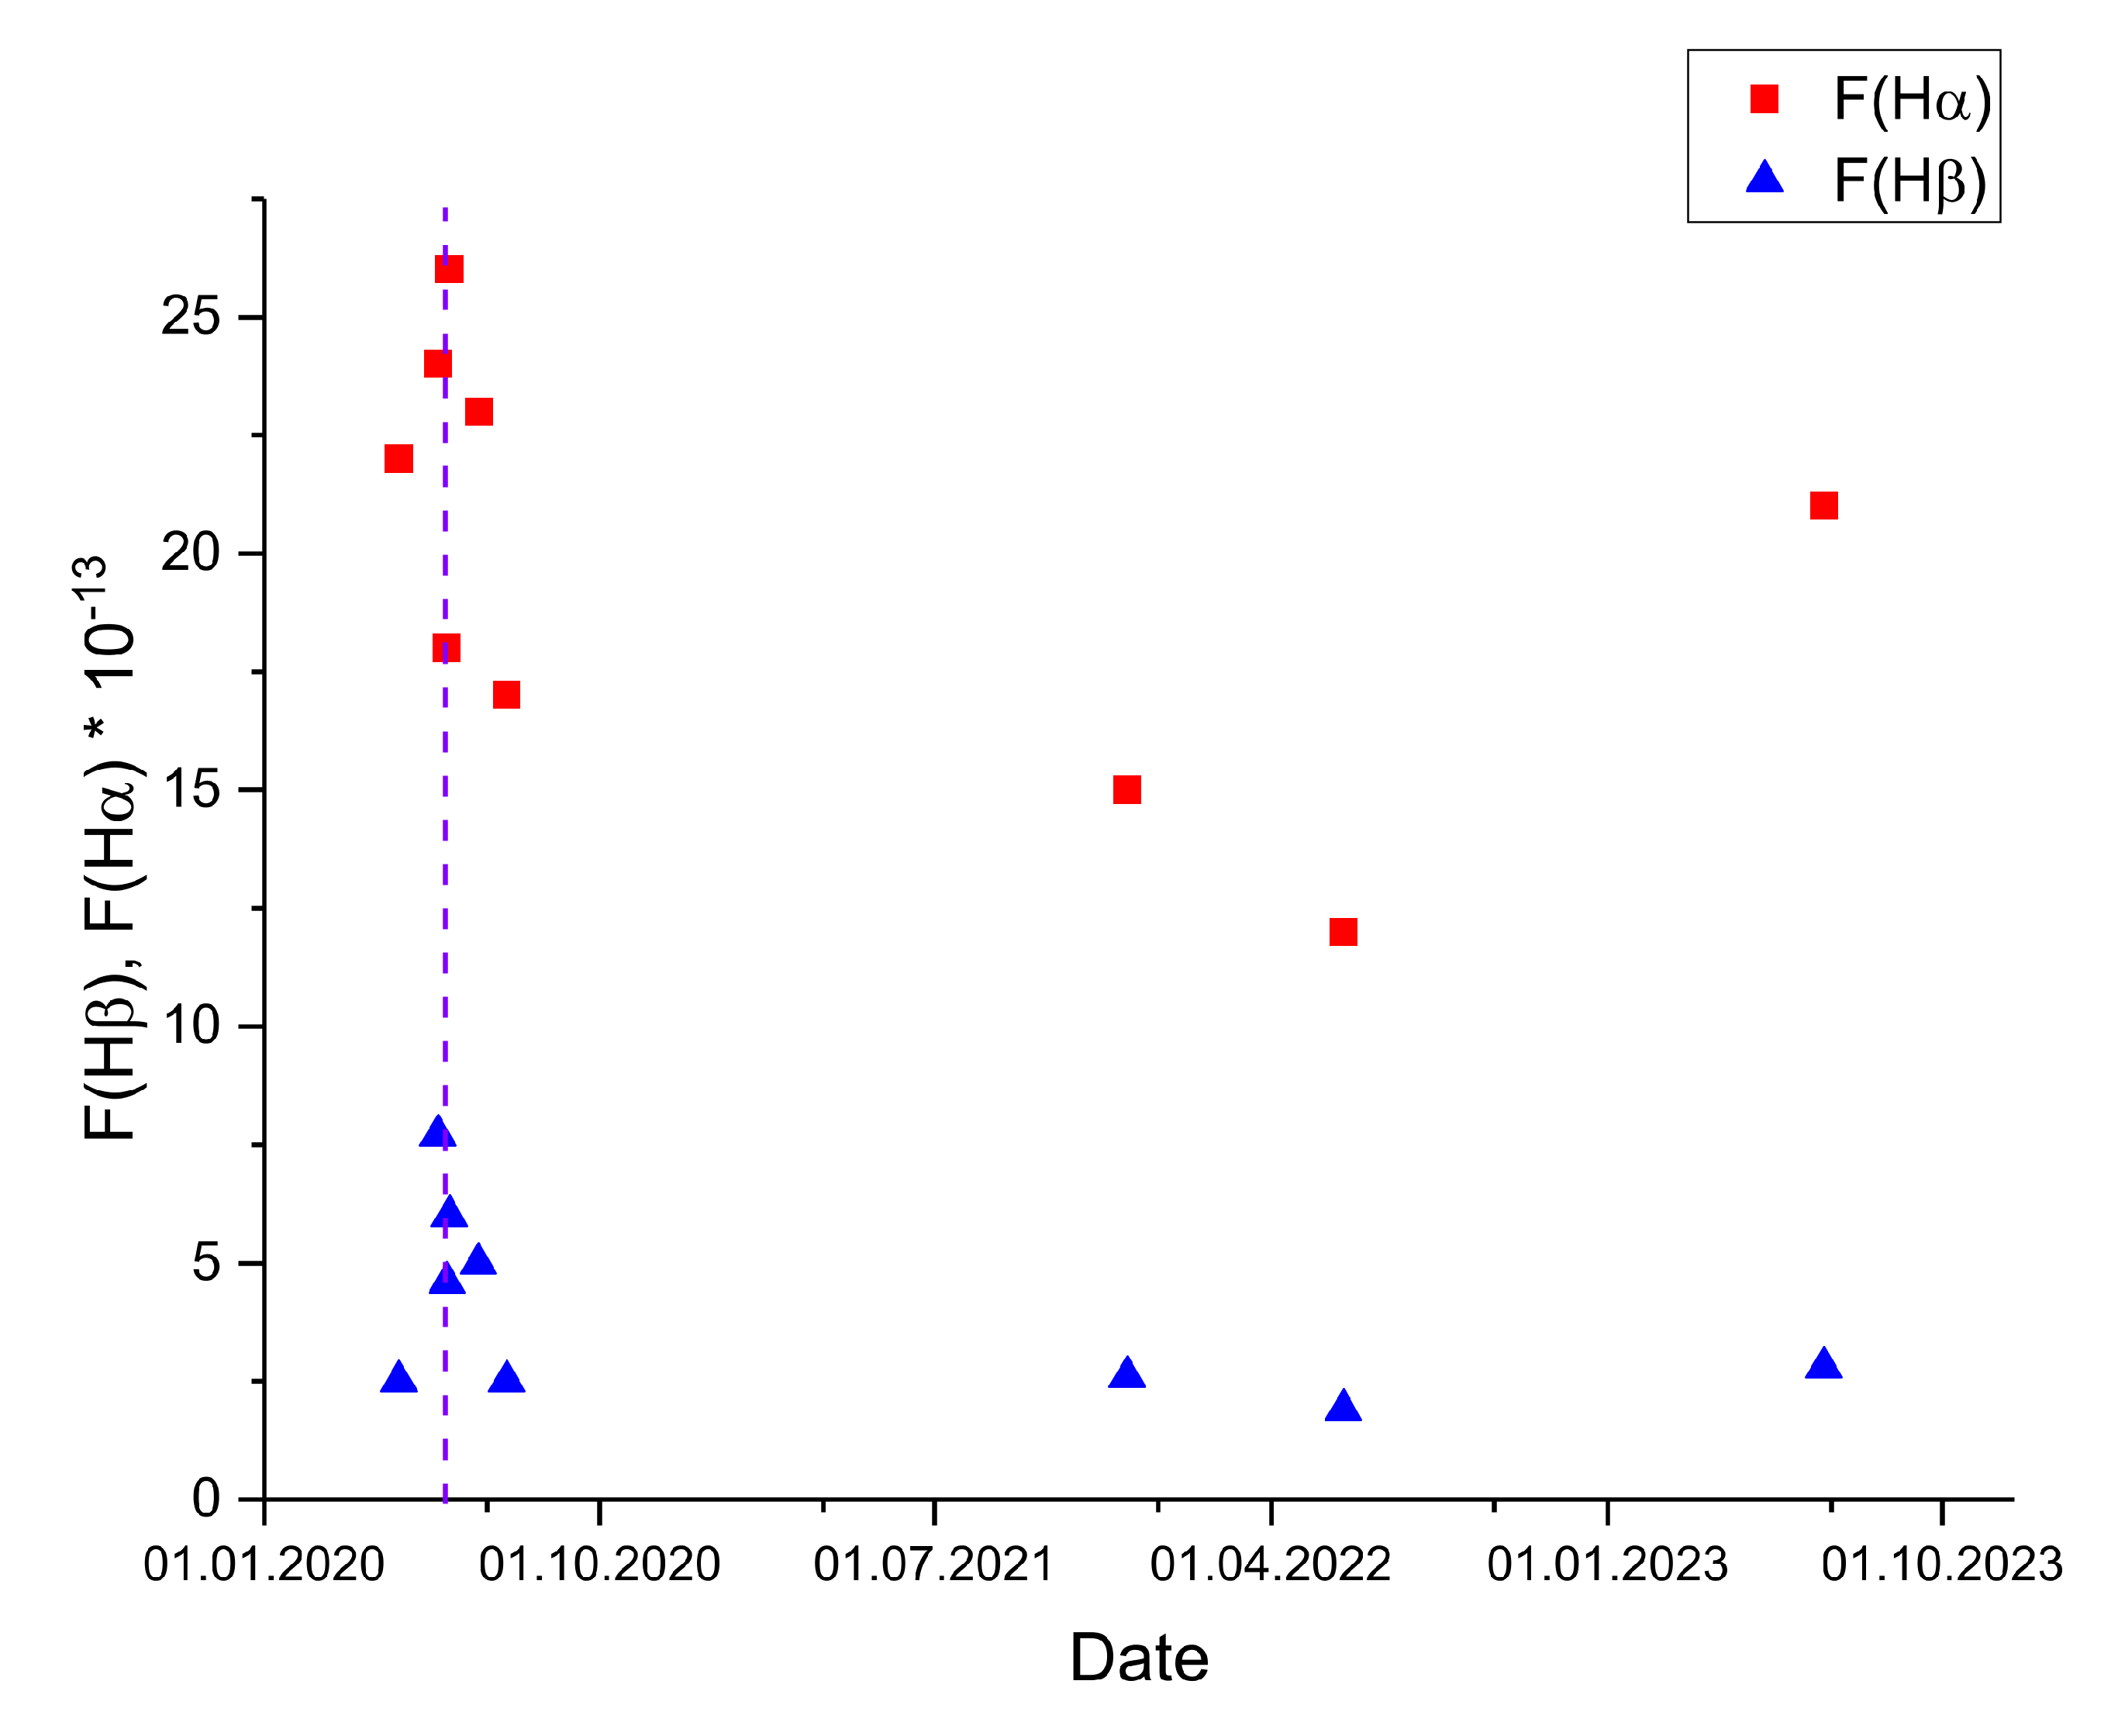
We have visualized the change in the fluxes of the H+[NII] and H lines in Figure 5, which allows us to trace their variations over time.

Figure 5.
The change in the fluxes of the H+[NII] and H lines. The vertical dashed line corresponds to the maximum of the X-ray flash from [6].
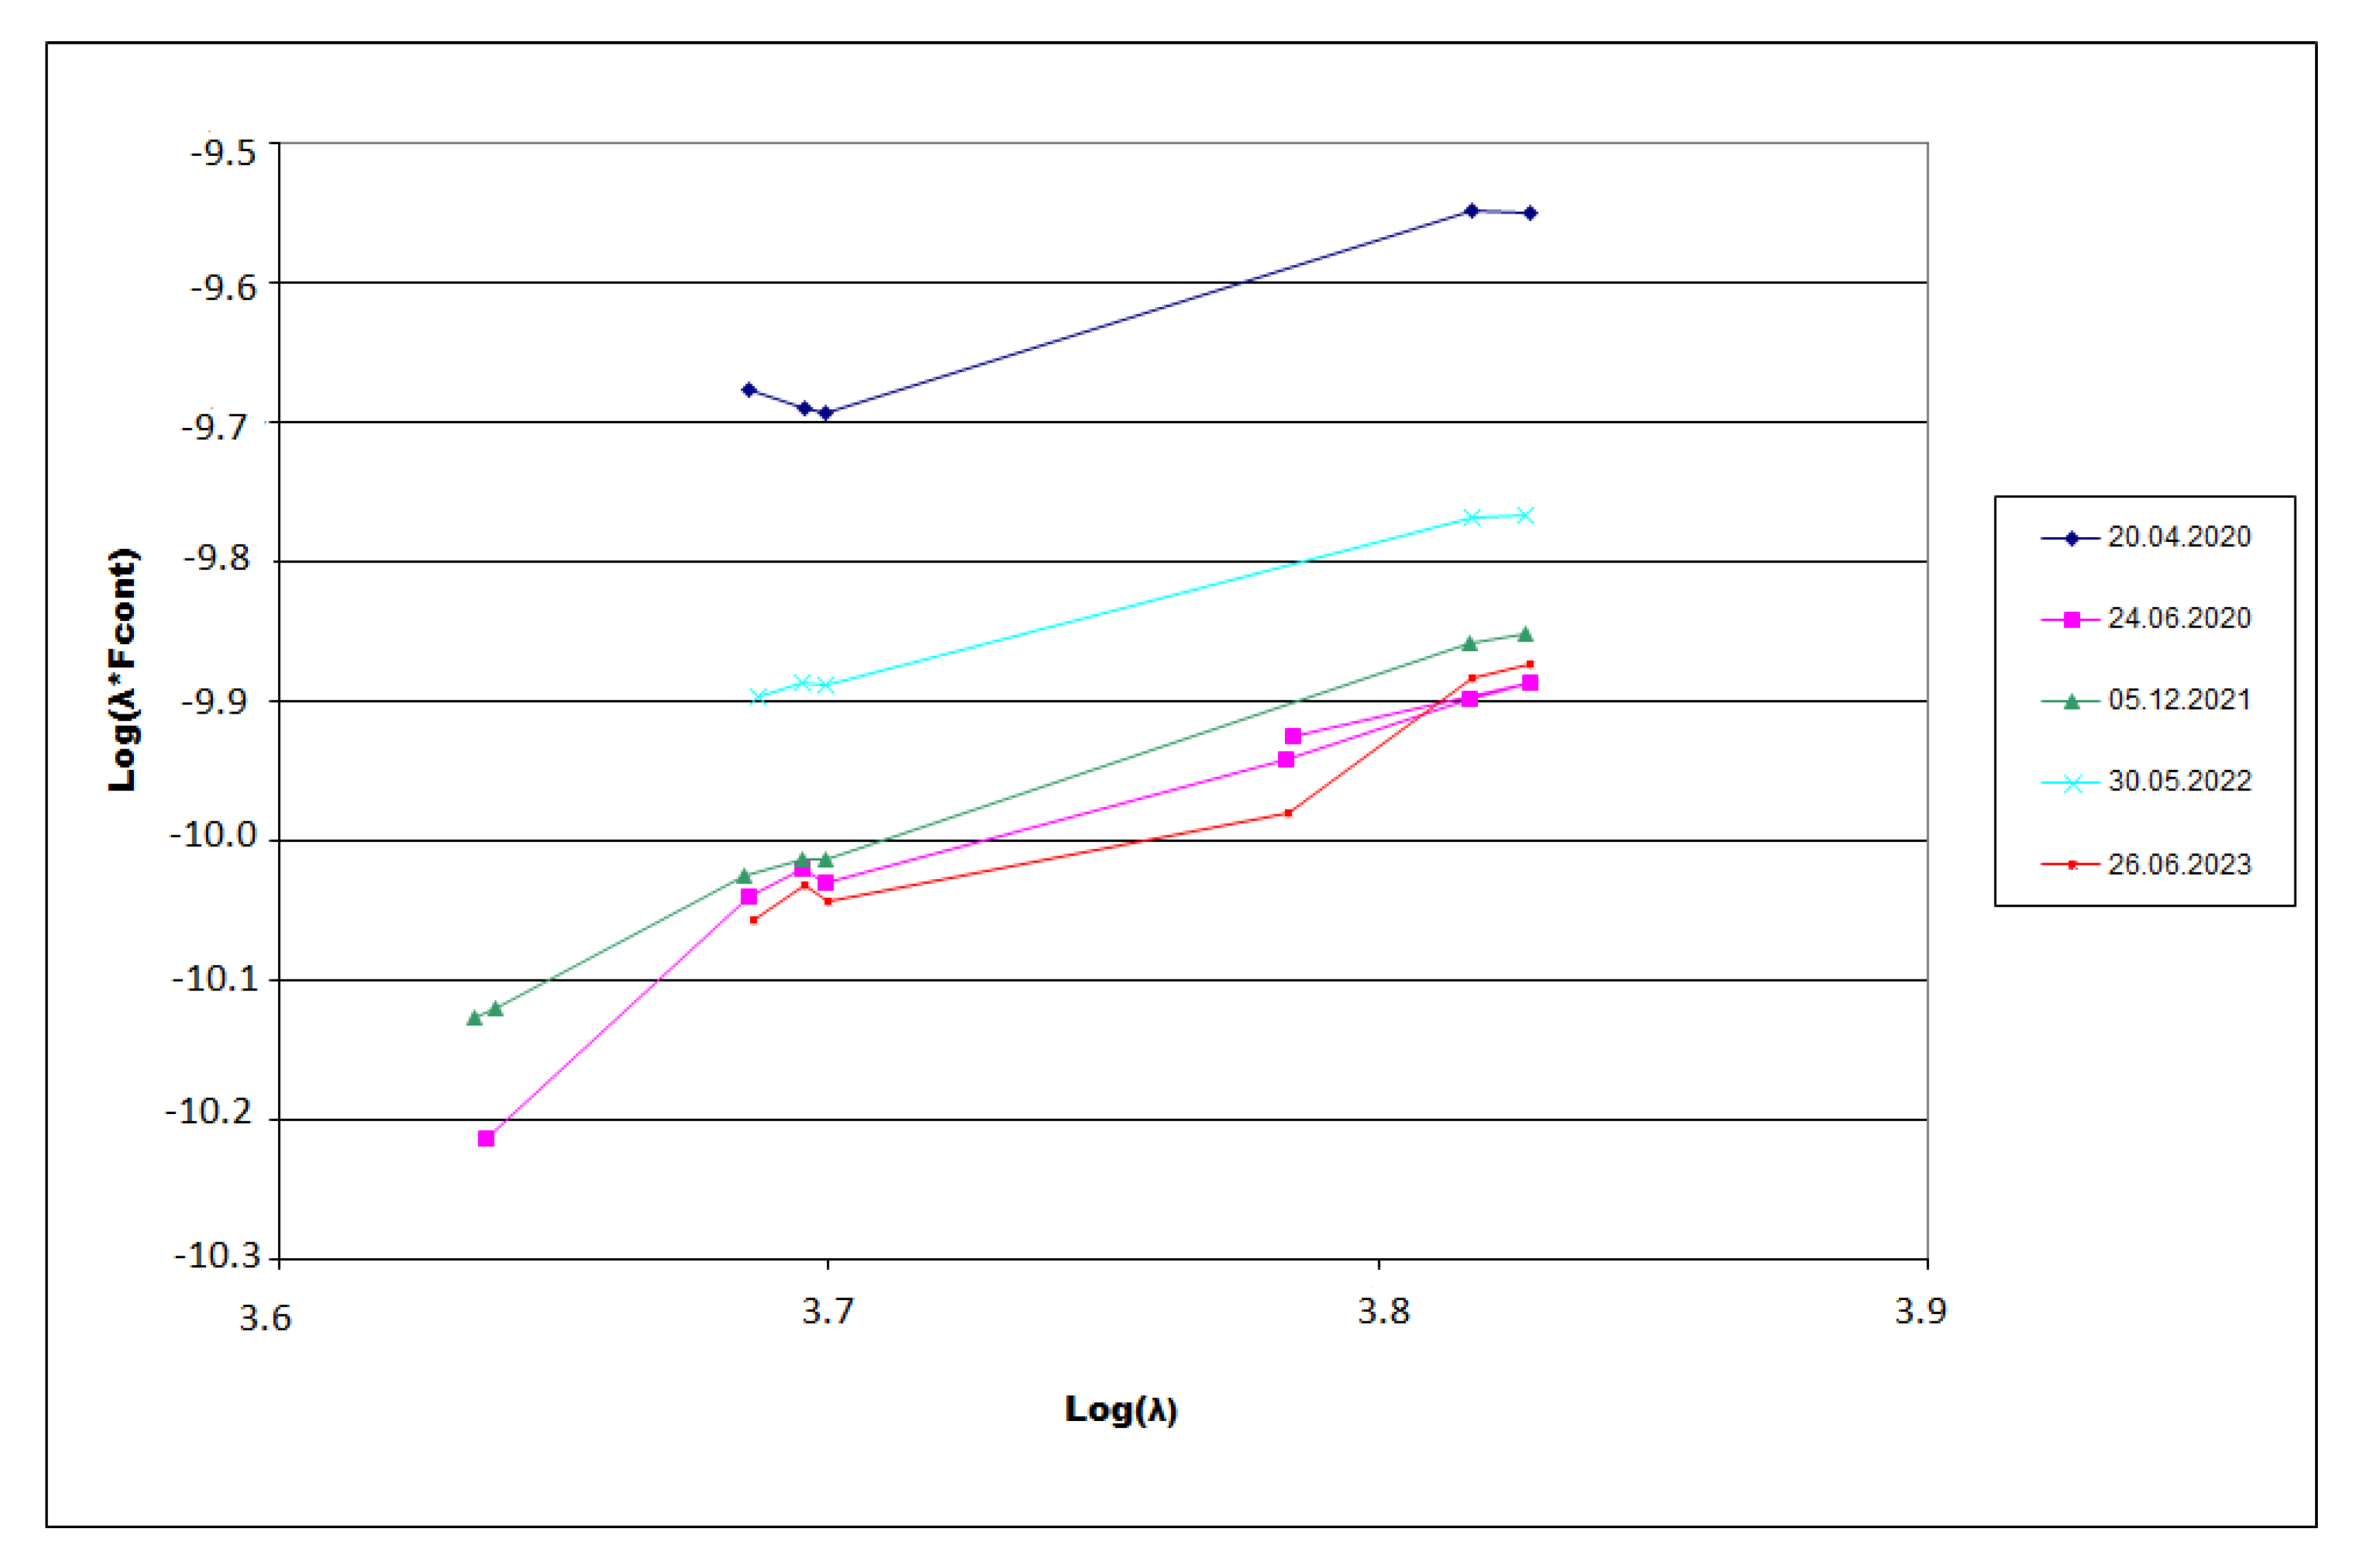
The Spectral Energy Distribution (SED) of the galaxy in the long-wavelength range is constructed based on continuum fluxes. Figure 6 demonstrates that the enhancement of optical continuum observed in 2020 corresponds to an increase in the ionizing radiation in the short-wavelength region of the spectrum.
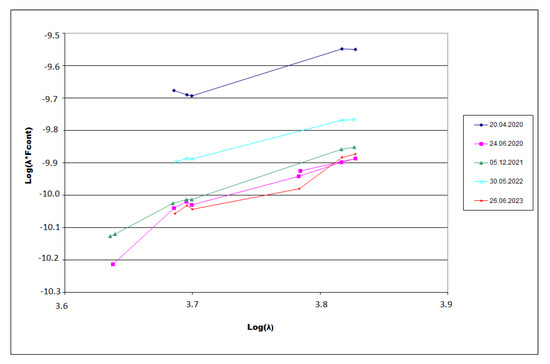
Figure 6.
SED of the galaxy NGC 3516 in the long-wavelength range, based on continuum fluxes.
The SED at high continuum brightness corresponds to the maximum values of fluxes in the H and H lines. Two points on the light curve related to 2022 (Figure 1) correspond to a slight increase in the continuum level (Table 2) and a “rise” in the SED (Figure 6). At the same time, the emission fluxes in the H and H lines remain at a low level, which leads to a decrease in their equivalent widths. The galaxy’s brightness reaches another maximum in 2024, an increase in emission fluxes is observed in mid-2023, the SED is at a low level, but its slope changes and the color indices decrease.
For a quantitative assessment of the broad-line region (BLR) size at different epochs, we calculated the continuum luminosity at Å (L5100), adopting a luminosity distance to NGC 3516 of Mpc, and applied the empirical R–L relation from Bentz et al. [28]. The results are summarized in Table 3. The characteristic size of the BLR varies between approximately 0.13 and 0.20 light-days across different observational epochs. The largest value was obtained in April 2020 (0.20 light-days), corresponding to the period of enhanced continuum luminosity. A slight increase in R is observed again in 2023, which matches a higher (though not maximum) SED position in Figure 6. By June 2023, a gradual decrease in to 0.13 light-days is observed, corresponding to a decline in continuum flux and the evolution of the spectral energy distribution.
Table 3.
Flux, luminosity and BLR size estimates for NGC 3516.
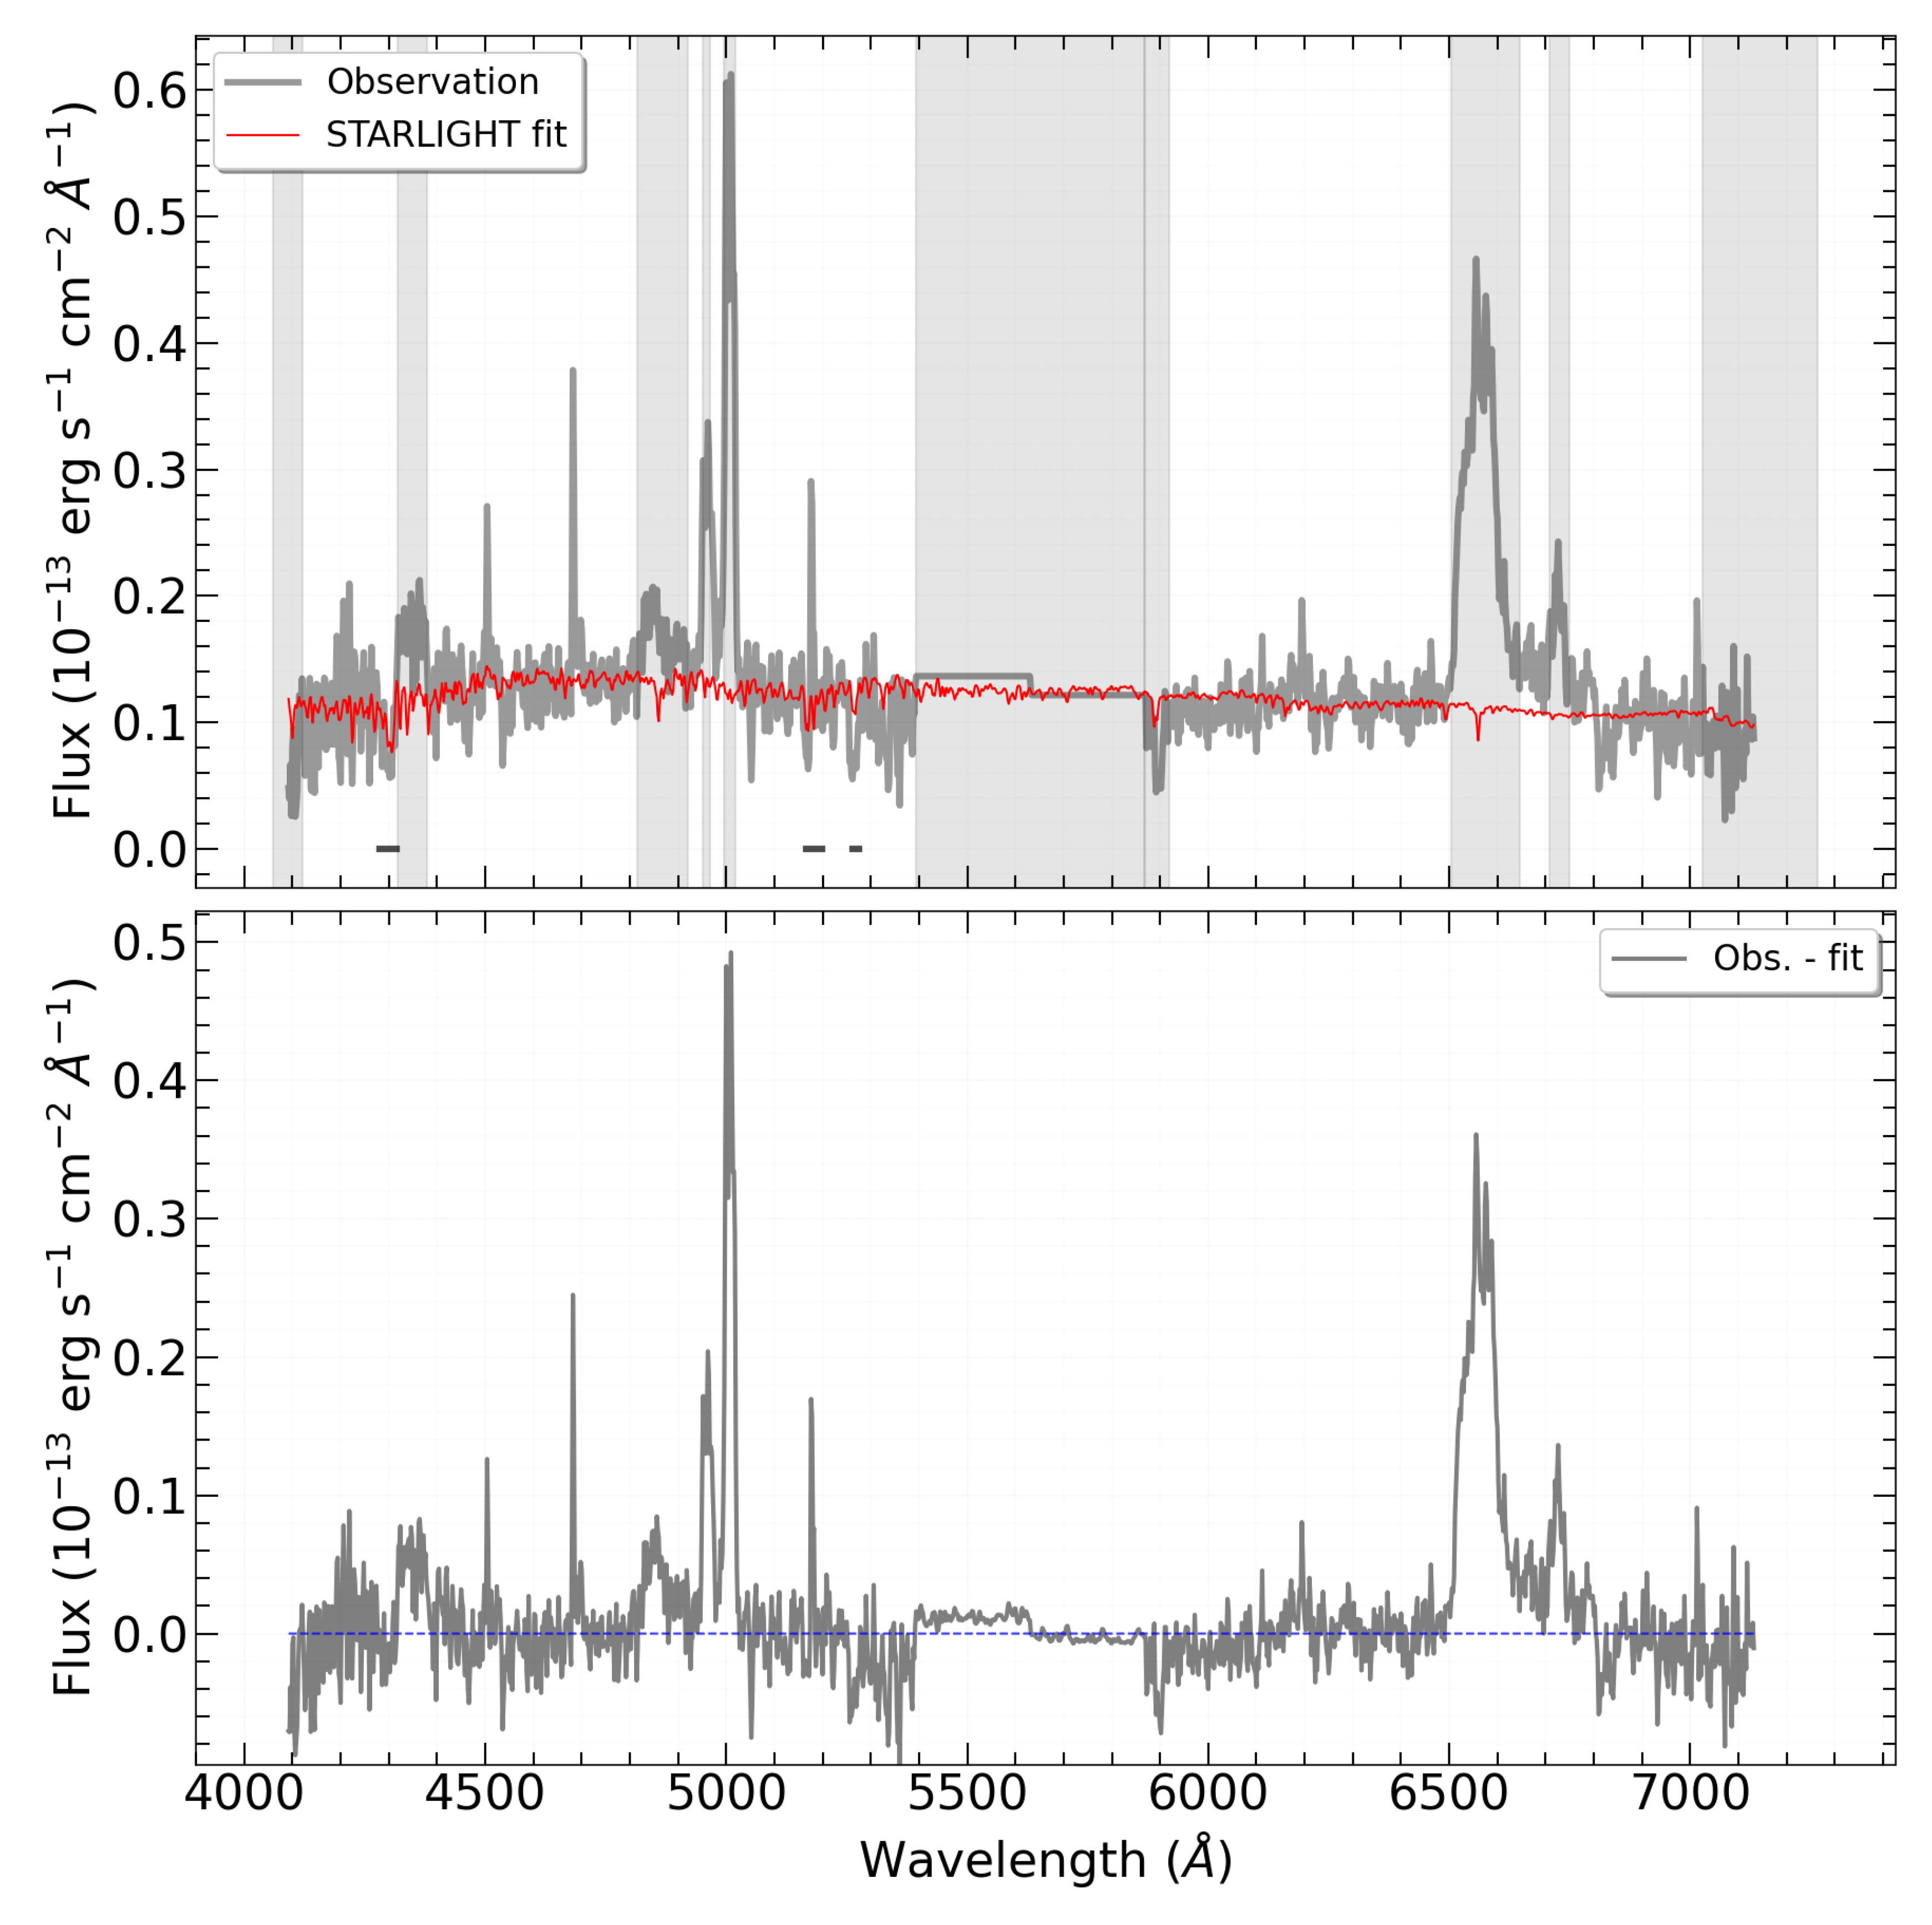
The spectrum of NGC 3516 obtained on 20 April 2020, with the “West” 1-meter (TSHAO) telescope was employed to separate the complex line profiles into individual components. When approximating emission line profiles in the spectrum with composite models, we apply a so-called “uninformative” approach as prior information for each model parameter. In this approach, the probability of a given parameter value is uniformly distributed within a specific range derived, for example, from previous studies of this object.
To describe the stellar component of the galaxy, we approximate the combined (stitched) spectrum of the galaxy using a set of templates with metallicity = and ages of Gy, a total of 9 spectra. In other words, we use a combination of spectra to accurately describe the light emitted by all the stars in the galaxy and account for their contribution to the overall spectrum. The result is shown in Figure 7 [29].
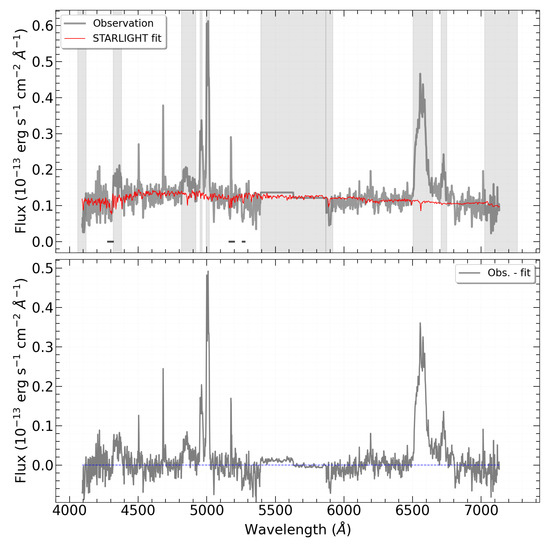
Figure 7.
Result of considering the stellar component in the spectrum of the galaxy NGC 3516 using the STARLIGHT [29] package (https://starlightsoftware.github.io/, accessed on 6 November 2024) for observations dated 20 April 2020.
We apply a Bayesian approach to determining the main parameters in the region of narrow line emission (NLE) and broad line emission (BLE), such as velocity dispersion and radial velocities, and identifying the most plausible model (the number of components in BLE). The “Bayesian evidence” factor is determined using the nested sampling method implemented in the DYNESTY package (Appendix A).
3.2. Spectral Modeling
Spectral Range Å– Å
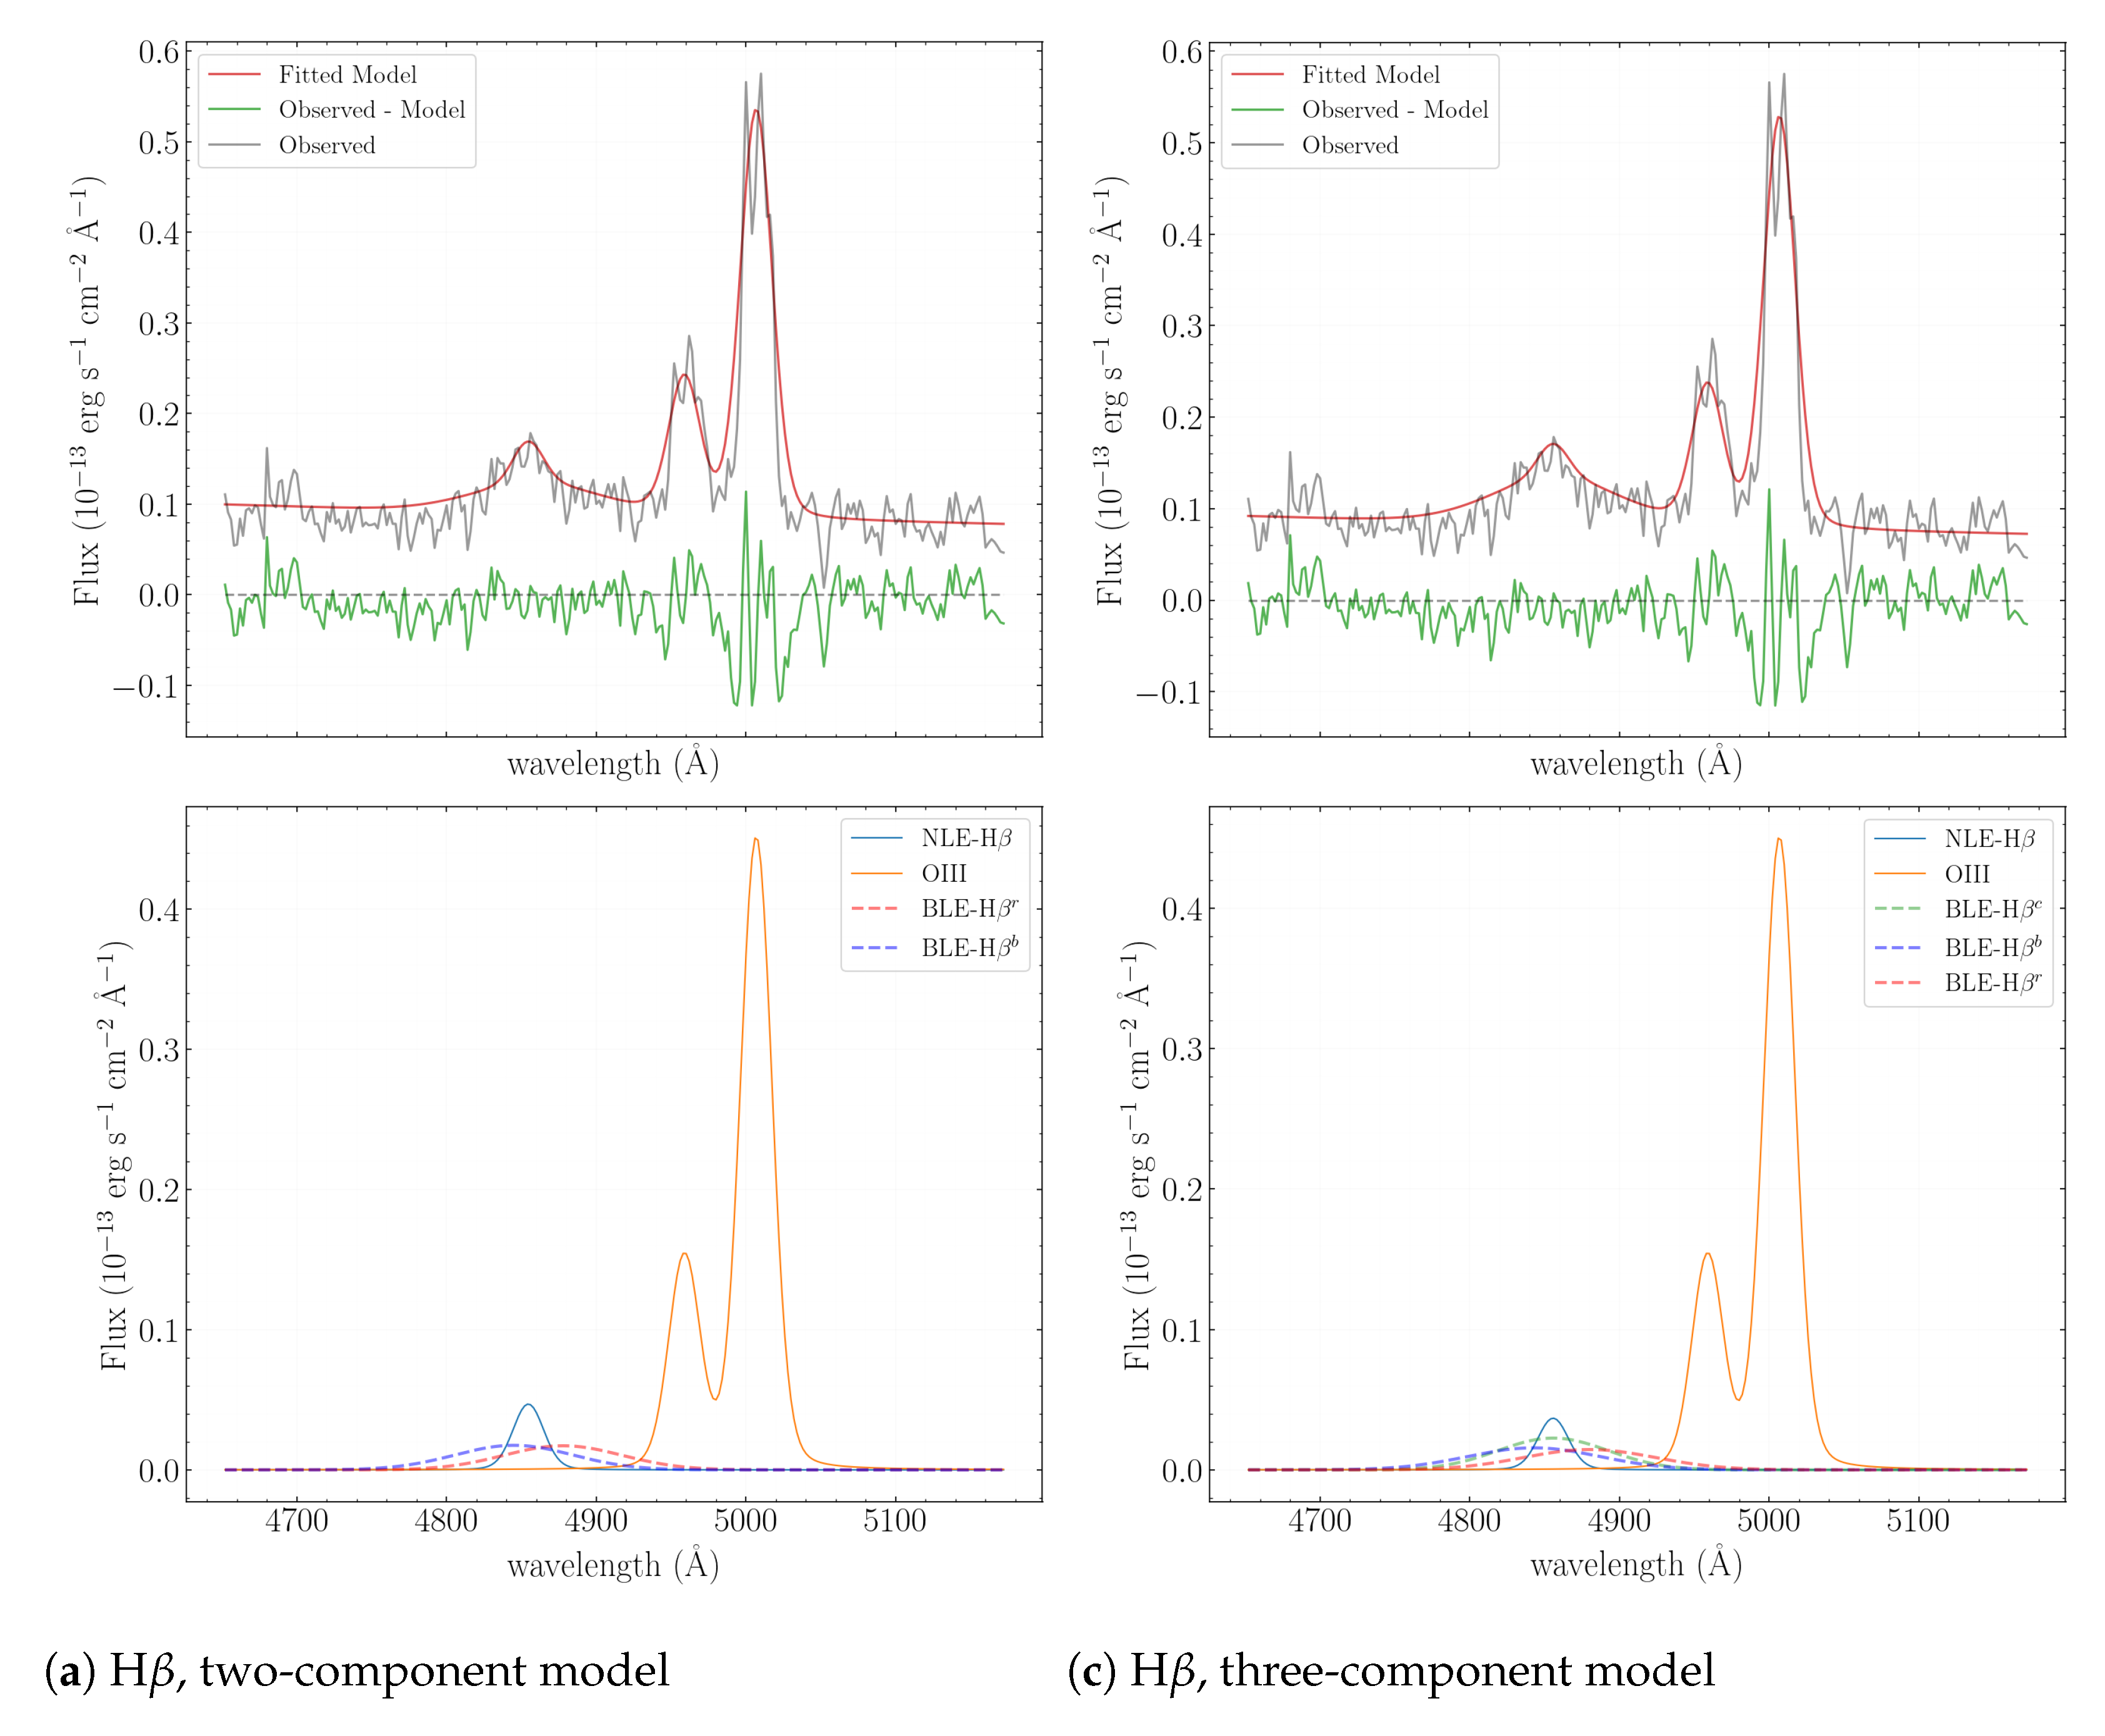
In this spectral range, NLE are represented by H 4861 Å, [OIII] 4959 Å and [OIII] 5007 Å. The NLE profiles are described using a Voigt function, assuming the same velocity dispersion for all lines. The amplitude ratio for the [OIII] doublet is fixed at 1:2.98. A two-component profile is used for BLE in H. A total of 12 parameters were used in the model. The results are shown in Figure 8.
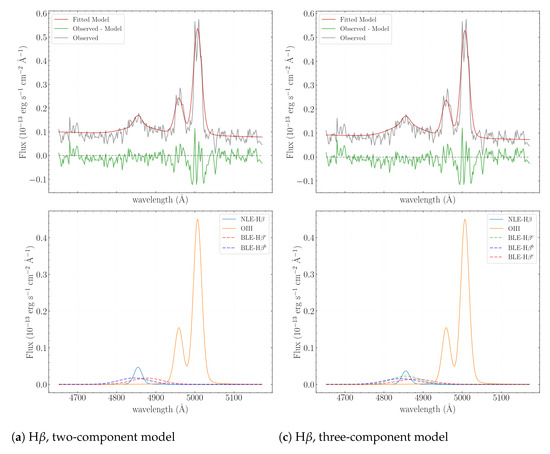
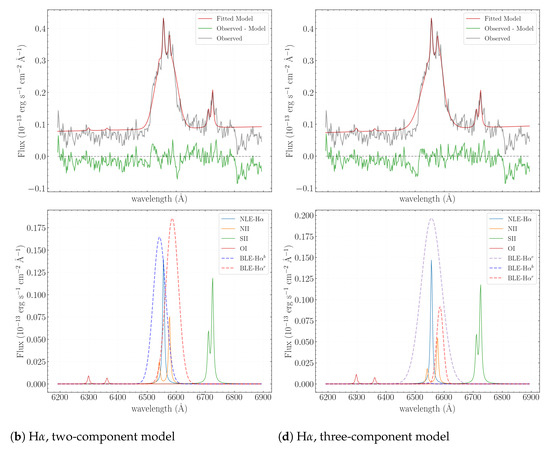
Figure 8.
The result of the approximation with the combined profile.
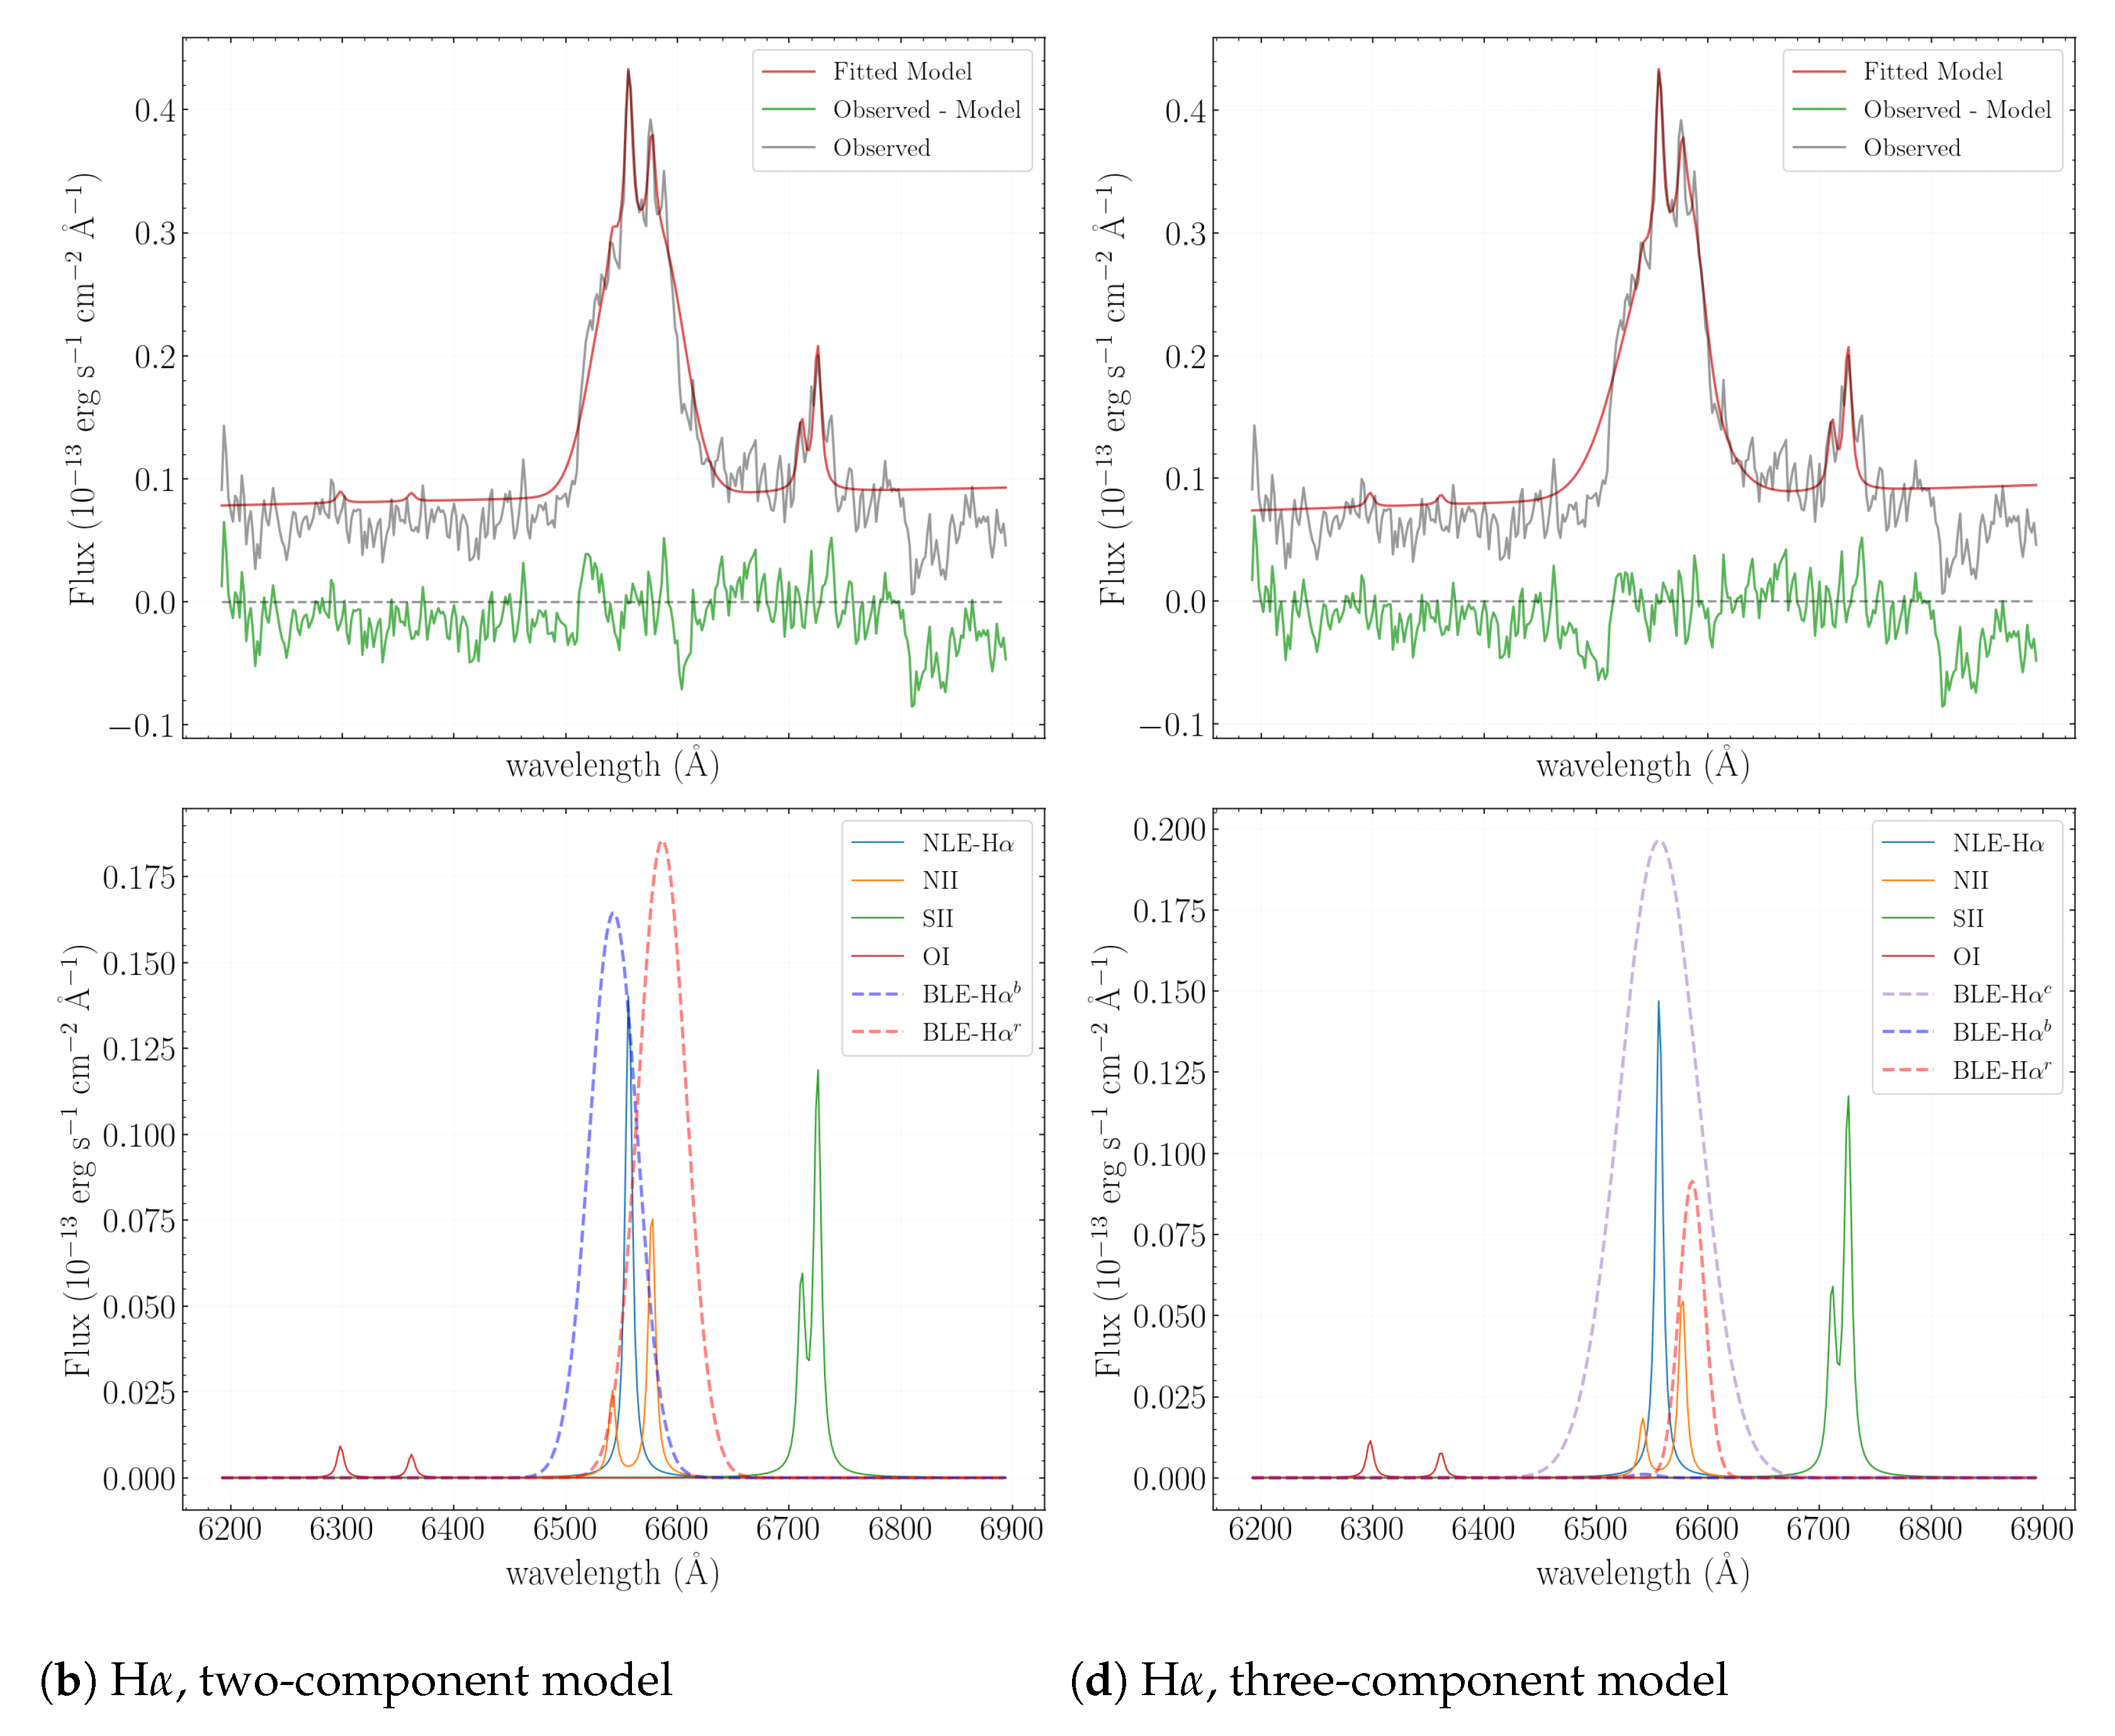
Spectral Range Å– Å
In this spectral range, the NLEs include the following: [OI] 6300.3 Å, [OI] 6363.8 Å, H 6564.6 Å, [NII] 6549.9 Å, 6585.3 Å and [SII] 6718.3 Å, 6732.7 Å, Figure 8. The NLE lines are modeled using a Voigt function [30] with identical velocity dispersions. The amplitude ratio for the [NII] doublet is set at 1:3.05. As a result of model fitting we estimated FWHM (H) = km , FWHM (H) = 353 km , EW (H) = 28 Å.
For the H range, the three-component model is preferred over the two-component model for describing the BLE profile, as = , indicating that the three-component model is 16 times more likely than the two-component one. For the H range, the two- and three-component models exhibit similar statistical significance (). The three-component model was chosen for consistency, considering the noise level and uncertainties. All approximations for the NLE lines used a Voigt profile, while the BLE lines were modeled with either a two- or three-component Gauss profile. The high noise level in this region prevents us from having a precise measurement of H velocity dispersion used for Black Hole mass estimation.
4. Discussion
The main goal of our work was to study the photometric and spectral variability of the Seyfert galaxy NGC 3516. We obtained brightness estimates in the B, V and filters, as well as flux measurements of all observed emission lines and the continuum near these lines.
Figure 1 shows the light curves of NGC 3516 in the B, V and filters based on observational data collected from 2014 to 2025 and supplemented by results from [2,6]. Our brightness values in the V and filters are approximately 0.2 mag higher than those reported in [2]; the cause of this discrepancy remains unclear. In the B filter, the values from [6] lie slightly above our light curve, while those from [2] lie somewhat below it. Overall, the agreement in the B filter can be considered satisfactory, and we will rely primarily on these data in the following discussion.
Thus, Figure 1 shows brightness maxima in 2014 and 2016. A subsequent brightening was observed in 2019. A powerful X-ray flare on 1 April 2020, caused an increase in optical brightness by about 0.2 mag, which was significantly weaker than the 2016 maximum. A new rise followed the subsequent decline in brightness in 2021. Due to the irregular nature of our observations, we can only note a general trend of gradual brightening from 2021 to 2025, without discussing the details of the process. In 2025, the B magnitude reached the same peak value as observed in 2016.
Maximum fluxes in the emission lines H, H and in the continuum were recorded in spring 2020. About 3–4 months later, these values decreased by approximately a factor of two and remained low until 2023, when an increase began. Given the lack of data between June 2022 and January 2023, it is possible that the rise in emission fluxes started earlier.
During the active phase (April–May 2020), emission lines of [FeVII] 6087Å appeared in the galaxy’s spectrum. The mechanisms of coronal line formation and the sources of their origin are discussed in several works, e.g., [26,27,31]. The formation of coronal lines may indicate a hardening of the SED in the X-ray region. A Tidal Disruption Event or an Extreme Coronal Line Emission may also explain the sudden appearance of coronal lines. Another possibility is the weakening of the central continuum, allowing the observation of weak emission lines like [FeVII] [27].
The black hole mass was estimated using the formulas from Greene [32]. A moderate-resolution spectrum obtained on 20 April 2020, was used, in which the broad components of the hydrogen lines were identified. Based on the luminosity and FWHM of the broad components of the H and H lines, we obtained estimates of the black hole mass: , , respectively. This is in agreement with the estimation by other authors [33,34]. The uncertainties in the derived values are mainly due to the low intensity of the broad components.
Despite the rather large volume of photometric data, the low cadence does not allow obtaining accurate estimates of time delays. Comparison of the curves obtained in the B and V filters gives Lag values of about zero for the periods 2014–2019 and 2020–2025.
It is worth mentioning that this study presents the selection of models solely within the framework of debating the criteria for model selection. In the cases of noisy data and potentially the presence of instrumental noise, reliance solely on residual quality may result in inaccurate interpretations. We propose the utilization of the Bayesian factor as a model selection criterion. The findings demonstrate its efficacy in discerning suitable models where residual quality alone may prove inadequate.
5. Conclusions
This paper presents the results of new spectral and photometric observations of NGC 3516, performed with the FAI and ShAO telescopes in 2020–2023 and 2014–2025, respectively. The photometric data cover the brightness increases of the galaxy in 2016 and 2019–2020. A new active phase began in 2021, and at the end of our observations in 2025, the brightness of the galaxy reached the values recorded during the outburst of 2016. Analysis of our data and the results of other observations showed that the color index decreases with increasing brightness; i.e., the brighter the galaxy, the bluer it is.
The fluxes in specific lines and the optical continuum had maximum values in 2020, shortly after the X-ray flash. The next increase in emission fluxes was recorded in mid-2023. The main interest of spectral studies is the characteristics of the broad components of the emission lines and their variation. The procedure for separating the hydrogen line profiles into components was performed only for one spectrum from 20 April 2020. (The rest spectra were obtained with low dispersion). Model calculations were carried out to approximate the profiles of the broad components H and H; variants of 2- and 3-component systems were considered.
In the future, we plan to conduct spectral and photometric observations synchronously and to obtain spectra with better spectral resolution for a detailed study of the broad components of hydrogen lines. This will allow us to determine the sizes of BLR zones and to study their changes.
Author Contributions
Conceptualization, methodology and visualization, S.S. and A.S.; software, A.S.; validation, L.A.; formal analysis, L.K. and Y.A.; investigation, S.S. and L.K.; resources, V.K., N.H. and S.R.; data curation, S.S. and L.A.; writing—original draft preparation, review and editing, S.S., A.S. and L.K.; supervision, project administration and funding acquisition, S.S. All authors have read and agreed to the published version of the manuscript.
Funding
This research is funded by the Ministry of Science and Higher Education of the Republic of Kazakhstan (Grant No. AP22784884 and Grant No. BR24992759).
Informed Consent Statement
Not applicable.
Data Availability Statement
Research data can be provided upon reasonable request.
Acknowledgments
The authors express their gratitude to the SHAO team and the FAI observers for their assistance in organizing and conducting the spectral and photometric observations.
Conflicts of Interest
The authors declare no conflicts of interest. The funders had no role in the design of the study, in the collection, analyses or interpretation of data, in the writing of the manuscript or in the decision to publish the results.
Appendix A. Theoretical Background for Bayesian Analysis
Recall that the task in the Bayesian approach is formulated as follows. Given observational data (D) and a model with free parameters (), Bayes’ theorem is stated as:
where the likelihood function is determined by the observed data, and the prior information about the parameters and what we already know about the model’s parameters is given by the probability distribution function . Often, is specified as a uniform distribution over a specific range of values, though in some cases, it is set as a normal distribution centered around a most likely value.
The greatest difficulty in obtaining absolute values of comes from the parameter , Bayesian evidence, which defines the probability distribution of obtaining the observed data across the entire parameter space , which is
which is often not possible. In the case where is specified as a uniform distribution over the entire parameter space and we assume that , we obtain
which automatically leads us to the standard least squares method if the likelihood function is a normal distribution.
The selection of the most “plausible” model between model 0 and model 1 is based on the Bayesian factor:
or, equivalently:
There is a Jeffreys scale on which the preference for one model (0) over another (1) is evaluated. It is generally accepted that if , the decision is inconclusive, and the models are essentially equivalent. If , there is significant preference for model 0; if model 0 is clearly preferable to model 1; and if , model 0 should definitely be chosen as the priority over model 1.
Note
| 1 | https://ned.ipac.caltech.edu (Access date: 6 November 2024). |
References
- Andrillat, Y.; Souffrin, S. Variations du Spectre du Noyau de la Galaxie de Seyfert NGC 3516. Astrophys. Lett. 1968, 1, 111–119. [Google Scholar]
- Shapovalova, A.I.; Popovic, L.C.; Afanasiev, V.L.; Ilic, D.; Kovacevic, A.; Burenko, A.N.; Chavushyan, V.H.; Marčeta-Mandić, S.; Spiridonova, O.; Valdes, J.R.; et al. Long-term optical spectral monitoring of a changing-look active galactic nucleus NGC 3516—I. Continuum and broad-line flux variability. Mon. Not. R. Astron. Soc. 2014, 485, 4790–4803. [Google Scholar] [CrossRef]
- Cherepashchuk, A.M.; Lyutyi, V.M. Rapid Variations of Halpha Intensity in the Nuclei of Seyfert Galaxies NGC 4151, 3516, 1068. Astrophys. Lett. 1973, 13, 165. [Google Scholar]
- De Rosa, G.; Fausnaugh, M.M.; Grier, C.J.; Peterson, B.M.; Denney, K.D.; Horne, K.; Bentz, M.C.; Ciroi, S.; Dalla Bontà, E.; Joner, M.D.; et al. Velocity-resolved Reverberation Mapping of Five Bright Seyfert 1 Galaxies. ApJ 2018, 866, 133. [Google Scholar] [CrossRef]
- Denney, K.D.; Peterson, B.M.; Pogge, R.W.; Adair, A.; Atlee, D.W.; Au-Yong, K.; Bentz, M.C.; Bird, J.C.; Brokofsky, D.J.; Chisholm, E.; et al. Diverse Kinematic Signatures from Reverberation Mapping of the Broad-Line Region in AGNs. Astrophys. J. 2009, 704. [Google Scholar] [CrossRef]
- Ilic, D.; Oknyansky, V.; Popovic, L.; Tsygankov, S.; Belinski, A.; Tatarnikov, A.M.; Dodin, A.V.; Shatsky, N.I.; Ikonnikova, N.P.; Rakić, N.; et al. A flare in the optical spotted in the changing-look Seyfert NGC 3516. Astron. Astrophys. 2020, 638, 7. [Google Scholar] [CrossRef]
- Popovic, L.; Ilic, D.; Burenkov, A.; Alvarez, V.M.P.; Marčeta-Mandić, S.; Kovačević-Dojčinović, J.; Shablovinskaya, E.; Kovačević, A.B.; Marziani, P.; Chavushyan, V.; et al. Long-term optical spectral monitoring of a changing-look active galactic nucleus NGC 3516. II. Astron. Astrophys. 2020, 675, 14. [Google Scholar] [CrossRef]
- Kraemer, S.B.; Crenshaw, D.M.; George, I.M.; Netzer, H.; Turner, T.J.; Gabel, J.R. Variable Ultraviolet Absorption in the Seyfert 1 Galaxy NGC 3516: The Case for Associated Ultraviolet and X-Ray Absorption. Astrophys. J. 2002, 577, 98. [Google Scholar] [CrossRef]
- Mathur, S.; Wilkes, B.J.; Aldcroft, T. The X-Ray Warm Absorber in NGC 3516. Astrophys. J. 1997, 478, 182. [Google Scholar] [CrossRef]
- Turner, T.J.; Kraemer, S.B.; George, I.M.; Reeves, J.N.; Bottorff, M.C. Complex X-Ray Absorption and the Fe Kα Profile in NGC 3516. Astrophys. J. 2005, 618, 155. [Google Scholar] [CrossRef]
- Ilić, D.; Popović, L.; Burenkov, A.; Shablovinskaya, E.M.E.U.R.; Moiseev, A.; Oparin, D.; Patiño Álvarez, V.; Chavushyan, V.; Marziani, P. Long-Term Optical Monitoring of Broad-Line AGNs (LoTerm AGN): Case Study of NGC 3516. Physics 2024, 6, 3. [Google Scholar] [CrossRef]
- Blandford, R.D.; McKee, C.F. Reverberation mapping of the emission line regions of Seyfert galaxies and quasars. Astrophys. J. 1982, 255, 419–439. [Google Scholar] [CrossRef]
- Urry, C.M.; Padovani, P. Unified Schemes for Radio-Loud Active Galactic Nuclei. Astron. Soc. Pac. 1995, 107, 803. [Google Scholar] [CrossRef]
- Mehdipour, M.; Kriss, G.A.; Brenneman, L.W.; Costantini, E.; Kaastra, J.S.; Branduardi-Raymont, G.; Di Gesu, L.; Ebrero, J.; Mao, J. Changing-look Event in NGC 3516: Continuum or Obscuration Variability? Astrophys. J. 2022, 925, 84. [Google Scholar] [CrossRef]
- Astronomical Imaging Software. Available online: https://diffractionlimited.com/product/maxim-dl/ (accessed on 6 November 2024).
- Doroshenko, V.; Sergeev, S.; Merkulova, N.I.; Sergeeva, E.A.; Golubinsky, Y.V.; Pronik, V.I. BVRI CCD Photometry of Comparison Stars in the Fields of 44 Active Galaxies. Astron. Soc. Pac. 2007, 360, 69. [Google Scholar]
- Shomshekova, S.A.; Reva, I.V.; Kondratyeva, L. Standardization of the photometric system of the 1-meter telescope on TSHAO. Natl. Acad. Sci. Repub. Kazakhstan-Phys.-Math. Ser. 2017, 4, 155–161. [Google Scholar]
- Fitzpatrick, M.; Placco, V.; Bolton, A.; Merino, B.; Ridgway, S.; Stanghellini, L. Modernizing IRAF to Support Gemini Data Reduction. arXiv 2024, arXiv:2401.01982. [Google Scholar] [CrossRef]
- Kharitonov, A.V.; Tereshchenko, V.; Knyazeva, L.N. Spectrophotometric Catalog of Stars, 3rd ed.; Kazakh University: Kazakhstan, Almaty, 2011; ISBN 9965-29-626-X. [Google Scholar]
- Schlafly, E.F.; Finkbeiner, D.P. Measuring Reddening with Sloan Digital Sky Survey Stellar Spectra and Recalibrating Sfd. Astrophys. J. 2011, 737, 103. [Google Scholar] [CrossRef]
- Speagle, J. Dynesty: A dynamic nested sampling package for estimating Bayesian posteriors and evidences. Mon. Not. R. Astron. Soc. 2020, 493, 3132–3158. [Google Scholar] [CrossRef]
- Koposov, S.; Speagle, J.; Barbary, K.; Ashton, G.; Bennett, E.; Buchner, J.; Scheffler, C.; Cook, B.; Talbot, C.; Guillochon, J.; et al. DYNESTY. 2023. Available online: https://zenodo.org/records/8408702 (accessed on 6 November 2024).
- Oknyansky, V.; Mikailov, K.; Huseynov, N. Changing Looks of the Nucleus of Seyfert Galaxy NGC 3516 during 2016–2020. Astron. Rep. 2020, 64, 979–984. [Google Scholar] [CrossRef]
- Oknyansky, V.L.; Brotherton, M.S.; Tsygankov, S.S.; Dodin, A.V.; Bao, D.W.; Zhao, B.X.; Du, P.; Burlak, M.A.; Ikonnikova, N.P.; Tatarnikov, A.M.; et al. Multi-Wavelength Monitoring and Reverberation Mapping of a Changing Look Event in the Seyfert Galaxy NGC 3516. Mon. Not. R. Astron. Soc. 2021, 505, 1029–1045. [Google Scholar] [CrossRef]
- Cann, J.M.; Satyapal, S.; Abel, N.P.; Ricci, C.; Secrest, N.J.; Blecha, L.; Gliozzi, M. The Hunt for Intermediate-mass Black Holes in the JWST Era. Astrophys. J. 2018, 861, 142. [Google Scholar] [CrossRef]
- Rodriguez-Ardila, A.; May, D.; Panda, S.; Fonseca-Faria, M.A.; Fraga, L. The narrow-line region properties of ESO 138-G001 unveiled by SOAR/SIFS observations. Mon. Not. R. Astron. Soc. 2024, 527, 10649–10667. [Google Scholar] [CrossRef]
- Callow, J.; Graur, O.; Clark, P.; Palmese, A.; Aguilar, J.; Ahlen, S.; BenZvi, S.; Brooks, D.; Claybaugh, T.; Macorra, A.d.; et al. The rate of extreme coronal line emitting galaxies in the Sloan Digital Sky Survey and their relation to tidal disruption events. Mon. Not. R. Astron. Soc. 2024, 535, 1095–1122. [Google Scholar] [CrossRef]
- Bentz, M.C.; Denney, K.D.; Grier, C.J.; Barth, A.J.; Peterson, B.M.; Vestergaard, M.; Bennert, V.N.; Canalizo, G.; Rosa, G.D.; Filippenko, A.V.; et al. The low-luminosity end of the radius-luminosity relationship for active galactic nuclei. Astrophys. J. 2013, 767, 149. [Google Scholar] [CrossRef]
- Cid Fernandes, R.; Mateus, A.; Sodré, L.; Stasińska, G.; Gomes, J.M. Semi-empirical analysis of Sloan Digital Sky Survey galaxies—I. Spectral synthesis method. Mon. Not. R. Astron. Soc. 2005, 358, 363–378. [Google Scholar] [CrossRef]
- Lusso, E.; Fotopoulou, S.; Selwood, M.; Allevato, V.; Calderone, G.; Mancini, C.; Mignoli, M.; Scodeggio, M.; Bisigello, L.; Feltre, A.; et al. Euclid preparation—XXXVIII. Spectroscopy of active galactic nuclei with NISP Euclid Collaboration. Astron. Astrophys. 2024, 685, A108. [Google Scholar] [CrossRef]
- Prieto, A.; Rodriguez-Ardila, A.; Panda, S.; Marinello, M. Erratum: A novel black hole mass scaling relation based on coronal gas, and its dependence with the accretion disc. Mon. Not. R. Astron. Soc. 2022, 511, 4444–4446. [Google Scholar] [CrossRef]
- Greene, J.E.; Ho, L.C. Estimating Black Hole Masses in Active Galaxies Using the H α Emission Line. Astrophys. J. 2005, 630, 122–129. [Google Scholar] [CrossRef]
- Feng, H.C.; Hu, C.; Li, S.S.; Liu, H.T.; Bai, J.M.; Xing, L.F.; Wang, W.Y.; Yang, Z.X.; Xiao, M.; Lu, K.X. Reverberation Mapping of Changing-look Active Galactic Nucleus NGC 3516. Astrophys. J. 2021, 909, 18. [Google Scholar] [CrossRef]
- Koss, M.J.; Ricci, C.; Trakhtenbrot, B.; Oh, K.; den Brok, J.S.; Mejía Restrepo, J.E.; Stern, D.; Privon, G.C.; Treister, E.; Powell, M.C.; et al. BASS. XXII. The BASS DR2 AGN Catalog and Data. Astrophys. J. Suppl. Ser. 2022, 261, 2. [Google Scholar] [CrossRef]
Disclaimer/Publisher’s Note: The statements, opinions and data contained in all publications are solely those of the individual author(s) and contributor(s) and not of MDPI and/or the editor(s). MDPI and/or the editor(s) disclaim responsibility for any injury to people or property resulting from any ideas, methods, instructions or products referred to in the content. |
© 2025 by the authors. Licensee MDPI, Basel, Switzerland. This article is an open access article distributed under the terms and conditions of the Creative Commons Attribution (CC BY) license (https://creativecommons.org/licenses/by/4.0/).