Article

Slowly Rotating Peculiar Star BD00°1659 as a Benchmark for Stratification Studies in Ap/Bp Stars

Institute of Astronomy of Russain Academy of Sciences, Moscow 119017, Russia
*
Author to whom correspondence should be addressed.
Galaxies 2024, 12(5), 55; https://doi.org/10.3390/galaxies12050055
Submission received: 23 August 2024 / Revised: 19 September 2024 / Accepted: 22 September 2024 / Published: 25 September 2024

Abstract

:
We present the results of a self-consistent analysis of the magnetic silicon star BD+00°1659, based on its high-resolution spectra taken from the ESPaDOnS archive (R = 68,000). This narrow-lined star shows the typical high Si abundance and Si iiiii anomaly, making it an ideal prototype for investigating the vertical distribution of Si and Fe in the stellar atmosphere. The derived abundances, ranging from helium to lanthanides, confirm the star’s classification as a silicon Bp spectral type. Silicon and iron are represented by lines of different ionisation stages (Fe iiii, Si iiii), indicating an ionisation imbalance interpreted as evidence of atmospheric stratification. Our stratification analysis reveals that there is a jump in iron and silicon abundances of 1.5 dex at atmospheric layers with an optical depth of log τ 5000 = −0.85–−1.00. Non-LTE calculations for iron in this stratified atmosphere show minor non-LTE effects. Our results can be applied to studying the impact of stratification on the emergent flux in rapidly rotating Si stars with similar atmospheric parameters and abundance anomalies (for example, MX TrA), where direct stratification analysis is challenging due to line blending.

1. Introduction

Magnetic chemically peculiar (Ap) stars are characterised by the presence of global magnetic fields and atmospheric abundance anomalies, particularly an excess of Si, Cr, and rare-earth elements (REE) ranging from 1 to 4 dex above solar values. It is believed that the magnetic field suppresses mixing processes in the atmospheres of magnetic stars, thereby creating conditions favourable for element separation. Michaud [1] proposed that the observed abundance anomalies could be explained by the diffusion of atoms and ions due to the combined effects of gravitational settling and radiation levitation. When gravitational pressure is the dominant force, elements tend to settle into deeper layers of the atmosphere. When, in contrast, radiation pressure dominates, elements concentrate in the upper atmosphere. This element separation results in vertical abundance gradients, known as stratification, which are responsible for the observed abundance anomalies. Stratification alters the atmospheric structure through changes in line and continuum opacities, leading to differences in the observed energy distribution compared to chemically normal stars [2].
The observational evidence for stratification are: an impossibility to fit the wings and cores of strong lines with a single value of abundance; the dependence of abundances on the excitation potential of transition; and the abundance difference yielded by lines of different ions of the same element [3]. The latter effect was observed for silicon lines in the spectra of Bp and even normal stars and has been referred to as the “Si iiiii anomaly” [4]. While in normal stars the difference in Si iiiii abundances can be almost completely reduced by accounting for non-LTE effects [5], in Bp stars, it is usually larger and has been suggested to be a result of stratification effects. Although Ap/Bp stars statistically rotate slower than normal stars of the same spectral types, the number of suitable objects is severely limited even among this subgroup. Significant line blending which complicates studies of stratification appears for velocities above v e sin i ≈ 20 km s−1. Hence, it is of practical interest whether the stratification profile derived in slowly rotating objects can be applied for the analysis of faster ones.
BD+00°1659 is a magnetic chemically peculiar star located in the open cluster NGC 2301, in the Galactic plane [6]. It is classified as a B9 Si star in the catalogue [7]. Bailey and Landstreet [4] investigated BD+00°1659 among 16 more magnetic Bp stars with effective temperatures ranging from 11,000 to 15,000 K and different rotation velocities. These stars exhibit a silicon overabundance of up to 1–1.5 dex compared to the solar value and a discrepancy between the abundances derived from Si ii and Si iii lines, with the latter being approximately 1 dex higher. The dipole magnetic field of BD+00°1659 was estimated to be 1200 G [4], although four B z measurements over the period 2005–2008 [8] suggest that the magnetic field is weak. Its mean value of ∼300 G does not exceed significantly the measurement error of 100–130 G. Except for the pronounced “Si ii- iii anomaly” an important feature of the star is its low projection equatorial velocity v e sin i = 7 ± 1 km s−1 [4]. Therefore, we performed abundance and stratification analysis of BD+00°1659 and consider whether it can be used as a benchmark for stratification studies in other Ap/Bp stars in the close temperature range.
The paper is organised as follows. Section 2 provides information about observational data and codes used in our study. The abundance and stratification analysis is described in Section 3 and Section 4. Comparison of our results with those from the literature is given in Section 5. Conclusions are presented in Section 6.

2. Observations and Stellar Atmosphere Parameters

For our analysis, we used the high-resolution spectrum extracted from the ESPaDOnS spectrograph (Canada–France–Hawaii Telescope) archive1 covering the spectral range 3700–10,500 Å with resolving power R = 68,000 and signal-to-noise ratio S N R = 182 near 5500 Å (proposal ID—08AC09, UT Date—2008-03-28, PI—J. Landstreet). The spectrum was automatically processed and the wavelength calibrated with the Libre-ESpRIT package [9].
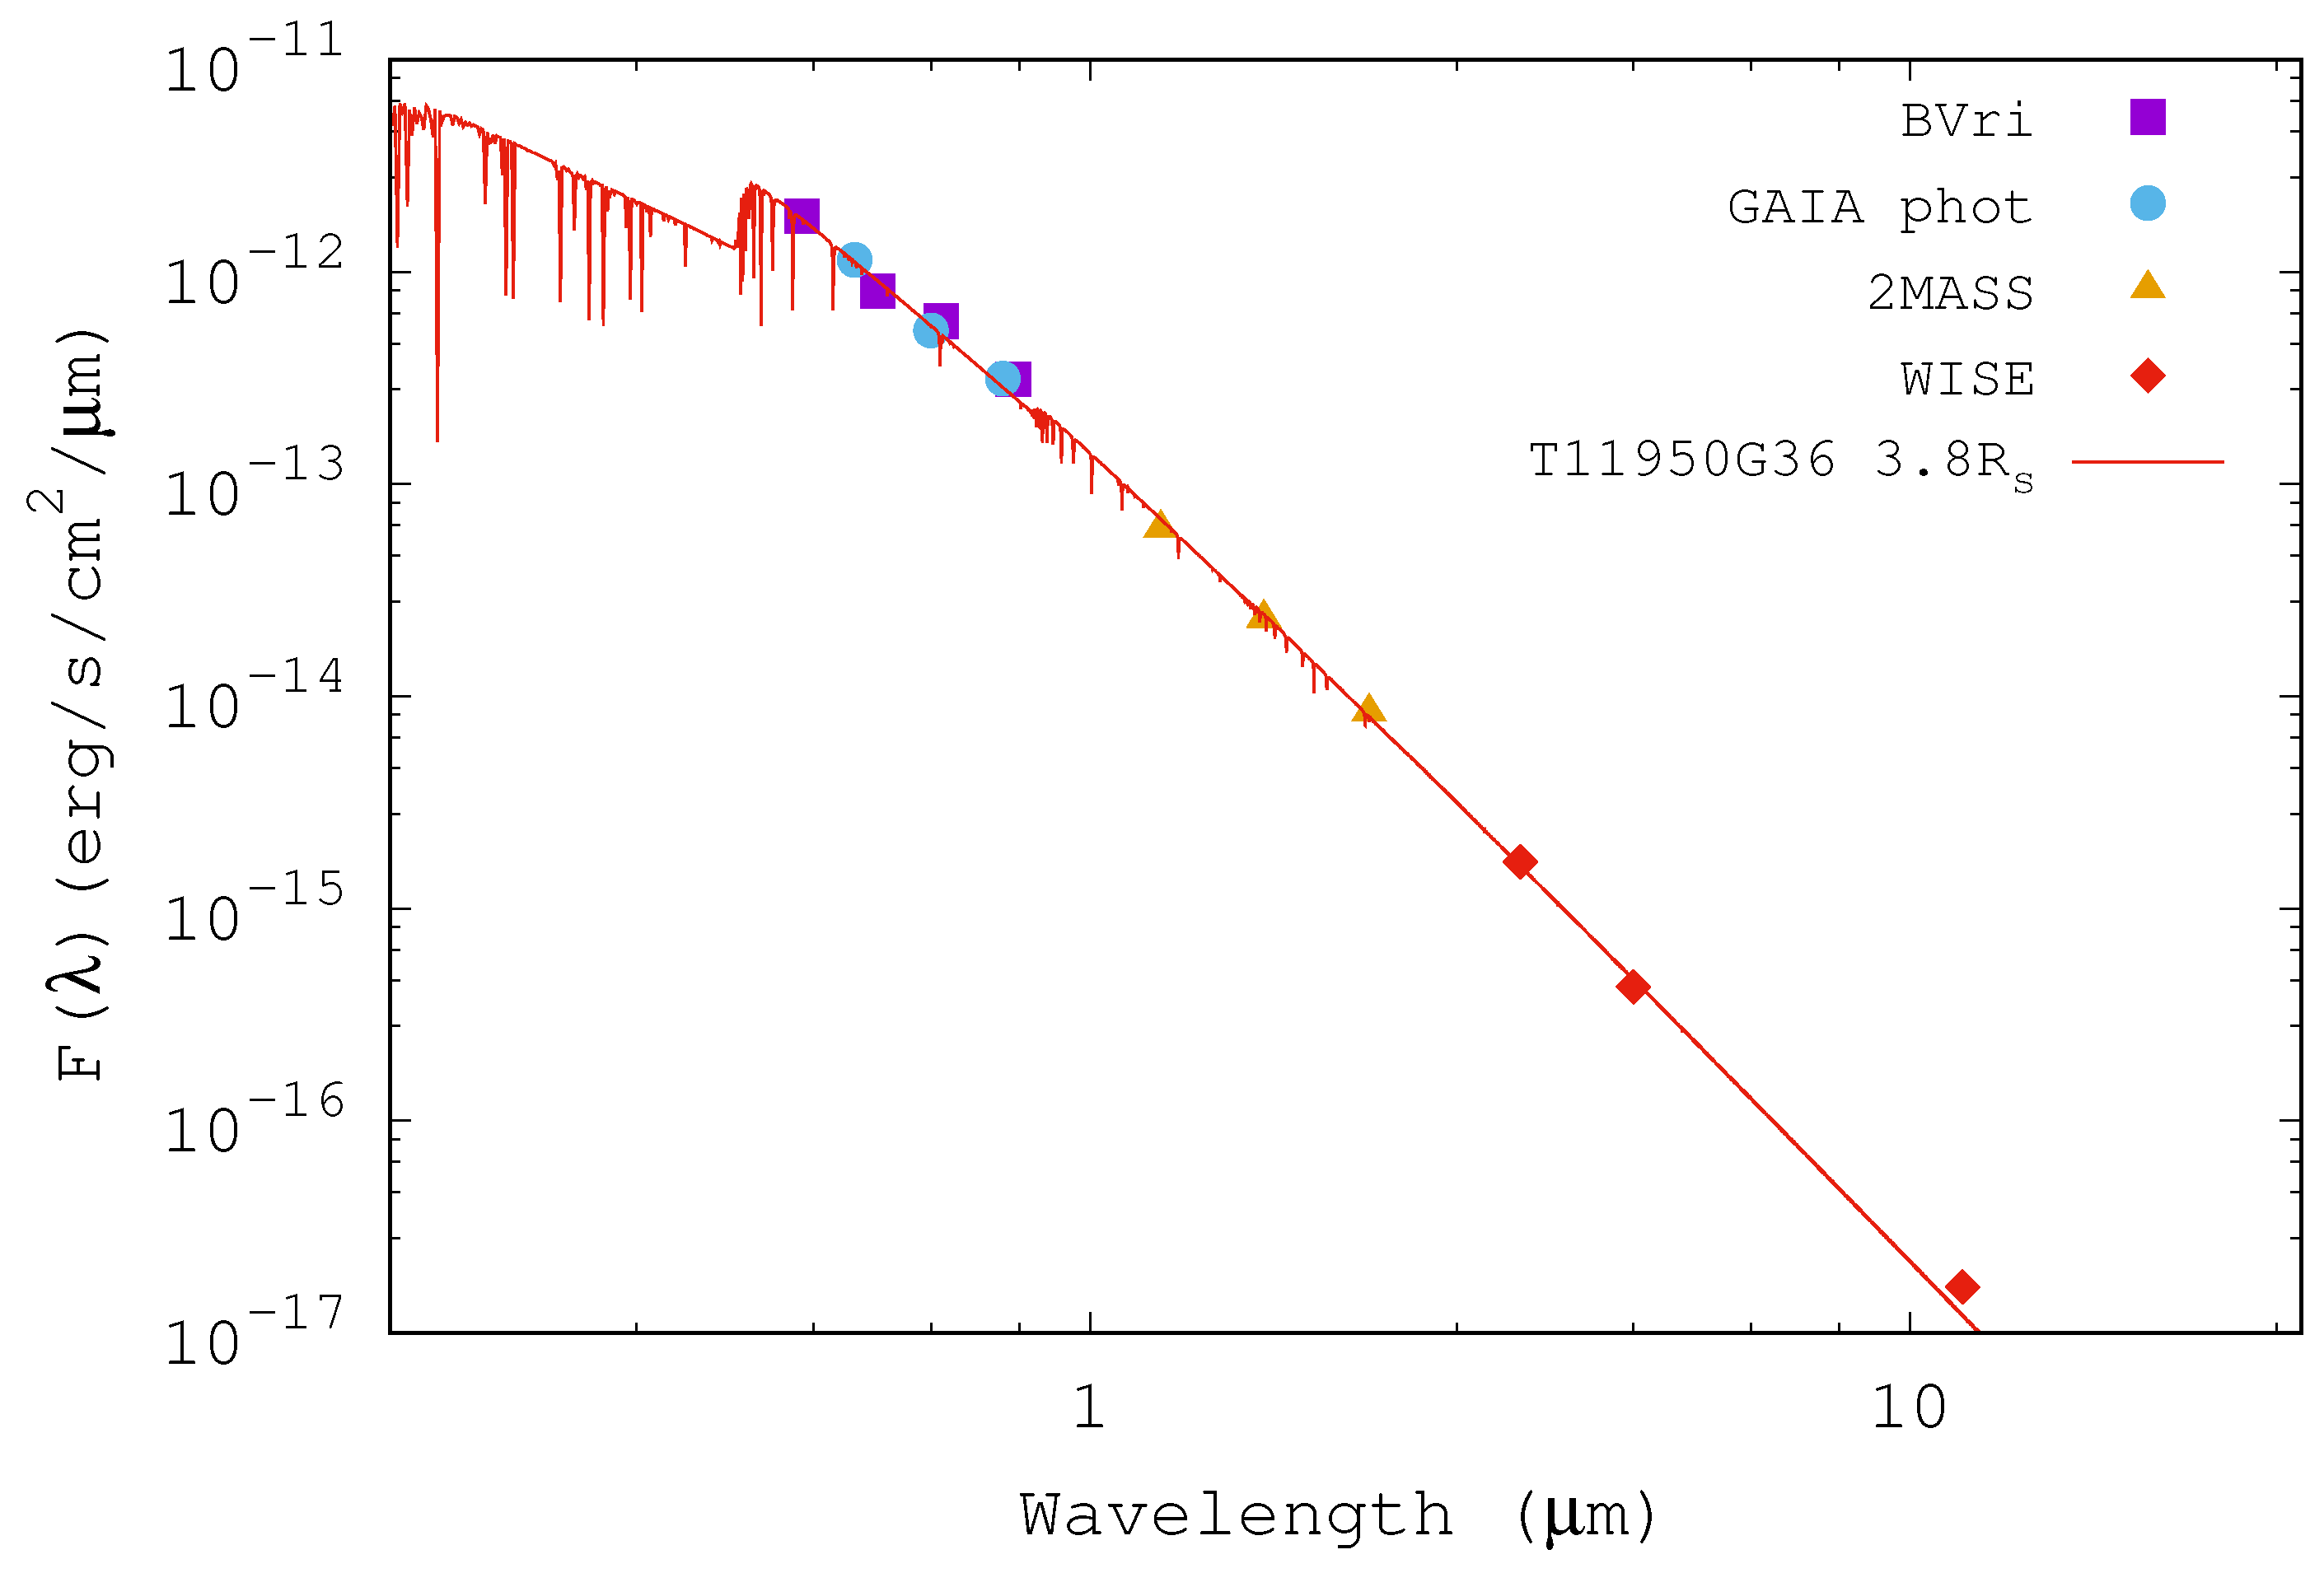
We performed atmospheric parameter determination using a self-consistent procedure based on spectral synthesis of Balmer lines profiles and spectral energy distribution (SED). Surprisingly, we found that BD+00°1659 appears to be a twin of a previously studied ApSi star MX TrA (HD 152564) [10]. The observed spectra of BD+00°1659 and MX TrA are nearly identical, particularly in the wavelength region around the hydrogen lines, when the observed spectrum of BD+00°1659 is broadened with the rotational velocity v e sin i = 69 km s−1 of MX TrA (see Figure 1a–c). The parameters of their atmospheres are: effective temperature T eff = 11,950 K, surface gravity log g = 3.6, and microturbulence V mic = 0 km s−1 (likewise in other magnetic Ap/Bp stars). Theoretical SED, calculated with these parameters and scaled for the radius of MX TrA from [10], align perfectly with the observational SED of BD+00°1659 (Figure 2). Photometric observations of BD+00°1659, collected via the Vizier-SED service,2 were corrected for interstellar reddening with E ( B V ) = 0.03 [11] using Fitzpatrick’s extinction curve [12]. The distance to the star, d = 864.38 pc, was adopted from [13]. Therefore, we used the pre-calculated model atmosphere of MX TrA from [10] ( T eff = 11,950 K and log g = 3.60. Hereafter: t11950g3.60) for the further analysis of BD+00°1659.
The surface magnetic field of the star was analysed using the Fe ii 6147.73 (Landé g-factor g L = 0.83) and 6149.25 Å ( g L = 1.35) lines, which are commonly used for magnetic field measurements. One more Fe ii line at 6432.68 Å ( g L = 1.83) was added. We computed the synthetic spectrum using the Synmast code [14] with zero radial B r and transversial B t components of the magnetic field vector and also allowing these components to vary. In the second case, we obtained a practically zero radial component and B t = 273 ± 198 G. Comparison of the spectral synthesis with single epoch observations used in our analysis revealed no signatures of magnetic line intensification exceeding the determination error. Therefore, subsequent synthetic spectrum calculations were performed using the nonmagnetic SynthVb code [15]. SynthVb enables calculating the synthetic spectrum either in the local thermodynamic equilibrium (LTE) or by accounting for departures from the LTE (non-LTE approach) via pre-computed departure coefficients (the ratio between non-LTE and LTE atomic level populations).

3. Abundance Analysis

The abundance for each spectral line was determined by fitting the synthetic line profile to the observed one using the BinMag visualization tool [16]. Atomic data were taken from VALD3 [17,18]. The non-LTE calculations are performed with a modified version of the DETAIL code [19,20] which includes the opacity package updated by Przybilla, Nieva, and Butler [21]. For this study, we updated the DETAIL code to enable accounting for chemical element stratification.
We determined abundances of 30 elements from He to Er. For Fe and Si, the abundances were obtained from the lines of the neutral atoms, and first and second ions. For other elements up to Ba, the abundances were obtained from the lines of the neutral atoms and first ions, and for the rare-earth elements, we used the lines of the first and second ions. Element abundances are given in a standard designation, log ε = log ( N el / N tot ) + 12.04, where Nel and Ntot are number densities of a given chemical element and total number of atoms, respectively. The full linelist with the line atomic parameters and individual line abundances is available online (see Data Availability Statement for details).
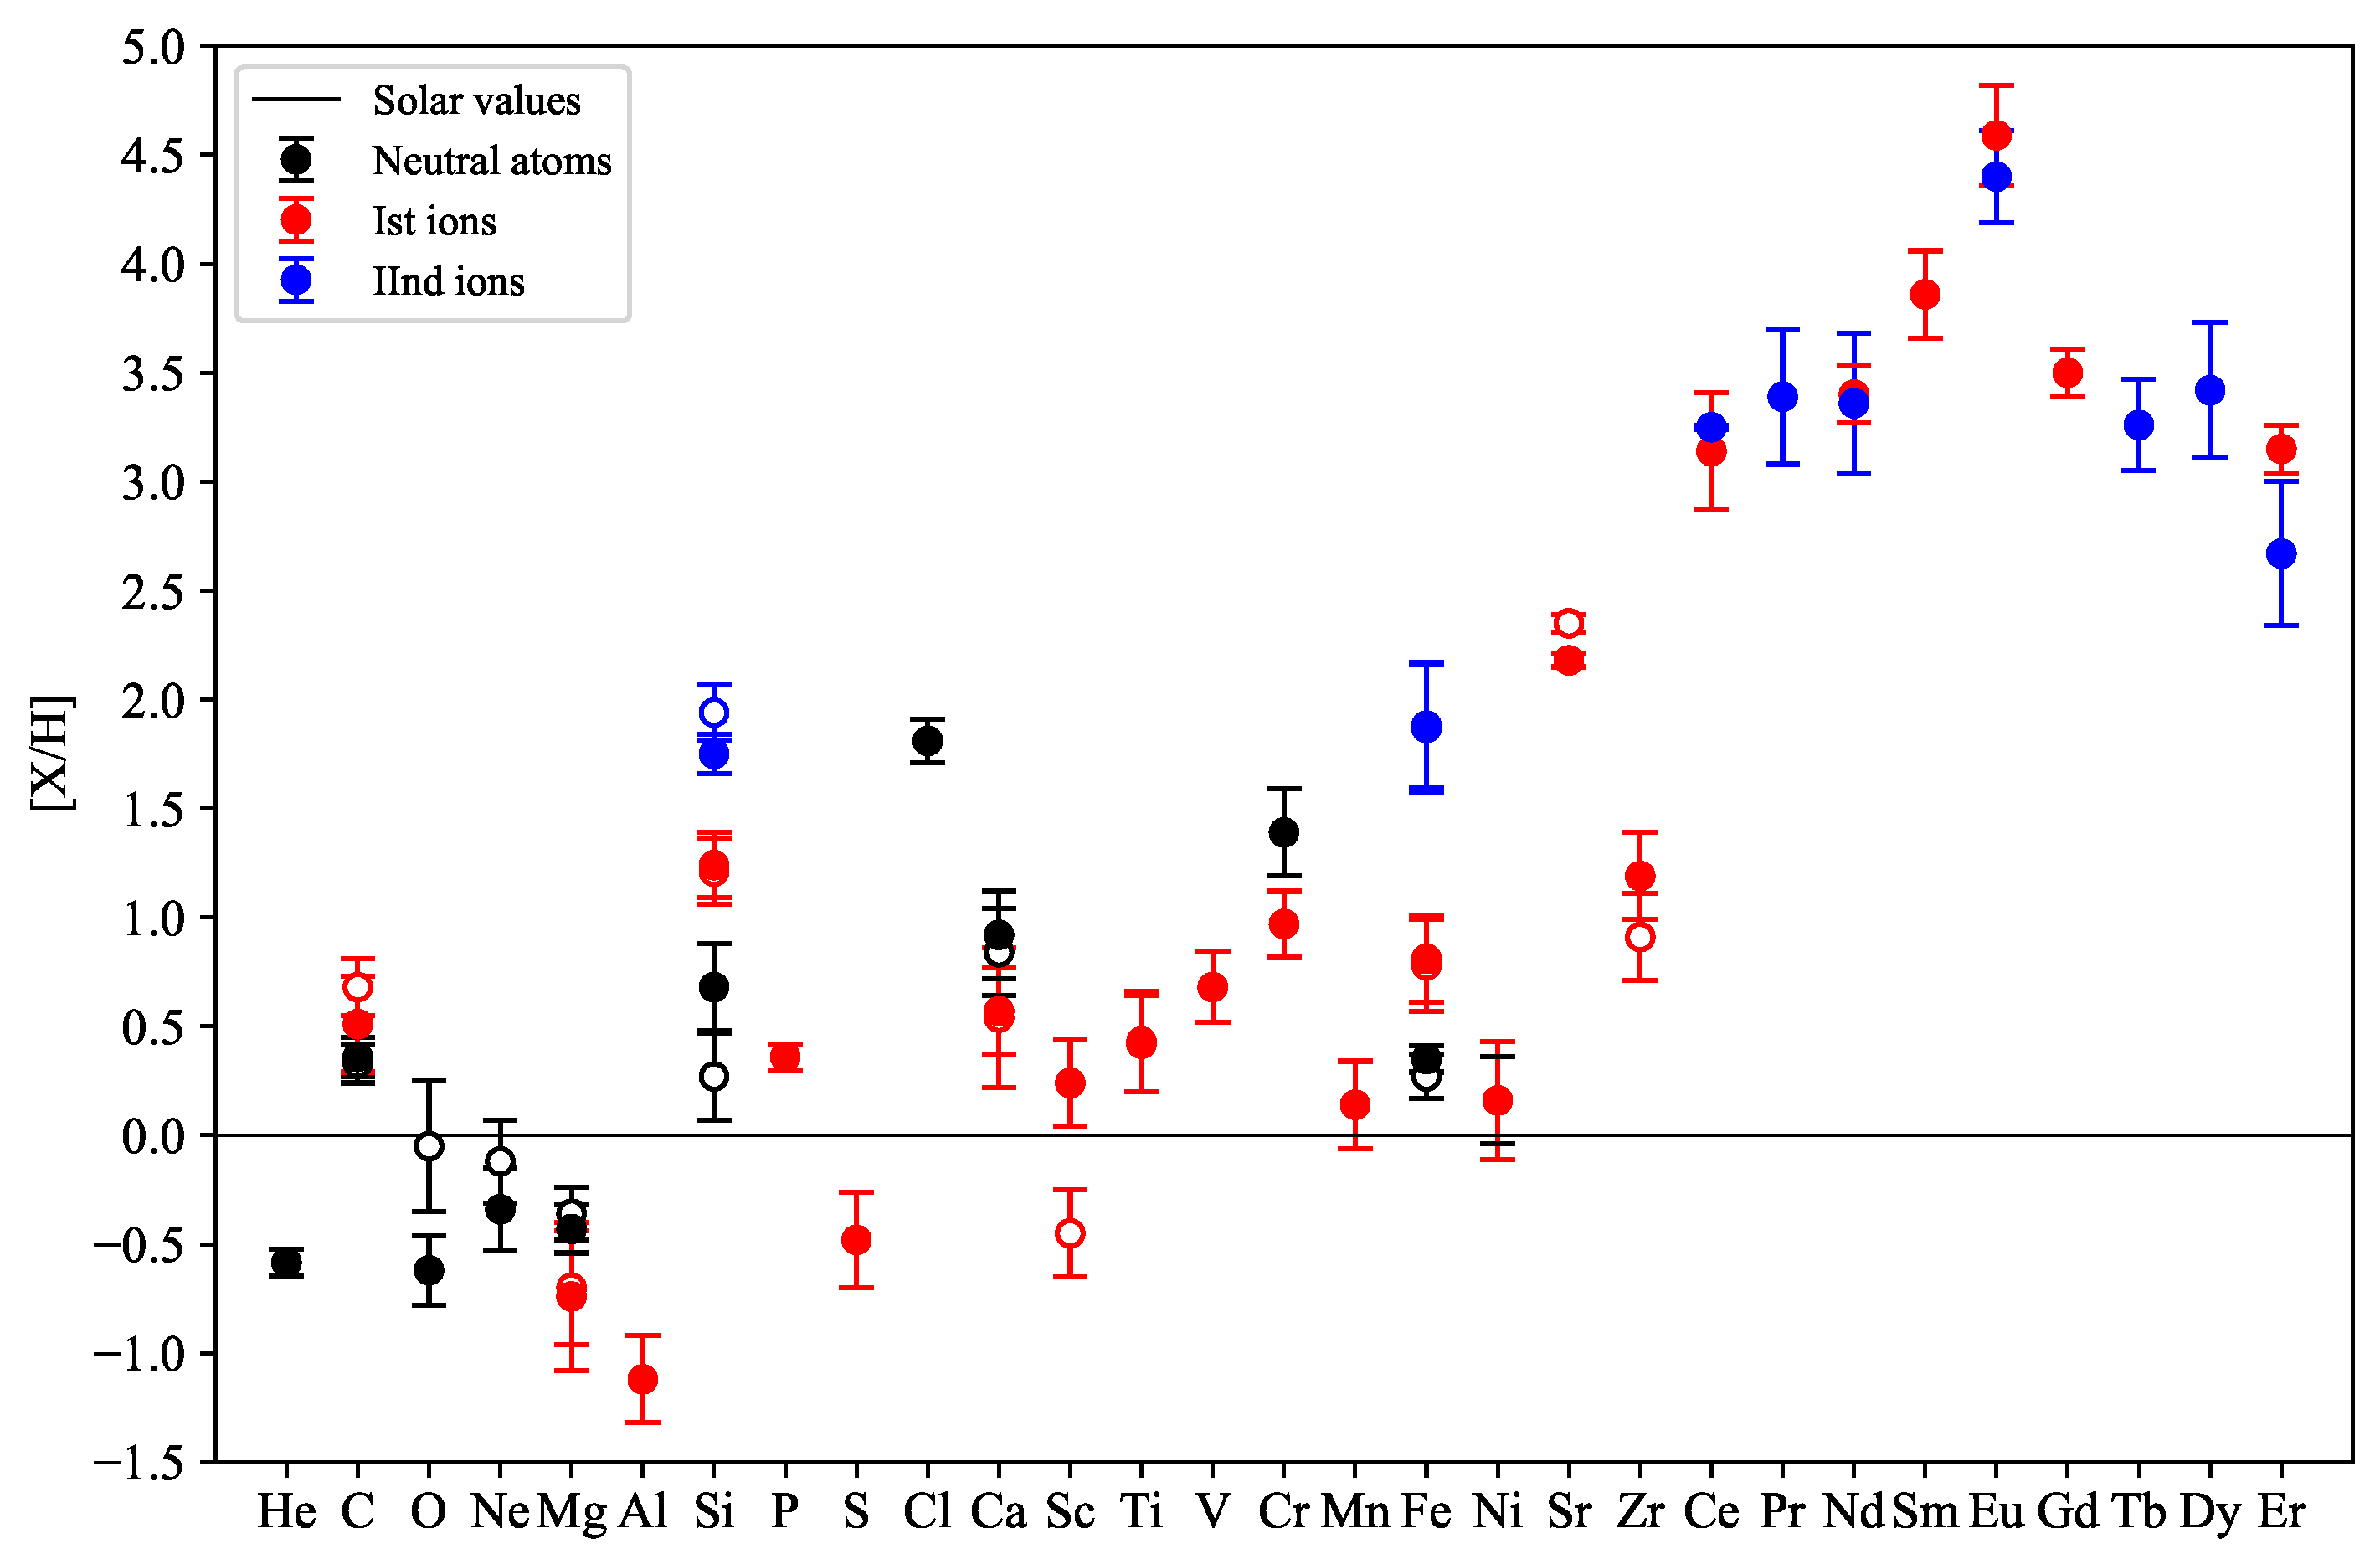
He, Al, V, P, S, Cr, Mn, Ni, and REE abundances are derived in LTE. For C, O, Ne, Na, Mg, Si, Ca, Sc, Ti, Sr, Zr, and Ba, we determine LTE and non-LTE abundances using model atoms described in [5,22,23,24,25,26,27,28,29,30]. Non-LTE calculations for Fe rely on a comprehensive Fe i- ii- iii model atom first introduced in Sitnova et al. [31]. The derived abundances of BD+00°1659 are presented in Table 1 and shown in Figure 3.
Figure 4 shows a comparison of the derived abundances in BD+00°1659 with those from [4] and with the abundances of its twin star MX TrA (t11950g3.60) from [10]. Comparisons are made using LTE results except for O i where non-LTE values are available. Dotted lines indicate an average ±0.15 dex uncertainty in abundance determination. Our LTE abundances well agree with those from [4]. An exception is Cr, where we used the updated oscillator strength values from [33]. Our abundances are consistent with those of MX TrA within the estimated uncertainty.
Although the predicted non-LTE corrections for Si and Fe reduce the abundance difference between lines of different ionisation stages, Si iiii and Fe iiii, this difference cannot be entirely removed. Therefore, we performed a stratification analysis for both elements.

4. Stratification Analysis

4.1. Stratification Analysis of BD+00°1659

In magnetic Ap/Bp stars, the violation of ionisation balance serves as evidence for abundance stratification [3]. Theoretical stratification models suggest that, as a first approximation, the vertical abundance distribution (stratification profile) can be represented by a step function [34]. This function is characterised by four parameters: the element abundances in the upper and lower atmospheric layers, the position of the abundance jump, and the width of this jump. These parameters are optimised to achieve the best fit with the observed profiles of spectral lines formed at different atmospheric layers.
The stratification analysis was performed with the IDL-based automated procedure DDaFit in conjunction with the Synth3 code [14]. A precise stratification analysis requires selecting unblended or minimally blended spectral lines of atoms/first/second ions with different intensities and excitation potentials E i . It is also crucial to choose spectral lines formed at different optical depths, particularly for Si, as the wings of strong Si ii lines form at similar depths to Si iii lines. Bailey and Landstreet [4] noted that a Si abundance jump of approximately 1 dex at log τ 5000 0.4 can reduce the observed Si ii/Si iii abundance difference to 0.3 dex. However, while a larger jump may remove the ionisation discrepancy, it does not allow fitting the wings of strong Si ii lines. This reason guided our choice of Si lines for the stratification study, where we used one strong line of Si ii at 4130.89 Å and three lines of Si iii. The Fe stratification analysis relies on four lines of Fe i, ten lines of Fe ii, and five lines of Fe iii.
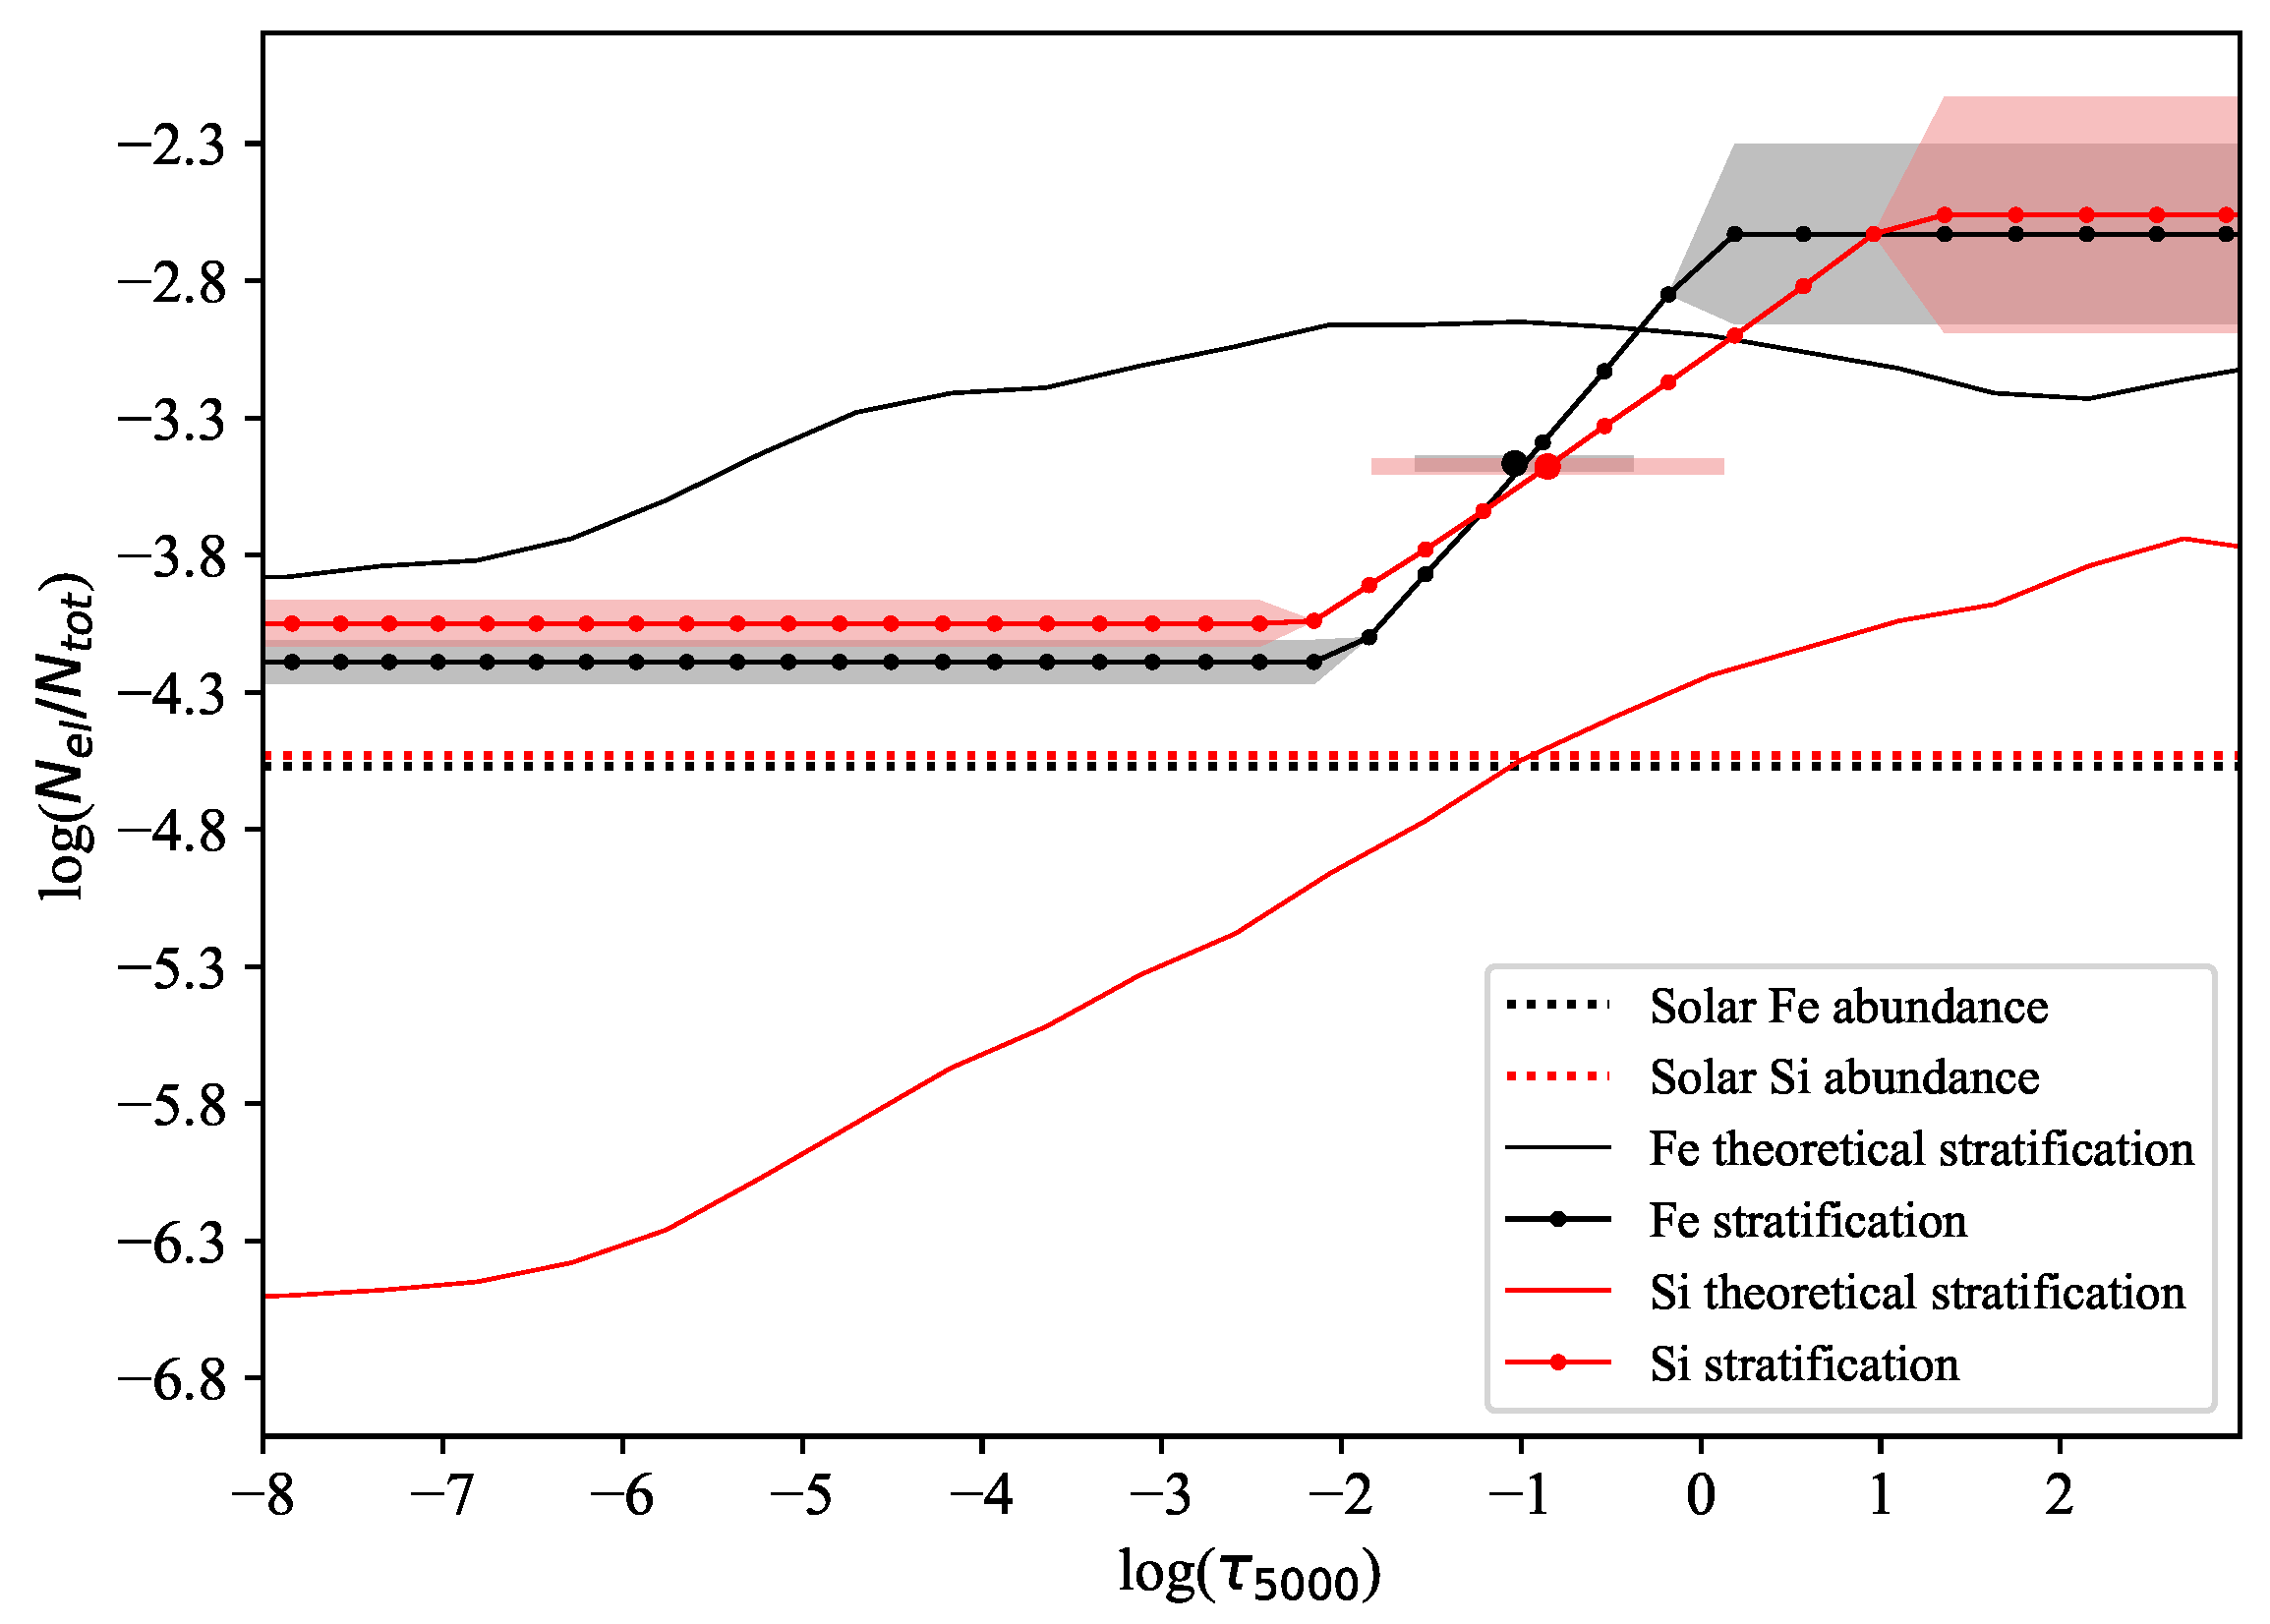
Figure 5 displays the calculated stratification profiles of Si and Fe in the stellar atmosphere. Figure 6a,b show the fitted line profiles calculated with a homogeneous element distribution and when accounting for stratification. The impact of stratification on the Fe i and Fe ii lines is minor, while stratification significantly improves the fitted Fe iii line profile. For Si, stratification provides a better fit to the observed line profiles compared to those calculated with a depth-independent abundance distribution.
Abundance jumps for both elements occur in atmospheric layers with an optical depth close to log τ 5000 = −1.0 (see Table 2). The derived Si stratification profile aligns with the theoretical Si diffusion calculations of [35], although the simple theory does not predict the large observed Si overabundance. For iron, the theoretical abundances in the upper and lower atmosphere are closer to the observed values, but the position of the theoretical jump is shifted to much higher atmospheric layers.
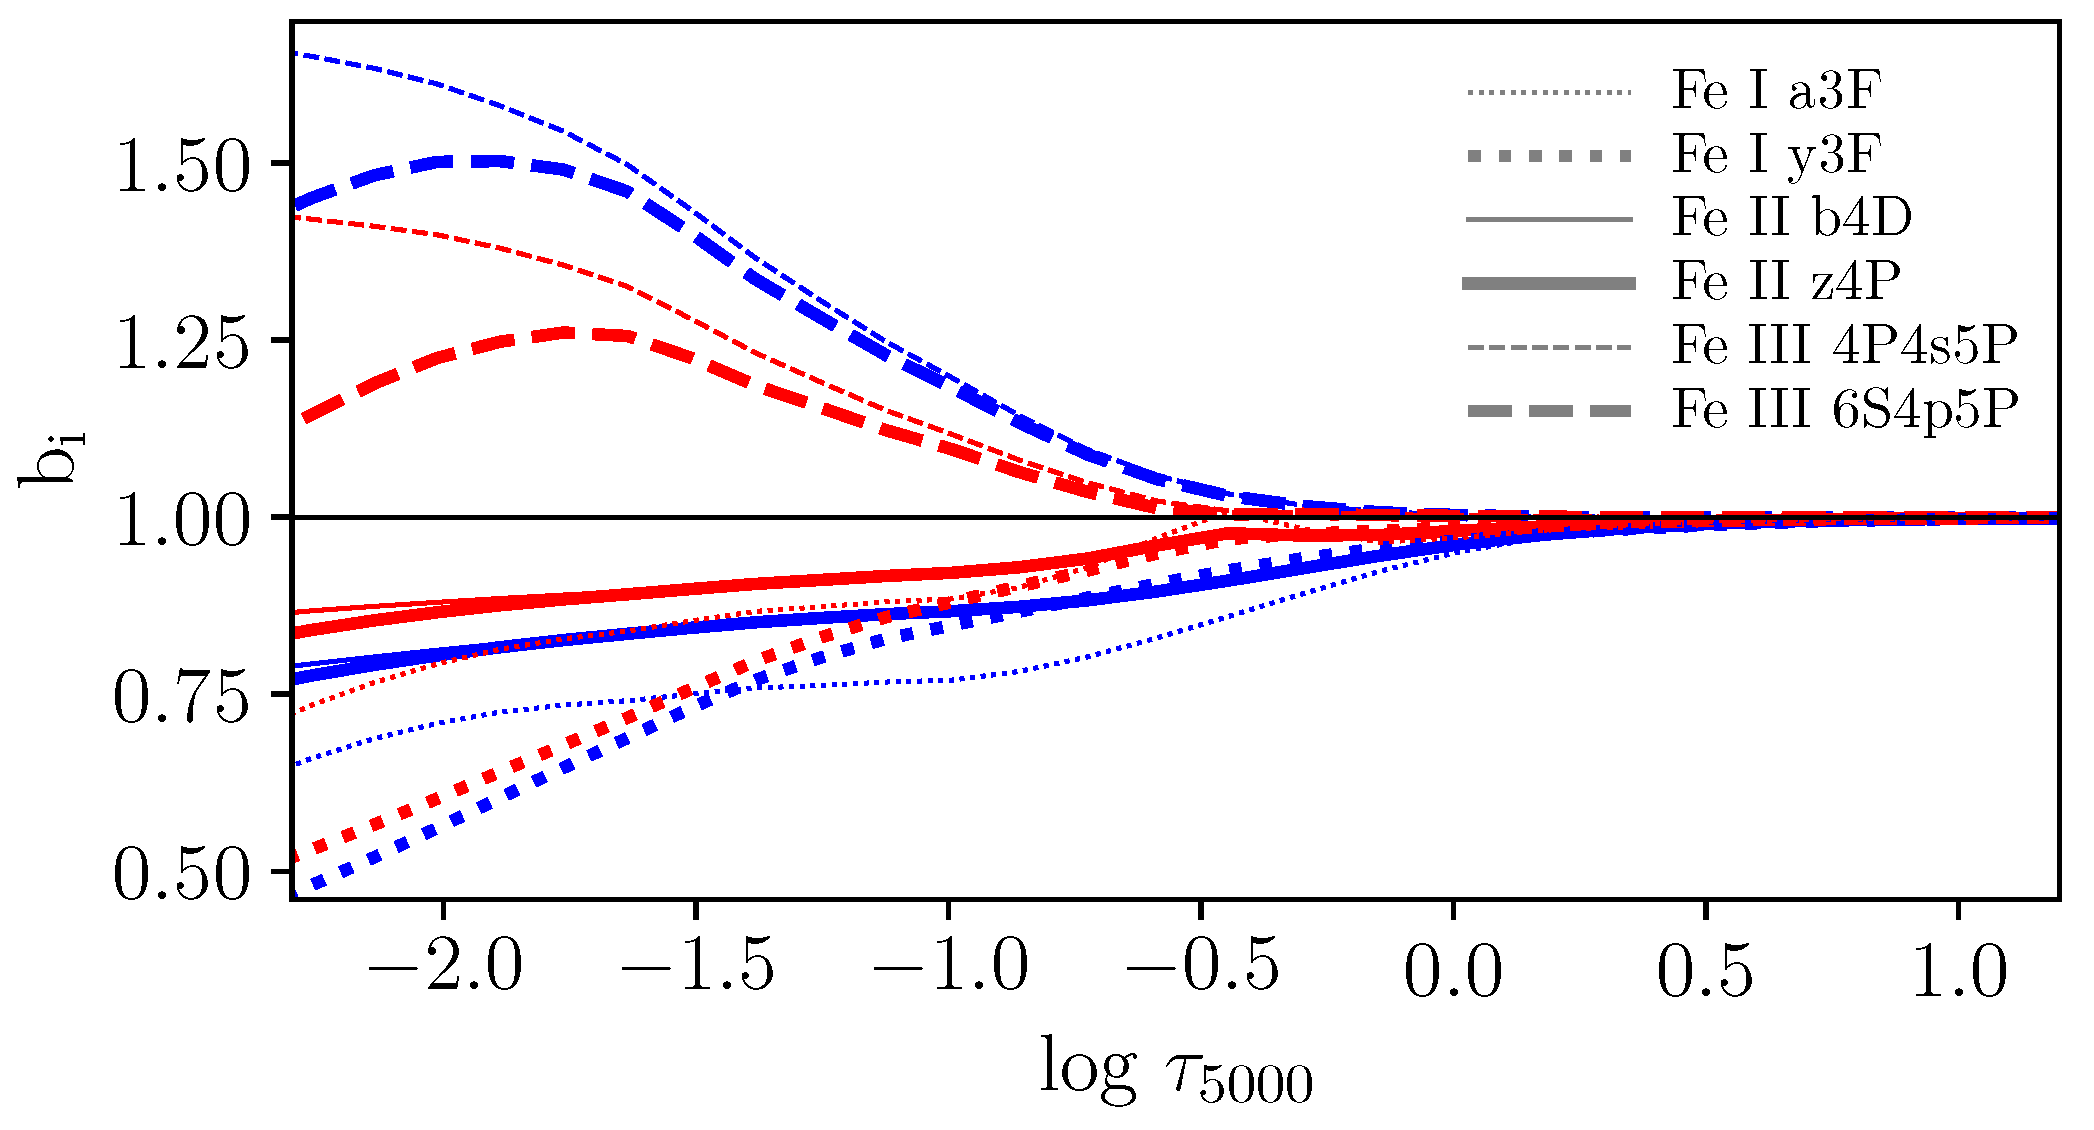
We estimated the impact of non-LTE effects on the abundance stratification for iron. Figure 7 shows the departure coefficients for selected levels of Fe i 4071 Å, Fe ii 6149 Å, and Fe iii 4431 Å in a stratified and homogeneous model atmosphere. We found non-LTE effects to be minor when accounting for stratification, and the departure coefficients show smaller deviations from unity compared to calculations that neglect stratification. As a result, the iron line profiles of Fe iiii ionisation stages, calculated with a stratified model atmosphere in LTE and non-LTE, practically coincide (see Figure 8). For iron and silicon, accounting for stratification shifts the formation depths of their spectral lines towards deeper atmospheric layers, where non-LTE effects are minor. Thus, in this study, we perform the abundance analysis of Si and Fe lines in LTE.
A horizontal magnetic field can impact elemental stratification in the upper atmosphere by reducing the effective diffusion coefficient of charged ions by a factor of two as the magnetic field strength increases [35]. However, since we assume a small (zero) magnetic field in BD+00°1659, the possible impact of the magnetic field on stratification was not considered.

4.2. Application of Stratification to MX TrA

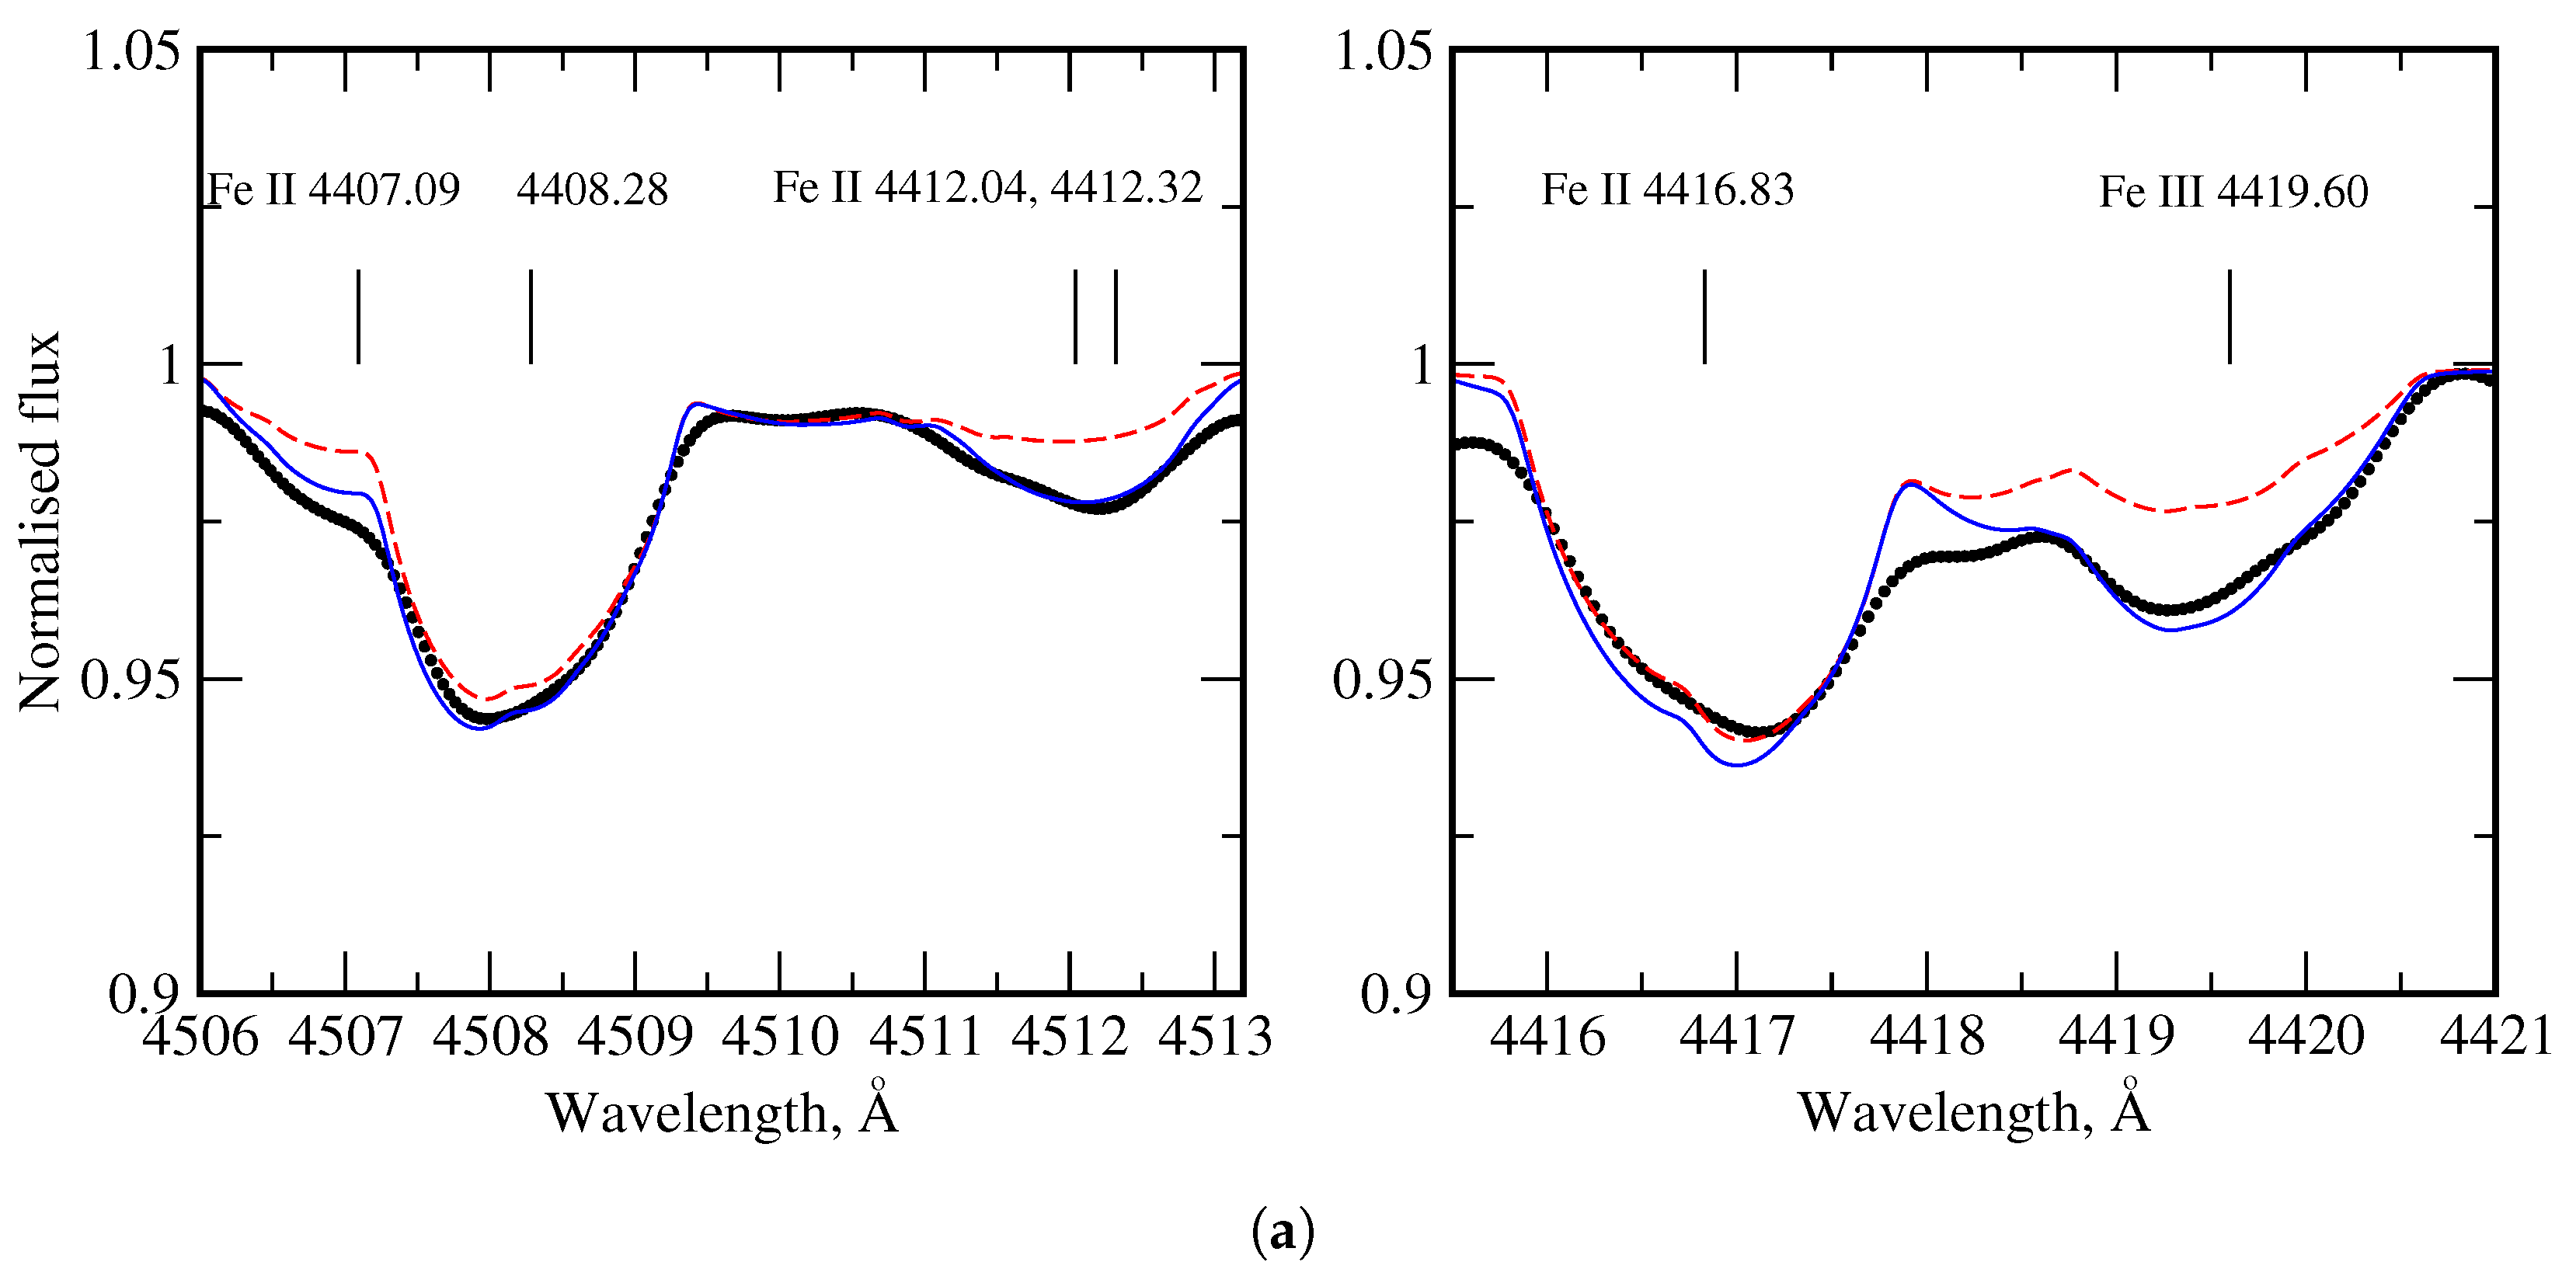
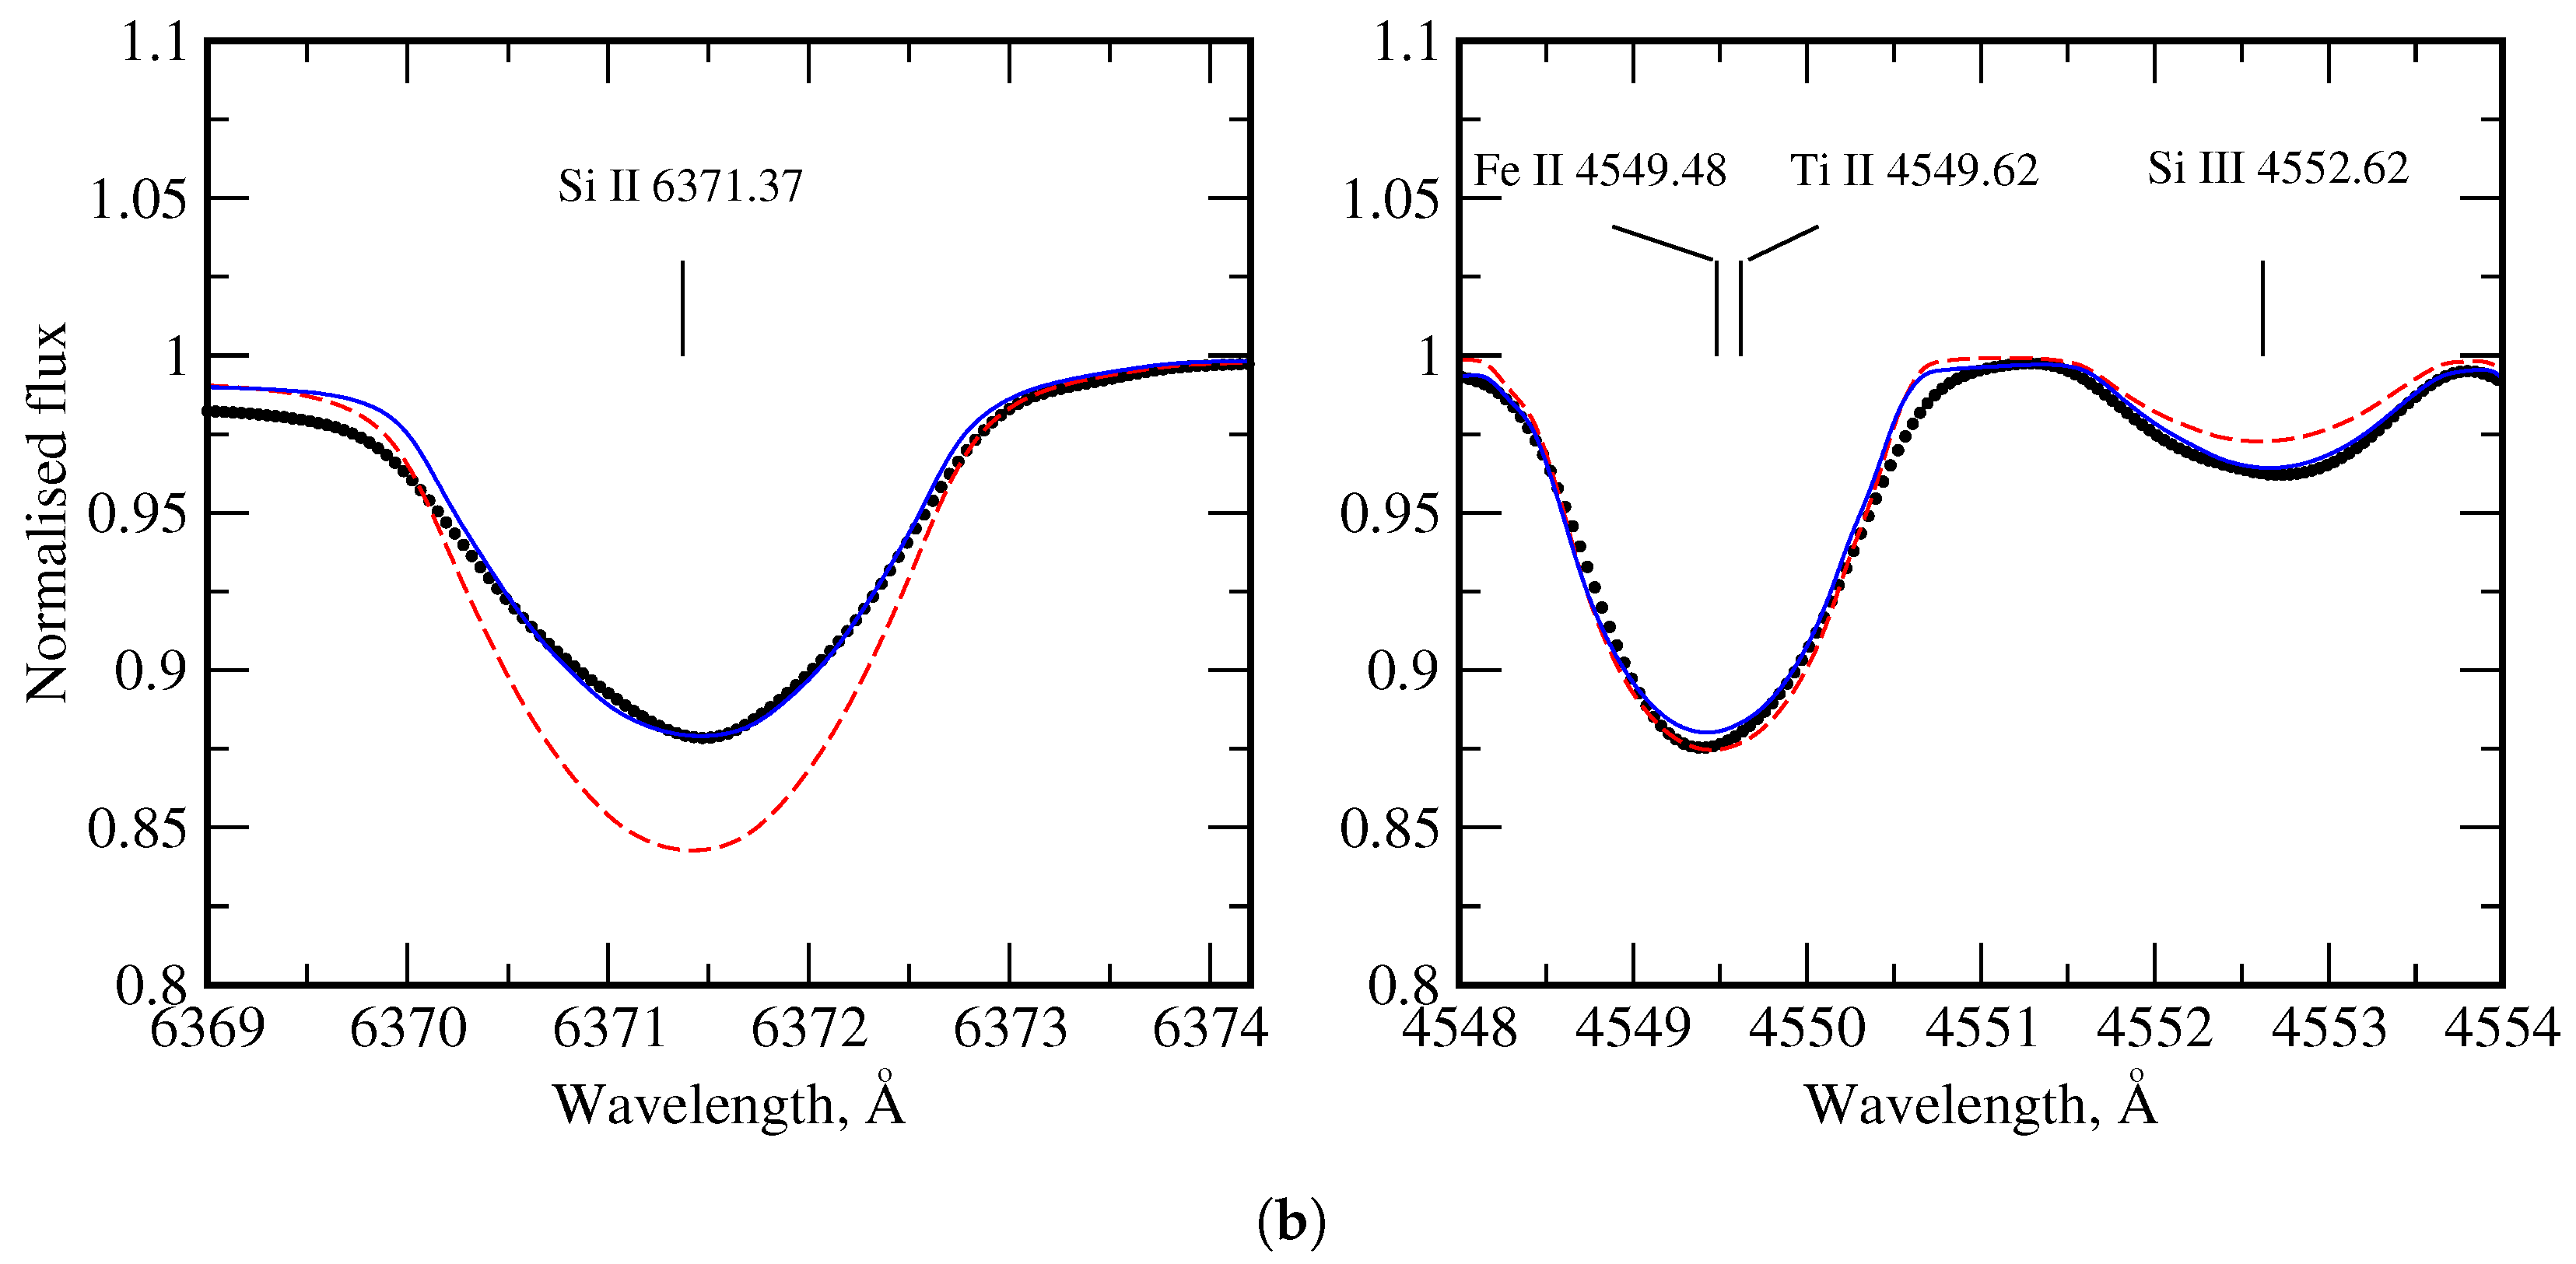
To check the possibility of spreading stratification results to Ap/Bp stars with faster rotation, we applied the derived Fe and Si vertical abundance distributions to the ApSi star MX TrA, which is shown to be a twin of BD+00°1659 (Section 2 and Section 3) and also possesses strong silicon overabundance and a Si iiiii ionisation imbalance in its atmosphere. Figure 9 illustrates the synthetic spectra calculated with the homogeneous and stratified model atmosphere t11950g3.60 fitted to the observed profiles of the selected Si iiiii, Fe iiiii lines in MX TrA. One can see that accounting for the BD+00°1659 stratification profile results in a much better fit of the selected lines in the MX TrA spectrum than in the case of a chemically homogeneous atmosphere.

5. Discussion

Our analysis revealed that BD+00°1659 is a representative member of the subgroup of chemically peculiar Ap/Bp stars with a chemically stratified atmosphere. We clearly showed that the spectra of two ApSi stars with close atmospheric parameters, slowly rotating BD+00°1659 and faster rotating MX TrA, are perfectly represented by one model with abundance stratification. In theory, stellar rotation should disrupt atmospheric stability due to meridional circulation and inhibit element diffusion. However, in the spectrum of another ApSi star, 56 Ari ( v e sin i = 160 km s−1), Fe and Si overabundances of the same order are observed: log ε F e = 7.9 and log ε S i = 8.5 [36]. This indicates that element diffusion may produce similar abundance distributions in ApSi stars regardless of their rotational velocity. We analysed a sample of 17 ApSi stars with rotational velocities ranging from 7 to 85 km s−1 [4] and found no clear correlation between Si overabundance or Si iiiii anomalies and v e sin i or between abundances and magnetic field strength. This is illustrated by Figure 10. Hence, we suppose that stratification is independent from the projected stellar rotational velocity ( v e sin i ) (within the limited temperature range) and consider BD+00°1659 as a possible prototype for stratification studies of silicon magnetic stars.
Regarding the influence of stratification on non-LTE calculations, it is important to note that a comparable investigation was previously conducted only for neodymium (Nd) and praseodymium (Pr) [37,38] in cool Ap stars. In the atmospheres of these stars, Pr and Nd are concentrated in a thin upper atmospheric layer above log τ 5000 = −3.5, where non-LTE effects are rather large. The present stratification study demonstrates that Si and Fe settle in the deep atmospheric layers, where non-LTE effects are negligible. It seems reasonable to suggest that as the depth of line formation moves into deeper layers, the influence of non-LTE effects will decrease. Consequently, for such elements (Fe, Si, perhaps Mg, Ca, Sr), the LTE approach can be employed in stratification analysis.

6. Conclusions

We performed a self-consistent spectroscopic analysis of the slowly rotating ApSi star BD+00°1659, deriving the abundances of 30 elements from He to Er and accounting for non-LTE effects for 11 of them. The star BD+00°1659 displays the abundance pattern typical for the magnetic Ap/Bp Si stars.
The analysis of silicon and iron abundances using spectral lines from different ionisation states reveals a clear violation of ionisation balance, indicating the presence of abundance stratification in the stellar atmosphere. Stratification analysis of Si and Fe shows that these elements are concentrated in deeper atmospheric layers, below log τ 5000 = −1.0. We demonstrate that when elements are concentrated in these deeper layers, non-LTE effects are negligible, allowing the LTE approach to be successfully applied in stratification analysis.
We showed that BD+00°1659 has the same radius, atmospheric parameters, and elemental abundances as the more rapidly rotating ApSi star MX TrA. We found no clear correlation between Si overabundance or Si iiiii anomalies and v e sin i in a sample of Ap/Bp Si stars from the literature. As a result, BD+00°1659 can serve as a benchmark for studying the impact of stratification on emergent flux and lines profiles in MX TrA and other fast-rotating Ap/Bp Si stars within the T eff = 11,000–13,000 temperature range, where severe line blending caused by rotation prevents direct stratification analysis.

Supplementary Materials

The following supporting information can be downloaded at: https://www.mdpi.com/article/10.3390/galaxies12050055/s1.

Author Contributions

Conceptualisation, I.P. and T.R.; methodology, T.R.; software, Y.P. and T.S.; validation, A.R., T.R. and Y.P.; formal analysis, A.R. and T.R.; investigation, A.R., T.R. and T.S.; resources, A.R. and Y.P.; data curation, A.R.; writing—original draft preparation, A.R.; writing—review and editing, A.R., T.R., I.P. and T.S.; visualisation, A.R. and T.R.; supervision, I.P.; project administration, I.P. and T.R.; funding acquisition, I.P. All authors have read and agreed to the published version of the manuscript.

Funding

This research was funded by the Russian Science Foundation (project No. 24-22-00237), https://rscf.ru/en/project/24-22-00237/ (accessed on 22 August 2024).

Data Availability Statement

Spectra of BD+00°1659 normalised to the continuum level are provided as Supplementary Materials in the form of an ASCII file in CDS. The full table of used lines with l o g g f , excitation potentials E i , LTE and non-LTE abundances, and references for oscillator strengths and hyperfine constants is available online in CDS.

Acknowledgments

We acknowledge L. I. Mashonkina for providing the non-LTE calculations and valuable comments on this study.

Conflicts of Interest

The authors declare no conflicts of interest.

Abbreviations

The following abbreviations are used in this manuscript:
REERare-Earth Elements
ESPaDOnSThe Echelle SpectroPolarimetric Device for the Observation of Stars
PIPrincipal Investigator
LTELocal Thermodynamic Equilibrium

Notes

1
2
http://vizier.cds.unistra.fr/vizier/sed/ (accessed on 22 August 2024).

References

  1. Michaud, G. Diffusion Processes in Peculiar A Stars. Astrophys. J. 1970, 160, 641. [Google Scholar] [CrossRef]
  2. Kochukhov, O.; Shulyak, D.; Ryabchikova, T. A self-consistent empirical model atmosphere, abundance and stratification analysis of the benchmark roAp starα Circini. Astron. Astrophys. 2009, 499, 851–863. [Google Scholar] [CrossRef]
  3. Ryabchikova, T.; Wade, G.A.; LeBlanc, F. Modelling of Stellar Atmospheres; 2003, 210, 301.
  4. Bailey, J.D.; Landstreet, J.D. Abundances determined using Si ii and Si iii in B-type stars: Evidence for stratification. Astron. Astrophys. 2013, 551, A30. [Google Scholar] [CrossRef]
  5. Mashonkina, L. Non-local thermodynamic equilibrium line formation for Si i–ii–iii in A–B stars and the origin of Si ii emission lines in ι Her. Mon. Not. R. Astron. Soc. 2020, 493, 6095–6108. [Google Scholar] [CrossRef]
  6. Grubissich, C.; Purgathofer, A. Der galaktische Sternhaufen NGC 2301. Mit 2 Textabbildungen. Zeitschrift fur Astrophysik 1962, 54, 41. [Google Scholar]
  7. Renson, P.; Gerbaldi, M.; Catalano, F.A. General catalogue of AP and AM stars. Astron. Astrophys. Suppl. Ser. 1991, 89, 429. [Google Scholar]
  8. Romanyuk, I.I.; Semenko, E.A.; Kudryavtsev, D.O. Results of the magnetic field measurements of CP stars carried out with the Russian 6-m telescope. II. Observations in 2008. Astrophys. Bull. 2015, 70, 444–455. [Google Scholar] [CrossRef]
  9. Donati, J.F.; Semel, M.; Carter, B.D.; Rees, D.E.; Cameron, A.C. Spectropolarimetric observations of active stars. Mon. Not. R. Astron. Soc. 1997, 291, 658–682. [Google Scholar] [CrossRef]
  10. Potravnov, I.; Ryabchikova, T.; Piskunov, N.; Pakhomov, Y.; Kniazev, A. Doppler imaging of a southern ApSi star HD 152564. Mon. Not. R. Astron. Soc. 2023, 527, 10376–10387. [Google Scholar] [CrossRef]
  11. Kharchenko, N.V.; Piskunov, A.E.; Röser, S.; Schilbach, E.; Scholz, R.-D. Astrophysical parameters of Galactic open clusters. Astron. Astrophys. 2005, 438, 1163–1173. [Google Scholar] [CrossRef]
  12. Fitzpatrick, E.L.; Massa, D.; Gordon, K.D.; Bohlin, R.; Clayton, G.C. An Analysis of the Shapes of Interstellar Extinction Curves. VII. Milky Way Spectrophotometric Optical-through-ultraviolet Extinction and Its R-dependence. Astrophys. J. 2019, 886, 108. [Google Scholar] [CrossRef]
  13. Brown, A.G.; Vallenari, A.; Prusti, T.; de Bruijne, J.H. GaiaEarly Data Release 3. Astron. Astrophys. 2021, 649, A1. [Google Scholar] [CrossRef]
  14. Kochukhov, O.P. Spectrum synthesis for magnetic, chemically stratified stellar atmospheres. arXiv 2007, arXiv:astro-ph/0701084. [Google Scholar]
  15. Tsymbal, V.; Ryabchikova, T.; Sitnova, T. Software for NLTE Spectrum Fitting. Phys. Magn. Stars 2019, 518, 247–252. [Google Scholar]
  16. Kochukhov, O. Astrophysics Source Code Library, 2018; ascl:1805.015.
  17. Piskunov, N.E.; Kupka, F.; Ryabchikova, T.A.; Weiss, W.W.; Jeffery, C.S. VALD: The Vienna Atomic Line Data Base. Astron. Astrophys. Suppl. Ser. 1995, 112, 525. [Google Scholar]
  18. Pakhomov, Y.V.; Ryabchikova, T.A.; Piskunov, N.E. Hyperfine Splitting in the VALD Database of Spectral-line Parameters. Astron. Rep. 2019, 63, 1010–1021. [Google Scholar] [CrossRef]
  19. Giddings, J.R. An Investigation of the Optical and Ultraviolet Spectra of Hot Subdwarf Stars. Ph.D. Thesis, University of London, London, UK, 1981. [Google Scholar]
  20. Butler, K.; Giddings, J. Newsletter on the Analysis of Astronomical Spectra No. 9; University of London: London, UK, 1985. [Google Scholar]
  21. Przybilla, N.; Nieva, M.-F.; Butler, K. Testing common classical LTE and NLTE model atmosphere and line-formation codes for quantitative spectroscopy of early-type stars. J. Phys. Conf. Ser. 2011, 328, 012015. [Google Scholar] [CrossRef]
  22. Alexeeva, S.A.; Ryabchikova, T.A.; Mashonkina, L.I. NLTE carbon abundance determination in selected A- and B-type stars and the interpretation of C i emission lines. Mon. Not. R. Astron. Soc. 2016, 462, 1123–1135. [Google Scholar] [CrossRef]
  23. Sitnova, T.M.; Mashonkina, L.I.; Ryabchikova, T.A. Influence of departures from LTE on oxygen abundance determination in the atmospheres of A-K stars. Astron. Lett. 2013, 39, 126–140. [Google Scholar] [CrossRef]
  24. Alexeeva, S.; Chen, T.; Ryabchikova, T.; Shi, W.; Sadakane, K.; Nishimura, M.; Zhao, G. Neon Abundances of B Stars in the Solar Neighborhood. Astrophys. J. 2020, 896, 59. [Google Scholar] [CrossRef]
  25. Alexeeva, S.A.; Pakhomov, Y.V.; Mashonkina, L.I. Non-LTE sodium abundance in galactic thick- and thin-disk red giants. Astron. Lett. 2014, 40, 406–424. [Google Scholar] [CrossRef]
  26. Alexeeva, S.; Ryabchikova, T.; Mashonkina, L.; Hu, S. NLTE Line Formation for Mg i and Mg ii in the Atmospheres of B–A–F–G–K Stars. Astrophys. J. 2018, 866, 153. [Google Scholar] [CrossRef]
  27. Sitnova, T.M.; Mashonkina, L.I.; Ryabchikova, T.A. A NLTE line formation for neutral and singly ionized calcium in model atmospheres of B-F stars. Mon. Not. R. Astron. Soc. 2018, 477, 3343. [Google Scholar] [CrossRef]
  28. Mashonkina, L. Influence of departures from LTE on determinations of the scandium abundances in A-B type stars. Mon. Not. R. Astron. Soc. 2023, 527, 8234–8244. [Google Scholar] [CrossRef]
  29. Sitnova, T.M.; Yakovleva, S.A.; Belyaev, A.K.; Mashonkina, L.I. Influence of Collisions with Hydrogen on Titanium Abundance Determinations in Cool Stars. Astron. Lett. 2020, 46, 120–130. [Google Scholar] [CrossRef]
  30. Mashonkina, L.; Ryabchikova, T.; Alexeeva, S.; Sitnova, T.; Zatsarinny, O. Chemical diversity among A-B stars with low rotational velocities: Non-LTE abundance analysis. Mon. Not. R. Astron. Soc. 2020, 499, 3706–3719. [Google Scholar] [CrossRef]
  31. Sitnova, T.; Ryabchikova, T.; Alexeeva, S.; Mashonkina, L. NLTE abundances of C, O, Ca, Ti, and Fe in the reference BAF-type stars. Proc. Int. Astron. Union 2017, 13, 360–361. [Google Scholar] [CrossRef]
  32. Lodders, K. Relative Atomic Solar System Abundances, Mass Fractions, and Atomic Masses of the Elements and Their Isotopes, Composition of the Solar Photosphere, and Compositions of the Major Chondritic Meteorite Groups. Space Sci. Rev. 2021, 217, 44. [Google Scholar] [CrossRef]
  33. Lawler, J.E.; Sneden, C.; Nave, G.; Hartog, E.A.D.; Emrahoğlu, N.; Cowan, J.J. IMPROVED Cr ii log(gf) VALUES AND ABUNDANCE DETERMINATIONS IN THE PHOTOSPHERES OF THE SUN AND METAL-POOR STAR HD 84937. Astrophys. J. Suppl. Ser. 2017, 228, 10. [Google Scholar] [CrossRef]
  34. Babel, J.; Lanz, T. Stratification of chemical elements in the atmosphere of the AP star 53 Camelopardalis. Astron. Astrophys. 1992, 263, 232–240. [Google Scholar]
  35. LeBlanc, F.; Monin, D.; Hui-Bon-Hoa, A.; Hauschildt, P.H. Stellar model atmospheres with abundance stratification. Astron. Astrophys. 2009, 495, 937–944. [Google Scholar] [CrossRef]
  36. Shulyak, D.; Kochukhov, O.; Valyavin, G.; Lee, B.-C.; Galazutdinov, G.; Kim, K.-M.; Han, I.; Burlakova, T. The Lorentz force in atmospheres of chemically peculiar stars: 56 Arietis. Astron. Astrophys. 2009, 509, A28. [Google Scholar] [CrossRef]
  37. Mashonkina, L.; Ryabchikova, T.; Ryabtsev, A. NLTE ionization equilibrium of Nd II and Nd III in cool A and Ap stars. Astron. Astrophys. 2005, 441, 309–318. [Google Scholar] [CrossRef]
  38. Mashonkina, L.; Ryabchikova, T.; Ryabtsev, A.; Kildiyarova, R. Non-LTE line formation for Pr II and Pr III in A and Ap stars. Astron. Astrophys. 2009, 495, 297–311. [Google Scholar] [CrossRef]
Figure 1. Comparison between MX TrA (black line) and BD+00°1659 (red line) spectra (a,b). The observed spectrum of BD+00°1659 is broadened with a rotational velocity of v e sin i = 69 km s−1. (a) Spectral range 6670–6890 Å with several Si and Fe lines, (b) hydrogen line profiles, (c) hydrogen line profiles in the observed spectrum of BD+00°1659 (black line) and synthesis spectrum calculated with t11950g3.60 model (red line).
Galaxies 12 00055 g001
Figure 2. Spectral energy distribution of BD+00°1659 (points) compared with theoretical flux (solid line) from adopted model atmosphere.
Galaxies 12 00055 g002
Figure 3. Abundances of BD+00°1659 relative to solar values. For those elements where non-LTE and LTE abundances are available, the corresponding LTE values are shown with open symbols.
Galaxies 12 00055 g003
Figure 4. Abundances in stars BD+00°1659 [4] and MX TrA relative to the results of the present paper. Dotted lines indicates an average ±0.15 dex abundance uncertainty.
Galaxies 12 00055 g004
Figure 5. Distribution of Fe (black line) and Si (red line) abundance in the atmosphere of BD+00°1659. Shaded areas show error bars for stratification parameters (higher and lower abundances and jump position). Theoretical predictions for the model T eff = 12,000 K, log g = 4.0 are shown by solid lines [35]. Solar abundances are indicated by dotted lines.
Galaxies 12 00055 g005
Figure 6. Spectral line profiles used in stratification analysis. Black crosses indicate the observed profile. Synthetic spectra calculated with homogeneous abundance and with a stratified one are shown by red dashed and blue solid lines, respectively.
Galaxies 12 00055 g006
Figure 7. The departure coefficients for the selected atomic levels of Fe i (dotted lines), Fe ii (solid lines), and Fe iii (dashed lines) as a function of optical depth in the model atmosphere of BD+00°1659. See the legend for the levels’ designation. Red and blue lines correspond to calculations accounting for and neglecting iron abundance stratification, respectively.
Galaxies 12 00055 g007
Figure 8. Comparison of Fe line profiles of different ionisation stages, calculated with stratified model in LTE and non-LTE. The excitation energy of the lower level ( E l o w ) is indicated.
Galaxies 12 00055 g008
Figure 9. Comparison between the observed Si (a) and Fe (b) line profiles in MX TrA (black filled circles) and synthetic spectra calculated with stratified (blue line) and homogeneous (red dashed line) model atmosphere.
Galaxies 12 00055 g009aGalaxies 12 00055 g009b
Figure 10. Si ii (filled black circles) and Si iii (open black circles) abundances from [4] versus v e sin i and magnetic field. Solid lines show the linear regressions. The solar Si abundance is indicated by dashed line.
Galaxies 12 00055 g010
Table 1. Non-LTE and LTE abundances for atoms and ions in the atmosphere of BD+00°1659.
Ion BD+00°1659MX TrASun
log ε [X/H] nl log ε log ε
He iL10.34(06)−0.584410.43(09)10.924
iL8.80(09)0.335 8.47
N8.83(09)0.365
iiL9.15(13)0.6849.34(04)
N8.98(22)0.514
iL8.68(30)−0.057 8.73
N8.11(16)−0.6278.01(14)
Ne iL8.03(19)−0.124 8.15
N7.81(20)−0.344
Mg iL7.16(12)−0.362 7.52
N7.09(11)−0.432
Mg iiL6.82(26)−0.7097.07(08)
N6.78(34)−0.749
Al iiL5.30(20)−1.1235.32(20)6.42
Si iL7.78(20)0.271 7.51
N8.19(20)0.681
Si iiL8.72(15)1.21208.42(22)
N8.75(15)1.2420
Si iiiL9.45(13)1.9439.49(13)
N9.26(09)1.753
iiL5.77(06)0.364 5.41
iiL6.67(22)−0.487 7.15
Cl iiL7.10(11)1.852 5.25
Ca iL7.11(20)0.841 6.27
N7.19(20)0.921
Ca iiL6.81(33)0.545
N6.84(20)0.575
Sc iiL2.59(20)−0.451 3.04
N3.28(20)0.241
Ti iiL5.32(22)0.42195.91(14)4.90
N5.33(23)0.4319
iiL4.63(16)0.686 3.95
Cr iL7.02(20)1.391 5.63
Cr iiL6.60(15)0.97366.54(16)
Mn iiL5.61(20)0.141 5.47
Fe iL7.72(10)0.2777.54(25)7.45
N7.80(06)0.357
Fe iiL8.23(21)0.78748.19(12)
N8.26(20)0.8174
Fe iiiL9.33(28)1.88129.06(30)
N9.32(30)1.8712
Ni iL6.36(20)0.161 6.20
Ni iiL6.36(27)0.163
Sr iiL5.23(04)2.352 2.88
N5.06(03)2.182
Zr iiL3.46(20)0.911 2.55
N3.74(20)1.191
Ce iiL4.72(27)3.145 1.58
Ce iiiL4.83(01)3.252
Pr iiiL4.11(31)3.3928 0.72
Nd iiL4.87(13)3.427 1.45
Nd iiiL4.81(32)3.3660
Sm iiL4.81(20)3.861 0.95
Eu iiL5.11(23)4.593 0.52
Eu iiiL4.92(21)4.403
Gd iiL4.58(11)3.505 1.08
Tb iiiL3.57(21)3.265 0.31
Dy iiiL4.52(31)3.4218
Er iiL4.08(11)3.152 0.93
Er iiiL3.60(33)2.677
L and N symbols indicate LTE and non-LTE mean abundances. nl is the number of spectral lines used for abundance determination. The standard deviation is given in parentheses and was assumed to be 0.2 dex when the abundance was obtained from a single line. The abundances of MX TrA are converted to the form of logε. The last column contains present-day solar system abundances taken from [32].
Table 2. Stratification parameters of Fe and Si in the atmosphere of BD+00°1659.
Element log N N tot up log N N tot low log τ 5000 log τ 5000
Fe −4.19(0.08)−2.63(0.33)−0.98(0.09)0.60(0.59)
Si −4.05(0.08)−2.56(0.43)−0.85(0.16)0.98(0.54)
The parameters of the step function of element stratification are presented, including the abundance in the upper and lower atmospheres, the position of the jump, and the width of the jump.
Disclaimer/Publisher’s Note: The statements, opinions and data contained in all publications are solely those of the individual author(s) and contributor(s) and not of MDPI and/or the editor(s). MDPI and/or the editor(s) disclaim responsibility for any injury to people or property resulting from any ideas, methods, instructions or products referred to in the content.