
Finding Rare Quasars: VLA Snapshot Continuum Survey of FRI Quasar Candidates Selected from the LOFAR Two-Metre Sky Survey (LoTSS)

 , , and
Abstract
1. Introduction
2. DATA
2.1. The Sample and Optical Data
2.2. LoTSS DRI Image Data
2.3. VLA Observations
3. Results
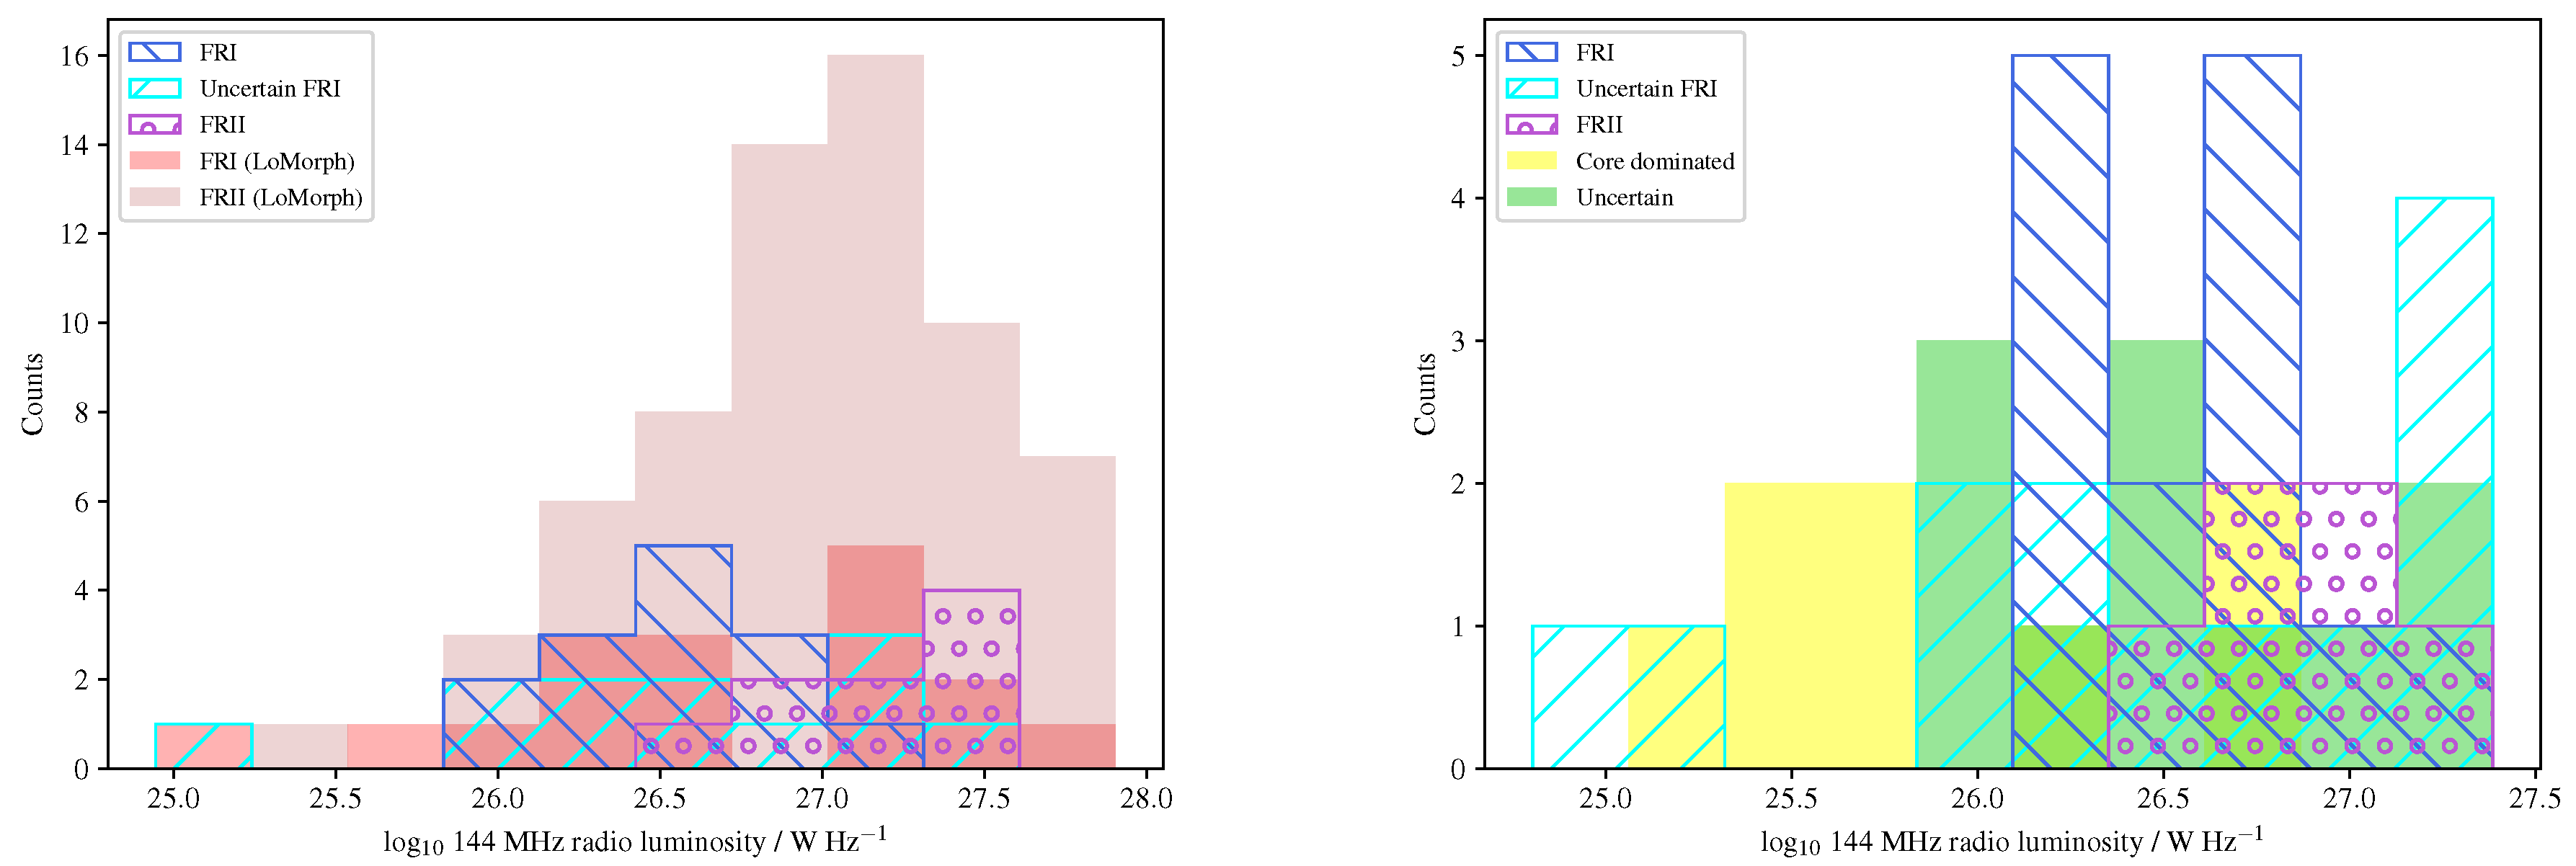
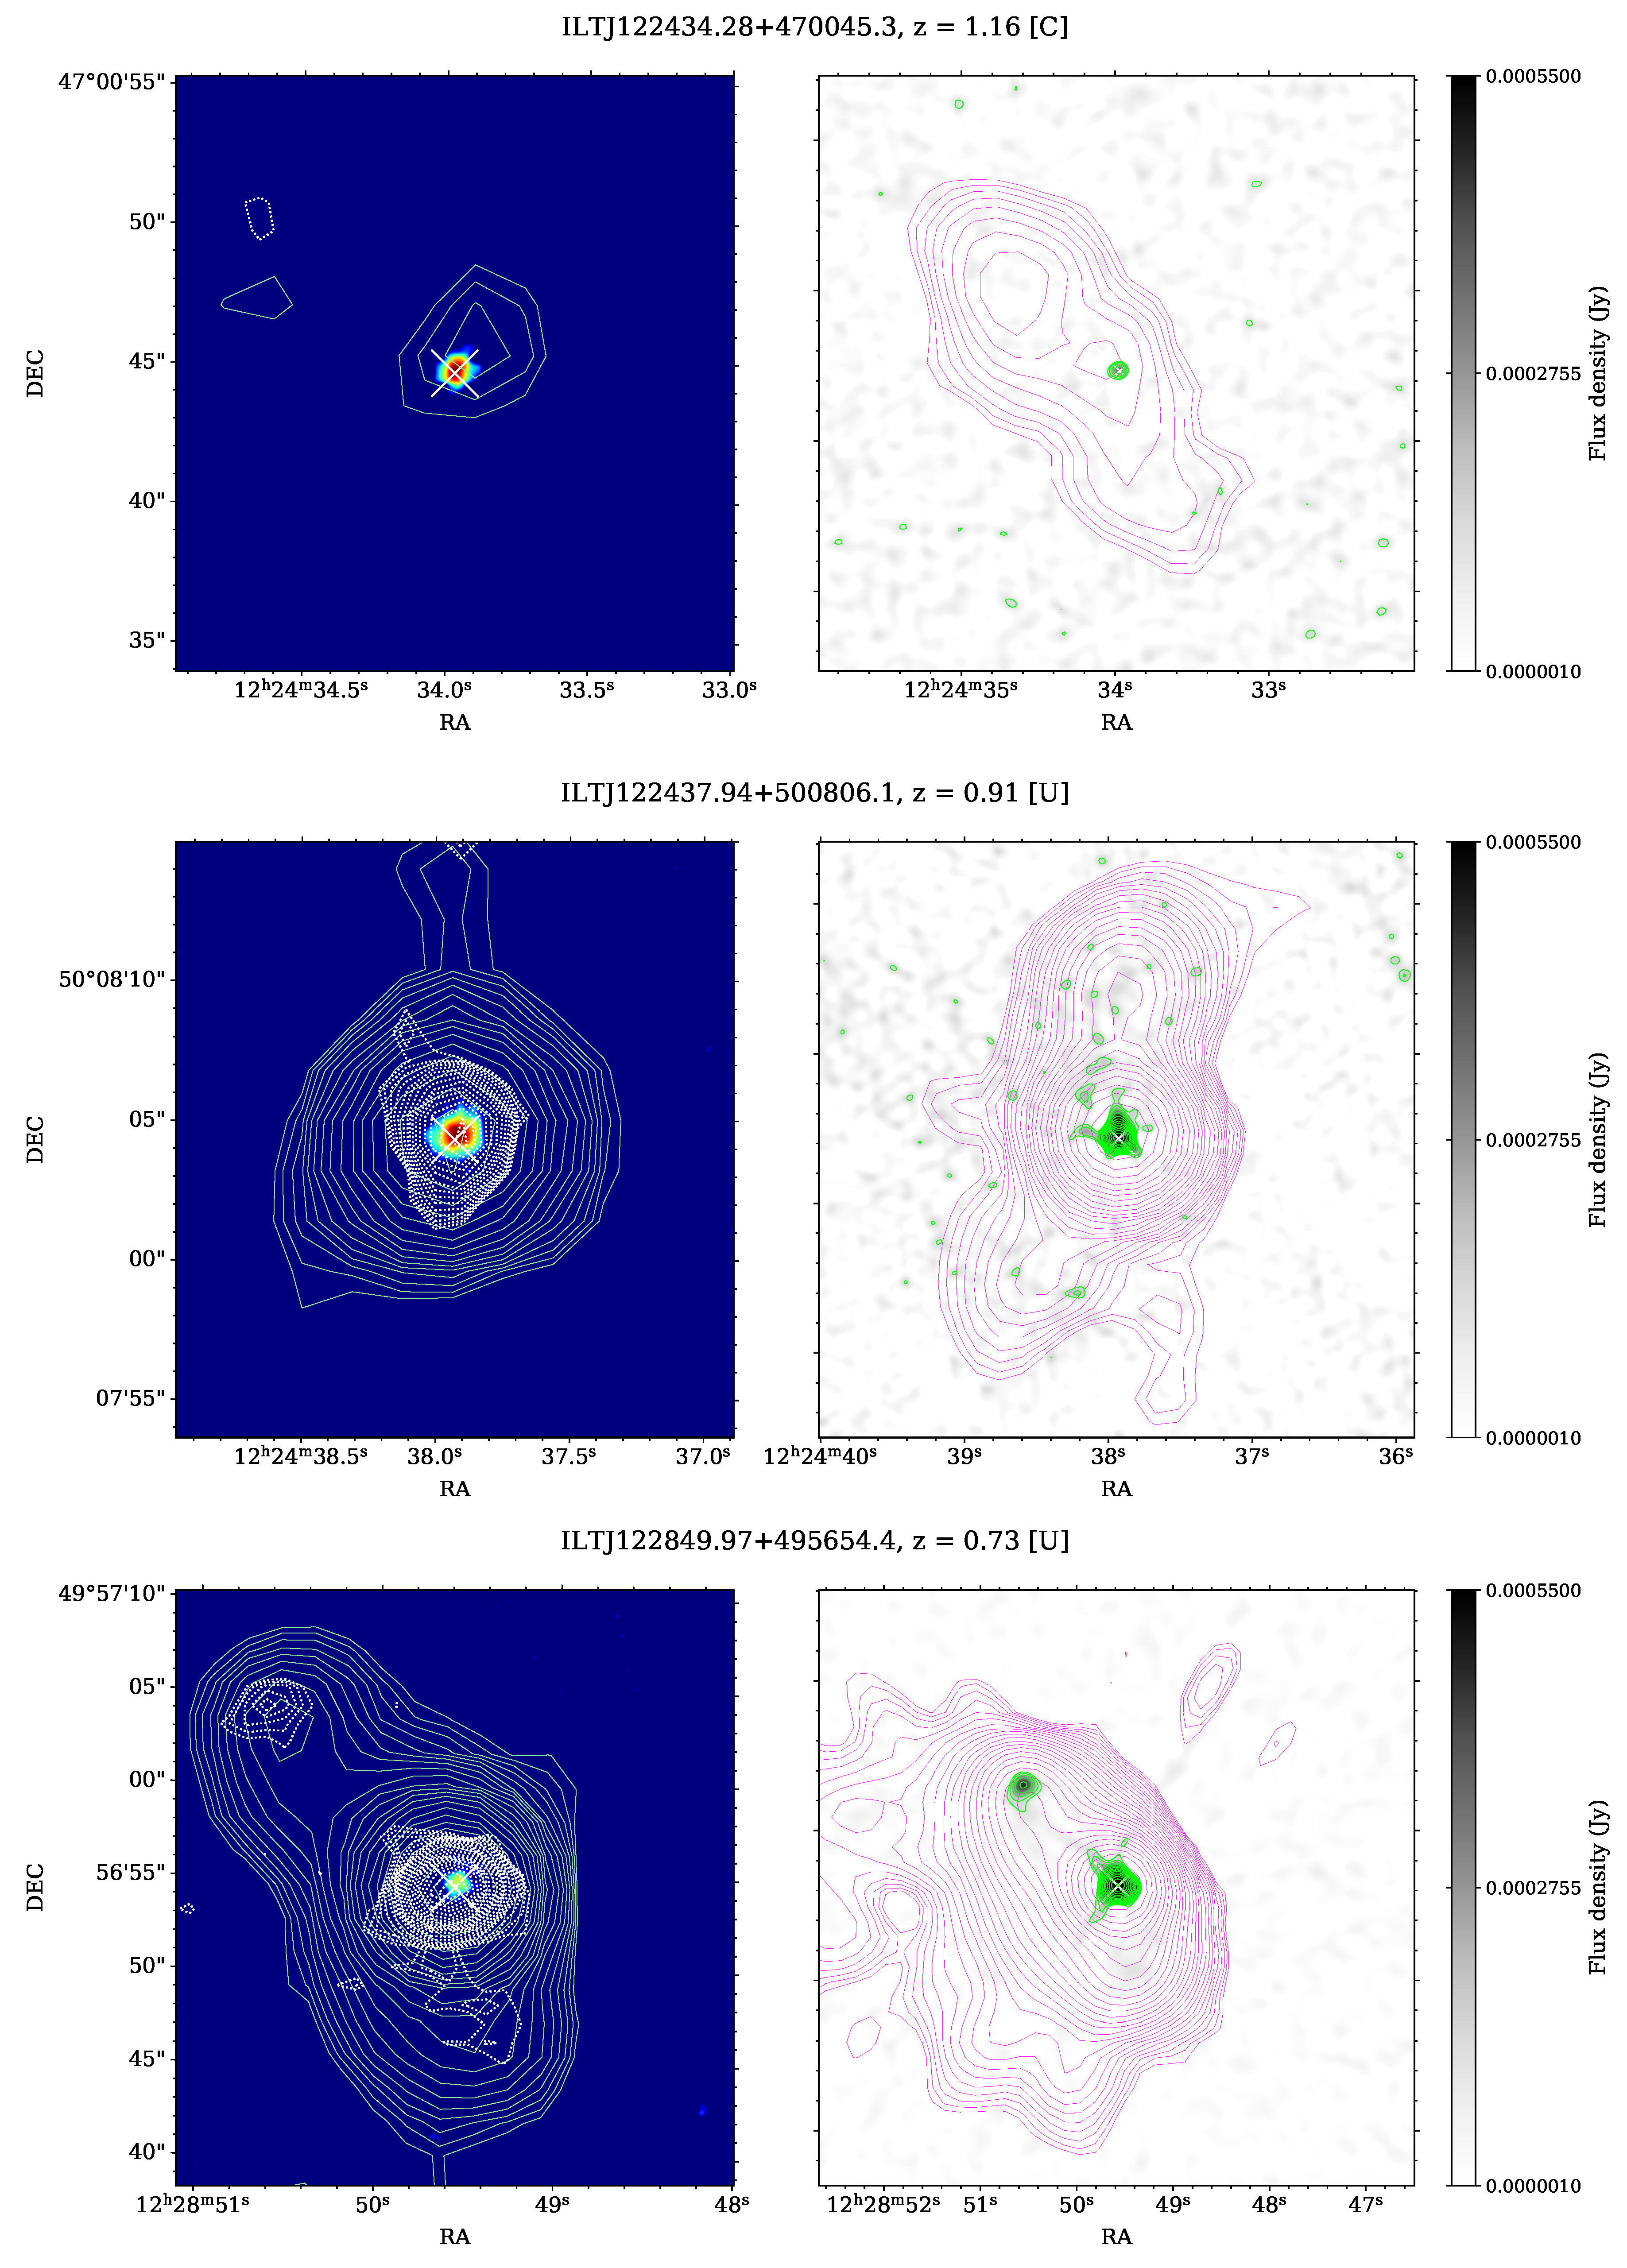
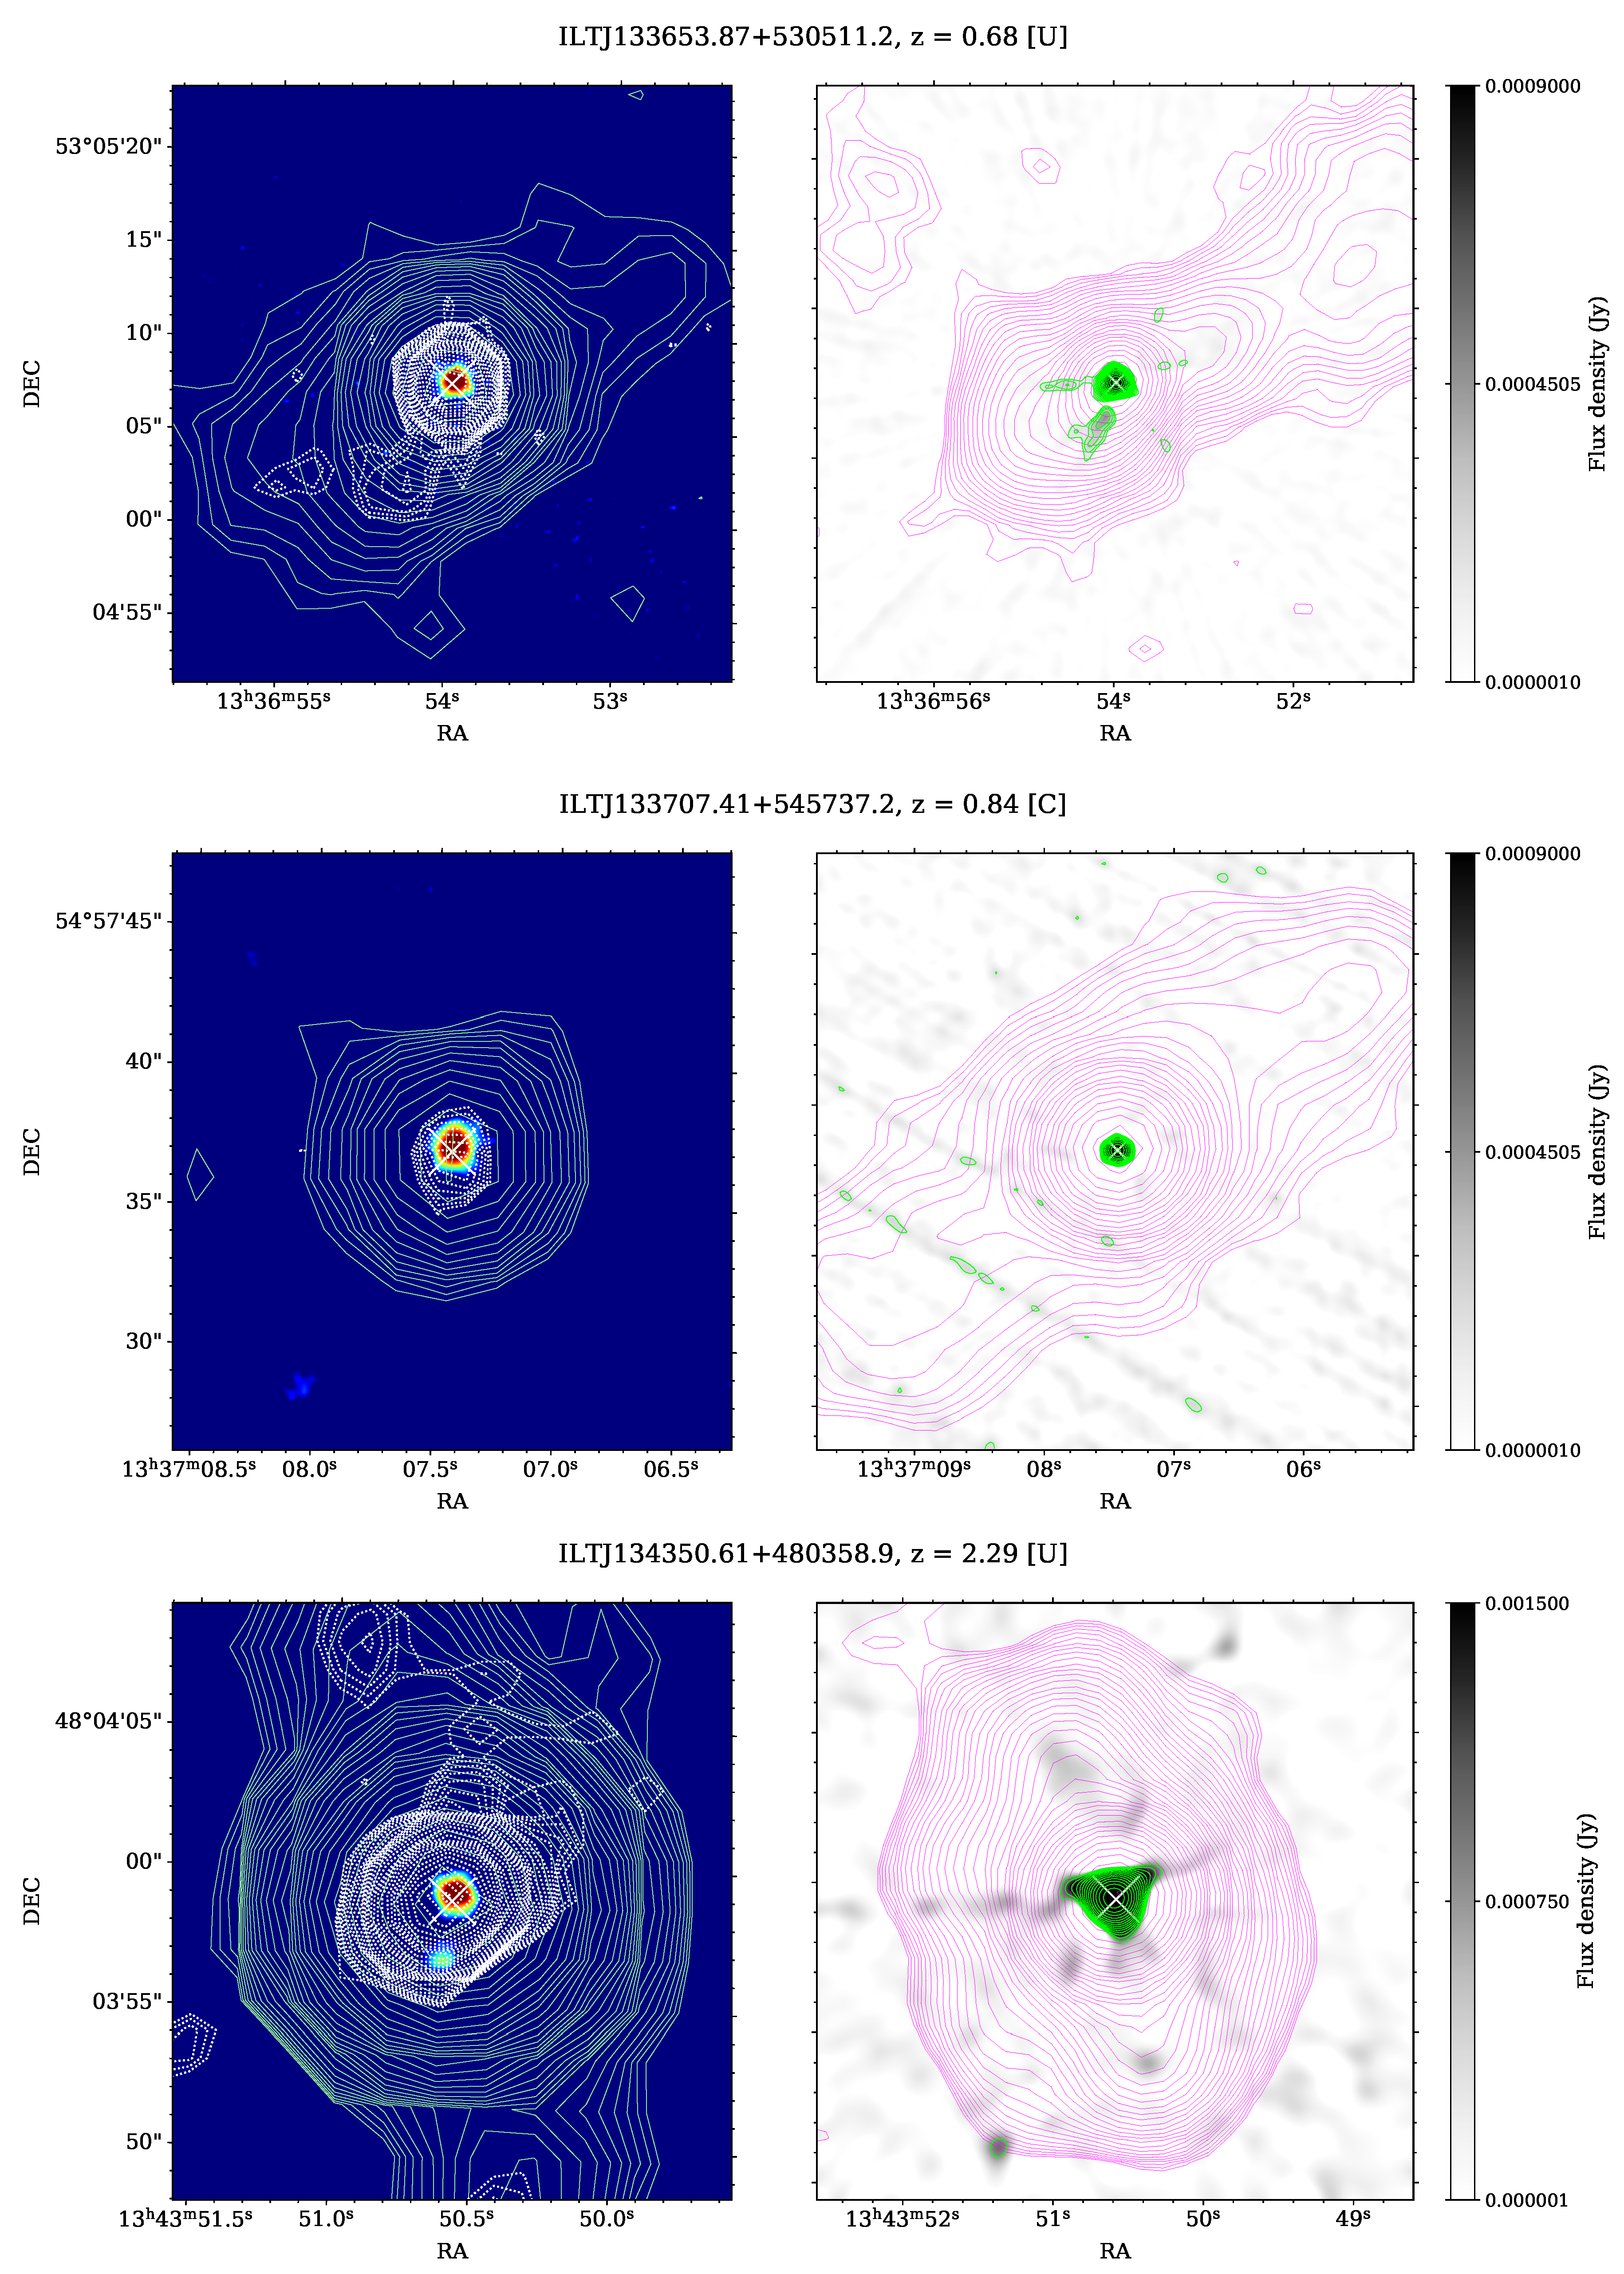
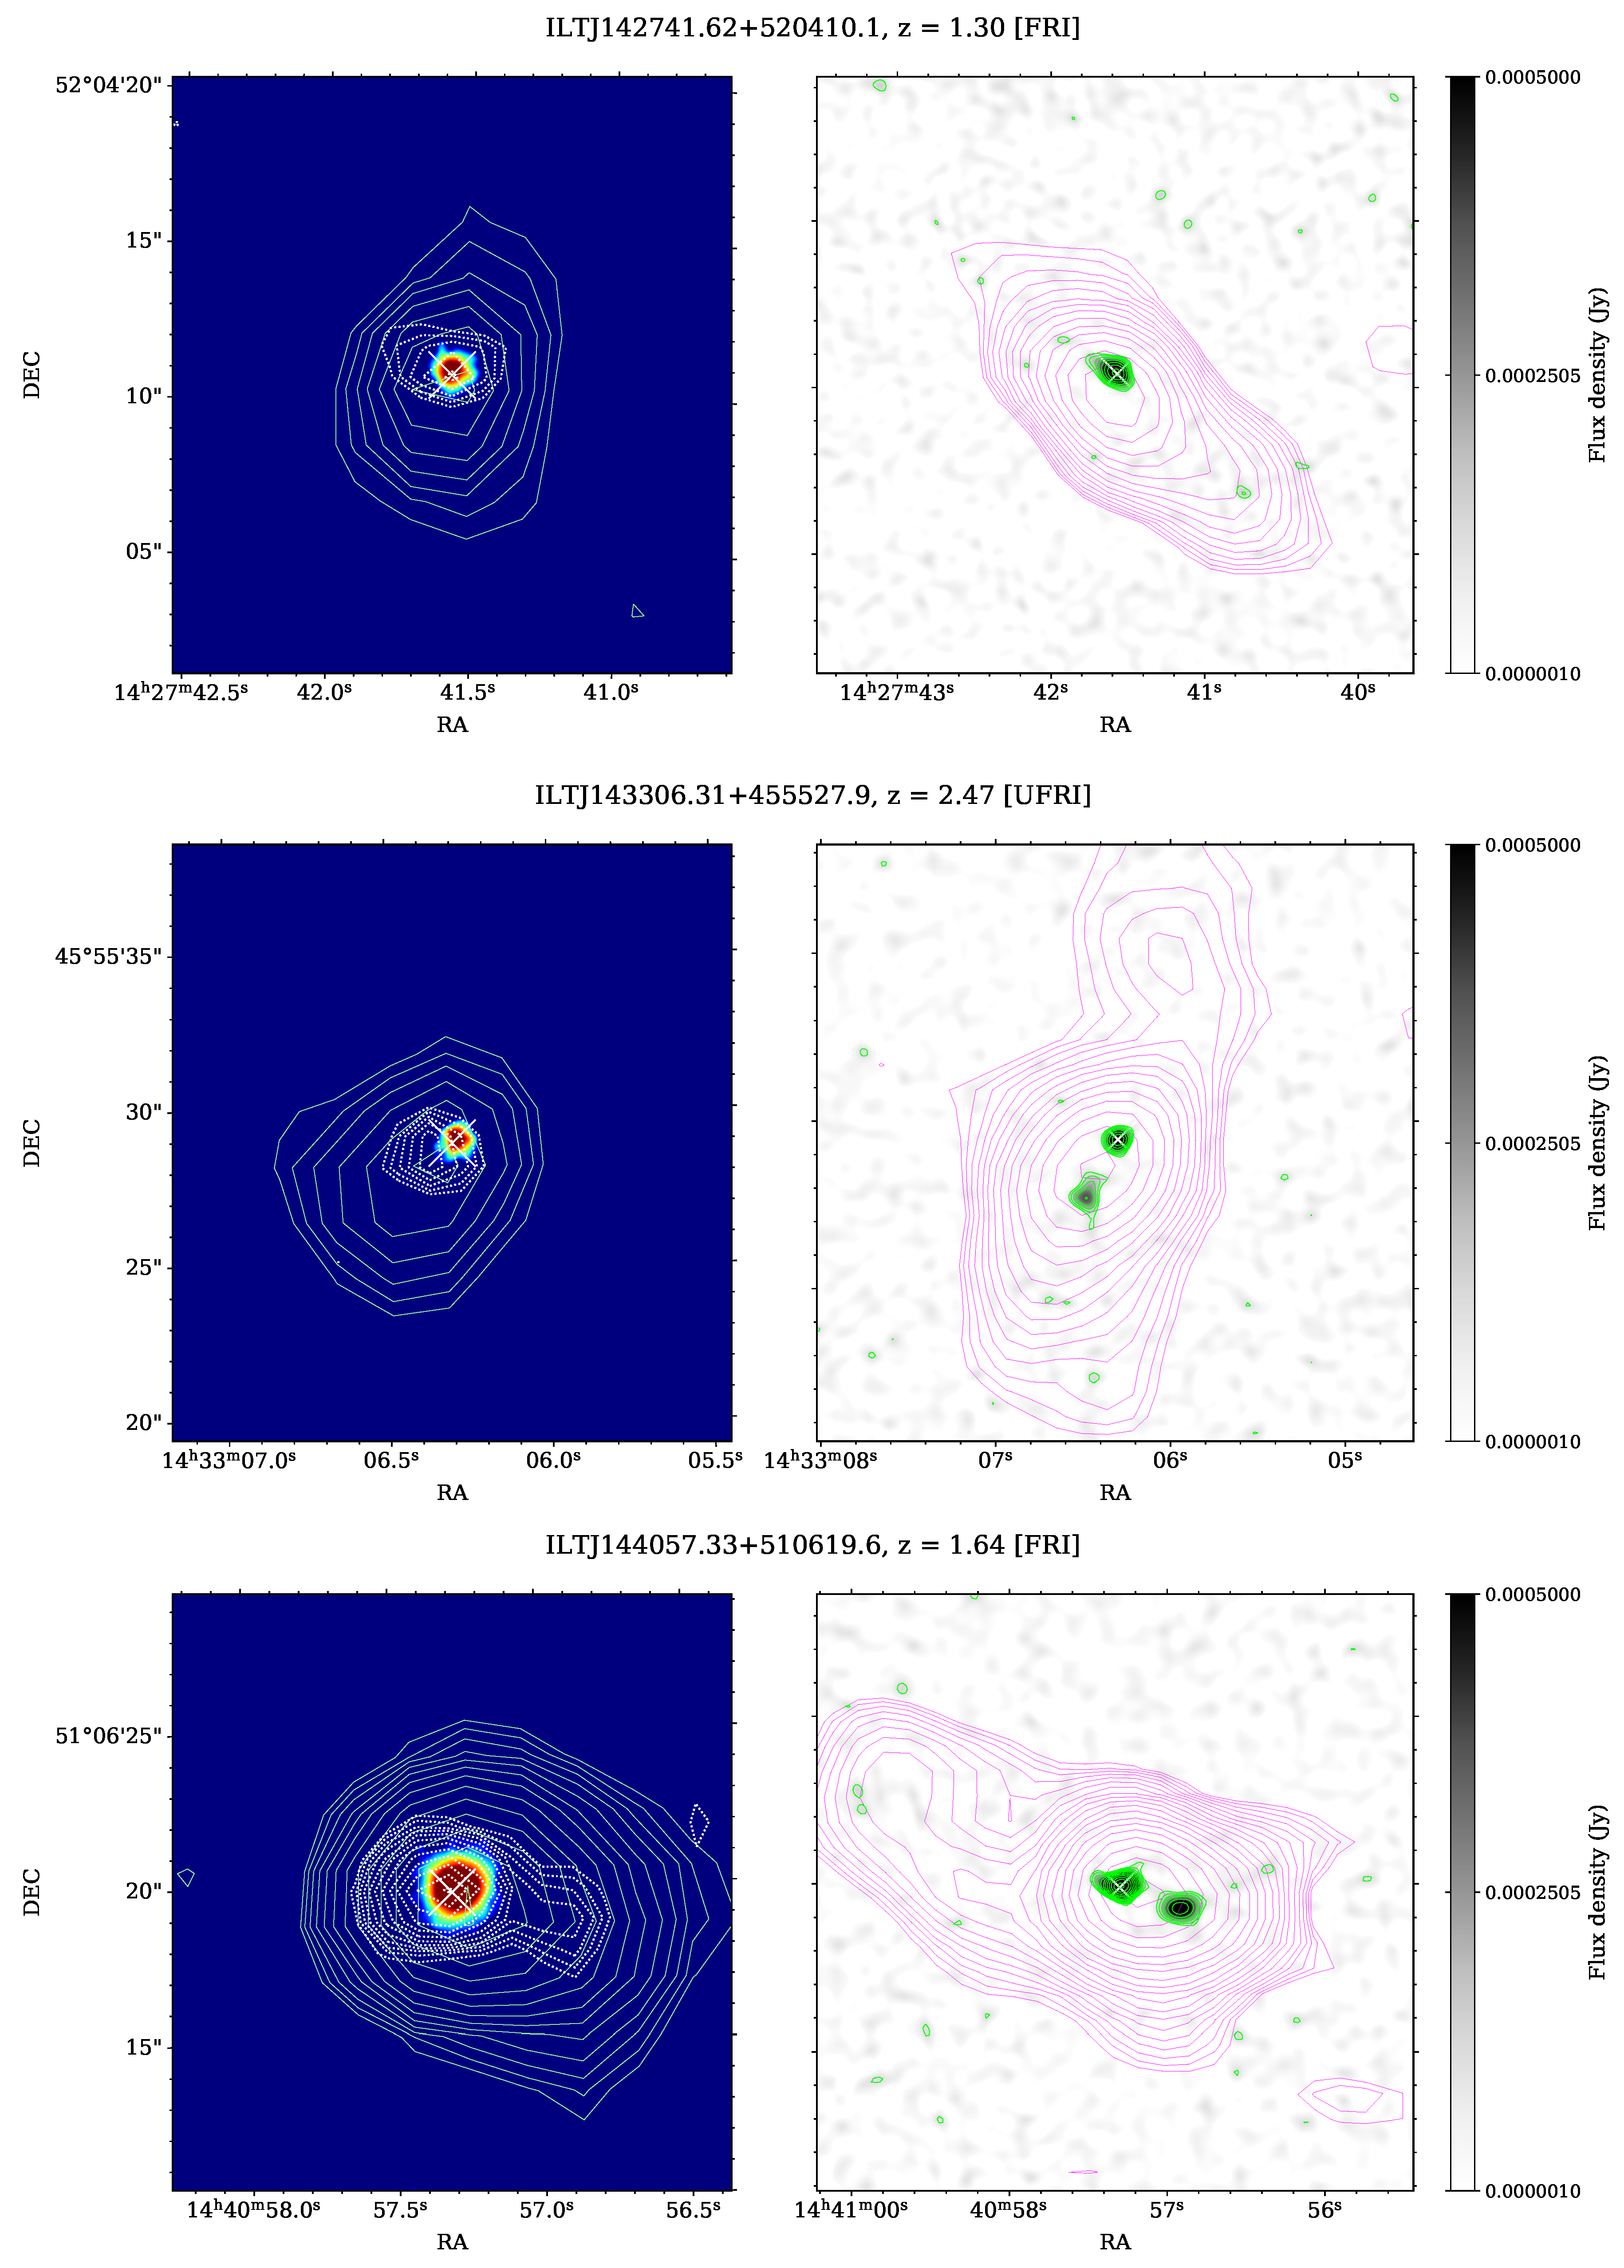
3.1. Classification Statistics of the Targets Using VLA Observations
3.2. Nuclear Properties of Quasars Associated with Different Radio Morphologies
3.3. Host Galaxy Colours
4. Discussion
5. Conclusions
- 25 per cent of the selected target quasars have been confirmed to be FRIs and around 25 per cent show extended structures similar to FRI jets but with the current observations it is not clear whether the bright jet parts are jet knots of an FRI jet or hot spots in FRII jets,
- Although our sample size is small we do not see any difference in the range of black hole masses and Eddington ratios of FRI and FRII quasars. On the other hand, FRI quasars have relatively low jet powers compared to FRII quasars in the samples explored in this study, consistent with the expectation from low-z radio galaxies,
- Investigation of optical galaxy colours of quasars showed that FRI and FRII quasars mainly have blue optical colours. Based on the sample studied here we conclude that quasars, as the most powerful, radiatively efficient systems among the AGN population are more likely to produce FRII type jets. For a quasar to form FRI jets should have low jet power (which is expected to be characterized by black hole spin and magnetic flux) and reside in a significantly dense environment.
Author Contributions
Funding
Data Availability Statement
Acknowledgments
Conflicts of Interest
Appendix A

| Source Name | Class | RA (deg) | DEC (deg) | z | 150 MHz Flux Density (mJy) | 1.5 GHz Flux Density (mJy) | 1.5 GHz Flux Density Error (mJy) | BH Mass log(M) | i-Band (mag) | Angular Scale (Mpc) | 5 GHz Density (mJy) |
|---|---|---|---|---|---|---|---|---|---|---|---|
| ILTJ104920.91 + 521010.1 | UFRI | 162.337 | 52.169 | 1.52 | 8.21 | 12.35 | 3.71 | − | −24.71 | 0.06 | − |
| ILTJ105127.19 + 474716.8 | C | 162.863 | 47.788 | 1.03 | 3.98 | 0.52 | 0.06 | 8.94 | −27.05 | 0.17 | 0.0 |
| ILTJ110126.15 + 485030.0 | UFRI | 165.359 | 48.842 | 1.19 | 254.27 | 32.8 | 9.84 | 8.58 | −24.44 | 0.32 | − |
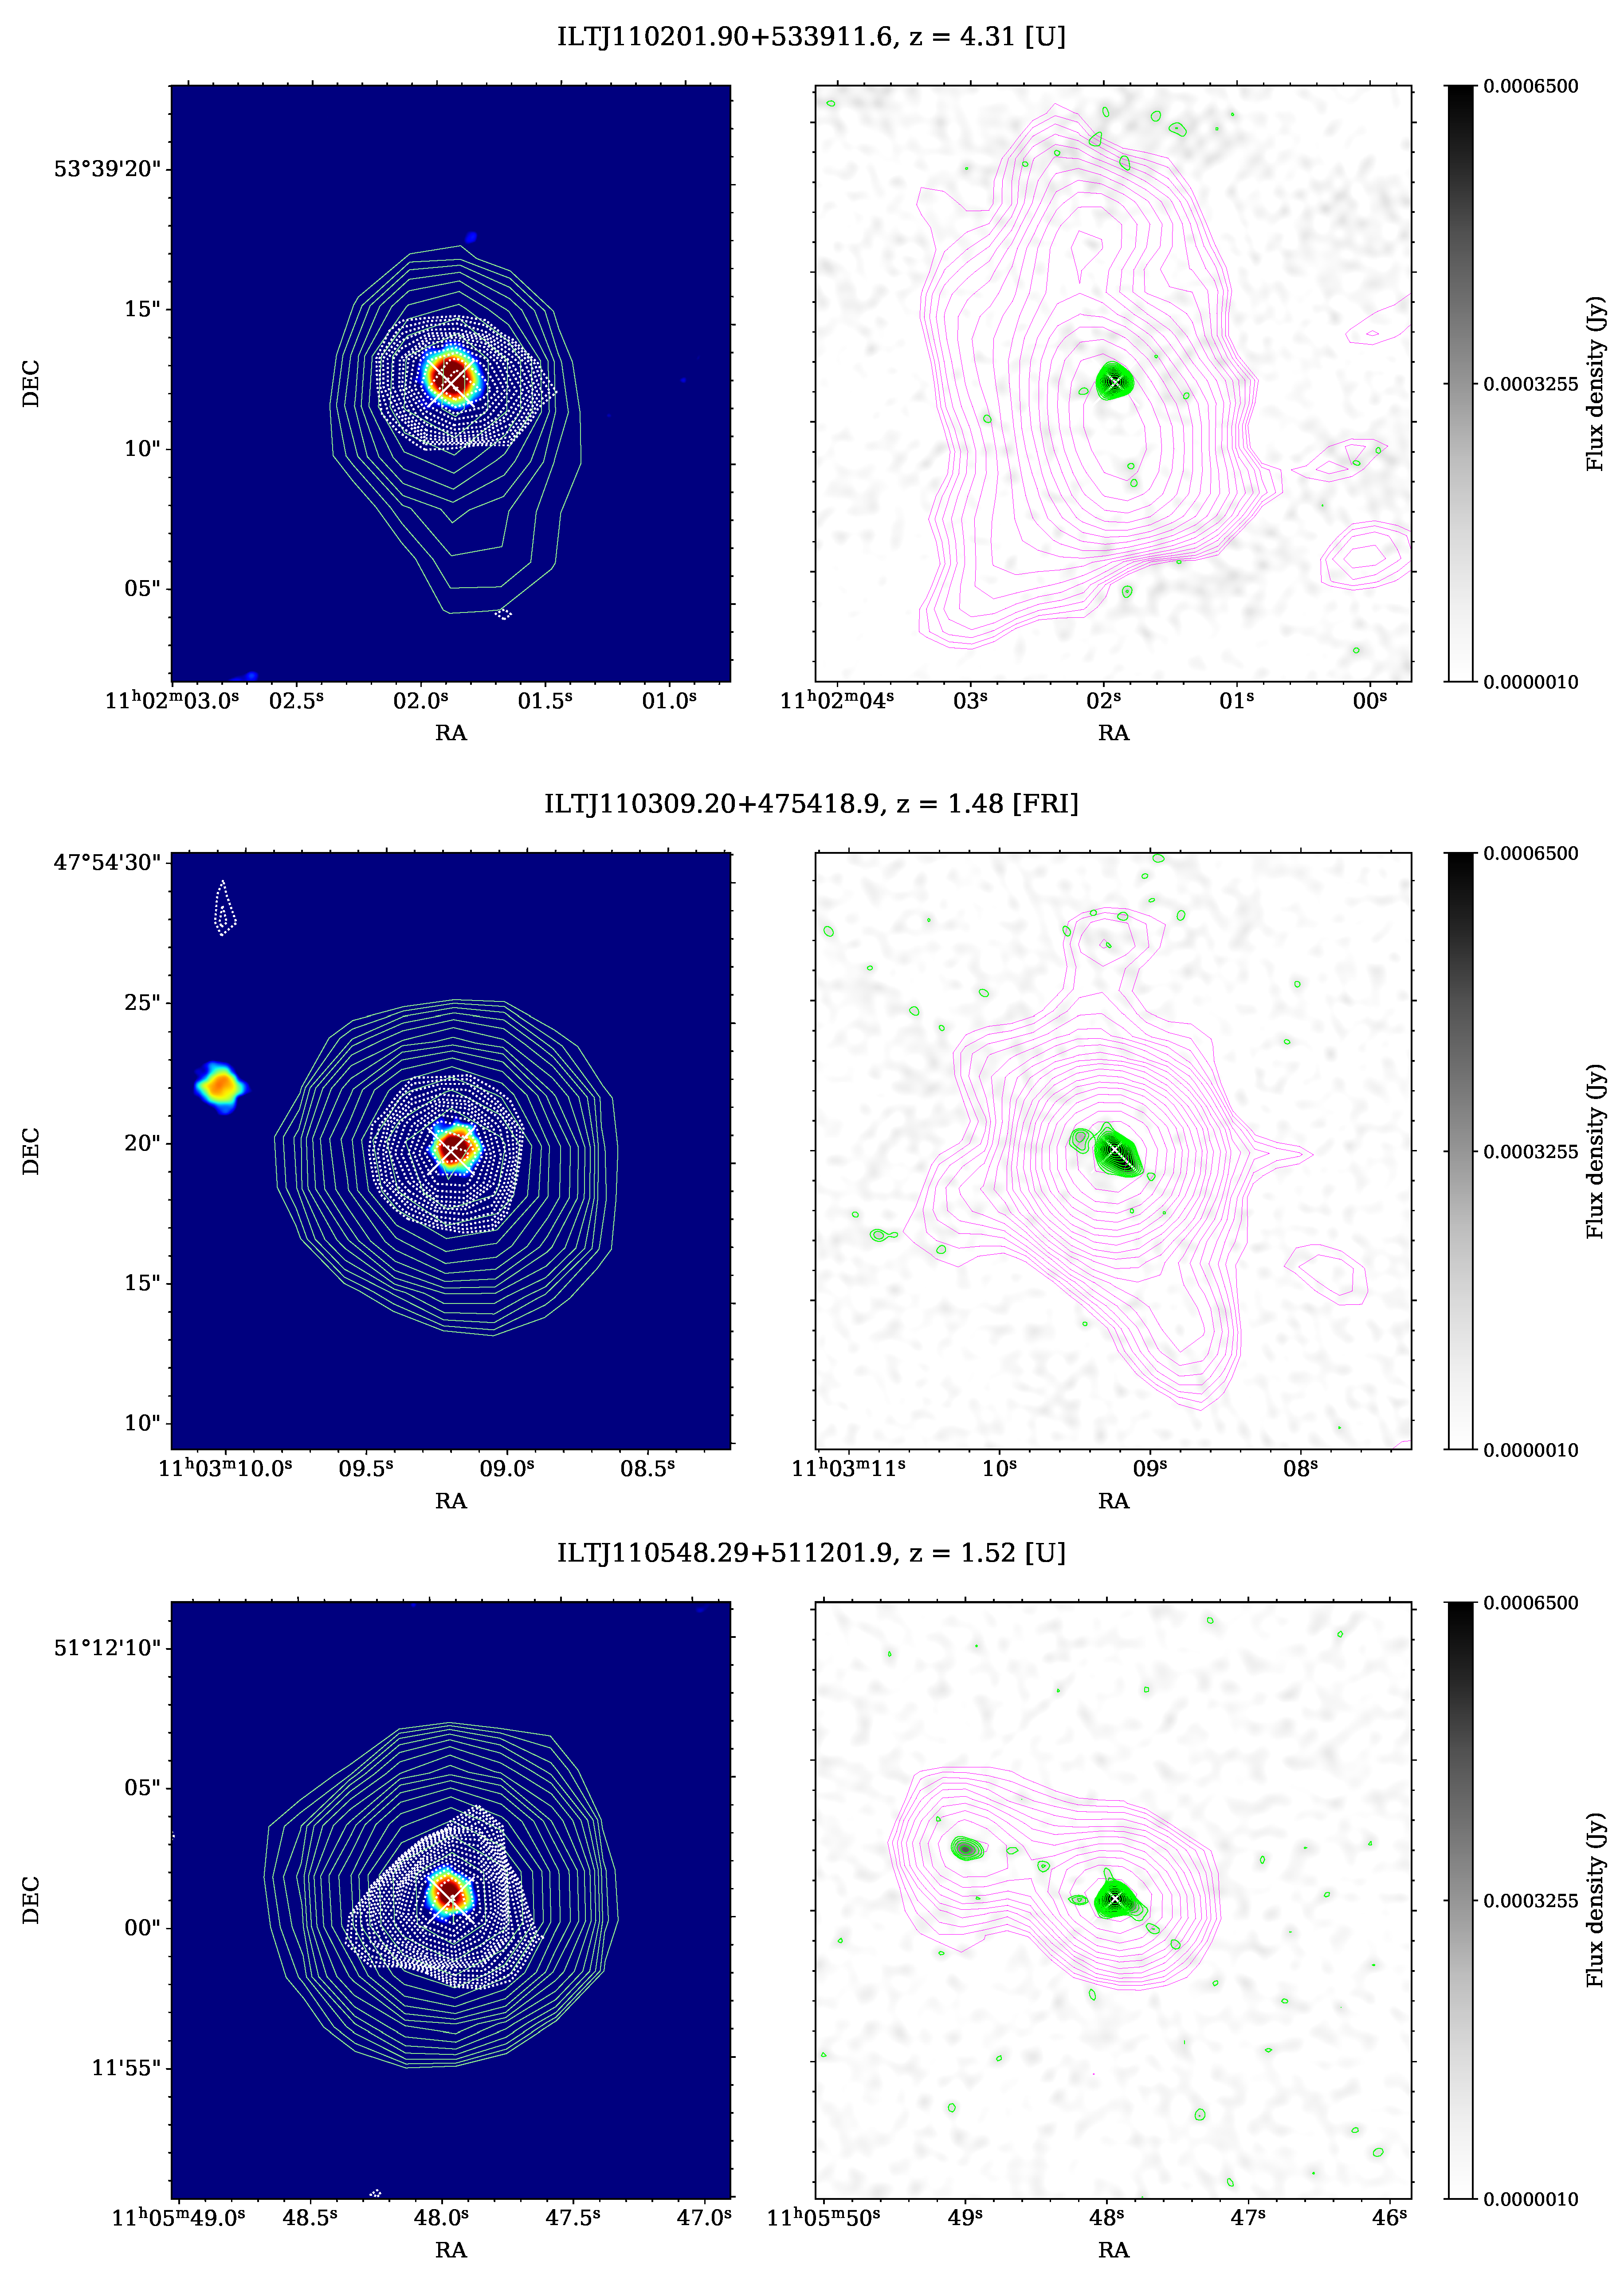
| ILTJ110201.90 + 533911.6 | U | 165.508 | 53.653 | 4.31 | 25.96 | 6.18 | 0.09 | 8.36 | −27.34 | 0.08 | 7.025 |
| ILTJ110309.20 + 475418.9 | FRI | 165.788 | 47.905 | 1.48 | 32.24 | 7.14 | 0.38 | 8.9 | −24.22 | 0.07 | − |
| ILTJ110548.29 + 511201.9 | U | 166.451 | 51.201 | 1.52 | 8.97 | 13.34 | 4.0 | 9.44 | −24.92 | 0.09 | − |
| ILTJ111014.00 + 464413.5 | FRII | 167.558 | 46.737 | 1.51 | 92.97 | 19.41 | 5.82 | 9.27 | −25.96 | 0.1 | 17.05 |
| ILTJ111042.51 + 455744.0 | FRI | 167.677 | 45.962 | 1.97 | 727.38 | 776.08 | 232.82 | − | −24.66 | 0.07 | − |
| ILTJ111312.71 + 483417.7 | C | 168.303 | 48.572 | 1.34 | 4.3 | 1.2 | 0.08 | − | −23.25 | 0.08 | − |
| ILTJ111738.07 + 483012.5 | FRI | 169.409 | 48.503 | 2.35 | 3.59 | 1.33 | 0.08 | 9.6 | −26.05 | 0.09 | − |
| ILTJ112003.81 + 463758.3 | UFRII | 170.016 | 46.633 | 1.22 | 43.67 | 6.65 | 2.0 | 8.53 | −23.74 | 0.07 | − |
| ILTJ112124.28 + 540227.8 | UFRI | 170.351 | 54.041 | 0.84 | 58.17 | 3.66 | 1.1 | − | −22.73 | 0.6 | − |
| ILTJ112621.48 + 555259.7 | FRII | 171.589 | 55.883 | 2.05 | 163.87 | 23.7 | 7.11 | − | −26.05 | 0.08 | − |
| ILTJ112913.38 + 501146.9 | FRI | 172.306 | 50.196 | 1.18 | 23.98 | 3.36 | 1.01 | − | −24.2 | 0.11 | − |
| ILTJ113251.06 + 541031.8 | U | 173.213 | 54.176 | 1.62 | 309.78 | 70.0 | 1.7 | 9.84 | −26.23 | 0.3 | 88.56 |
| ILTJ113836.90 + 524511.3 | FRI | 174.654 | 52.753 | 1.62 | 35.73 | 62.15 | 18.64 | 9.97 | −26.72 | 0.26 | 15.81 |
| ILTJ114047.85 + 462200.6 | UFRI | 175.199 | 46.367 | 0.11 | 182.18 | 19.9 | 2.4 | 8.09 | −23.36 | 0.08 | 53.2 |
| ILTJ114202.51 + 500229.3 | C | 175.51 | 50.041 | 2.19 | 113.91 | 21.82 | 0.36 | − | −25.47 | 0.35 | − |
| ILTJ114312.36 + 505016.3 | U | 175.801 | 50.838 | 0.91 | 59.41 | 41.46 | 0.58 | − | −24.1 | 0.98 | − |
| ILTJ114749.90 + 504605.4 | C | 176.958 | 50.768 | 2.13 | 18.4 | 9.66 | 0.24 | − | −24.53 | 0.08 | − |
| ILTJ114837.17 + 554500.6 | UFRI | 177.155 | 55.75 | 0.42 | 27.5 | 30.3 | 9.09 | 8.6 | −22.56 | 0.23 | − |
| ILTJ114845.60 + 554058.5 | UFRI | 177.19 | 55.683 | 0.46 | 265.06 | 22.14 | 6.64 | 7.43 | −22.39 | 0.43 | − |
| ILTJ115415.25 + 484454.7 | UFRII | 178.564 | 48.749 | 1.5 | 235.0 | 37.76 | 11.33 | − | −24.35 | 0.17 | − |
| ILTJ120132.45 + 552408.7 | C | 180.385 | 55.402 | 1.86 | 2.21 | 0.28 | 0.07 | 8.72 | −26.19 | 0.0 | − |
| ILTJ120435.95 + 485654.8 | FRII | 181.15 | 48.949 | 0.45 | 1615.12 | 241.03 | 72.31 | 8.34 | −24.48 | 0.65 | 175.5 |
| ILTJ120644.89 + 464336.6 | FRI | 181.687 | 46.727 | 0.84 | 157.96 | 28.13 | 8.44 | 8.2 | −23.57 | 0.34 | − |
| ILTJ121426.22 + 545306.5 | FRI | 183.609 | 54.885 | 2.92 | 17.04 | 5.2 | 1.56 | 8.47 | −25.17 | 0.08 | − |
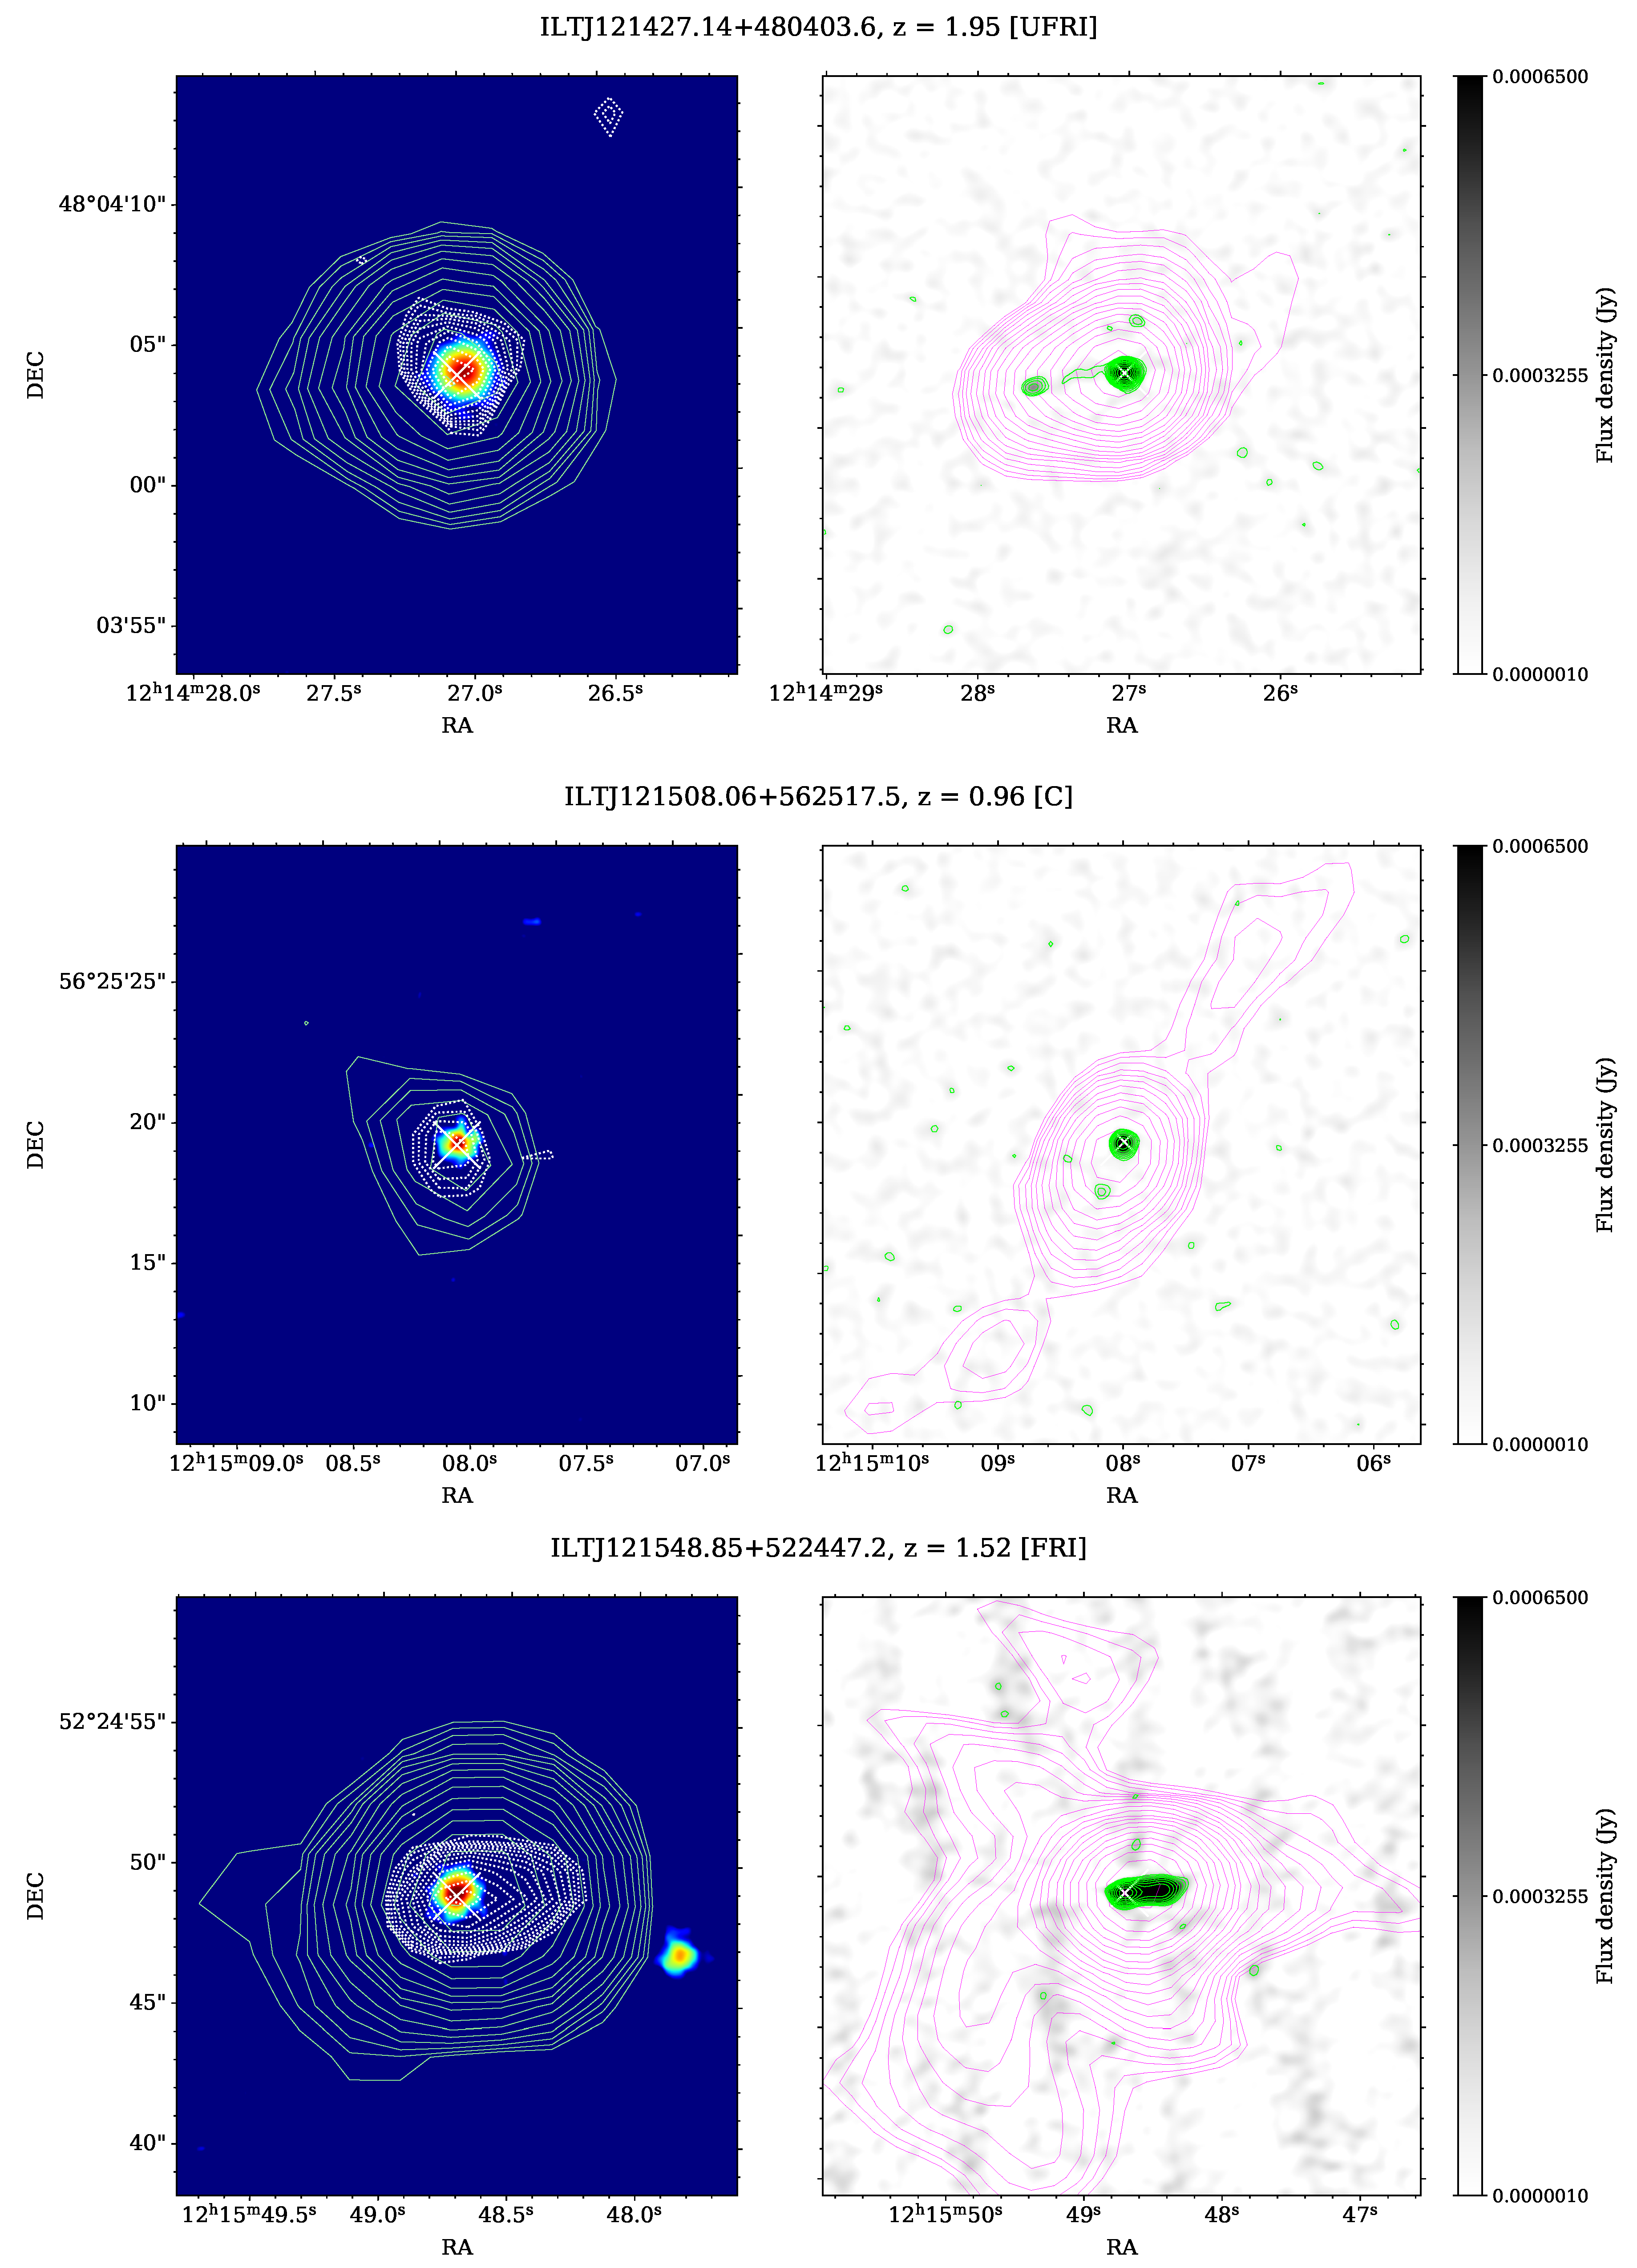
| ILTJ121427.14 + 480403.6 | UFRI | 183.613 | 48.068 | 1.95 | 17.85 | 6.29 | 1.89 | 8.8 | −26.89 | 0.06 | 7.346 |
| ILTJ121508.06 + 562517.5 | C | 183.784 | 56.422 | 0.96 | 6.15 | 1.38 | 0.06 | 8.39 | −23.13 | 0.05 | − |
| ILTJ121548.85 + 522447.2 | FRI | 183.954 | 52.413 | 1.52 | 61.39 | 12.39 | 3.72 | − | −24.77 | 0.26 | − |
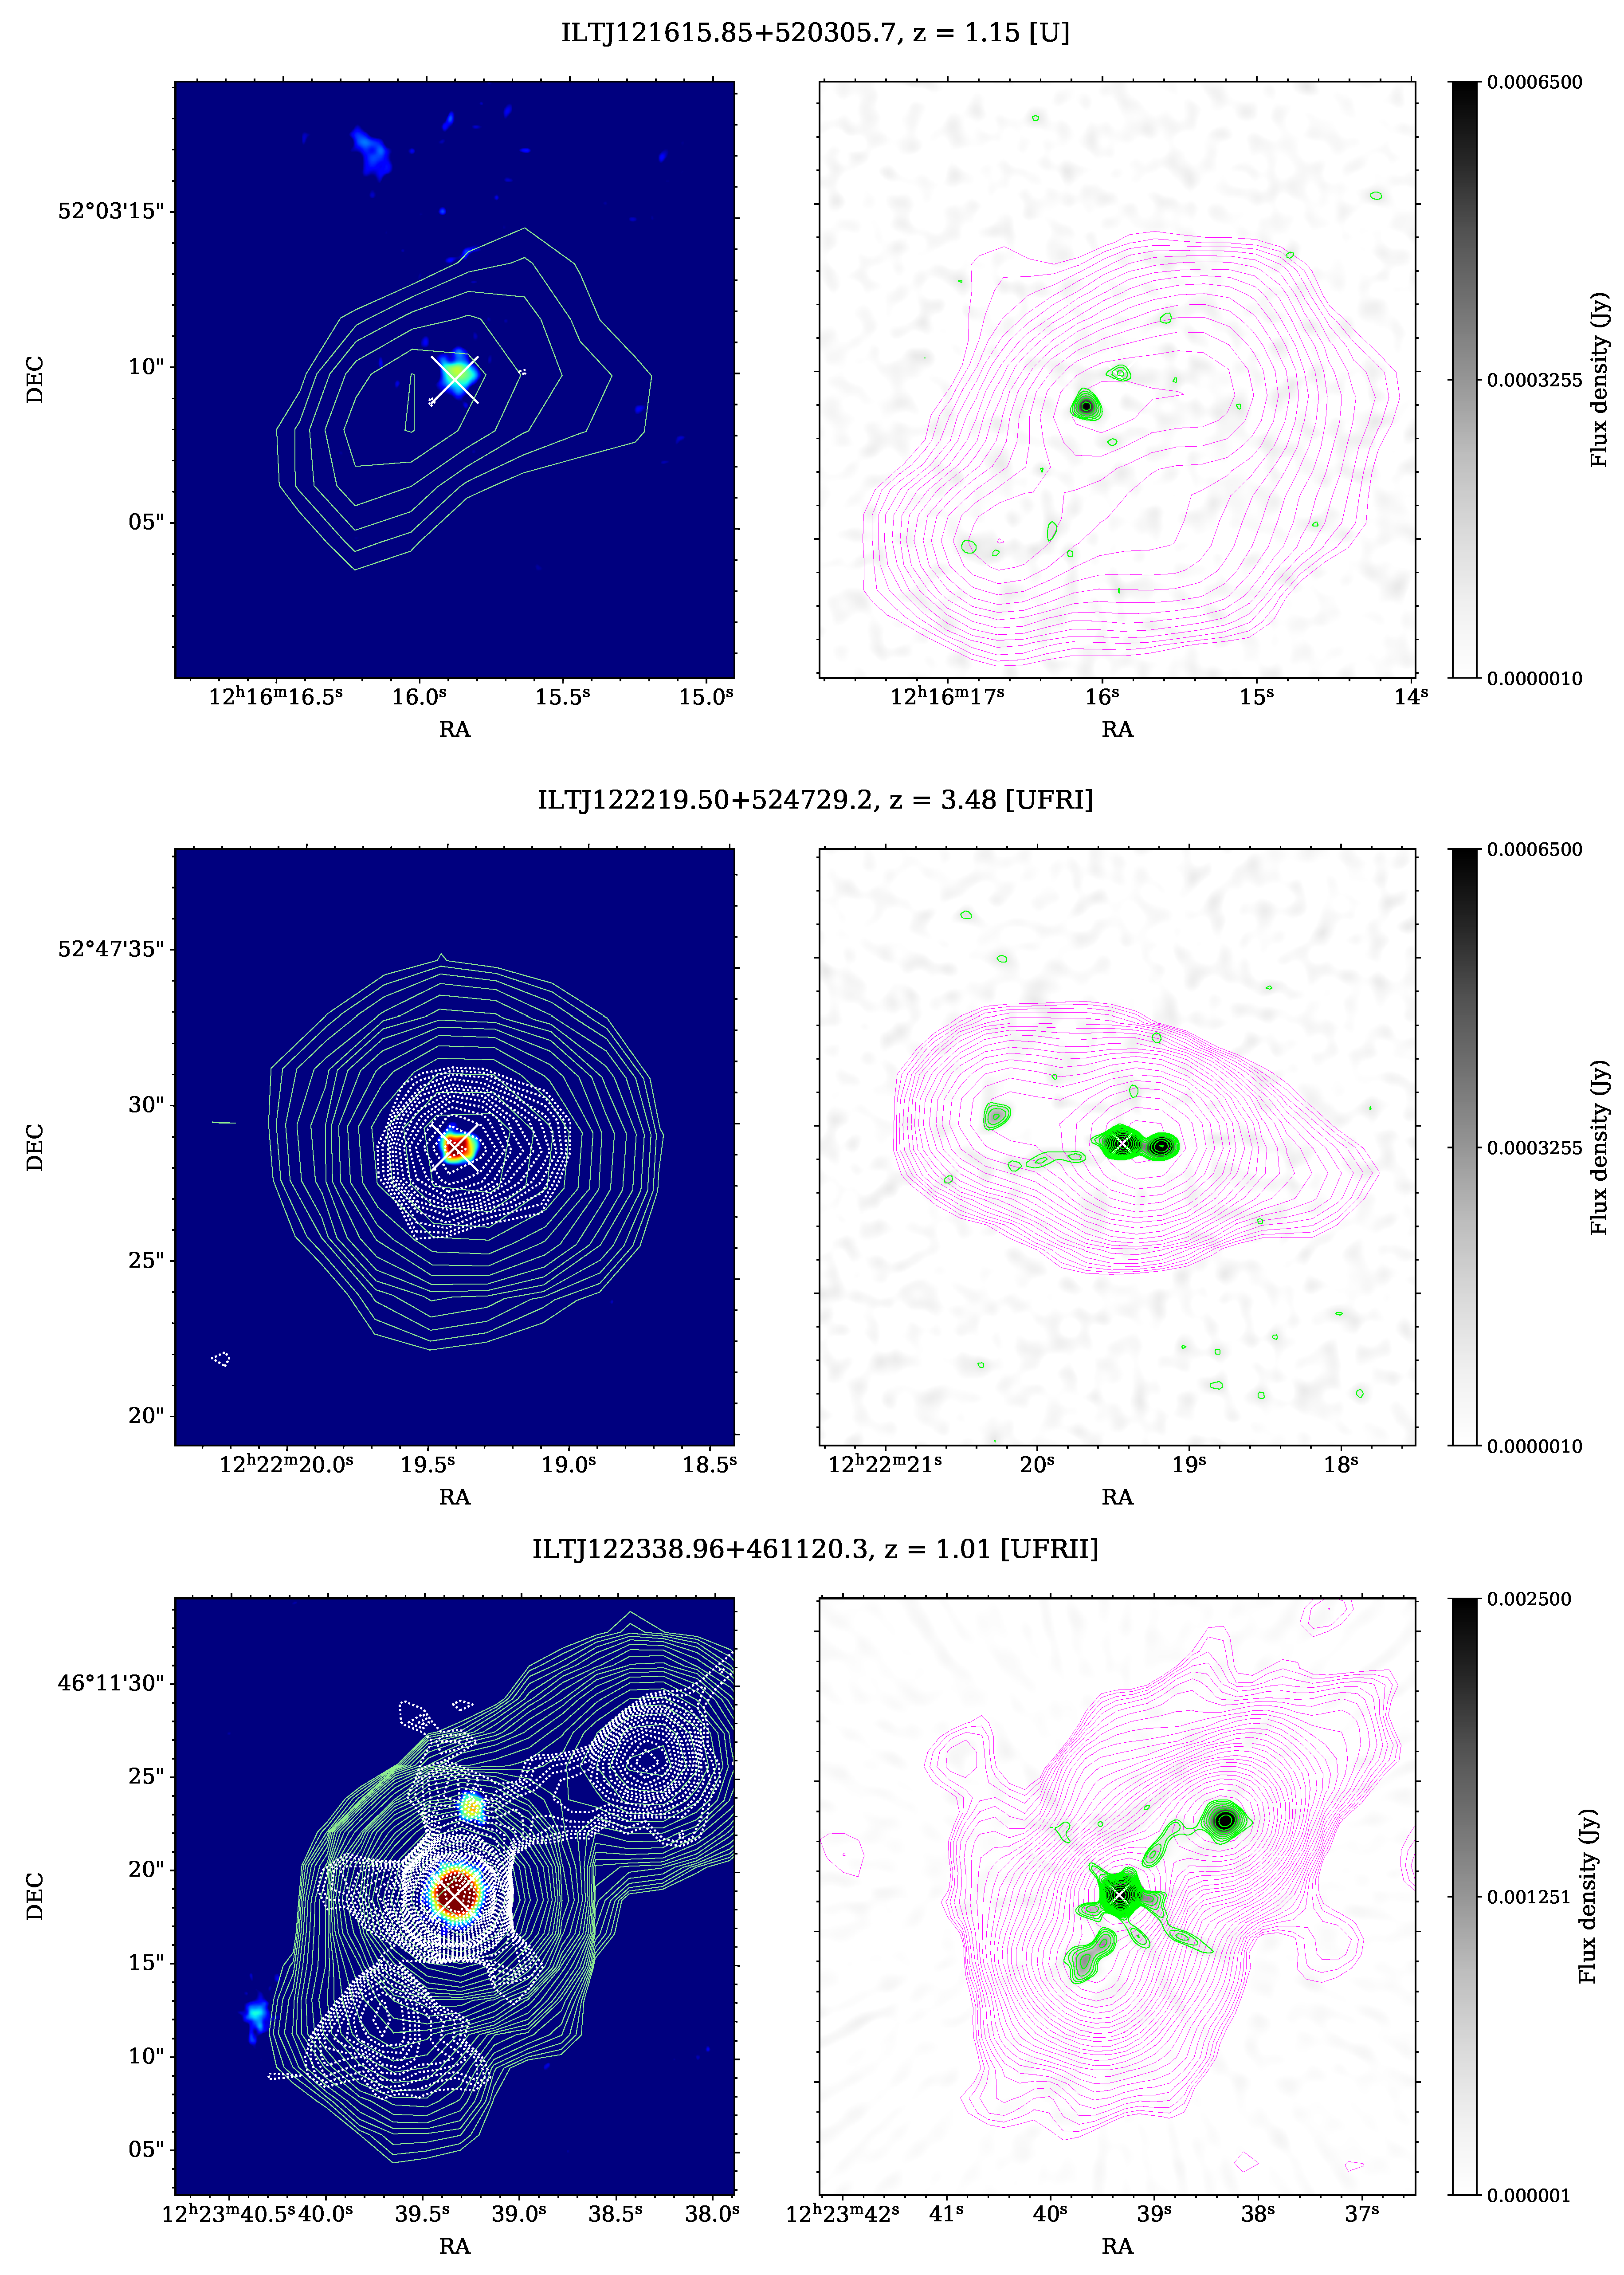
| ILTJ121615.85 + 520305.7 | U | 184.066 | 52.052 | 1.15 | 18.94 | 1.22 | 0.37 | − | −23.62 | 0.23 | − |
| ILTJ122219.50 + 524729.2 | UFRI | 185.581 | 52.791 | 3.48 | 24.66 | 8.34 | 2.5 | 9.65 | −25.6 | 0.07 | − |
| ILTJ122338.96 + 461120.3 | UFRII | 185.912 | 46.189 | 1.01 | 516.49 | 258.42 | 77.53 | 9.02 | −26.52 | 0.32 | 257.3 |
| ILTJ122434.28 + 470045.3 | C | 186.143 | 47.013 | 1.16 | 5.91 | 0.31 | 0.05 | − | −23.13 | 0.38 | − |
| ILTJ122437.94 + 500806.1 | U | 186.158 | 50.135 | 0.91 | 32.31 | 10.55 | 0.28 | − | −24.05 | 0.08 | − |
| ILTJ122849.97 + 495654.4 | U | 187.208 | 49.948 | 0.73 | 174.73 | 35.82 | 10.75 | − | −22.57 | 0.88 | − |
| ILTJ122909.25 + 552231.9 | U | 187.289 | 55.376 | 1.41 | 149.63 | 88.6 | 1.3 | 9.15 | −27.05 | 0.19 | 52.7 |
| ILTJ123315.85 + 492836.1 | FRI | 188.316 | 49.477 | 1.69 | 130.73 | 15.28 | 4.58 | − | −24.93 | 0.26 | − |
| ILTJ123530.80 + 522828.9 | U | 188.878 | 52.475 | 1.66 | 61.23 | 97.9 | 2.0 | 9.59 | −27.63 | 1.16 | 74.83 |
| ILTJ123639.59 + 494633.7 | U | 189.165 | 49.776 | 1.9 | 17.65 | 97.15 | 29.15 | − | −25.78 | 0.29 | − |
| ILTJ124339.80 + 500653.9 | UFRII | 190.916 | 50.115 | 1.43 | 61.18 | 3.72 | 1.12 | 9.11 | −24.91 | 0.93 | − |
| ILTJ124746.08 + 502251.6 | UFRII | 191.942 | 50.381 | 2.33 | 122.06 | 16.75 | 5.03 | 8.56 | −25.91 | 0.12 | 18.47 |
| ILTJ125959.20 + 560735.0 | FRI | 194.997 | 56.126 | 1.12 | 117.88 | 6.29 | 1.89 | 9.36 | −24.1 | 0.41 | 10.66 |
| ILTJ130106.27 + 545200.3 | C | 195.276 | 54.867 | 2.76 | 11.15 | 1.7 | 0.09 | 8.13 | −25.09 | 0.21 | − |
| ILTJ130350.03 + 484848.5 | UFRII | 195.958 | 48.813 | 0.6 | 418.74 | 84.17 | 25.25 | 8.71 | −24.33 | 0.31 | 45.18 |
| ILTJ131102.97 + 551353.7 | U | 197.762 | 55.232 | 0.93 | 586.88 | 242.7 | 5.0 | 8.69 | −25.22 | 0.09 | 226.3 |
| ILTJ131753.68 + 462449.5 | UFRI | 199.474 | 46.414 | 1.95 | 117.03 | 30.59 | 9.18 | 8.65 | −25.66 | 0.25 | − |
| ILTJ132348.54 + 540323.3 | U | 200.952 | 54.056 | 2.63 | 17.25 | 32.47 | 9.74 | 9.06 | −26.8 | 0.11 | − |
| ILTJ133653.87 + 530511.2 | U | 204.224 | 53.086 | 0.68 | 136.33 | 52.14 | 0.56 | − | −23.63 | 0.73 | − |
| ILTJ133707.41 + 545737.2 | C | 204.281 | 54.96 | 0.84 | 49.75 | 6.01 | 0.2 | 8.8 | −23.78 | 0.26 | 4.26 |
| ILTJ134350.61 + 480358.9 | U | 205.961 | 48.066 | 2.29 | 1178.27 | 310.7 | 2.9 | 8.74 | −26.16 | 0.06 | − |
| ILTJ141317.64 + 480826.8 | FRI | 213.323 | 48.141 | 1.24 | 28.28 | 6.26 | 1.88 | 9.58 | −25.3 | 0.12 | − |
| ILTJ141416.33 + 533509.4 | UFRI | 213.568 | 53.586 | 2.45 | 27.74 | 12.01 | 0.14 | − | −25.12 | 0.09 | − |
| ILTJ141419.55 + 491820.4 | FRI | 213.581 | 49.306 | 0.57 | 106.66 | 4.58 | 1.37 | 8.06 | −23.13 | 0.36 | − |
| ILTJ142741.62 + 520410.1 | FRI | 216.923 | 52.069 | 1.3 | 15.58 | 1.75 | 0.09 | − | −24.02 | 0.11 | − |
| ILTJ143306.31 + 455527.9 | UFRI | 218.276 | 45.924 | 2.47 | 13.73 | 1.8 | 0.54 | − | −25.02 | 0.58 | − |
| ILTJ144057.33 + 510619.6 | FRI | 220.239 | 51.105 | 1.64 | 37.22 | 6.68 | 2.01 | 8.64 | −26.09 | 0.11 | 6.385 |
| ILTJ144157.46 + 455453.7 | FRI | 220.489 | 45.915 | 1.97 | 18.26 | 2.48 | 0.74 | − | −24.46 | 0.29 | − |
| ILTJ144611.40 + 484615.2 | FRI | 221.548 | 48.771 | 1.2 | 27.27 | 9.6 | 0.12 | 9.37 | −26.09 | 0.3 | 10.53 |
| ILTJ151532.53 + 491525.9 | UFRI | 228.886 | 49.257 | 1.89 | 88.75 | 182.68 | 54.8 | 9.9 | -26.86 | 0.08 | 35.67 |


References
- Yang, J.; Wang, F.; Fan, X.; Hennawi, J.F.; Davies, F.B.; Yue, M.; Banados, E.; Wu, X.B.; Venemans, B.; Barth, A.J.; et al. Pōniuā’ena: A Luminous z = 7.5 Quasar Hosting a 1.5 Billion Solar Mass Black Hole. Astrophys. J. 2020, 897, L14. [Google Scholar] [CrossRef]
- Gürkan, G.; Hardcastle, M.J.; Jarvis, M.J. The Wide-field Infrared Survey Explorer properties of complete samples of radio-loud active galactic nucleus. Mon. Not. R. Astron. Soc. 2014, 438, 1149–1161. [Google Scholar] [CrossRef]
- Gürkan, G.; Hardcastle, M.J.; Best, P.N.; Morabito, L.K.; Prandoni, I.; Jarvis, M.J.; Duncan, K.J.; Calistro Rivera, G.; Callingham, J.R.; Cochrane, R.K.; et al. LoTSS/HETDEX: Optical quasars. I. Low-frequency radio properties of optically selected quasars. Astron. Astrophys. 2019, 622, A11. [Google Scholar] [CrossRef]
- Macfarlane, C.; Best, P.N.; Sabater, J.; Gurkan, G.; Jarvis, M.J.; Rottgering, H.J.A.; Baldi, R.D.; Calistro Rivera, G.; Duncan, K.J.; Morabito, L.K.; et al. The radio loudness of SDSS quasars from the LOFAR Two-metre Sky Survey: Ubiquitous jet activity and constraints on star formation. arXiv 2021, arXiv:2107.09141. [Google Scholar] [CrossRef]
- Gürkan, G.; Jackson, N.; Koopmans, L.V.E.; Fassnacht, C.D.; Berciano Alba, A. Measuring gravitational lens time delays using low-resolution radio monitoring observations. Mon. Not. R. Astron. Soc. 2014, 441, 127–135. [Google Scholar] [CrossRef][Green Version]
- McKean, J.P.; Luichies, R.; Drabent, A.; Gürkan, G.; Hartley, P.; Lafontaine, A.; Prandoni, I.; Röttgering, H.J.A.; Shimwell, T.W.; Stacey, H.R.; et al. Gravitational lensing in LoTSS DR2: Extremely faint 144-MHz radio emission from two highly magnified quasars. Mon. Not. R. Astron. Soc. 2021, 505, L36–L40. [Google Scholar] [CrossRef]
- Hartley, P.; Jackson, N.; Badole, S.; McKean, J.P.; Sluse, D.; Vives-Arias, H. Using strong lensing to understand the microJy radio emission in two radio quiet quasars at redshift 1.7. arXiv 2021, arXiv:2109.10720. [Google Scholar] [CrossRef]
- Hardcastle, M.J.; Croston, J.H. Radio galaxies and feedback from AGN jets. New Astron. Rev. 2020, 88, 101539. [Google Scholar] [CrossRef]
- Fanaroff, B.L.; Riley, J.M. The morphology of extragalactic radio sources of high and low luminosity. Mon. Not. R. Astron. Soc. 1974, 167, 31–36. [Google Scholar] [CrossRef]
- Miraghaei, H.; Best, P.N. The nuclear properties and extended morphologies of powerful radio galaxies: The roles of host galaxy and environment. Mon. Not. R. Astron. Soc. 2017, 466, 4346–4363. [Google Scholar] [CrossRef]
- Mingo, B.; Croston, J.H.; Hardcastle, M.J.; Best, P.N.; Duncan, K.J.; Morganti, R.; Rottgering, H.J.A.; Sabater, J.; Shimwell, T.W.; Williams, W.L.; et al. Revisiting the Fanaroff-Riley dichotomy and radio-galaxy morphology with the LOFAR Two-Metre Sky Survey (LoTSS). Mon. Not. R. Astron. Soc. 2019, 488, 2701–2721. [Google Scholar] [CrossRef]
- Macconi, D.; Torresi, E.; Grandi, P.; Boccardi, B.; Vignali, C. Radio morphology-accretion mode link in Fanaroff-Riley type II low-excitation radio galaxies. Mon. Not. R. Astron. Soc. 2020, 493, 4355–4366. [Google Scholar] [CrossRef]
- Grandi, P.; Torresi, E.; Macconi, D.; Boccardi, B.; Capetti, A. Jet-Accretion System in the Nearby mJy Radio Galaxies. Astrophys. J. Astrophys. J. 2021, 911, 17. [Google Scholar] [CrossRef]
- Vardoulaki, E.; Jiménez Andrade, E.F.; Delvecchio, I.; Smolčić, V.; Schinnerer, E.; Sargent, M.T.; Gozaliasl, G.; Finoguenov, A.; Bondi, M.; Zamorani, G.; et al. FR-type radio sources at 3 GHz VLA-COSMOS: Relation to physical properties and large-scale environment. Astron. Astrophys. 2021, 648, A102. [Google Scholar] [CrossRef]
- Baum, S.A.; Zirbel, E.L.; O’Dea, C.P. Toward Understanding the Fanaroff-Riley Dichotomy in Radio Source Morphology and Power. Astrophys. J. 1995, 451, 88. [Google Scholar] [CrossRef]
- Falcke, H.; Gopal-Krishna; Biermann, P.L. Unified schemes for active galaxies: A clue from the missing Fanaroff-Riley type I quasar population. Astron. Astrophys. 1995, 298, 395. [Google Scholar]
- Bennett, A.S. The preparation of the revised 3C catalogue of radio sources. Mon. Not. R. Astron. Soc. 1962, 125, 75. [Google Scholar] [CrossRef][Green Version]
- Laing, R.A.; Riley, J.M.; Longair, M.S. Bright radio sources at 178 MHz—Flux densities, optical identifications and the cosmological evolution of powerful radio galaxies. Mon. Not. R. Astron. Soc. 1983, 204, 151–187. [Google Scholar] [CrossRef]
- Blundell, K.M.; Lacy, M. A multi-radio-frequency study of the radio-quiet quasar E1821+643. Mon. Not. R. Astron. Soc. 1995, 274, L9–L13. [Google Scholar] [CrossRef]
- Heywood, I.; Blundell, K.M.; Rawlings, S. The prevalence of Fanaroff-Riley type I radio quasars. Mon. Not. R. Astron. Soc. 2007, 381, 1093–1102. [Google Scholar] [CrossRef][Green Version]
- Radcliffe, J.F.; Barthel, P.D.; Garrett, M.A.; Beswick, R.J.; Thomson, A.P.; Muxlow, T.W.B. The radio emission from active galactic nuclei. Astron. Astrophys. 2021, 649, L9. [Google Scholar] [CrossRef]
- Rigby, E.E.; Best, P.N.; Snellen, I.A.G. A sample of mJy radio sources at 1.4 GHz in the Lynx and Hercules fields—II. Cosmic evolution of the space density of FR I radio sources. Mon. Not. R. Astron. Soc. 2008, 385, 310–334. [Google Scholar] [CrossRef][Green Version]
- Shimwell, T.W.; Tasse, C.; Hardcastle, M.J.; Mechev, A.P.; Williams, W.L.; Best, P.N.; Röttgering, H.J.A.; Callingham, J.R.; Dijkema, T.J.; de Gasperin, F.; et al. The LOFAR Two-metre Sky Survey. II. First data release. Astron. Astrophys. 2019, 622, A1. [Google Scholar] [CrossRef]
- Myers, A.D.; Palanque-Delabrouille, N.; Prakash, A.; Pâris, I.; Yeche, C.; Dawson, K.S.; Bovy, J.; Lang, D.; Schlegel, D.J.; Newman, J.A.; et al. The SDSS-IV Extended Baryon Oscillation Spectroscopic Survey: Quasar Target Selection. Astrophys. J. 2015, 221, 27. [Google Scholar] [CrossRef]
- Ivezić, Ž.; Menou, K.; Knapp, G.R.; Strauss, M.A.; Lupton, R.H.; Vanden Berk, D.E.; Richards, G.T.; Tremonti, C.; Weinstein, M.A.; Anderson, S.; et al. Optical and Radio Properties of Extragalactic Sources Observed by the FIRST Survey and the Sloan Digital Sky Survey. Astron. J. 2002, 124, 2364–2400. [Google Scholar] [CrossRef]
- White, R.L.; Helfand, D.J.; Becker, R.H.; Glikman, E.; de Vries, W. Signals from the Noise: Image Stacking for Quasars in the FIRST Survey. Astrophys. J. 2007, 654, 99–114. [Google Scholar] [CrossRef]
- Mingo, B.; Hardcastle, M.J.; Croston, J.H.; Dicken, D.; Evans, D.A.; Morganti, R.; Tadhunter, C. An X-ray survey of the 2 Jy sample—I. Is there an accretion mode dichotomy in radio-loud AGN? Mon. Not. R. Astron. Soc. 2014, 440, 269–297. [Google Scholar] [CrossRef]
- Gürkan, G.; Hardcastle, M.J.; Jarvis, M.J.; Smith, D.J.B.; Bourne, N.; Dunne, L.; Maddox, S.; Ivison, R.J.; Fritz, J. Herschel-ATLAS: The connection between star formation and AGN activity in radio-loud and radio-quiet active galaxies. Mon. Not. R. Astron. Soc. 2015, 452, 3776–3794. [Google Scholar] [CrossRef]
- Planck Collaboration; Ade, P.A.R.; Aghanim, N.; Arnaud, M.; Ashdown, M.; Aumont, J.; Baccigalupi, C.; Banday, A.J.; Barreiro, R.B.; Bartlett, J.G.; et al. Planck 2015 results. XIII. Cosmological parameters. Astron. Astrophys. 2016, 594, A13. [Google Scholar] [CrossRef]
- Blanton, M.R.; Bershady, M.A.; Abolfathi, B.; Albareti, F.D.; Allende Prieto, C.; Almeida, A.; Alonso-García, J.; Anders, F.; Anderson, S.F.; Andrews, B.; et al. Sloan Digital Sky Survey IV: Mapping the Milky Way, Nearby Galaxies, and the Distant Universe. Astron. J. 2017, 154, 28. [Google Scholar] [CrossRef]
- Wright, E.L.; Eisenhardt, P.R.M.; Mainzer, A.K.; Ressler, M.E.; Cutri, R.M.; Jarrett, T.; Kirkpatrick, J.D.; Padgett, D.; McMillan, R.S.; Skrutskie, M.; et al. The Wide-field Infrared Survey Explorer (WISE): Mission Description and Initial On-orbit Performance. Astron. J. 2010, 140, 1868–1881. [Google Scholar] [CrossRef]
- Rau, A.; Kulkarni, S.R.; Law, N.M.; Bloom, J.S.; Ciardi, D.; Djorgovski, G.S.; Fox, D.B.; Gal-Yam, A.; Grillmair, C.C.; Kasliwal, M.M.; et al. Exploring the Optical Transient Sky with the Palomar Transient Factory. Publ. Astron. Soc. Pac. 2009, 121, 1334. [Google Scholar] [CrossRef]
- Law, N.M.; Kulkarni, S.R.; Dekany, R.G.; Ofek, E.O.; Quimby, R.M.; Nugent, P.E.; Surace, J.; Grillmair, C.C.; Bloom, J.S.; Kasliwal, M.M.; et al. The Palomar Transient Factory: System Overview, Performance, and First Results. Publ. Astron. Soc. Pac. 2009, 121, 1395. [Google Scholar] [CrossRef]
- Pâris, I.; Petitjean, P.; Aubourg, É.; Myers, A.D.; Streblyanska, A.; Lyke, B.W.; Anderson, S.F.; Armengaud, É.; Bautista, J.; Blanton, M.R.; et al. The Sloan Digital Sky Survey Quasar Catalog: Fourteenth data release. Astron. Astrophys. 2018, 613, A51. [Google Scholar] [CrossRef]
- Williams, W.L.; Hardcastle, M.J.; Best, P.N.; Sabater, J.; Croston, J.H.; Duncan, K.J.; Shimwell, T.W.; Röttgering, H.J.A.; Nisbet, D.; Gürkan, G.; et al. The LOFAR Two-metre Sky Survey. III. First data release: Optical/infrared identifications and value-added catalogue. Astron. Astrophys. 2019, 622, A2. [Google Scholar] [CrossRef]
- Flewelling, H.A.; Magnier, E.A.; Chambers, K.C.; Heasley, J.N.; Holmberg, C.; Huber, M.E.; Sweeney, W.; Waters, C.Z.; Calamida, A.; Casertano, S.; et al. The Pan-STARRS1 Database and Data Products. Astrophys. J. 2020, 251, 7. [Google Scholar] [CrossRef]
- Becker, R.H.; White, R.L.; Helfand, D.J. The FIRST Survey: Faint Images of the Radio Sky at Twenty Centimeters. Astrophys. J. 1995, 450, 559. [Google Scholar] [CrossRef]
- Richards, G.T.; Strauss, M.A.; Fan, X.; Hall, P.B.; Jester, S.; Schneider, D.P.; Vanden Berk, D.E.; Stoughton, C.; Anderson, S.F.; Brunner, R.J.; et al. The Sloan Digital Sky Survey Quasar Survey: Quasar Luminosity Function from Data Release 3. Astron. J. 2006, 131, 2766–2787. [Google Scholar] [CrossRef]
- Shen, Y.; Richards, G.T.; Strauss, M.A.; Hall, P.B.; Schneider, D.P.; Snedden, S.; Bizyaev, D.; Brewington, H.; Malanushenko, V.; Malanushenko, E.; et al. A Catalog of Quasar Properties from Sloan Digital Sky Survey Data Release 7. Astrophys. J. 2011, 194, 45. [Google Scholar] [CrossRef]
- Kozłowski, S. Virial Black Hole Mass Estimates for 280,000 AGNs from the SDSS Broadband Photometry and Single-epoch Spectra. Astrophys. J. 2017, 228, 9. [Google Scholar] [CrossRef]
- Morabito, L.K.; Matthews, J.H.; Best, P.N.; Gürkan, G.; Jarvis, M.J.; Prandoni, I.; Duncan, K.J.; Hardcastle, M.J.; Kunert-Bajraszewska, M.; Mechev, A.P.; et al. The origin of radio emission in broad absorption line quasars: Results from the LOFAR Two-metre Sky Survey. Astron. Astrophys. 2019, 622, A15. [Google Scholar] [CrossRef]
- Offringa, A.R.; van de Gronde, J.J.; Roerdink, J.B.T.M. A morphological algorithm for improved radio-frequency interference detection. Astron. Astrophys. 2012, 539, A95. [Google Scholar] [CrossRef]
- McMullin, J.P.; Waters, B.; Schiebel, D.; Young, W.; Golap, K. CASA Architecture and Applications. Astronomical Data Analysis Software and Systems XVI. Astron. Soc. Pac. Conf. Ser. 2007, 376, 127. [Google Scholar]
- Clark, B.G. An efficient implementation of the algorithm ‘CLEAN’. Astron. Astrophys. 1980, 89, 377. [Google Scholar]
- Perley, R.A.; Butler, B.J. An Accurate Flux Density Scale from 50 MHz to 50 GHz. Astrophys. J. 2017, 230, 7. [Google Scholar] [CrossRef]
- Hardcastle, M.J.; Krause, M.G.H. Numerical modelling of the lobes of radio galaxies in cluster environments. Mon. Not. R. Astron. Soc. 2013, 430, 174–196. [Google Scholar] [CrossRef]
- Willott, C.J.; Rawlings, S.; Blundell, K.M.; Lacy, M. The emission line-radio correlation for radio sources using the 7C Redshift Survey. Mon. Not. R. Astron. Soc. 1999, 309, 1017–1033. [Google Scholar] [CrossRef]
- Hardcastle, M.J. A simulation-based analytic model of radio galaxies. Mon. Not. R. Astron. Soc. 2018, 475, 2768–2786. [Google Scholar] [CrossRef]
- Croston, J.H.; Ineson, J.; Hardcastle, M.J. Particle content, radio-galaxy morphology, and jet power: All radio-loud AGN are not equal. Mon. Not. R. Astron. Soc. 2018, 476, 1614–1623. [Google Scholar] [CrossRef]
- Klindt, L.; Alexander, D.M.; Rosario, D.J.; Lusso, E.; Fotopoulou, S. Fundamental differences in the radio properties of red and blue quasars: Evolution strongly favoured over orientation. Mon. Not. R. Astron. Soc. 2019, 488, 3109–3128. [Google Scholar] [CrossRef]
- Rosario, D.J.; Fawcett, V.A.; Klindt, L.; Alexander, D.M.; Morabito, L.K.; Fotopoulou, S.; Lusso, E.; Calistro Rivera, G. Fundamental differences in the radio properties of red and blue quasars: Insight from the LOFAR Two-metre Sky Survey (LoTSS). Mon. Not. R. Astron. Soc. 2020, 494, 3061–3079. [Google Scholar] [CrossRef]
- Lyke, B.W.; Higley, A.N.; McLane, J.N.; Schurhammer, D.P.; Myers, A.D.; Ross, A.J.; Dawson, K.; Chabanier, S.; Martini, P.; Busca, N.G.; et al. The Sloan Digital Sky Survey Quasar Catalog: Sixteenth Data Release. Astrophys. J. 2020, 250, 8. [Google Scholar] [CrossRef]
- Bicknell, G.V. Relativistic Jets and the Fanaroff-Riley Classification of Radio Galaxies. Astrophys. J. 1995, 101, 29. [Google Scholar] [CrossRef]
- Kaiser, C.R.; Alexander, P. A self-similar model for extragalactic radio sources. Mon. Not. R. Astron. Soc. 1997, 286, 215–222. [Google Scholar] [CrossRef]
- Meier, D.L.; Koide, S.; Uchida, Y. Magnetohydrodynamic Production of Relativistic Jets. Science 2001, 291, 84–92. [Google Scholar] [CrossRef]
- Kaiser, C.R.; Best, P.N. Luminosity function, sizes and FR dichotomy of radio-loud AGN. Mon. Not. R. Astron. Soc. 2007, 381, 1548–1560. [Google Scholar] [CrossRef]
- Blandford, R.D.; Znajek, R.L. Electromagnetic extraction of energy from Kerr black holes. Mon. Not. R. Astron. Soc. 1977, 179, 433–456. [Google Scholar] [CrossRef]
- Retana-Montenegro, E.; Röttgering, H.J.A. Probing the radio loud/quiet AGN dichotomy with quasar clustering. Astron. Astrophys. 2017, 600, A97. [Google Scholar] [CrossRef]
- Laing, R.A.; Bridle, A.H. Dynamical models for jet deceleration in the radio galaxy 3C 31. Mon. Not. R. Astron. Soc. 2002, 336, 1161–1180. [Google Scholar] [CrossRef]
- Tchekhovskoy, A.; Bromberg, O. Three-dimensional relativistic MHD simulations of active galactic nuclei jets: Magnetic kink instability and Fanaroff-Riley dichotomy. Mon. Not. R. Astron. Soc. 2016, 461, L46–L50. [Google Scholar] [CrossRef]
- Lietzen, H.; Heinämäki, P.; Nurmi, P.; Liivamägi, L.J.; Saar, E.; Tago, E.; Takalo, L.O.; Einasto, M. Large-scale environments of z < 0.4 active galaxies. Astron. Astrophys. 2011, 535, A21. [Google Scholar] [CrossRef]
- Barthel, P. Quasars and Radio Galaxies may BE Two of a Kind. Sci. Am. 1989, 260, 20. [Google Scholar] [CrossRef]
- Laing, R.A.; Canvin, J.R.; Bridle, A.H. The physics of jets in FR I radio galaxies. New Astron. Rev. 2003, 47, 577–579. [Google Scholar] [CrossRef]
- Laing, R.A.; Bridle, A.H. Systematic properties of decelerating relativistic jets in low-luminosity radio galaxies. Mon. Not. R. Astron. Soc. 2014, 437, 3405–3441. [Google Scholar] [CrossRef]
- Aceituno, J.; Sánchez, S.F.; Grupp, F.; Lillo, J.; Hernán-Obispo, M.; Benitez, D.; Montoya, L.M.; Thiele, U.; Pedraz, S.; Barrado, D.; et al. CAFE: Calar Alto Fiber-fed Échelle spectrograph. Astron. Astrophys. 2013, 552, A31. [Google Scholar] [CrossRef]
- Taylor, M.B. TOPCAT & STIL: Starlink Table/VOTable Processing Software. Astronomical Data Analysis Software and Systems XIV. Astron. Soc. Pac. Conf. Ser. 2005, 347, 29. [Google Scholar]


| Morphology Type | Counts |
|---|---|
| FRI | 15 |
| UFRI (Uncertain FRI) | 13 |
| FRII | 3 |
| UFRII (Uncertain FRII) | 6 |
| C (Unresolved/core dominated) | 9 |
| U (Uncertain) | 14 |
| Compared Populations and the Sample Size | AD Statistic | Critical Value | |
|---|---|---|---|
| FRI (9) | FRII (7) | −0.002 | 2.401 (0.05) |
| FRI + UFRI (18) | FRII (7) | −0.20 | 1.961 (0.05) |
| All FRIs (19) | All FRIIs (67) | −0.22 | 1.961 (0.05) |
| Compared Populations | AD Statistic | Critical Value | |
|---|---|---|---|
| FRI (15) | FRII (9) | 3.02 | 1.961 (0.05) |
| FRI + UFRI (28) | FRII (9) | 3.50 | 1.961 (0.05) |
| All FRIs (45) | All FRIIs (86) | 9.51 | 1.961 (0.05) |
| Compared Populations | AD Statistic | Critical Value | |
|---|---|---|---|
| FRI (9) | FRII (7) | 0.1 | 2.401 (0.05) |
| FRI + UFRI (18) | FRII (7) | 0.09 | 1.961 (0.05) |
| All FRIs (19) | All FRIIs (67) | 0.34 | 1.961 (0.05) |
Publisher’s Note: MDPI stays neutral with regard to jurisdictional claims in published maps and institutional affiliations. |
© 2021 by the authors. Licensee MDPI, Basel, Switzerland. This article is an open access article distributed under the terms and conditions of the Creative Commons Attribution (CC BY) license (https://creativecommons.org/licenses/by/4.0/).
Share and Cite
Gürkan, G.; Croston, J.; Hardcastle, M.J.; Mahatma, V.; Mingo, B.; Williams, W.L. Finding Rare Quasars: VLA Snapshot Continuum Survey of FRI Quasar Candidates Selected from the LOFAR Two-Metre Sky Survey (LoTSS). Galaxies 2022, 10, 2. https://doi.org/10.3390/galaxies10010002
Gürkan G, Croston J, Hardcastle MJ, Mahatma V, Mingo B, Williams WL. Finding Rare Quasars: VLA Snapshot Continuum Survey of FRI Quasar Candidates Selected from the LOFAR Two-Metre Sky Survey (LoTSS). Galaxies. 2022; 10(1):2. https://doi.org/10.3390/galaxies10010002
Chicago/Turabian StyleGürkan, Gülay, Judith Croston, Martin J. Hardcastle, Vijay Mahatma, Beatriz Mingo, and Wendy L. Williams. 2022. "Finding Rare Quasars: VLA Snapshot Continuum Survey of FRI Quasar Candidates Selected from the LOFAR Two-Metre Sky Survey (LoTSS)" Galaxies 10, no. 1: 2. https://doi.org/10.3390/galaxies10010002
APA StyleGürkan, G., Croston, J., Hardcastle, M. J., Mahatma, V., Mingo, B., & Williams, W. L. (2022). Finding Rare Quasars: VLA Snapshot Continuum Survey of FRI Quasar Candidates Selected from the LOFAR Two-Metre Sky Survey (LoTSS). Galaxies, 10(1), 2. https://doi.org/10.3390/galaxies10010002