
Evaluation of the Choroidal Thickness and Retinal Nerve Fiber Layer Thickness in Patients with Vasovagal Syncope

 ,
,  , ,
, ,
Abstract
1. Introduction
2. Materials and Methods
2.1. Patient Population
2.2. Head-Up Tilt Table Testing Protocol
2.3. Ophthalmic Examinations
2.4. Statistical Analysis
3. Results
4. Discussion
5. Conclusions
Author Contributions
Funding
Institutional Review Board Statement
Informed Consent Statement
Data Availability Statement
Conflicts of Interest
References
- Longo, S.; Legramante, J.M.; Rizza, S.; Federici, M. Vasovagal syncope: An overview of pathophysiological mechanisms. Eur. J. Intern. Med. 2023, 112, 6–14. [Google Scholar] [CrossRef] [PubMed]
- Sandhu, R.K.; Raj, S.R.; Thiruganasambandamoorthy, V.; Kaul, P.; Morillo, C.A.; Krahn, A.D.; Guzman, J.C.; Sheldon, R.S. Canadian Cardiovascular Society Clinical Practice Update on the Assessment and Management of Syncope. Can. J. Cardiol. 2020, 36, 1167–1177. [Google Scholar] [CrossRef]
- van Dijk, J.G.; van Rossum, I.A.; Thijs, R.D. Timing of Circulatory and Neurological Events in Syncope. Front. Cardiovasc. Med. 2020, 7, 36. [Google Scholar] [CrossRef] [PubMed]
- van Dijk, J.G.; van Rossum, I.A.; Thijs, R.D. The pathophysiology of vasovagal syncope: Novel insights. Auton. Neurosci. 2021, 236, 102899. [Google Scholar] [CrossRef]
- Pachon-M, J.C. Neurocardiogenic syncope: Pacemaker or cardioneuroablation? Heart Rhythm. 2020, 17, 829–830. [Google Scholar] [CrossRef] [PubMed]
- Pietrucha, A.Z. Endothelial function in vasovagal syncope. [published correction appears]. Expert. Rev. Cardiovasc. Ther. 2014, 12, 1387–1389, Erratum in Expert Rev. Cardiovasc. Ther. 2015, 13, 455–484. https://doi.org/10.1586/14779072.2015.1024484. [Google Scholar] [CrossRef]
- Reiner, A.; Fitzgerald, M.E.C.; Del Mar, N.; Li, C. Neural control of choroidal blood flow. Prog. Retin. Eye Res. 2018, 64, 96–130. [Google Scholar] [CrossRef]
- Motamed Shariati, M.; Khazaei, S.; Yaghoobi, M. Choroidal vascularity index in health and systemic diseases: A systematic review. Int. J. Retin. Vitr. 2024, 10, 87–96. [Google Scholar] [CrossRef]
- Shin, D.Y.; Hong, K.E.; Lee, N.Y.; Park, C.K.; Park, H.Y.L. Association of choroidal blood flow with autonomic dysfunction in patients with normal tension glaucoma. Sci. Rep. 2022, 12, 5136–5142. [Google Scholar] [CrossRef]
- Singh, S.R.; Vupparaboina, K.K.; Goud, A.; Dansingani, K.K.; Chhablani, J. Choroidal imaging biomarkers. Surv. Ophthalmol. 2019, 64, 312–333. [Google Scholar] [CrossRef]
- Aponte-Becerra, L.; Novak, P. Tilt Test: A Review. J. Clin. Neurophysiol. 2021, 38, 279–286. [Google Scholar] [CrossRef] [PubMed]
- van Zanten, S.; Sutton, R.; Hamrefors, V.; Fedorowski, A.; de Lange, F.J. Tilt table testing, methodology and practical insights for the clinic. Clin. Physiol. Funct. Imaging 2024, 44, 119–130. [Google Scholar] [CrossRef]
- Wei, X.; Balne, P.K.; Meissner, K.E.; Barathi, V.A.; Schmetterer, L.; Agrawal, R. Assessment of flow dynamics in retinal and choroidal microcirculation. Surv. Ophthalmol. 2018, 63, 646–664. [Google Scholar] [CrossRef] [PubMed]
- Piotrowski, R.; Baran, J.; Sikorska, A.; Krynski, T.; Kulakowski, P. Cardioneuroablation for Reflex Syncope: Efficacy and Effects on Autonomic Cardiac Regulation-A Prospective Randomized Trial. JACC Clin. Electrophysiol. 2023, 9, 85–95. [Google Scholar] [CrossRef] [PubMed]
- Aksu, T.; Davila, A.; Gupta, D. The “heart brain” and neuromodulation for vasovagal syncope. Auton. Neurosci. 2021, 236, 102892. [Google Scholar] [CrossRef]
- Liao, Y.; Xu, W.R.; Li, H.X.; Tang, C.S.; Jin, H.F.; Du, J.B. Plasma Neuropeptide Y Levels in Vasovagal Syncope in Children. Chin. Med. J. 2017, 130, 2778–2784. [Google Scholar] [CrossRef]
- Gallegos, A.; Márquez-Velasco, R.; Allende, R.; Gómez-Flores, J.R.; Cázares-Campos, I.; González-Hermosillo, A.; Bojalil, R.; Cárdenas, M.; Márquez, M.F. Serum concentrations of nitric oxide and soluble tumor necrosis factor receptor 1 (sTNFR1) in vasovagal syncope: Effect of orthostatic challenge. Int. J. Cardiol. 2013, 167, 2321–2322. [Google Scholar] [CrossRef]
- Hétu, S.; Pouliot, M.; Cordahi, G.; Couture, R.; Vaucher, E. Assessment of retinal and choroidal blood flow changes using laser Doppler flowmetry in rats. Curr. Eye Res. 2013, 38, 158–167. [Google Scholar] [CrossRef]
- Finzi, A.; Cellini, M.; Strobbe, E.; Campos, E.C. ET-1 plasma levels, choroidal thickness and multifocal electroretinogram in retinitis pigmentosa. Life Sci. 2014, 118, 386–390. [Google Scholar] [CrossRef]
- Li, C.; Fitzgerald, M.E.; Del Mar, N.; Reiner, A. Stimulation of Baroresponsive Parts of the Nucleus of the Solitary Tract Produces Nitric Oxide-mediated Choroidal Vasodilation in Rat Eye. Front. Neuroanat. 2016, 10, 94. [Google Scholar] [CrossRef] [PubMed]
- Erdinest, N.; London, N.; Ovadia, H.; Levinger, N. Nitric Oxide Interaction with the Eye. Vision 2021, 5, 29. [Google Scholar] [CrossRef] [PubMed] [PubMed Central]
- Kim, Y.H.; Oh, J. Choroidal Thickness Profile in Chorioretinal Diseases: Beyond the Macula. Front. Med. 2021, 8, 797428. [Google Scholar] [CrossRef]
- Sinawat, S.; Thongmee, W.; Sanguansak, T.; Laovirojjanakul, W.; Sinawat, S.; Yospaiboon, Y. Oral Spironolactone versus Conservative Treatment for Non-Resolving Central Serous Chorioretinopathy in Real-Life Practice. Clin. Ophthalmol. 2020, 14, 1725–1734. [Google Scholar] [CrossRef]
- Steiner, M.; Esteban-Ortega, M.D.M.; Muñoz-Fernández, S. Choroidal and retinal thickness in systemic autoimmune and inflammatory diseases: A review. Surv. Ophthalmol. 2019, 64, 757–769. [Google Scholar] [CrossRef] [PubMed]
- Mathews, R.; Horo, S.; Jose, D.; Kavalakatt, J.A.; J, G.R.; John, S.S. Role of Psychological Stress and Choroidal Thickness in Central Serous Chorioretinopathy. Nepal. J. Ophthalmol. 2023, 15, 36–46. [Google Scholar] [CrossRef]
- Mukherji, S.; Karmakar, S.; Dasgupta, S. Association of Central serous chorioretinopathy with type of personality, anxiety and depression. Indian. J. Ophthalmol. 2024, 72, S60–S65. [Google Scholar] [CrossRef] [PubMed]
- Mansour, A.M.; Koaik, M.; Lima, L.H.; Casella, A.M.B.; Uwaydat, S.H.; Shahin, M.; Tamim, H.; Sanchez-Ruiz, M.J.; Mansour, H.A.; Dodwell, D. Physiologic and Psychologic Risk Factors in Central Serous Chorioretinopathy. Ophthalmol. Retin. 2017, 1, 497–507. [Google Scholar] [CrossRef]
- Abuzainah, B.; Gutlapalli, S.D.; Chaudhuri, D.; Khan, K.I.; Al Shouli, R.; Allakky, A.; Ferguson, A.A.; Khan, A.I.; Hamid, P. Anxiety and Depression as Risk Factors for Vasovagal Syncope and Potential Treatment Targets: A Systematic Review. Cureus 2022, 14, e32793. [Google Scholar] [CrossRef]
- Ng, J.; Sheldon, R.S.; Ritchie, D.; Raj, V.; Raj, S.R. Reduced quality of life and greater psychological distress in vasovagal syncope patients compared to healthy individuals. Pacing Clin. Electrophysiol. 2019, 42, 180–188. [Google Scholar] [CrossRef]
- Zabel, P.; Kałużny, J.J.; Wiłkość-Dębczyńska, M.; Gębska-Tołoczko, M.; Suwała, K.; Kucharski, R.; Araszkiewicz, A. Peripapillary Retinal Nerve Fiber Layer Thickness in Patients with Alzheimer’s Disease: A Comparison of Eyes of Patients with Alzheimer’s Disease, Primary Open-Angle Glaucoma, and Preperimetric Glaucoma and Healthy Controls. Med. Sci. Monit. 2019, 25, 1001–1008. [Google Scholar] [CrossRef] [PubMed] [PubMed Central]
- Rao, H.L.; Pradhan, Z.S.; Suh, M.H.; Moghimi, S.; Mansouri, K.; Weinreb, R.N. Optical Coherence Tomography Angiography in Glaucoma. J. Glaucoma 2020, 29, 312–321. [Google Scholar] [CrossRef] [PubMed] [PubMed Central]
- Deshpande, G.A.; Gupta, R.; Bawankule, P.; Raje, D.; Chakraborty, M. Evaluation of ganglion cell-inner plexiform layer thickness in the diagnosis of preperimetric glaucoma and comparison to retinal nerve fiber layer. Indian J. Ophthalmol. 2021, 69, 1113–1119. [Google Scholar] [CrossRef]
- Benagiano, V.; Rizzi, A.; Sannace, C.; Alessio, G.; Ribatti, D.; Dammacco, R. Aqueous humor as eye lymph: A crossroad between venous and lymphatic system. Exp. Eye Res. 2024, 243, 109904. [Google Scholar] [CrossRef]
- Brylla, E.; Tscheudschilsuren, G.; Santos, A.N.; Nieber, K.; Spanel-Borowski, K.; Aust, G. Differences between retinal and choroidal microvascular endothelial cells (MVECs) under normal and hypoxic conditions. Exp. Eye Res. 2003, 77, 527–535. [Google Scholar] [CrossRef]
- Vader, M.J.C.; Habani, Y.I.; Schlingemann, R.O.; Klaassen, I. miRNA Levels as a Biomarker for Anti-VEGF Response in Patients with Diabetic Macular Edema. J. Pers. Med. 2021, 11, 1297. [Google Scholar] [CrossRef] [PubMed]
- Hwang, S.; Kang, M.H.; Seong, M.; Cho, H.; Shin, Y.U. Swept-Source OCT Angiography Features in Patients after Macular Hole Surgery. J. Pers. Med. 2022, 12, 1493. [Google Scholar] [CrossRef]
- Sutton, R.; Brignole, M.; Menozzi, C.; Raviele, A.; Alboni, P.; Giani, P.; Moya, A. Dual-chamber pacing in the treatment of neurally mediated tilt-positive cardioinhibitory syncope: Pacemaker versus no therapy: A multicenter randomized study. The Vasovagal Syncope International Study (VASIS) Investigators. Circulation 2000, 102, 294–299. [Google Scholar] [CrossRef]

| Patients with VVS (n = 67) | Healthy Controls (n = 61) | p Value | |
|---|---|---|---|
| Age (years) | 35.2 ± 6.3 | 36.3 ± 7.4 | 0.13 |
| Gender (Female%) | 42(62.7%) | 35(57.4%) | 0.08 |
| Body mass index (kg/m2) | 22.4 ± 5.6 | 21.5 ± 3.9 | 0.23 |
| Smoking | 14(20.9%) | 12(19.6%) | 0.47 |
| SRE (D) | +0.71 ± 0.2 | +0.58 ± 0.3 | 0.55 |
| Axial length (mm) | 23.08 ± 0.4 | 22.98 ± 0.3 | 0.67 |
| Intraocular pressure (mm Hg) | 16.25 ± 5.3 | 18.04 ± 4.8 | 0.25 |
| Systolic BP (mmHg) | 108.3 ± 7.2 | 123.4 ± 9.3 | 0.22 |
| Diastolic BP (mmHg) | 76.7 ± 4.7 | 79.9 ± 5.9 | 0.12 |
| Mean BP (mmHg) | 86.7 ± 5.5 | 94.3 ± 6.9 | 0.19 |
| Participants with VVS (n = 67) | Healthy Controls (n = 61) | p Value | |
|---|---|---|---|
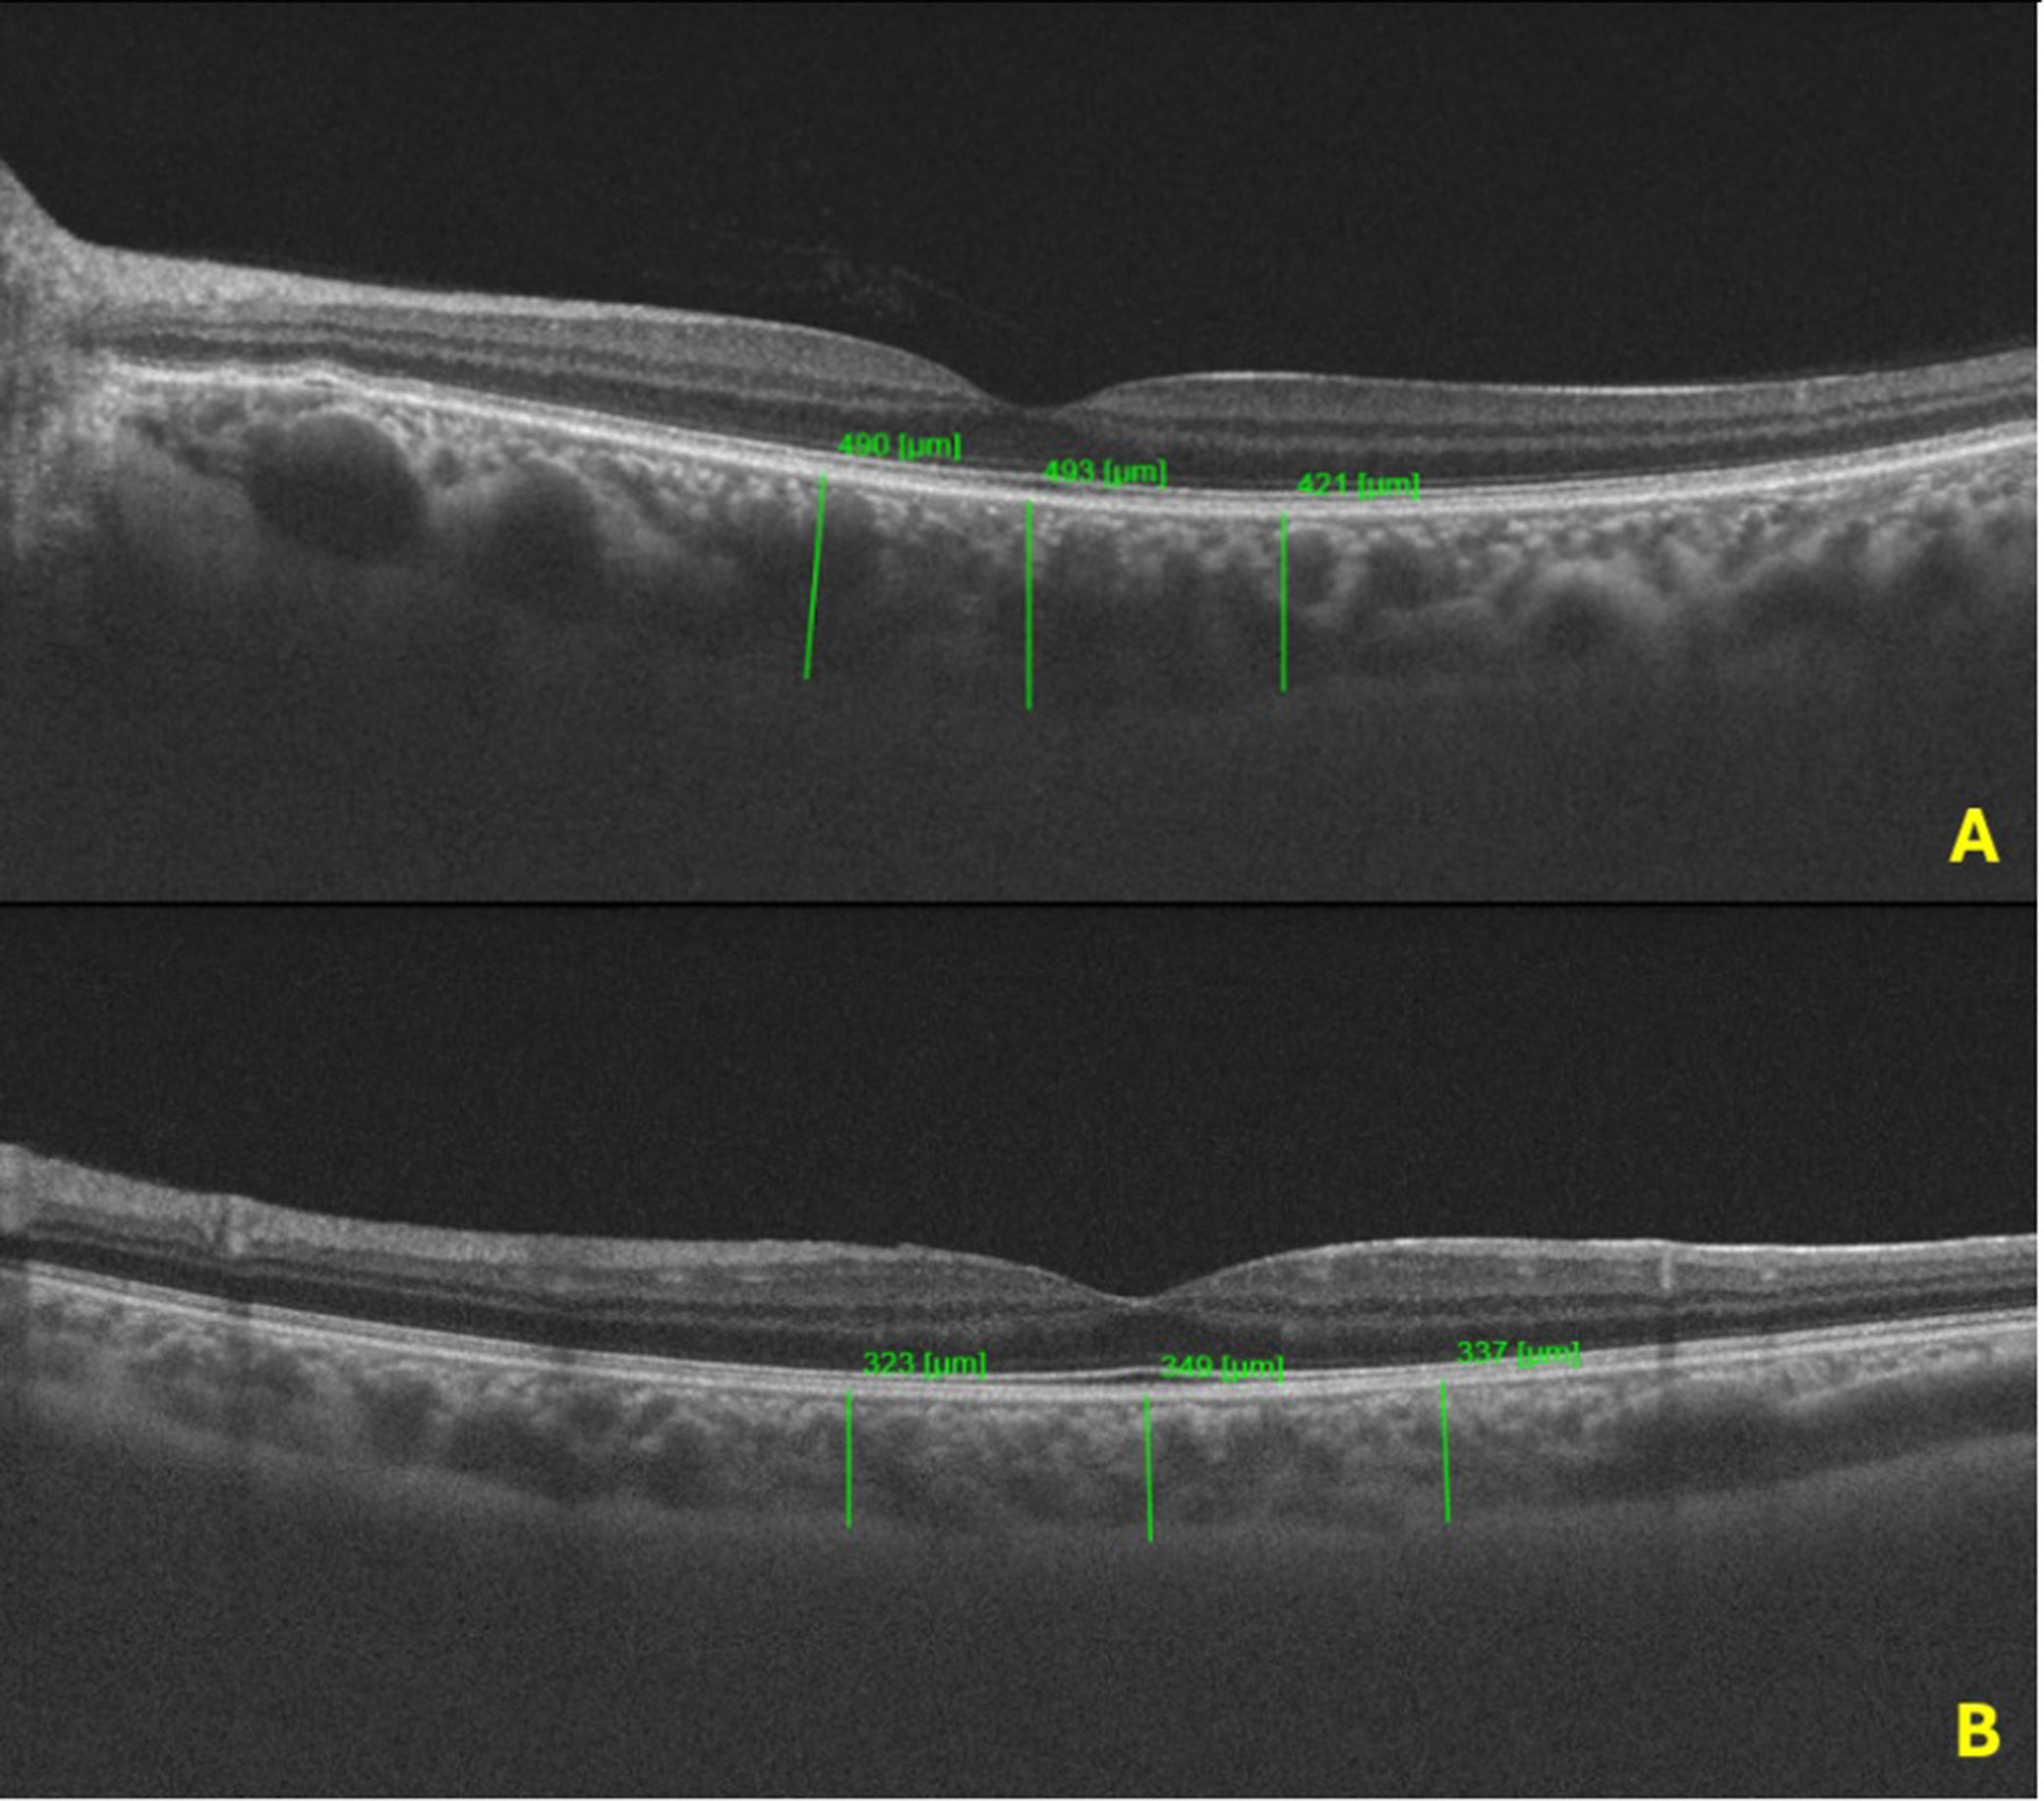
| Foveal CT (μm) | 408.7 ± 92.5 | 342.1 ± 60.2 | <0.001 |
| Nasal CT (μm) | 385.2 ± 98.3 | 329.2 ± 47.6 | <0.001 |
| Temporal CT (μm) | 379.5 ± 91.6 | 321.48 ± 43.2 | <0.001 |
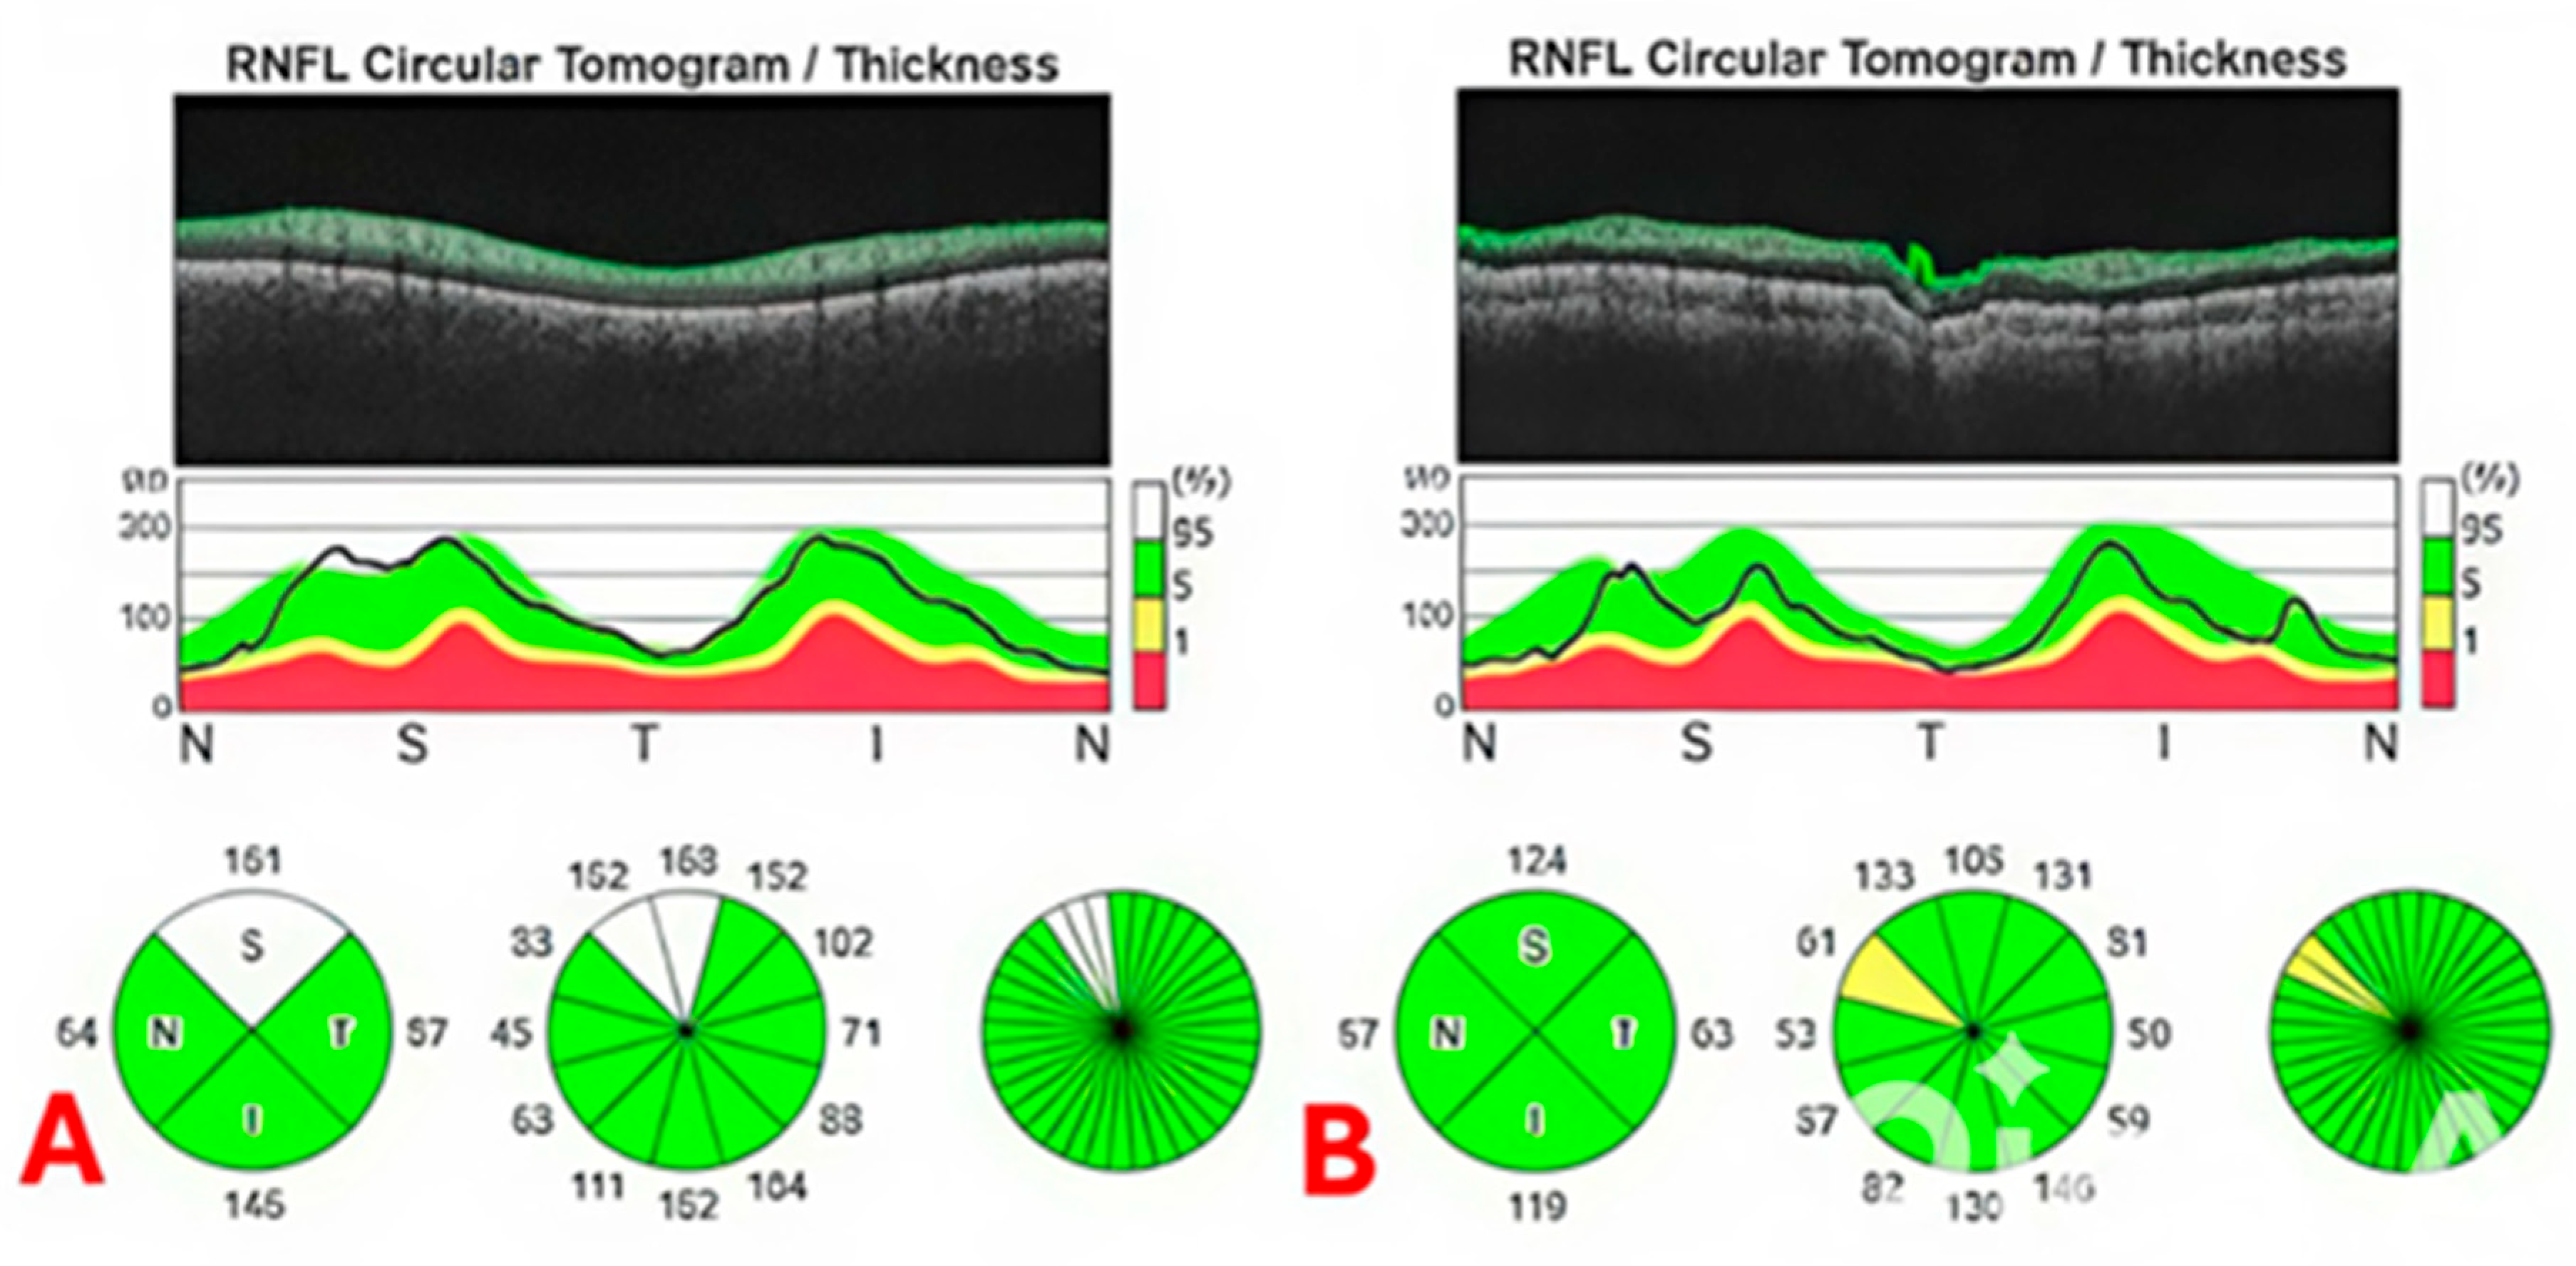
| Global pRNFLT (μm) | 106.7 ± 7.4 | 108.2 ± 6.2 | 0.11 |
| Inferior pRNFLT (μm) | 128.6 ± 8.3 | 129.2 ± 8.9 | 0.41 |
| Superior pRNFLT (μm) | 127.6 ± 7.9 | 129.8 ± 8.4 | 0.31 |
| Nasal pRNFLT (μm) | 86.5 ± 6.7 | 87.6 ± 6.3 | 0.24 |
| Temporal pRNFLT (μm) | 84.4 ± 6.5 | 86.2 ± 6.8 | 0.26 |
Disclaimer/Publisher’s Note: The statements, opinions and data contained in all publications are solely those of the individual author(s) and contributor(s) and not of MDPI and/or the editor(s). MDPI and/or the editor(s) disclaim responsibility for any injury to people or property resulting from any ideas, methods, instructions or products referred to in the content. |
© 2025 by the authors. Licensee MDPI, Basel, Switzerland. This article is an open access article distributed under the terms and conditions of the Creative Commons Attribution (CC BY) license (https://creativecommons.org/licenses/by/4.0/).
Share and Cite
Isleyen, H.B.; Kanar, B.G.; Akcay, G.; Demir, S.; Kanar, H.S.; Yazicioglu, M.V. Evaluation of the Choroidal Thickness and Retinal Nerve Fiber Layer Thickness in Patients with Vasovagal Syncope. J. Pers. Med. 2025, 15, 259. https://doi.org/10.3390/jpm15060259
Isleyen HB, Kanar BG, Akcay G, Demir S, Kanar HS, Yazicioglu MV. Evaluation of the Choroidal Thickness and Retinal Nerve Fiber Layer Thickness in Patients with Vasovagal Syncope. Journal of Personalized Medicine. 2025; 15(6):259. https://doi.org/10.3390/jpm15060259
Chicago/Turabian StyleIsleyen, Hasan B., Batur G. Kanar, Guzide Akcay, Serdar Demir, Hatice S. Kanar, and Mehmet V. Yazicioglu. 2025. "Evaluation of the Choroidal Thickness and Retinal Nerve Fiber Layer Thickness in Patients with Vasovagal Syncope" Journal of Personalized Medicine 15, no. 6: 259. https://doi.org/10.3390/jpm15060259
APA StyleIsleyen, H. B., Kanar, B. G., Akcay, G., Demir, S., Kanar, H. S., & Yazicioglu, M. V. (2025). Evaluation of the Choroidal Thickness and Retinal Nerve Fiber Layer Thickness in Patients with Vasovagal Syncope. Journal of Personalized Medicine, 15(6), 259. https://doi.org/10.3390/jpm15060259