
Genetic Predictors of Paxlovid Treatment Response: The Role of IFNAR2, OAS1, OAS3, and ACE2 in COVID-19 Clinical Course

 , ,
, ,  ,
,  ,
,  and
and 
Abstract
1. Introduction
2. Materials and Methods
2.1. Sample Collection
2.2. Laboratory and Clinical Data
2.3. Identifying Genetic Polymorphisms
2.4. Statistical Analysis
2.5. Power Analysis
3. Results
3.1. Baseline Patient Parameters
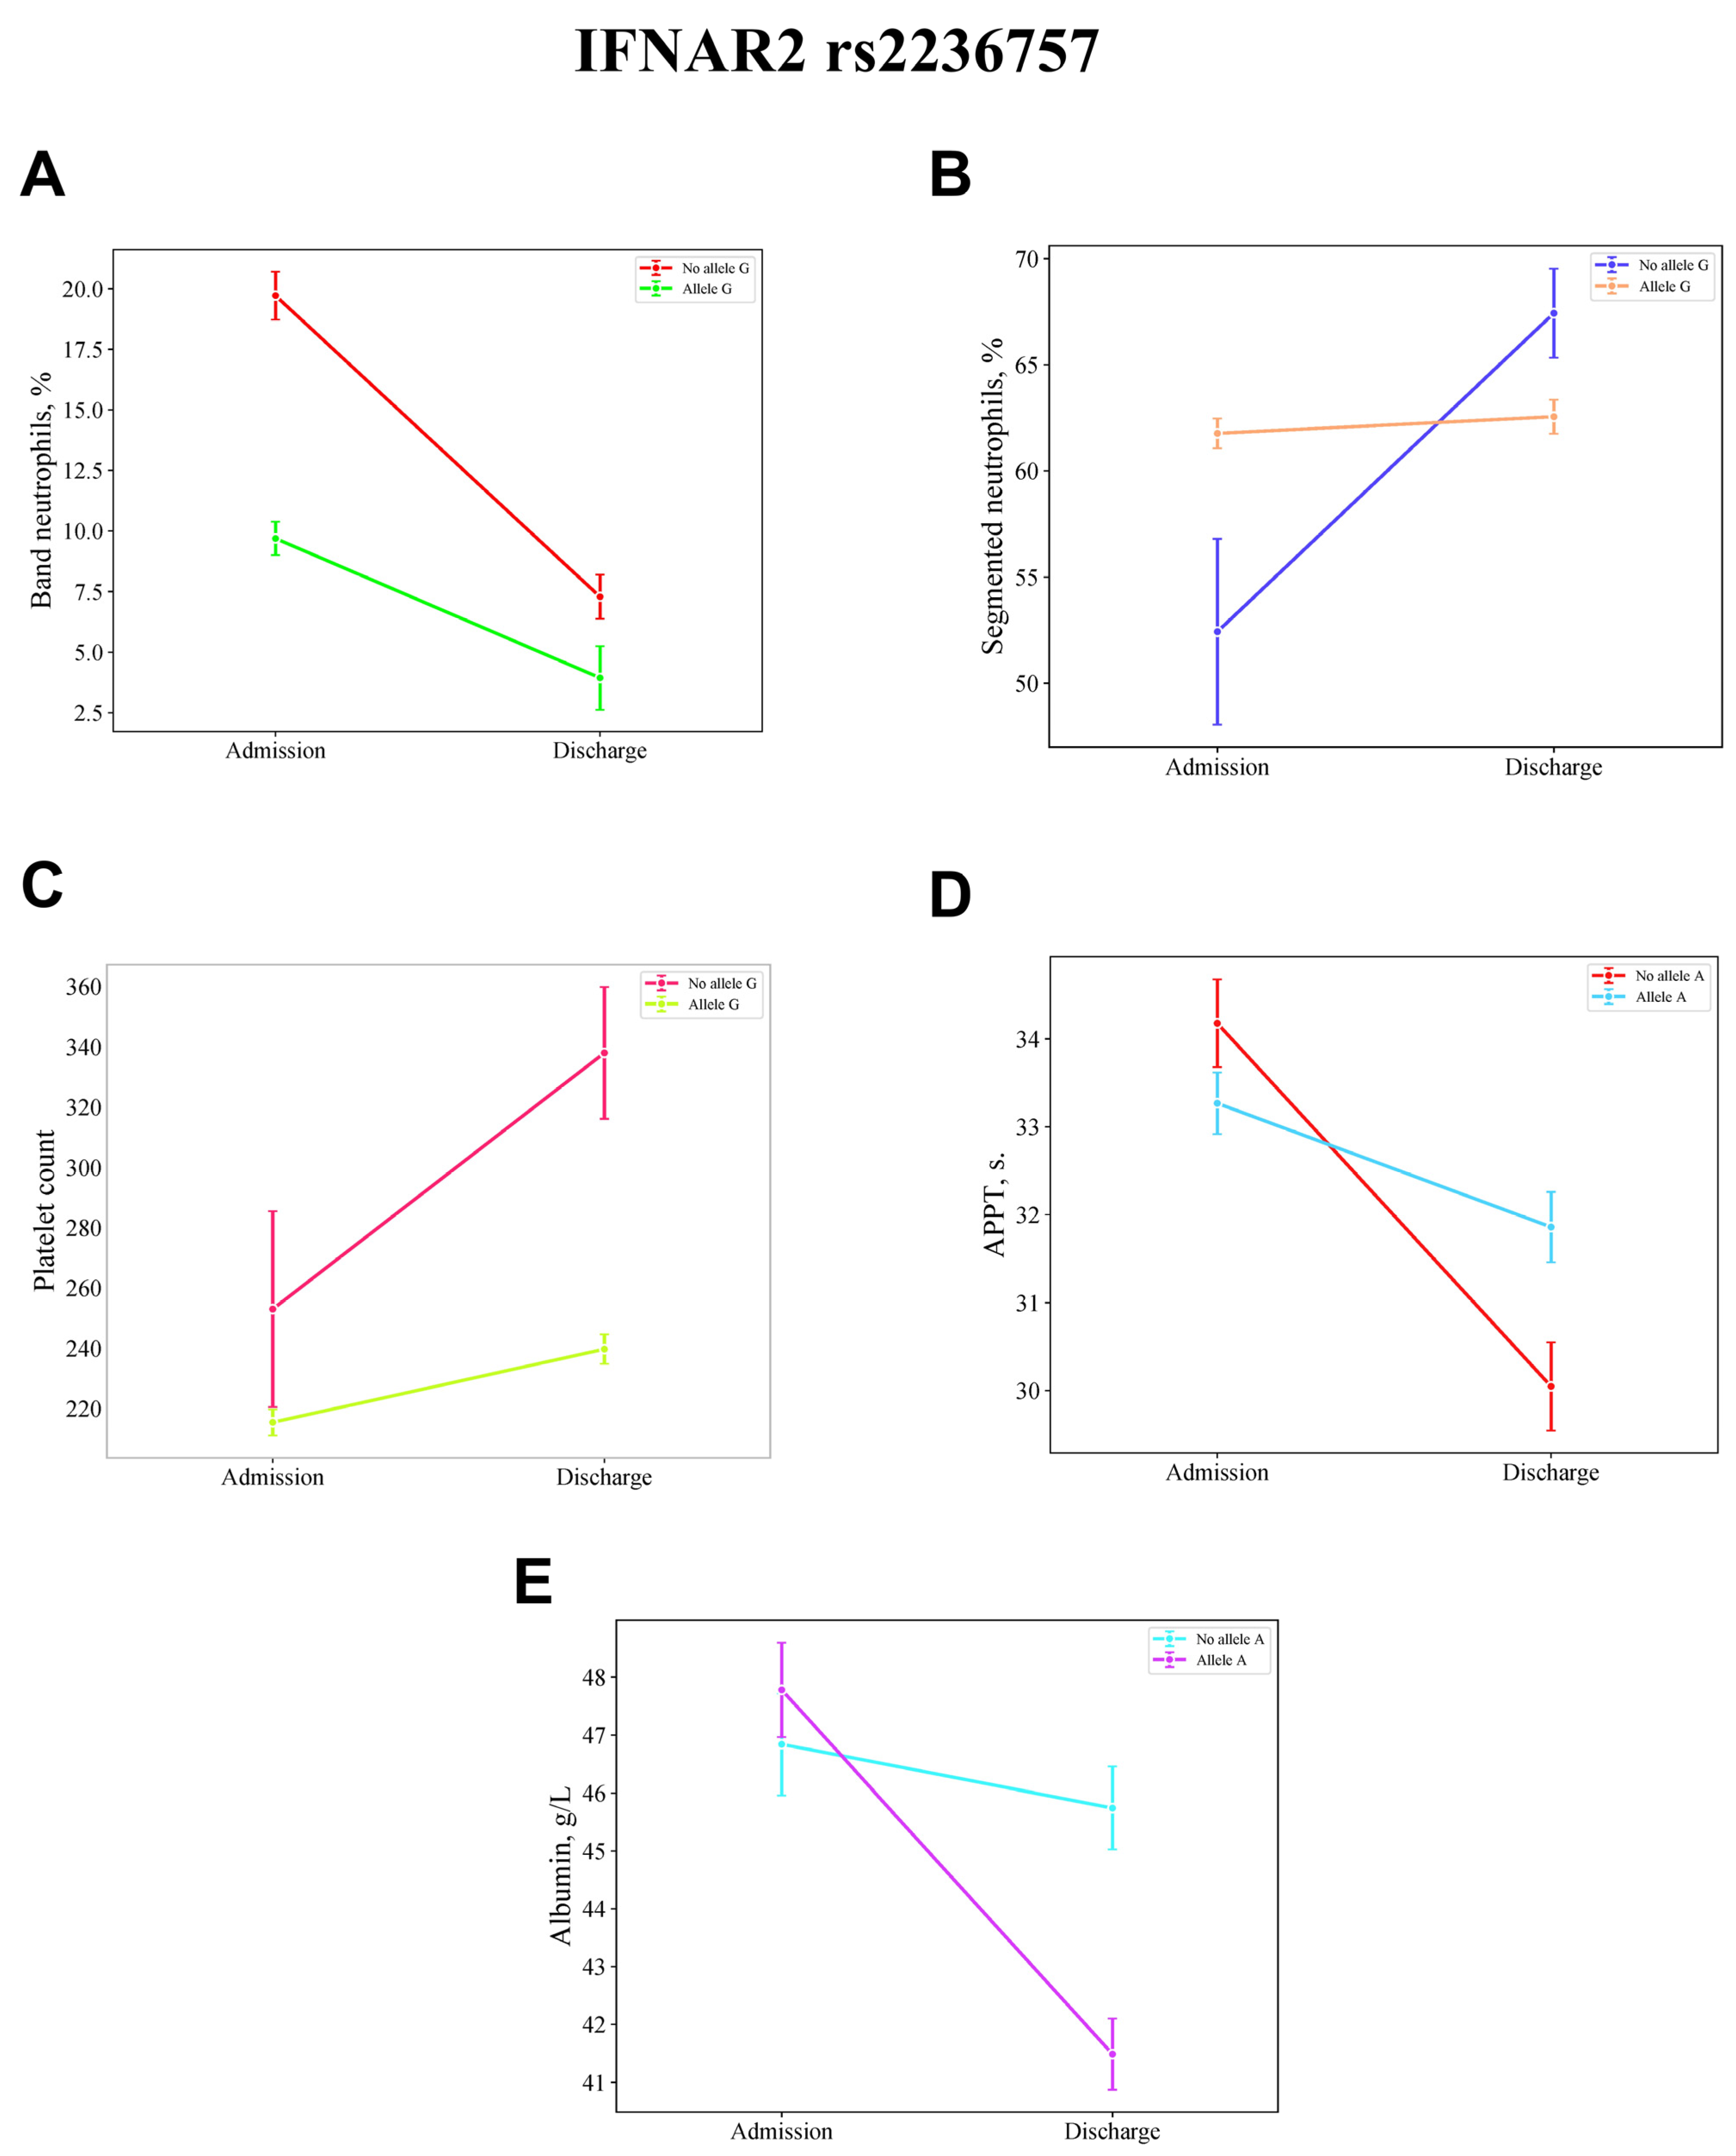
3.2. Alleles and Clinical Dynamics
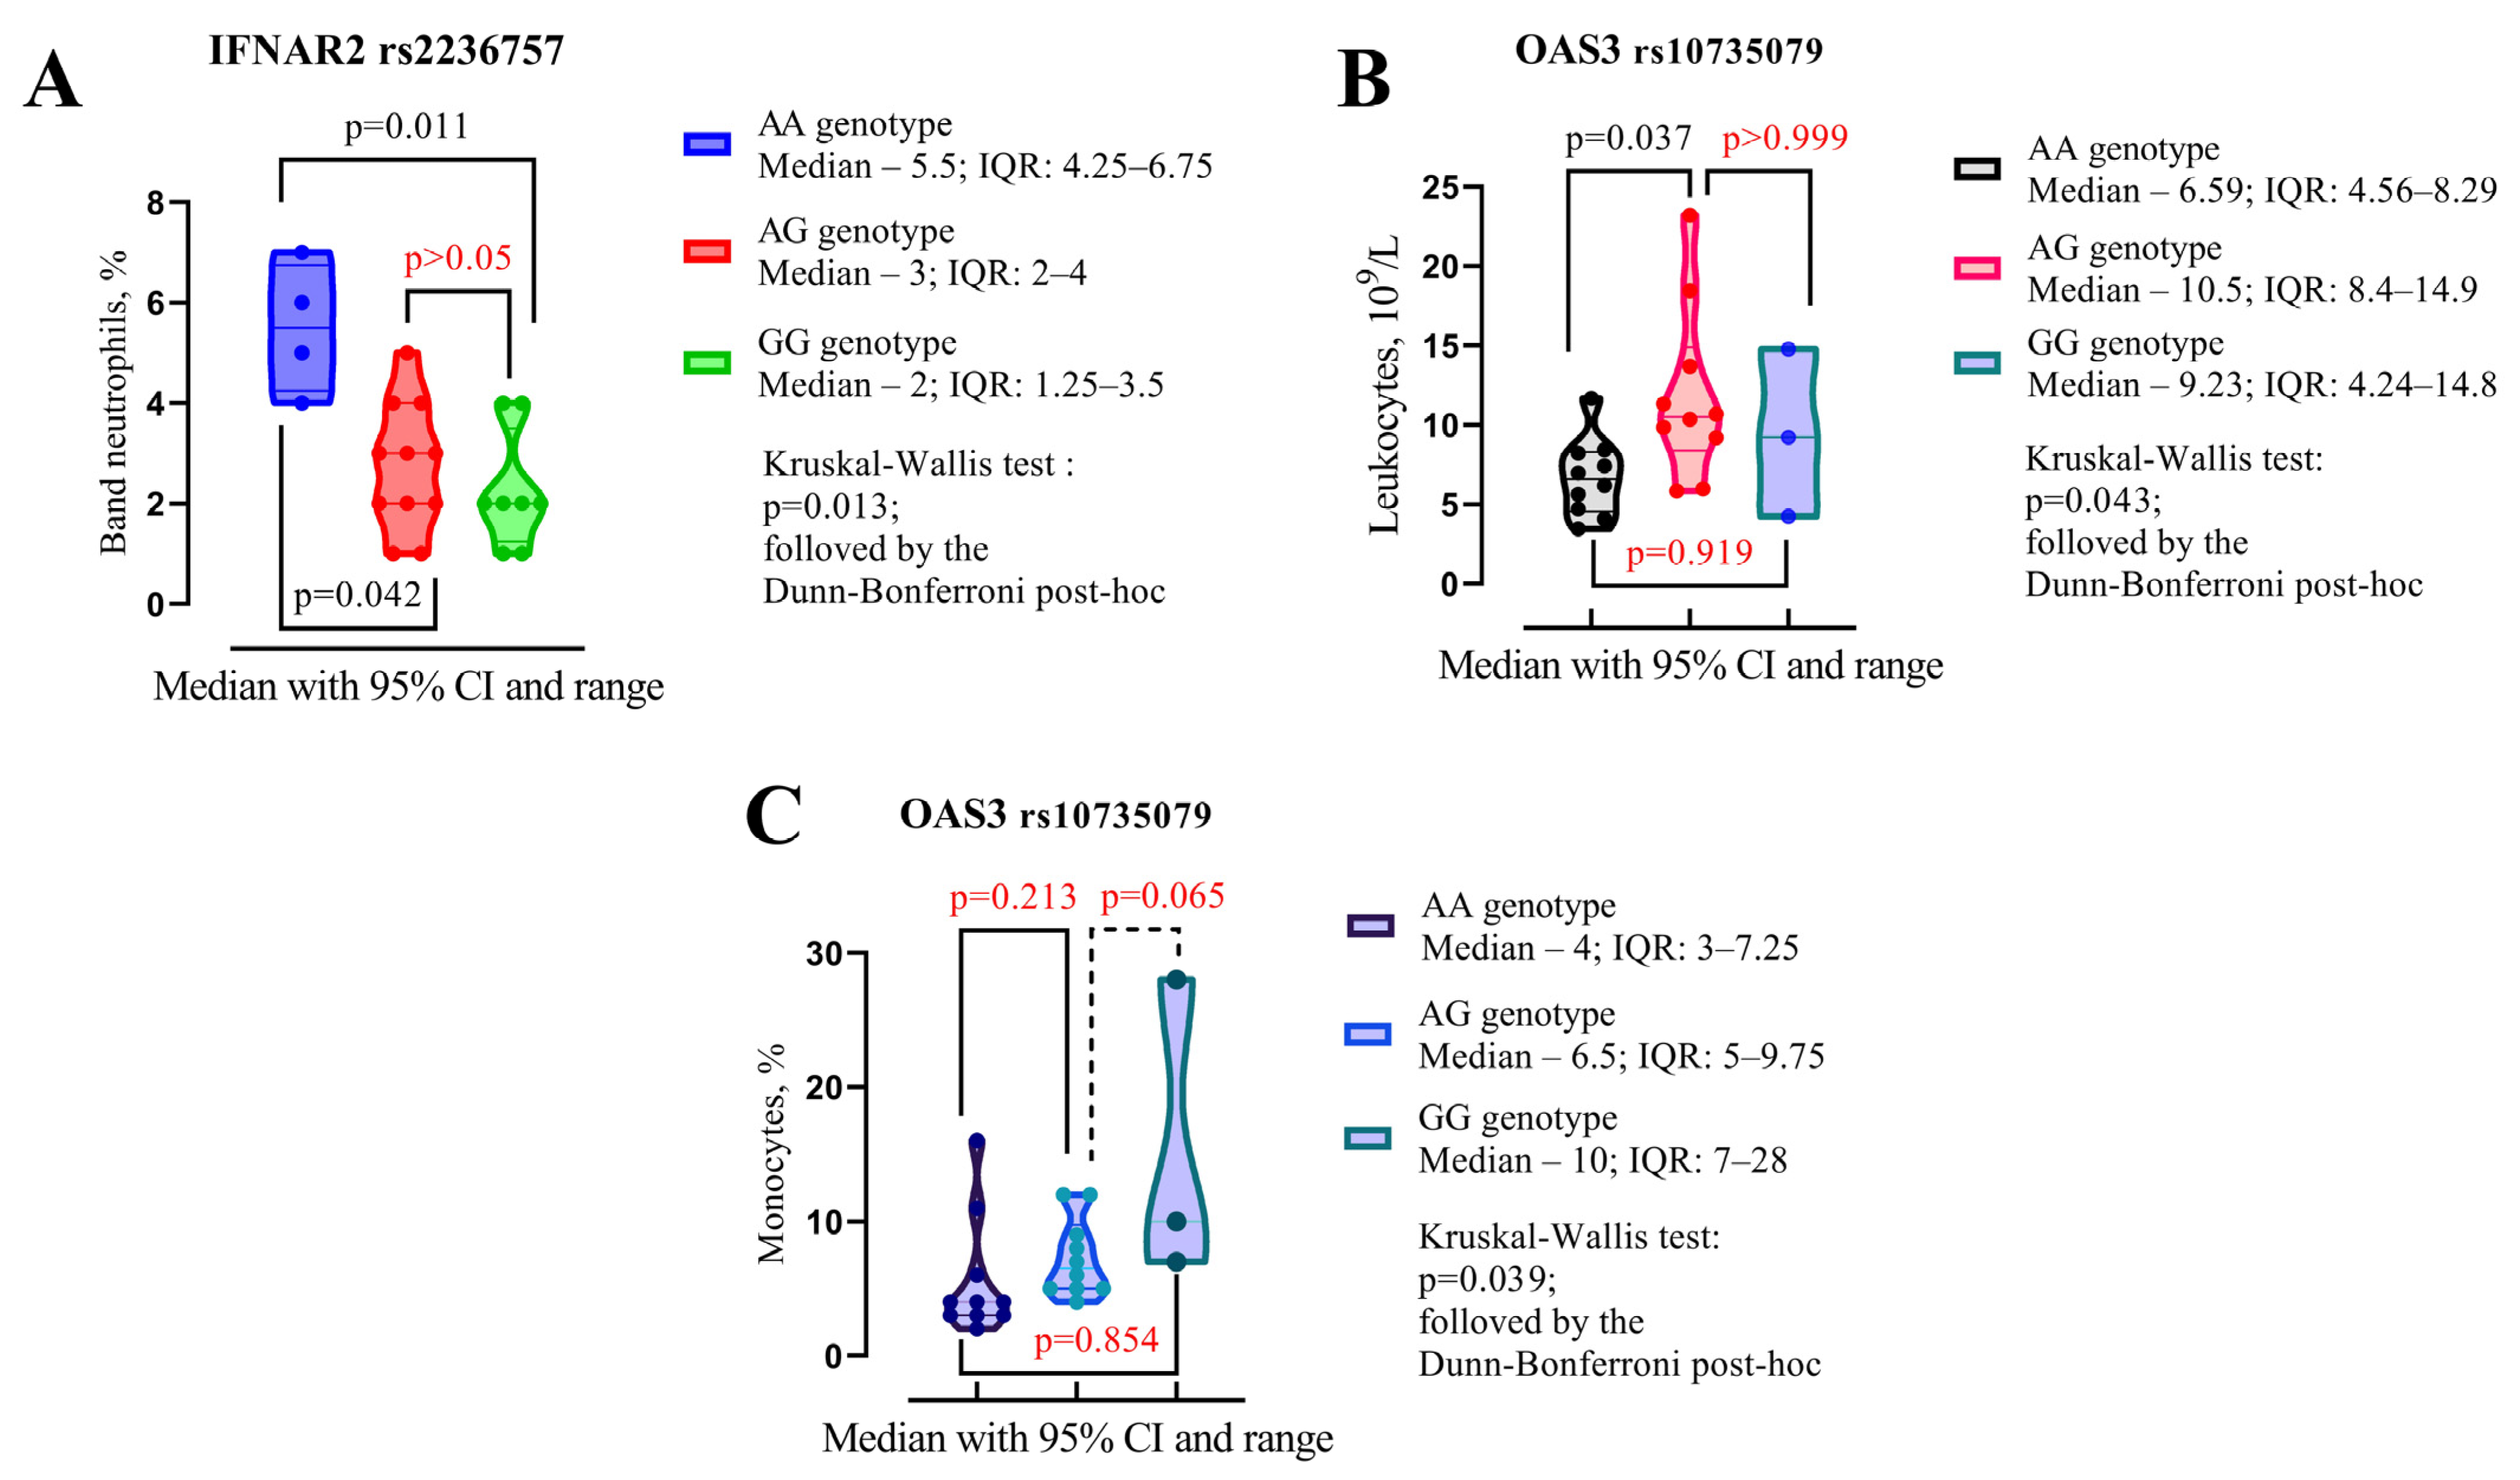
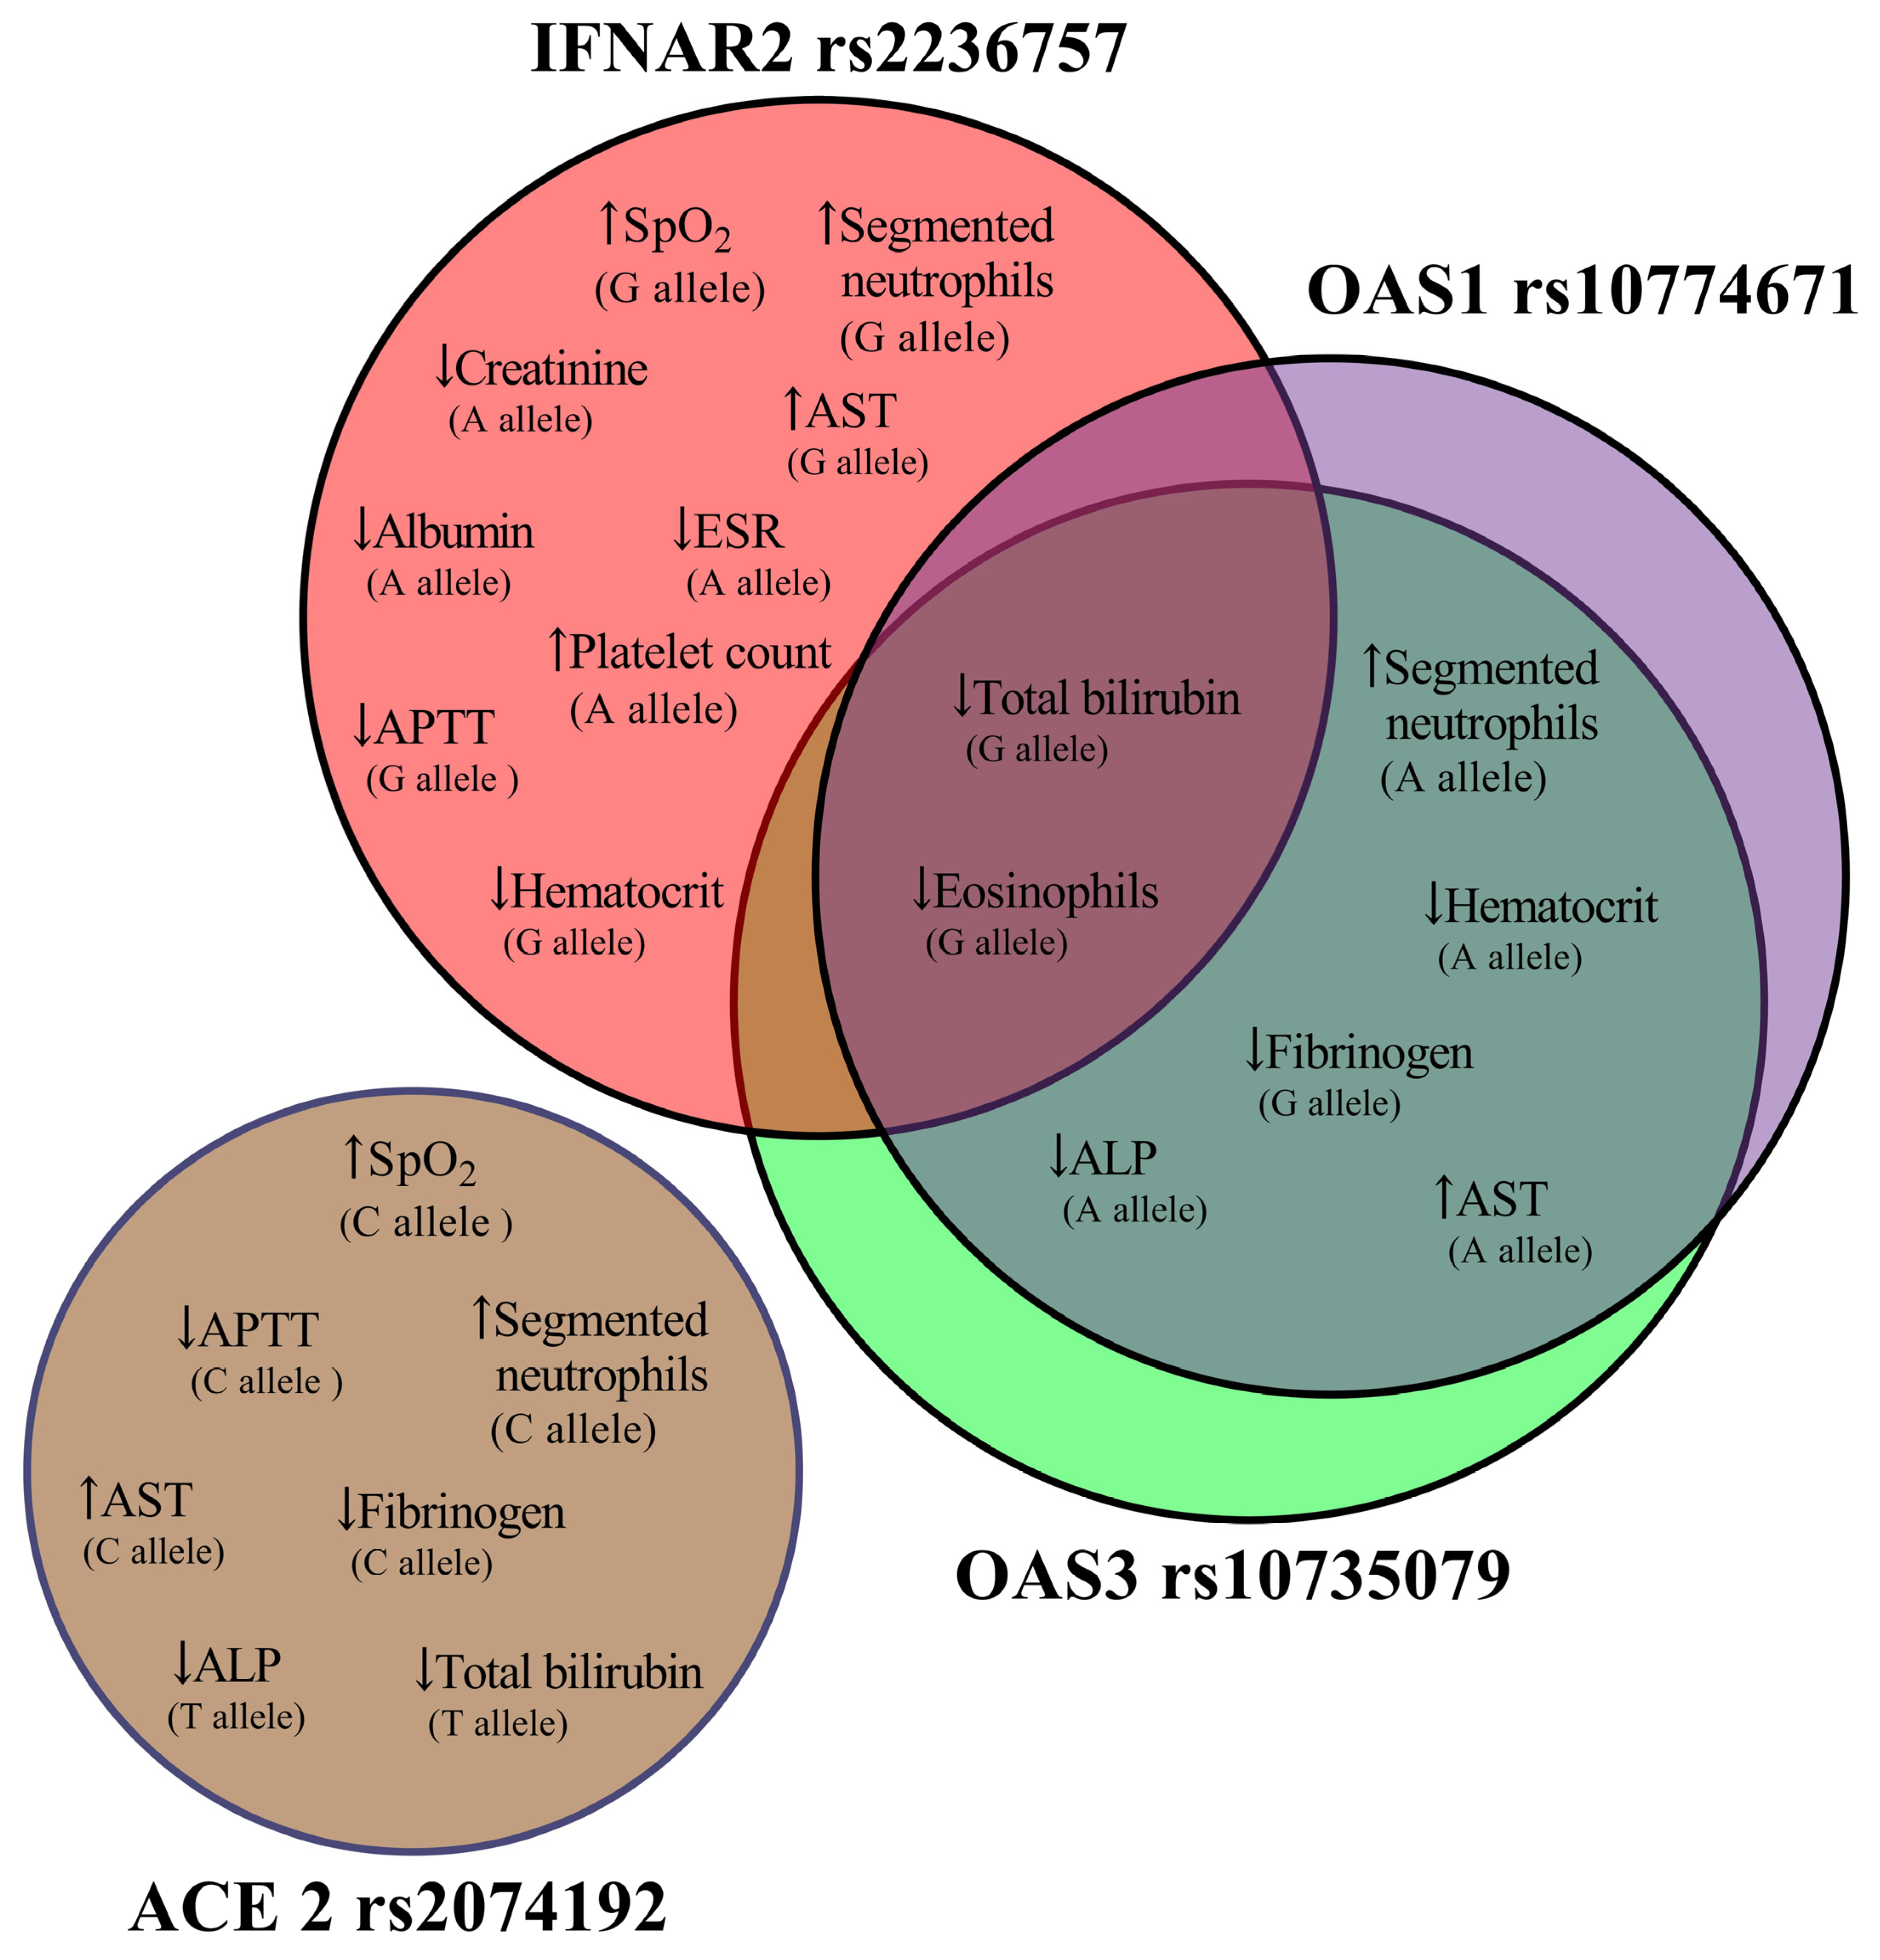
3.3. Genetic Determinants of Laboratory Parameter Differences
3.4. Alleles, Genotypes, and Clinical Outcomes
4. Discussion
5. Limitations
6. Conclusions
Author Contributions
Funding
Institutional Review Board Statement
Informed Consent Statement
Data Availability Statement
Conflicts of Interest
References
- Sharma, A.; Tiwari, S.; Deb, M.K.; Marty, J.L. Severe acute respiratory syndrome coronavirus-2 (SARS-CoV-2): A global pandemic and treatment strategies. Int. J. Antimicrob. Agents 2020, 56, 106054. [Google Scholar] [CrossRef] [PubMed]
- Li, G.; Hilgenfeld, R.; Whitley, R.; De Clercq, E. Therapeutic strategies for COVID-19: Progress and lessons learned. Nat. Rev. Drug Discov. 2023, 22, 449–475. [Google Scholar] [CrossRef] [PubMed]
- Hu, B.; Guo, H.; Zhou, P.; Shi, Z.L. Characteristics of SARS-CoV-2 and COVID-19. Nat. Rev. Microbiol. 2021, 19, 141–154. [Google Scholar] [CrossRef] [PubMed]
- Patel, M.; Chaubey, A.K.; Pittman, C.U.; Mlsna, T., Jr.; Mohan, D. Coronavirus (SARS-CoV-2) in the environment: Occurrence, persistence, analysis in aquatic systems and possible management. Sci. Total Environ. 2021, 765, 142698. [Google Scholar] [CrossRef]
- Najjar-Debbiny, R.; Gronich, N.; Weber, G.; Khoury, J.; Amar, M.; Stein, N.; Goldstein, L.H.; Saliba, W. Effectiveness of Paxlovid in Reducing Severe Coronavirus Disease 2019 and Mortality in High-Risk Patients. Clin. Infect. Dis. Off. Publ. Infect. Dis. Soc. Am. 2023, 76, e342–e349. [Google Scholar] [CrossRef]
- Reis, S.; Metzendorf, M.I.; Kuehn, R.; Popp, M.; Gagyor, I.; Kranke, P.; Meybohm, P.; Skoetz, N.; Weibel, S. Nirmatrelvir combined with ritonavir for preventing and treating COVID-19. Cochrane Database Syst. Rev. 2022, 9, Cd015395. [Google Scholar] [CrossRef]
- Bege, M.; Borbás, A. The Design, Synthesis and Mechanism of Action of Paxlovid, a Protease Inhibitor Drug Combination for the Treatment of COVID-19. Pharmaceutics 2024, 16, 217. [Google Scholar] [CrossRef]
- Zatovkaňuková, P.; Veselý, D.; Slíva, J. Evaluating Drug Interaction Risks: Nirmatrelvir & Ritonavir Combination (PAXLOVID®) with Concomitant Medications in Real-World Clinical Settings. Pathogens 2024, 13, 1055. [Google Scholar] [CrossRef]
- Moon, C.; Porges, E.; Roberts, A.; Bacon, J. A combination of nirmatrelvir and ombitasvir boosts inhibition of SARS-CoV-2 replication. Antivir. Res. 2024, 225, 105859. [Google Scholar] [CrossRef]
- Kronenberger, T.; Laufer, S.A.; Pillaiyar, T. COVID-19 therapeutics: Small-molecule drug development targeting SARS-CoV-2 main protease. Drug Discov. Today 2023, 28, 103579. [Google Scholar] [CrossRef]
- Pagliano, P.; Spera, A.; Sellitto, C.; Scarpati, G.; Folliero, V.; Piazza, O.; Franci, G.; Conti, V.; Ascione , T. Preclinical discovery and development of nirmatrelvir/ritonavir combinational therapy for the treatment of COVID-19 and the lessons learned from SARS-COV-2 variants. Expert Opin. Drug Discov. 2023, 18, 1–11. [Google Scholar] [CrossRef] [PubMed]
- Blair, H.A. Nirmatrelvir plus ritonavir in COVID-19: A profile of its use. Drugs Ther. Perspect. Ration. Drug Sel. Use 2023, 39, 41–47. [Google Scholar] [CrossRef] [PubMed]
- Ton, A.T.; Pandey, M.; Smith, J.R.; Ban, F.; Fernandez, M.; Cherkasov, A. Targeting SARS-CoV-2 papain-like protease in the postvaccine era. Trends Pharmacol. Sci. 2022, 43, 906–919. [Google Scholar] [CrossRef] [PubMed]
- Wong, C.K.H.; Au, I.C.H.; Lau, K.T.K.; Lau, E.H.Y.; Cowling, B.J.; Leung, G.M. Real-world effectiveness of early molnupiravir or nirmatrelvir-ritonavir in hospitalised patients with COVID-19 without supplemental oxygen requirement on admission during Hong Kong’s omicron BA.2 wave: A retrospective cohort study. Lancet Infect. Dis. 2022, 22, 1681–1693. [Google Scholar] [CrossRef]
- Hammond, J.; Leister-Tebbe, H.; Gardner, A.; Abreu, P.; Bao, W.; Wisemandle, W.; Baniecki, M.; Hendrick, V.M.; Damle, B.; Simón-Campos, A.; et al. Oral Nirmatrelvir for High-Risk, Nonhospitalized Adults with Covid-19. N. Engl. J. Med. 2022, 386, 1397–1408. [Google Scholar] [CrossRef]
- Yip, T.C.; Lui, G.C.; Lai, M.S.; Wong, V.W.; Tse, Y.K.; Ma, B.H.; Hui, E.; Leung, M.K.W.; Chan, H.L.; Hui, D.S.; et al. Impact of the Use of Oral Antiviral Agents on the Risk of Hospitalization in Community Coronavirus Disease 2019 Patients (COVID-19). Clin. Infect. Dis. Off. Publ. Infect. Dis. Soc. Am. 2023, 76, e26–e33. [Google Scholar] [CrossRef]
- Buchynskyi, M.; Oksenych, V.; Kamyshna, I.; Kamyshnyi, O. Exploring Paxlovid Efficacy in COVID-19 Patients with MAFLD: Insights from a Single-Center Prospective Cohort Study. Viruses 2024, 16, 112. [Google Scholar] [CrossRef]
- Mahase, E. Covid-19: Pfizer’s paxlovid is 89% effective in patients at risk of serious illness, company reports. BMJ (Clin. Res. ed.) 2021, 375, n2713. [Google Scholar] [CrossRef]
- Akinosoglou, K.-A.; Schinas, G.; Gogos, C. Oral Antiviral Treatment for COVID-19: A Comprehensive Review on Nirmatrelvir/Ritonavir. Viruses 2022, 14, 2540. [Google Scholar] [CrossRef]
- Fitero, A.; Negrut, N.; Popa, A.; John, H.T.; Ferician, A.C.; Manole, F.; Marian, P. Integrated Analysis of Remdesivir and Paxlovid in COVID-19 Patients: A Personalized Approach to High-Risk Individuals for Severe Evolution. J. Clin. Med. 2024, 13, 6670. [Google Scholar] [CrossRef]
- Lim, S.; Tignanelli, C.; Hoertel, N.; Boulware, D.; Usher, M. Prevalence of Medical Contraindications to Nirmatrelvir/Ritonavir in a Cohort of Hospitalized and Nonhospitalized Patients With COVID-19. Open Forum Infect. Dis. 2022, 9, ofac389. [Google Scholar] [CrossRef] [PubMed]
- González-Gómez, Á.; Caro-Teller, J.M.; González-Barrios, I.; Castro-Frontiñán, A.; Rodríguez-Quesada, P.P.; Ferrari-Piquero, J.M. Safety profile of nirmatrelvir-ritonavir: Evidence of adverse events due to drug-drug interactions. Farm. Hosp. 2024, 48, 70–74. [Google Scholar] [CrossRef]
- Kwok, W.C.; Tam, T.C.C.; Ho, J.C.M.; Lam, D.C.L.; Ip, M.S.; Ho, P.L. Real-World Effectiveness Study of Nirmatrelvir-Ritonavir or Molnupiravir in Hospitalized Unvaccinated Patients with Chronic Respiratory Diseases and Moderate COVID-19 at Presentation. Int. J. Chronic Obstr. Pulm. Dis. 2024, 19, 77–86. [Google Scholar] [CrossRef]
- Saravolatz, L.D.; Depcinski, S.; Sharma, M. Molnupiravir and Nirmatrelvir-Ritonavir: Oral Coronavirus Disease 2019 Antiviral Drugs. Clin. Infect. Dis. Off. Publ. Infect. Dis. Soc. Am. 2023, 76, 165–171. [Google Scholar] [CrossRef]
- Lamb, Y.N. Nirmatrelvir Plus Ritonavir: First Approval. Drugs 2022, 82, 585–591. [Google Scholar] [CrossRef]
- Cvancara, D.J.; Baertsch, H.C.; Lehmann, A.E.; Humphreys, I.M.; Farrell, N.F.; Marshall, T.B.; Bhatt,, N.K.; Abuzeid, W.M.; Jafari, A. Postmarketing Reporting of Paxlovid-Related Dysgeusia: A Real-World Pharmacovigilance Study. Otolaryngol.—Head Neck Surg. Off. J. Am. Acad. Otolaryngol.-Head Neck Surg. 2023, 169, 55–61. [Google Scholar] [CrossRef]
- Caronia, L.; Xi, R.; Margolskee, R.F.; Jiang, P. Paxlovid mouth likely is mediated by activation of the TAS2R1 bitter receptor by nirmatrelvir. Biochem. Biophys. Res. Commun. 2023, 682, 138–140. [Google Scholar] [CrossRef]
- Li, M.; Zhang, Q.S.; Liu, X.L.; Wang, H.L.; Liu, W. Adverse Events Associated with Nirmatrelvir/Ritonavir: A Pharmacovigilance Analysis Based on FAERS. Pharmaceuticals 2022, 15, 1455. [Google Scholar] [CrossRef]
- Sayed Ahmed, H.A.; Mohamed, S.F.; Mostafa, M.; Elotla, S.F.; Shah, A.; Shah, J.; Fouad, A.M. Psychometric evaluation of the Arabic version of the 5-item Problem Areas in Diabetes (AR-PAID-5) scale. BMC Prim. Care 2022, 23, 148. [Google Scholar] [CrossRef]
- Liang, Y.; Ma, L.; Wang, Y.; Zheng, J.; Su, L.; Lyu, J. Adverse events associated with molnupiravir: A real-world disproportionality analysis in food and drug administration adverse event reporting system. Front. Pharmacol. 2023, 14, 1253799. [Google Scholar] [CrossRef]
- Pérez-Iruela, J.A.; Pastor-Fructuoso, P.; De Gracia-Rodríguez, C.; Soler-Vigil, M.; Gómez-Martínez, M.D.V. Adverse reactions to radiopharmaceuticals. Farm. Hosp. 2021, 45, 142–149. [Google Scholar] [PubMed]
- Doogue, M.P.; Polasek, T.M. The ABCD of clinical pharmacokinetics. Ther. Adv. Drug Saf. 2013, 4, 5–7. [Google Scholar] [CrossRef] [PubMed]
- Nwabufo, C.K.; Bendayan, R. Pharmacokinetic considerations to optimize clinical outcomes for COVID-19 drugs. Trends Pharmacol. Sci. 2022, 43, 1041–1054. [Google Scholar] [CrossRef]
- Pilla Reddy, V.; El-Khateeb, E.; Jo, H.; Giovino, N.; Lythgoe, E.; Sharma, S.; Tang, W.; Jamei, M.; Rastomi-Hodjegan, A. Pharmacokinetics under the COVID-19 storm. Br. J. Clin. Pharmacol. 2023, 89, 158–186. [Google Scholar] [CrossRef]
- McColl, E.R.; Croyle, M.A.; Zamboni, W.C.; Honer, W.G.; Heise, M.; Piquette-Miller, M.; Goralski, K.B. COVID-19 Vaccines and the Virus: Impact on Drug Metabolism and Pharmacokinetics. Drug Metab. Dispos. Biol. Fate Chem. 2023, 51, 130–141. [Google Scholar] [CrossRef]
- Dzhuryak, V.; Sydorchuk, L.; Sydorchuk, A.; Kamyshnyi, O.; Kshanovska, A.; Levytska, S.; Knut, R.; Sheremet, M.; Ivashchuk, S.; Petrynych, O.; et al. The cytochrome 11B2 aldosterone synthase gene CYP11B2 (RS1799998) polymorphism associates with chronic kidney disease in hypertensive patients. Biointerface Res. Appl. Chem. 2020, 10, 5406–5411. [Google Scholar] [CrossRef]
- Kamyshna, I.I.; Pavlovych, L.B.; Maslyanko, V.A.; Kamyshnyi, A.M. Analysis of the transcriptional activity of genes of neuropeptides and their receptors in the blood of patients with thyroid pathology. J. Med. Life 2021, 14, 243–249. [Google Scholar] [CrossRef]
- Roden, D.M.; McLeod, H.L.; Relling, M.V.; Williams, M.S.; Mensah, G.A.; Peterson, J.F.; Van Driest, S.L. Pharmacogenomics. Lancet 2019, 394, 521–532. [Google Scholar] [CrossRef]
- Ahmed, S.; Zhou, Z.; Zhou, J.; Chen, S.Q. Pharmacogenomics of Drug Metabolizing Enzymes and Transporters: Relevance to Precision Medicine. Genom. Proteom. Bioinform. 2016, 14, 298–313. [Google Scholar] [CrossRef]
- Babayeva, M.; Loewy, Z. Repurposing Drugs for COVID-19: Pharmacokinetics and Pharmacogenomics of Chloroquine and Hydroxychloroquine. Pharmgenom. Pers. Med. 2020, 13, 531–542. [Google Scholar] [CrossRef]
- Pinto, N.; Dolan, M.E. Clinically relevant genetic variations in drug metabolizing enzymes. Curr. Drug Metab. 2011, 12, 487–497. [Google Scholar] [CrossRef] [PubMed]
- Madian, A.G.; Wheeler, H.E.; Jones, R.B.; Dolan, M.E. Relating human genetic variation to variation in drug responses. Trends Genet. TIG 2012, 28, 487–495. [Google Scholar] [CrossRef] [PubMed]
- Halabitska, I.; Oksenych, V.; Kamyshnyi, O. Exploring the Efficacy of Alpha-Lipoic Acid in Comorbid Osteoarthritis and Type 2 Diabetes Mellitus. Nutrients 2024, 16, 3349. [Google Scholar] [CrossRef] [PubMed]
- Halabitska, I.; Babinets, L. Different consequences of the treatment of osteoarthritis in gastrointestinal comorbidity with exocrine pancreatic insufficiency. Fam. Med. Prim. Care Rev. 2021, 23, 422–428. [Google Scholar] [CrossRef]
- Repchuk, Y.; Sydorchuk, L.P.; Sydorchuk, A.R.; Fedonyuk, L.Y.; Kamyshnyi, O.; Korovenkova, O.; Plehutsa, I.M.; Dzhuryak, V.S.; Myshkovskii, Y.M.; Iftoda, O.M.; et al. Linkage of blood pressure, obesity and diabetes mellitus with angiotensinogen gene (AGT 704T>C/rs699) polymorphism in hypertensive patients. Bratisl. Lekárske listy 2021, 122, 715–720. [Google Scholar] [CrossRef]
- Carli, M.; Kolachalam, S.; Longoni, B.; Pintaudi, A.; Baldini, M.; Aringhieri, S.; Fasciani, I.; Annibale, P.; Maggio, R.; Scarselli, M. Atypical Antipsychotics and Metabolic Syndrome: From Molecular Mechanisms to Clinical Differences. Pharmaceuticals 2021, 14, 238. [Google Scholar] [CrossRef]
- Halabitska, I.; Babinets, L.; Oksenych, V.; Kamyshnyi, O. Diabetes and Osteoarthritis: Exploring the Interactions and Therapeutic Implications of Insulin, Metformin, and GLP-1-Based Interventions. Biomedicines 2024, 12, 1630. [Google Scholar] [CrossRef]
- Weinberg Sibony, R.; Segev, O.; Dor, S.; Raz, I. Drug Therapies for Diabetes. Int. J. Mol. Sci. 2023, 24, 17147. [Google Scholar] [CrossRef]
- Pavlo, P.; Kamyshna, I.; Kamyshnyi, A. Effects of metformin on the gut microbiota: A systematic review. Mol. Metab. 2023, 77, 101805. [Google Scholar] [CrossRef]
- Petakh, P.; Griga, V.; Mohammed, I.B.; Loshak, K.; Poliak, I.; Kamyshnyiy, A. Effects of Metformin, Insulin on Hematological Parameters of COVID-19 Patients with Type 2 Diabetes. Med. Arch. 2022, 76, 329–332. [Google Scholar] [CrossRef]
- Bailey, C.J. Metformin: Therapeutic profile in the treatment of type 2 diabetes. Diabetes Obes. Metab. 2024, 26 (Suppl. S3), 3–19. [Google Scholar] [CrossRef] [PubMed]
- Petakh, P.; Kamyshna, I.; Oksenych, V.; Kainov, D.; Kamyshnyi, A. Metformin Therapy Changes Gut Microbiota Alpha-Diversity in COVID-19 Patients with Type 2 Diabetes: The Role of SARS-CoV-2 Variants and Antibiotic Treatment. Pharmaceuticals 2023, 16, 904. [Google Scholar] [CrossRef]
- Petakh, P.; Kamyshna, I.; Kamyshnyi, A. Gene expression of protein kinase AMP-activated catalytic subunit alpha 1 (PRKAA1), solute carrier family 2 member 1 (SLC2A1) and mechanistic target of rapamycin (MTOR) in metformin-treated type 2 diabetes patients with COVID-19: Impact on inflammation markers. Inflammopharmacology 2024, 32, 885–891. [Google Scholar]
- Rommasi, F.; Nasiri, M.J.; Mirsaeidi, M. Immunomodulatory agents for COVID-19 treatment: Possible mechanism of action and immunopathology features. Mol. Cell. Biochem. 2022, 477, 711–726. [Google Scholar] [CrossRef]
- Zemlyak, O.S.; Babinets, L.S.; Halabitska, I.M. The Role of Endotoxicosis And Inflammation In Deepening The Pancreatic Functional Insufficiency In Chronic Pancreatitis In Combination With Type 2 Diabetes. Pol. Merkur. Lek. Organ Pol. Tow. Lek. 2023, 51, 207–215. [Google Scholar] [CrossRef]
- Redkva, O.V.; Babinets, L.S.; Halabitska, I.M. Evaluation of Parameters of Actual Typical Pathogenetic Syndromes In Comorbidity Of Type 2 Diabetes Mellitus And Chronic Pancreatitis. Wiad. Lek. (1960) 2021, 74, 2557–2559. [Google Scholar] [CrossRef]
- Chan, L.E.; Casiraghi, E.; Laraway, B.; Coleman, B.; Blau, H.; Zaman, A.; Harris, N.; Wilkins, K.; Gargano, M.; Valentini, G.; et al. Metformin is associated with reduced COVID-19 severity in patients with prediabetes. Diabetes Res. Clin. Pract. 2022, 194, 110157. [Google Scholar] [CrossRef]
- Halabitska, I.; Petakh, P.; Kamyshna, I.; Oksenych, V.; Kainov, D.E.; Kamyshnyi, O. The interplay of gut microbiota, obesity, and depression: Insights and interventions. Cell. Mol. Life Sci. CMLS 2024, 81, 443. [Google Scholar] [CrossRef]
- Hua, Y.; Dai, X.; Xu, Y.; Xing, G.; Liu, H.; Lu, T.; Chen, Y.; Zhang, Y. Drug repositioning: Progress and challenges in drug discovery for various diseases. Eur. J. Med. Chem. 2022, 234, 114239. [Google Scholar] [CrossRef]
- Low, Z.Y.; Farouk, I.A.; Lal, S.K. Drug Repositioning: New Approaches and Future Prospects for Life-Debilitating Diseases and the COVID-19 Pandemic Outbreak. Viruses 2020, 12, 1058. [Google Scholar] [CrossRef]
- Khan, S.; Agnihotri, J.; Patil, S.; Khan, N. Drug repurposing: A futuristic approach in drug discovery. J. Pharm. Biol. Sci. 2023, 11, 66–69. [Google Scholar] [CrossRef]
- Harrison, A.G.; Lin, T.; Wang, P. Mechanisms of SARS-CoV-2 Transmission and Pathogenesis. Trends Immunol. 2020, 41, 1100–1115. [Google Scholar] [CrossRef] [PubMed]
- Pouladi, N.; Abdolahi, S. Investigating the ACE2 polymorphisms in COVID-19 susceptibility: An in silico analysis. Mol. Genet. Genom. Med. 2021, 9, e1672. [Google Scholar] [CrossRef] [PubMed]
- Sienko, J.; Marczak, I.; Kotowski, M.; Bogacz, A.; Tejchman, K.; Sienko, M.; Kotfis, K. Association of ACE2 Gene Variants with the Severity of COVID-19 Disease-A Prospective Observational Study. Int. J. Environ. Res. Public Health 2022, 19, 12622. [Google Scholar] [CrossRef]
- Pairo-Castineira, E.; Clohisey, S.; Klaric, L.; Bretherick, A.D.; Rawlik, K.; Pasko, D.; Walker, S.; Parkinson, N.; Fourman, M.H.; Russell, C.D.; et al. Genetic mechanisms of critical illness in COVID-19. Nature 2021, 591, 92–98. [Google Scholar] [CrossRef]
- Adli, A.; Rahimi, M.; Khodaie, R.; Hashemzaei, N.; Hosseini, S.M. Role of genetic variants and host polymorphisms on COVID-19: From viral entrance mechanisms to immunological reactions. J. Med. Virol. 2022, 94, 1846–1865. [Google Scholar] [CrossRef]
- Chen, F.; Zhang, Y.; Li, X.; Li, W.; Liu, X.; Xue, X. The Impact of ACE2 Polymorphisms on COVID-19 Disease: Susceptibility, Severity, and Therapy. Front. Cell. Infect. Microbiol. 2021, 11, 753721. [Google Scholar] [CrossRef]
- Devaux, C.A.; Camoin-Jau, L. An update on angiotensin-converting enzyme 2 structure/functions, polymorphism, and duplicitous nature in the pathophysiology of coronavirus disease 2019: Implications for vascular and coagulation disease associated with severe acute respiratory syndrome coronavirus infection. Front. Microbiol. 2022, 13, 1042200. [Google Scholar]
- Costa, L.B.; Perez, L.G.; Palmeira, V.A.; Macedo, E.C.T.; Ribeiro, V.T.; Lanza, K.; Simões E Silva, A.C. Insights on SARS-CoV-2 Molecular Interactions With the Renin-Angiotensin System. Front. Cell Dev. Biol. 2020, 8, 559841. [Google Scholar] [CrossRef]
- Delpino, M.V.; Quarleri, J. SARS-CoV-2 Pathogenesis: Imbalance in the Renin-Angiotensin System Favors Lung Fibrosis. Front. Cell. Infect. Microbiol. 2020, 10, 340. [Google Scholar] [CrossRef]
- Hamet, P.; Pausova, Z.; Attaoua, R.; Hishmih, C.; Haloui, M.; Shin, J.; Paus, T.; Abrahamowicz, M.; Gaudet, D.; Santucci, L.; et al. SARS-CoV-2 Receptor ACE2 Gene Is Associated with Hypertension and Severity of COVID 19: Interaction with Sex, Obesity, and Smoking. Am. J. Hypertens. 2021, 34, 367–376. [Google Scholar] [CrossRef] [PubMed]
- Martínez-Gómez, L.E.; Herrera-López, B.; Martinez-Armenta, C.; Ortega-Peña, S.; Camacho-Rea, M.D.C.; Suarez-Ahedo, C.; Vázquez-Cárdenas, P.; Vargas-Alarcón, G.; Rojas-Velasco, G.; Fragoso, J.M.; et al. ACE and ACE2 Gene Variants Are Associated With Severe Outcomes of COVID-19 in Men. Front. Immunol. 2022, 13, 812940. [Google Scholar] [CrossRef] [PubMed]
- Forbester, J.L.; Humphreys, I.R. Genetic influences on viral-induced cytokine responses in the lung. Mucosal Immunol. 2021, 14, 14–25. [Google Scholar] [CrossRef]
- Ovsyannikova, I.G.; Haralambieva, I.H.; Crooke, S.N.; Poland, G.A.; Kennedy, R.B. The role of host genetics in the immune response to SARS-CoV-2 and COVID-19 susceptibility and severity. Immunol. Rev. 2020, 296, 205–219. [Google Scholar] [CrossRef]
- Buchynskyi, M.; Oksenych, V.; Kamyshna, I.; Budarna, O.; Halabitska, I.; Petakh, P.; Kamyshnyi, O. Genomic insight into COVID-19 severity in MAFLD patients: A single-center prospective cohort study. Front. Genet. 2024, 15, 1460318. [Google Scholar] [CrossRef]
- Buchynskyi, M.; Oksenych, V.; Kamyshna, I.; Vorobets, I.; Halabitska, I.; Kamyshnyi, O. Modulatory Roles of AHR, FFAR2, FXR, and TGR5 Gene Expression in Metabolic-Associated Fatty Liver Disease and COVID-19 Outcomes. Viruses 2024, 16, 985. [Google Scholar] [CrossRef]
- Fricke-Galindo, I.; Martínez-Morales, A.; Chávez-Galán, L.; Ocaña-Guzmán, R.; Buendía-Roldán, I.; Pérez-Rubio, G.; Hernández-Zenteno, R.J.; Verónica-Aguilar, A.; Alarcón-Dionet, A.; Aguilar-Duran, H.; et al. IFNAR2 relevance in the clinical outcome of individuals with severe COVID-19. Front. Immunol. 2022, 13, 949413. [Google Scholar] [CrossRef]
- Dieter, C.; de Almeida Brondani, L.; Lemos, N.E.; Schaeffer, A.F.; Zanotto, C.; Ramos, D.T.; Girardi, E.; Pellenz, F.M.; Camargo, J.L.; Moresco, K.S.; et al. Polymorphisms in ACE1, TMPRSS2, IFIH1, IFNAR2, and TYK2 Genes Are Associated with Worse Clinical Outcomes in COVID-19. Genes 2022, 14, 29. [Google Scholar] [CrossRef]
- Hamidah, B.; Pakpahan, C.; Wulandari, L.; Tinduh, D.; Wibawa, T.; Prakoeswa, C.R.S.; Oceandy, D. Expression of interferon-stimulated genes, but not polymorphisms in the interferon α/β receptor 2 gene, is associated with coronavirus disease 2019 mortality. Heliyon 2024, 10, e39002. [Google Scholar] [CrossRef]
- López-Bielma, M.F.; Falfán-Valencia, R.; Abarca-Rojano, E.; Pérez-Rubio, G. Participation of Single-Nucleotide Variants in IFNAR1 and IFNAR2 in the Immune Response against SARS-CoV-2 Infection: A Systematic Review. Pathogens 2023, 12, 1320. [Google Scholar] [CrossRef]
- Gokul, A.; Arumugam, T.; Ramsuran, V. Genetic Ethnic Differences in Human 2′-5′-Oligoadenylate Synthetase and Disease Associations: A Systematic Review. Genes 2023, 14, 527. [Google Scholar] [CrossRef] [PubMed]
- Bonnevie-Nielsen, V.; Field, L.L.; Lu, S.; Zheng, D.J.; Li, M.; Martensen, P.M.; Nielsen, T.B.; Beck-Nielsen, H.; Lau, Y.L.; Pociot, F. Variation in antiviral 2′,5′-oligoadenylate synthetase (2′5′AS) enzyme activity is controlled by a single-nucleotide polymorphism at a splice-acceptor site in the OAS1 gene. Am. J. Hum. Genet. 2005, 76, 623–633. [Google Scholar] [CrossRef] [PubMed]
- Banday, A.R.; Stanifer, M.L.; Florez-Vargas, O.; Onabajo, O.O.; Papenberg, B.W.; Zahoor, M.A.; Mirabello, L.; Ring, T.G.; Lee, C.H.; Albert, P.S.; et al. Genetic regulation of OAS1 nonsense-mediated decay underlies association with COVID-19 hospitalization in patients of European and African ancestries. Nat. Genet. 2022, 54, 1103–1116. [Google Scholar] [CrossRef] [PubMed]
- Kozak, K.; Pavlyshyn, H.; Kamyshnyi, O.; Shevchuk, O.; Korda, M.; Vari, S.G. The Relationship between COVID-19 Severity in Children and Immunoregulatory Gene Polymorphism. Viruses 2023, 15, 2093. [Google Scholar] [CrossRef]
- Kamyshnyi, A.; Koval, H.; Kobevko, O.; Buchynskyi, M.; Oksenych, V.; Kainov, D.; Lyubomirskaya, K.; Kamyshna, I.; Potters, G.; Moshynets, O. Therapeutic Effectiveness of Interferon-α2b against COVID-19 with Community-Acquired Pneumonia: The Ukrainian Experience. Int. J. Mol. Sci. 2023, 24, 6887. [Google Scholar] [CrossRef]
- Du, Z.; Wang, L.; Bai, Y.; Liu, Y.; Lau, E.H.Y.; Galvani, A.P.; Krug, R.M.; Cowling, B.J.; Meyers, L.A. A retrospective cohort study of Paxlovid efficacy depending on treatment time in hospitalized COVID-19 patients. eLife 2024, 13, 89801. [Google Scholar] [CrossRef]
- Bai, Y.; Du, Z.; Wang, L.; Lau, E.; Fung, I.; Holme, P.; Cowling, B.J.; Galvani, A.P.; Krug, R.M.; Meyers, L.A. Public Health Impact of Paxlovid as Treatment for COVID-19, United States. Emerg. Infect. Dis. 2024, 30, 262–269. [Google Scholar] [CrossRef]
- Rahmah, L.; Abarikwu, S.O.; Arero, A.G.; Essouma, M.; Jibril, A.T.; Fal, A.; Flisiak, R.; Makuku, R.; Marquez, L.; Mohamed, K.; et al. Oral antiviral treatments for COVID-19: Opportunities and challenges. Pharmacol. Rep. PR 2022, 74, 1255–1278. [Google Scholar] [CrossRef]
- Balzanelli, M.G.; Distratis, P.; Lazzaro, R.; Pham, V.H.; Tran, T.C.; Dipalma, G.; Bianco, A.; Serlenga, E.M.; Aityan, S.K.; Pierangeli, V.; et al. Analysis of Gene Single Nucleotide Polymorphisms in COVID-19 Disease Highlighting the Susceptibility and the Severity towards the Infection. Diagnostics 2022, 12, 2824. [Google Scholar] [CrossRef]
- Grimaudo, S.; Amodio, E.; Pipitone, R.M.; Maida, C.M.; Pizzo, S.; Prestileo, T.; Tramuto, F.; Sardina, D.; Vitale, F.; Casuccio, A.; et al. PNPLA3 and TLL-1 Polymorphisms as Potential Predictors of Disease Severity in Patients With COVID-19. Front. Cell Dev. Biol. 2021, 9, 627914. [Google Scholar] [CrossRef]
- Imran, L.; Zubair, R.; Mughal, S.; Shakeel, R. Ritonavir-boosted Nirmatrelvir and COVID-19 outcomes in the age of Omicron variant. Ann. Med. Surg. (2012) 2023, 85, 313–315. [Google Scholar] [CrossRef] [PubMed]
- Buchynskyi, M.; Kamyshna, I.; Lyubomirskaya, K.; Moshynets, O.; Kobyliak, N.; Oksenych, V.; Kamyshnyi, A. Efficacy of interferon alpha for the treatment of hospitalized patients with COVID-19: A meta-analysis. Front. Immunol. 2023, 14, 1069894. [Google Scholar] [CrossRef] [PubMed]
- Sodeifian, F.; Nikfarjam, M.; Kian, N.; Mohamed, K.; Rezaei, N. The role of type I interferon in the treatment of COVID-19. J. Med. Virol. 2022, 94, 63–81. [Google Scholar] [CrossRef]
- Antonopoulou, I.; Sapountzaki, E.; Rova, U.; Christakopoulos, P. Inhibition of the main protease of SARS-CoV-2 (M(pro)) by repurposing/designing drug-like substances and utilizing nature’s toolbox of bioactive compounds. Comput. Struct. Biotechnol. J. 2022, 20, 1306–1344. [Google Scholar] [CrossRef]
- Citarella, A.; Dimasi, A.; Moi, D.; Passarella, D.; Scala, A.; Piperno, A.; Micale, N. Recent Advances in SARS-CoV-2 Main Protease Inhibitors: From Nirmatrelvir to Future Perspectives. Biomolecules 2023, 13, 1339. [Google Scholar] [CrossRef]
- Joyce, R.P.; Hu, V.W.; Wang, J. The history, mechanism, and perspectives of nirmatrelvir (PF-07321332): An orally bioavailable main protease inhibitor used in combination with ritonavir to reduce COVID-19-related hospitalizations. Med. Chem. Res. Int. J. Rapid Commun. Des. Mech. Action Biol. Act. Agents 2022, 31, 1637–1646. [Google Scholar] [CrossRef]
- Owen, D.R.; Allerton, C.M.N.; Anderson, A.S.; Aschenbrenner, L.; Avery, M.; Berritt, S.; Boras, B.; Cardin, R.D.; Carlo, A.; Coffman, K.J.; et al. An oral SARS-CoV-2 M(pro) inhibitor clinical candidate for the treatment of COVID-19. Science 2021, 374, 1586–1593. [Google Scholar] [CrossRef]
- Hashemian, S.M.R.; Sheida, A.; Taghizadieh, M.; Memar, M.Y.; Hamblin, M.R.; Bannazadeh Baghi, H.; Sadri Nahand, J.; Asemi, Z.; Mirzaei, H. Paxlovid (Nirmatrelvir/Ritonavir): A new approach to Covid-19 therapy? Biomed. Pharmacother. 2023, 162, 114367. [Google Scholar] [CrossRef]
- Pairo-Castineira, E.; Rawlik, K.; Bretherick, A.D.; Qi, T.; Wu, Y.; Nassiri, I.; McConkey, G.A.; Zechner, M.; Klaric, L.; Griffiths, F.; et al. GWAS and meta-analysis identifies 49 genetic variants underlying critical COVID-19. Nature 2023, 617, 764–768. [Google Scholar] [CrossRef]
- Fakhkhari, M.; Caidi, H.; Sadki, K. HLA alleles associated with COVID-19 susceptibility and severity in different populations: A systematic review. Egypt. J. Med. Hum. Genet. 2023, 24, 1–9. [Google Scholar] [CrossRef] [PubMed]
- Abdelhafez, M.; Nasereddin, A.; Shamma, O.A.; Abed, R.; Sinnokrot, R.; Marof, O.; Heif, T.; Erekat, Z.; Al-Jawabreh, A.; Ereqat, S. Association of IFNAR2 rs2236757 and OAS3 rs10735079 Polymorphisms with Susceptibility to COVID-19 Infection and Severity in Palestine. Interdiscip. Perspect. Infect. Dis. 2023, 2023, 9551163. [Google Scholar] [CrossRef] [PubMed]
- Jalkanen, J.; Khan, S.; Elima, K.; Huttunen, T.; Wang, N.; Hollmén, M.; Elo, L.L.; Jalkanen, S. Polymorphism in interferon alpha/beta receptor contributes to glucocorticoid response and outcome of ARDS and COVID-19. Crit. Care 2023, 27, 112. [Google Scholar] [CrossRef] [PubMed]
- Paranga, T.G.; Pavel-Tanasa, M.; Constantinescu, D.; Plesca, C.E.; Petrovici, C.; Miftode, I.L.; Moscalu, M.; Cianga, P.; Miftode, E.G. Comparison of C-reactive protein with distinct hyperinflammatory biomarkers in association with COVID-19 severity, mortality and SARS-CoV-2 variants. Front. Immunol. 2023, 14, 1213246. [Google Scholar] [CrossRef]
- Sagris, M.; Theofilis, P.; Antonopoulos, A.S.; Oikonomou, E.; Tsioufis, K.; Tousoulis, D. Genetic Predisposition and Inflammatory Inhibitors in COVID-19: Where Do We Stand? Biomedicines 2022, 10, 242. [Google Scholar] [CrossRef]
- Leisching, G.; Wiid, I.; Baker, B. The Association of OASL and Type I Interferons in the Pathogenesis and Survival of Intracellular Replicating Bacterial Species. Front. Cell. Infect. Microbiol. 2017, 7, 196. [Google Scholar] [CrossRef]
- Lee, W.B.; Choi, W.Y.; Lee, D.H.; Shim, H.; Kim-Ha, J.; Kim, Y.J. OAS1 and OAS3 negatively regulate the expression of chemokines and interferon-responsive genes in human macrophages. BMB Rep. 2019, 52, 133–138. [Google Scholar] [CrossRef]
- Bader El Din, N.; Moustafa, R.; Ghaleb, E.; El-Shenawy, R.; Agwa, M.; Helmy, N.; El‑Shiekh, M.; Yousif, A.; Mahfouz, M.; Seif, A.; et al. Association of OAS1 gene polymorphism with the severity of COVID-19 infection. World Acad. Sci. J. 2024, 6, 1–9. [Google Scholar] [CrossRef]
- Córdova-Dávalos, L.E.; Hernández-Mercado, A.; Barrón-García, C.B.; Rojas-Martínez, A.; Jiménez, M.; Salinas, E.; Cervantes-García, D. Impact of genetic polymorphisms related to innate immune response on respiratory syncytial virus infection in children. Virus Genes 2022, 58, 501–514. [Google Scholar] [CrossRef]
- Mihaescu, G.; Chifiriuc, M.C.; Filip, R.; Bleotu, C.; Ditu, L.M.; Constantin, M.; Cristian, R.E.; Grigore, R.; Bertesteanu, S.V.; Bertesteanu, G.; et al. Role of interferons in the antiviral battle: From virus-host crosstalk to prophylactic and therapeutic potential in SARS-CoV-2 infection. Front. Immunol. 2023, 14, 1273604. [Google Scholar] [CrossRef]
- Garcia-Del-Barco, D.; Risco-Acevedo, D.; Berlanga-Acosta, J.; Martos-Benítez, F.D.; Guillén-Nieto, G. Revisiting Pleiotropic Effects of Type I Interferons: Rationale for Its Prophylactic and Therapeutic Use Against SARS-CoV-2. Front. Immunol. 2021, 12, 655528. [Google Scholar] [CrossRef] [PubMed]
- Aliyari, S.R.; Quanquin, N.; Pernet, O.; Zhang, S.; Wang, L.; Cheng, G. The Evolutionary Dance between Innate Host Antiviral Pathways and SARS-CoV-2. Pathogens 2022, 11, 538. [Google Scholar] [CrossRef] [PubMed]
- Kaur, R.; Tada, T.; Landau, N.R. Restriction of SARS-CoV-2 replication by receptor transporter protein 4 (RTP4). mBio 2023, 14, e0109023. [Google Scholar] [CrossRef] [PubMed]
- Awady, M.; Anany, M.; Esmat, G.; Zayed, N.; Tabll, A.; Helmy, A.; Zayady, A.R.; Abdalla, M.S.; Sharada, H.M.; El Raziky, M.; et al. Single nucleotide polymorphism at exon 7 splice acceptor site of OAS1 gene determines response of hepatitis C virus patients to interferon therapy. J. Gastroenterol. Hepatol. 2010, 26, 843–850. [Google Scholar] [CrossRef]
- Méndez Rodríguez, M.L.; Ponciano-Gómez, A.; Campos-Aguilar, M.; Tapia-Sánchez, W.D.; Duarte-Martínez, C.L.; Romero-Herrera, J.S.; Olivas-Quintero, S.; Saucedo-Campos, A.D.; Méndez-Cruz, A.R.; Jimenez-Flores, R.; et al. Neutrophil-to-Lymphocyte Ratio and Cytokine Profiling as Predictors of Disease Severity and Survival in Unvaccinated COVID-19 Patients. Vaccines 2024, 12, 861. [Google Scholar] [CrossRef]
- Farah, R.; Khamisy-Farah, R.; Dziedzic, K.; Skrzypek, E.; Pruc, M.; Bragazzi, N.L.; Szarpak, L.; Jomah, M. The role of the neutrophil-lymphocyte ratio in predicting poor outcomes in COVID-19 patients. Cardiol. J. 2024, 31, 374–380. [Google Scholar] [CrossRef]
- Lagunas-Rangel, F. Neutrophil-to-Lymphocyte ratio and Lymphocyte-to-C-reactive protein ratio in patients with severe coronavirus disease 2019 (COVID-19): A meta-analysis. J. Med. Virol. 2020, 92, 1733–1734. [Google Scholar] [CrossRef]
- Magusali, N.; Graham, A.; Piers, T.; Panichnantakul, P.; Yaman, Ü.; Shoai, M.; Reynolds, R.H.; Botia, J.A.; Brookes, K.J.; Guetta-Baranes, T.; et al. Genetic variability associated with OAS1 expression in myeloid cells increases the risk of Alzheimer’s disease and severe COVID-19 outcomes. bioRxiv 2021. [Google Scholar] [CrossRef]
- Gunasekara, S.; Tamil Selvan, M.; Murphy, C.L.; Shatnawi, S.; Cowan, S.; More, S.; Ritchey, J.; Miller, C.A.; Rudd, J.M. Characterization of Neutrophil Functional Responses to SARS-CoV-2 Infection in a Translational Feline Model for COVID-19. Int. J. Mol. Sci. 2024, 25, 10054. [Google Scholar] [CrossRef]
- Odon, V.; Fros, J.J.; Goonawardane, N.; Dietrich, I.; Ibrahim, A.; Alshaikhahmed, K.; Nguyen, D.; Simmonds, P. The role of ZAP and OAS3/RNAseL pathways in the attenuation of an RNA virus with elevated frequencies of CpG and UpA dinucleotides. Nucleic Acids Res. 2019, 47, 8061–8083. [Google Scholar] [CrossRef]
- Datta, P.K.; Liu, F.; Fischer, T.; Rappaport, J.; Qin, X. SARS-CoV-2 pandemic and research gaps: Understanding SARS-CoV-2 interaction with the ACE2 receptor and implications for therapy. Theranostics 2020, 10, 7448–7464. [Google Scholar] [CrossRef] [PubMed]
- Zamorano Cuervo, N.; Grandvaux, N. ACE2: Evidence of role as entry receptor for SARS-CoV-2 and implications in comorbidities. eLife 2020, 9, e61390. [Google Scholar] [CrossRef]
- Luo, D.; Bai, M.; Zhang, W.; Wang, J. The possible mechanism and research progress of ACE2 involved in cardiovascular injury caused by COVID-19: A review. Front. Cardiovasc. Med. 2024, 11, 1409723. [Google Scholar] [CrossRef]
- Bhimraj, A.; Morgan, R.L.; Shumaker, A.H.; Lavergne, V.; Baden, L.; Cheng, V.C.; Edwards, K.M.; Gandhi, R.; Muller, W.J.; O’Horo, J.C.; et al. Infectious Diseases Society of America Guidelines on the Treatment and Management of Patients with COVID-19. Clin. Infect. Dis. Off. Publ. Infect. Dis. Soc. Am. 2020, 78, e83–e102. [Google Scholar]
- Montenegro, A.F.L.; Clementino, M.A.F.; Yaochite, J.N.U. Type I interferon pathway genetic variants in severe COVID-19. Virus Res. 2024, 342, 199339. [Google Scholar] [CrossRef]
- Schönfelder, K.; Breuckmann, K.; Elsner, C.; Dittmer, U.; Fistera, D.; Herbstreit, F.; Risse, J.; Schmidt, K.; Sutharsan, S.; Taube, C.; et al. The influence of IFITM3 polymorphisms on susceptibility to SARS-CoV-2 infection and severity of COVID-19. Cytokine 2021, 142, 155492. [Google Scholar] [CrossRef]
- Paim, A.A.O.; Lopes-Ribeiro, Á.; Daian, E.S.D.S.O.; Andrade, L.A.F.; Moraes, T.F.S.; Barbosa-Stancioli, E.F.; da Fonseca, F.G.; Coelho-Dos-Reis, J.G. Will a little change do you good? A putative role of polymorphisms in COVID-19. Immunol. Lett. 2021, 235, 9–14. [Google Scholar] [CrossRef]
- van der Made, C.I.; Netea, M.G.; van der Veerdonk, F.L.; Hoischen, A. Clinical implications of host genetic variation and susceptibility to severe or critical COVID-19. Genome Med. 2022, 14, 96. [Google Scholar] [CrossRef]
- Ji, X.S.; Chen, B.; Ze, B.; Zhou, W.H. Human genetic basis of severe or critical illness in COVID-19. Front. Cell. Infect. Microbiol. 2022, 12, 963239. [Google Scholar] [CrossRef]


| Paxlovid Treatment (n = 23) | Standard Treatment (n = 49) | p-Value a | |
|---|---|---|---|
| Age, median (IQR) b | 64 (46–71) | 66 (51–72) | 0.721 |
| Male, No. (%) | 12 (52.17%) | 31 (63.26%) | 0.339 |
| BMI, kg/m2 | 26.5 (2.09–29.7) | 26.1 (23.84–30.97) | 0.717 |
| Duration of hospital stay, days | 9 (7–11) | 11 (9–14) | 0.001 |
| COVID-19 severity (moderate/severe/critical), n | 18/4/1 | 24/21/4 | 0.062 |
| Need for oxygen supply, n (%) | 5 (1.17%) | 15 (30.61%) | 0.575 |
| Paxlovid Treatment | |||||||||
|---|---|---|---|---|---|---|---|---|---|
| Genotype | ACE2 rs2074192 | Genotype | IFNAR2 rs2236757 | OAS3 rs10735079 | OAS1 rs10774671 | ||||
| Expected | Observed | Expected | Observed | Expected | Observed | Expected | Observed | ||
| CC | 14.88 | 15 | AA | 3.92 | 4 | 9.141 | 9 | 9.78 | 10 |
| CT | 7.24 | 7 | AG | 11.15 | 11 | 10.72 | 11 | 10.43 | 10 |
| TT | 0.88 | 1 | GG | 7.92 | 8 | 3.14 | 3 | 2.78 | 3 |
| χ2 = 0.025; p = 0.874 | χ2 = 0.004; p = 0.949 | χ2 = 0.039; p = 0.841 | χ2 = 0.016; p = 0.899 | ||||||
| Standard Treatment | |||||||||
| CC | 26.45 | 25 | AA | 4.29 | 3 | 19.61 | 20 | 21.55 | 23 |
| CT | 19.10 | 22 | AG | 20.42 | 23 | 22.78 | 22 | 21.59 | 19 |
| TT | 3.45 | 2 | GG | 24.29 | 23 | 6.61 | 7 | 5.56 | 7 |
| χ2 = 1.128; p = 0.569 | χ2 = 0.783; p = 0.676 | χ2 = 0.057; p = 0.972 | χ2 = 0.853; p = 0.653 | ||||||
| IFNAR2 rs2236757 | |||||||
|---|---|---|---|---|---|---|---|
| Repeated Measures | Within-Subject Effect | Between-Subject Effect | |||||
| Interaction | F | p-Value | η2p | F | p-Value | η2p | |
| Band neutrophils, % | Allele G × Time | 5.051 | p = 0.028 | 0.067 | 7.632 | p = 0.007 | 0.098 |
| Segmented neutrophils, % | 5.688 | p = 0.020 | 0.075 | 0.264 | p = 0.609 | 0.004 | |
| Platelet count | 5.977 | p = 0.017 | 0.079 | 4.468 | p = 0.038 | 0.060 | |
| Fibrinogen, g/L | 5.101 | p = 0.027 | 0.068 | 6.263 | p = 0.015 | 0.082 | |
| APPT, s. | Allele A × Time | 6.236 | p = 0.015 | 0.082 | 0.172 | p = 0.679 | 0.002 |
| Albumin, g/L | 6.258 | p = 0.015 | 0.082 | 0.783 | p = 0.379 | 0.011 | |
| OAS3 rs10735079 | |||||||
| QPT, % | Allele A × Time | 5.380 | p = 0.023 | 0.071 | 0.570 | p = 0.453 | 0.008 |
| Fibrinogen, g/L | Allele G × Time | 4.128 | p = 0.046 | 0.056 | 1.951 | p = 0.167 | 0.027 |
| OAS1 rs10774671 | |||||||
| QPT, % | Allele A × Time | 5.380 | p = 0.023 | 0.071 | 0.570 | p = 0.453 | 0.008 |
| Fibrinogen, g/L | Allele G × Time | 4.452 | p = 0.038 | 0.060 | 2.748 | p = 0.102 | 0.038 |
| Band Neutrophils, % | IFNAR2 rs2236757 Allele G | Mean | SD | SE |
|---|---|---|---|---|
| Admission | No allele G | 19.714 | 19.576 | 7.399 |
| Allele G | 9.692 | 6.685 | 0.829 | |
| Discharge | No allele G | 7.286 | 6.626 | 2.504 |
| Allele G | 3.938 | 5.166 | 0.641 | |
| Segmented Neutrophils, % | ||||
| Admission | No allele G | 52.429 | 22.150 | 8.372 |
| Allele G | 61.769 | 12.427 | 1.541 | |
| Discharge | No allele G | 67.429 | 11.297 | 4.270 |
| Allele G | 62.554 | 13.104 | 1.625 | |
| Platelet Count | ||||
| Admission | No allele G | 253.000 | 173.305 | 65.503 |
| Allele G | 215.431 | 66.937 | 8.302 | |
| Discharge | No allele G | 338.000 | 169.051 | 63.895 |
| Allele G | 239.723 | 80.180 | 9.945 | |
| Fibrinogen, g/L | ||||
| Admission | No allele G | 5.896 | 2.809 | 1.062 |
| Allele G | 3.988 | 1.511 | 0.187 | |
| Discharge | No allele G | 4.253 | 1.621 | 0.613 |
| Allele G | 3.703 | 1.147 | 0.142 | |
| APPT, s. | IFNAR2 rs2236757 Allele A | Mean | SD | SE |
| Admission | No allele A | 34.177 | 5.459 | 0.980 |
| Allele A | 33.268 | 4.522 | 0.706 | |
| Discharge | No allele A | 30.048 | 5.457 | 0.980 |
| Allele A | 31.860 | 5.116 | 0.799 | |
| Albumin, g/L | ||||
| Admission | No allele A | 46.839 | 9.256 | 1.662 |
| Allele A | 47.780 | 10.398 | 1.624 | |
| Discharge | No allele A | 45.742 | 8.000 | 1.437 |
| Allele A | 41.488 | 7.916 | 1.236 | |
| QPT, % | OAS3 rs10735079 Allele A | Mean | SD | SE |
| Admission | No allele A | 93.320 | 16.194 | 5.121 |
| Allele A | 90.676 | 18.490 | 2.348 | |
| Discharge | No allele A | 82.000 | 24.119 | 7.627 |
| Allele A | 93.182 | 18.453 | 2.344 | |
| Fibrinogen, g/L | ||||
| Admission | No allele G | 3.710 | 1.237 | 0.226 |
| Allele G | 4.504 | 1.982 | 0.306 | |
| Discharge | No allele G | 3.724 | 0.943 | 0.172 |
| Allele G | 3.779 | 1.361 | 0.210 | |
| QPT, % | OAS1 rs10774671 Allele A | Mean | SD | SE |
| Admission | No allele A | 93.320 | 16.194 | 5.121 |
| Allele A | 90.676 | 18.490 | 2.348 | |
| Discharge | No allele A | 82.000 | 24.119 | 7.627 |
| Allele A | 93.182 | 18.453 | 2.344 | |
| Fibrinogen, g/L | ||||
| Admission | No allele G | 3.686 | 1.247 | 0.220 |
| Allele G | 4.563 | 1.991 | 0.315 | |
| Discharge | No allele G | 3.691 | 0.905 | 0.160 |
| Allele G | 3.808 | 1.398 | 0.221 |
| Band Neutrophils, % | |||||||
|---|---|---|---|---|---|---|---|
| 95% CI for Mean Difference | |||||||
| IFNAR2 rs2236757 Allele G×Time | Mean Difference | Lower | Upper | SE | t | p bonf. | |
| No allele G, Admission | Allele G, Admission | 10.022 | 2.402 | 17.642 | 2.839 | 3.530 | 0.004 |
| No allele G, Discharge | 12.429 | 4.766 | 20.091 | 2.822 | 4.404 | <0.001 | |
| Allele G, Discharge | 15.776 | 8.156 | 23.396 | 2.839 | 5.557 | <0.001 | |
| Allele G, Admission | No allele G, Discharge | 2.407 | −5.214 | 10.027 | 2.839 | 0.848 | 1.000 |
| Allele G, Discharge | 5.754 | 3.239 | 8.268 | 0.926 | 6.213 | <0.001 | |
| No allele G, Discharge | Allele, G, Discharge | 3.347 | −4.273 | 10.967 | 2.839 | 1.179 | 1.000 |
| Segmented Neutrophils, % | |||||||
| No allele G, Admission | Allele G, Admission | −9.341 | −23.474 | 4.793 | 5.271 | −1.772 | 0.473 |
| No allele G, Discharge | −15.000 | −30.378 | 0.378 | 5.664 | −2.649 | 0.060 | |
| Allele G, Discharge | −10.125 | −24.259 | 4.008 | 5.271 | −1.921 | 0.342 | |
| Allele G, Admission | No allele G, Discharge | −5.659 | −19.793 | 8.474 | 5.271 | −1.074 | 1.000 |
| Allele G, Discharge | −0.785 | −5.831 | 4.262 | 1.859 | −0.422 | 1.000 | |
| No allele G, Discharge | Allele, G, Discharge | 4.875 | −9.259 | 19.008 | 5.271 | 0.925 | 1.000 |
| Platelet Count | |||||||
| No allele G, Admission | Allele G, Admission | 37.569 | −55.355 | 130.494 | 34.448 | 1.091 | 1.000 |
| No allele G, Discharge | −85.000 | −149.063 | −20.937 | 23.593 | −3.603 | 0.004 | |
| Allele G, Discharge | 13.277 | −79.648 | 106.201 | 34.448 | 0.385 | 1.000 | |
| Allele G, Admission | No allele G, Discharge | −122.569 | −215.494 | −29.645 | 34.448 | −3.558 | 0.004 |
| Allele G, Discharge | −24.292 | −45.316 | −3.269 | 7.743 | −3.138 | 0.015 | |
| No allele G, Discharge | Allele, G, Discharge | 98.277 | 5.352 | 191.201 | 34.448 | 2.853 | 0.032 |
| Fibrinogen, g/L | |||||||
| No allele G, Admission | Allele G, Admission | 1.908 | 0.362 | 3.454 | 0.576 | 3.314 | 0.007 |
| No allele G, Discharge | 1.643 | 0.092 | 3.194 | 0.571 | 2.876 | 0.032 | |
| Allele G, Discharge | 2.193 | 0.647 | 3.739 | 0.576 | 3.809 | 0.001 | |
| Allele G, Admission | No allele G, Discharge | −0.265 | −1.811 | 1.280 | 0.576 | −0.460 | 1.000 |
| Allele G, Discharge | 0.285 | −0.224 | 0.794 | 0.187 | 1.521 | 0.796 | |
| No allele G, Discharge | Allele, G, Discharge | 0.550 | −0.995 | 2.096 | 0.576 | 0.956 | 1.000 |
| APPT, s | |||||||
| 95% CI for Mean Difference | |||||||
| IFNAR2 rs2236757 Allele A × Time | Mean Difference | Lower | Upper | SE | t | p bonf. | |
| No allele A, Admission | Allele A, Admission | 0.909 | −2.361 | 4.179 | 1.216 | 0.748 | 1.000 |
| No allele A, Discharge | 4.129 | 1.897 | 6.361 | 0.822 | 5.022 | <0.001 | |
| Allele A, Discharge | 2.317 | −0.953 | 5.588 | 1.216 | 1.906 | 0.356 | |
| Allele A, Admission | No allele A, Discharge | 3.220 | −0.050 | 6.490 | 1.216 | 2.649 | 0.056 |
| Allele A, Discharge | 1.408 | −0.533 | 3.349 | 0.715 | 1.970 | 0.317 | |
| No allele A, Discharge | Allele, A, Discharge | −1.812 | −5.082 | 1.459 | 1.216 | −1.490 | 0.835 |
| Albumin, g/L | |||||||
| No allele A, Admission | Allele A, Admission | −0.942 | −6.693 | 4.809 | 2.140 | −0.440 | 1.000 |
| No allele A, Discharge | 1.097 | −3.159 | 5.353 | 1.567 | 0.700 | 1.000 | |
| Allele A, Discharge | 5.351 | −0.400 | 11.102 | 2.140 | 2.500 | 0.083 | |
| Allele A, Admission | No allele A, Discharge | 2.039 | −3.713 | 7.790 | 2.140 | 0.952 | 1.000 |
| Allele A, Discharge | 6.293 | 2.592 | 9.993 | 1.363 | 4.617 | <0.001 | |
| No allele A, Discharge | Allele, A, Discharge | 4.254 | −1.497 | 10.005 | 2.140 | 1.988 | 0.296 |
| QPT, % | |||||||
| OAS3 rs10735079 Allele A × Time | Mean Difference | Lower | Upper | SE | t | p bonf. | |
| No allele A, Admission | Allele A, Admission | 2.644 | −14.536 | 19.824 | 6.390 | 0.414 | 1.000 |
| No allele A, Discharge | 11.320 | −3.699 | 26.339 | 5.531 | 2.046 | 0.267 | |
| Allele A, Discharge | 0.138 | −17.042 | 17.318 | 6.390 | 0.022 | 1.000 | |
| Allele A, Admission | No allele A, Discharge | 8.676 | −8.504 | 25.856 | 6.390 | 1.358 | 1.000 |
| Allele A, Discharge | −2.506 | −8.538 | 3.526 | 2.221 | −1.128 | 1.000 | |
| No allele A, Discharge | Allele, A, Discharge | −11.182 | −28.362 | 5.998 | 6.390 | −1.750 | 0.498 |
| Fibrinogen, g/L | |||||||
| OAS3 rs10735079 Allele G × Time | Mean Difference | Lower | Upper | SE | t | p bonf. | |
| No allele G, Admission | Allele G, Admission | −0.794 | −1.744 | 0.157 | 0.354 | −2.242 | 0.161 |
| No allele G, Discharge | −0.014 | −0.768 | 0.740 | 0.278 | −0.050 | 1.000 | |
| Allele G, Discharge | −0.069 | −1.019 | 0.882 | 0.354 | −0.194 | 1.000 | |
| Allele G, Admission | No allele G, Discharge | 0.780 | −0.171 | 1.731 | 0.354 | 2.203 | 0.178 |
| Allele G, Discharge | 0.725 | 0.088 | 1.362 | 0.235 | 3.089 | 0.017 | |
| No allele G, Discharge | Allele, G, Discharge | −0.055 | −1.006 | 0.896 | 0.354 | −0.155 | 1.000 |
| QPT, % | |||||||
| OAS1 rs10774671 Allele A × Time | Mean Difference | Lower | Upper | SE | t | p bonf. | |
| No allele A, Admission | Allele A, Admission | 2.644 | −14.536 | 19.824 | 6.390 | 0.414 | 1.000 |
| No allele A, Discharge | 11.320 | −3.699 | 26.339 | 5.531 | 2.046 | 0.267 | |
| Allele A, Discharge | 0.138 | −17.042 | 17.318 | 6.390 | 0.022 | 1.000 | |
| Allele A, Admission | No allele A, Discharge | 8.676 | −8.504 | 25.856 | 6.390 | 1.358 | 1.000 |
| Allele A, Discharge | −2.506 | −8.538 | 3.526 | 2.221 | −1.128 | 1.000 | |
| No allele A, Discharge | Allele, A, Discharge | −11.182 | −28.362 | 5.998 | 6.390 | −1.750 | 0.498 |
| Fibrinogen, g/L | |||||||
| OAS1 rs10774671 Allele G × Time | Mean Difference | Lower | Upper | SE | t | p bonf. | |
| No allele G, Admission | Allele G, Admission | −0.877 | −1.816 | 0.062 | 0.350 | −2.507 | 0.081 |
| No allele G, Discharge | −0.005 | −0.733 | 0.724 | 0.268 | −0.018 | 1.000 | |
| Allele G, Discharge | −0.122 | −1.061 | 0.817 | 0.350 | −0.349 | 1.000 | |
| Allele G, Admission | No allele G, Discharge | 0.872 | −0.067 | 1.811 | 0.350 | 2.494 | 0.084 |
| Allele G, Discharge | 0.755 | 0.103 | 1.406 | 0.240 | 3.145 | 0.015 | |
| No allele G, Discharge | Allele, G, Discharge | −0.117 | −1.056 | 0.822 | 0.350 | −0.335 | 1.000 |
| IFNAR2 rs2236757 | |||
|---|---|---|---|
| No Allele G (n = 4) | Allele G (n = 19) | p-Value a | |
| Band neutrophils, % (IQR) | 5.5 (4.25–6.75) | 2 (2–4) | p = 0.001 |
| OAS3 rs10735079 | |||
| No Allele G (n = 10) | Allele G (n = 13) | p-Value | |
| Leukocytes, 109/L | 6.59 (4.56–8.29) | 10.4 (7.59–14.2) | p = 0.015 |
| Monocytes, % | 4 (3–7.25) | 7 (5–11) | p = 0.019 |
| Hematocrit, % | 34.2 (30.5–37.3) | 41 (36.2–44) | p = 0.018 |
| OAS1 rs10774671 | |||
| No Allele G (n = 9) | Allele G (n = 14) | p-Value | |
| Leukocytes, 109/L | 6.19 (4.40–8.34) | 10.1 (6.74–14) | p = 0.023 |
| Hematocrit, % | 35 (30.2–37.4) | 40.2 (35.2–43.5) | p = 0.040 |
| IFNAR2 rs2236757 Allele A (n = 15) Allele G (n = 19) | Admission | Discharge | p-Value a | |
| SpO2, %, median (IQR) | Allele A | 96 (94–98) | 98 (97–98) | p = 0.151 |
| Allele G | 96 (92–97) | 98 (97–98) | p = 0.019 | |
| Segmented neutrophils, % | Allele A | 55 (46–75) | 66 (48–74) | p = 0.059 |
| Allele G | 61 (47–70) | 66 (52–78) | p = 0.029 | |
| Eosinophils, % | Allele A | 1 (0–2) | 1 (0–1) | p = 0.169 |
| Allele G | 1 (1–2) | 1 (0–1) | p = 0.048 | |
| ESR, mm/h | Allele A | 7 (4–11) | 5 (4–6) | p = 0.021 |
| Allele G | 5 (4–10) | 4 (4–5) | p = 0.371 | |
| Platelet count, 109/L | Allele A | 173 (142–204) | 215 (166–244) | p = 0.041 |
| Allele G | 193 (165–231) | 220 (169–262) | p = 0.064 | |
| Hematocrit, % | Allele A | 37.2 (34–44) | 36.6 (30.8–41) | p = 0.132 |
| Allele G | 40 (34.2–45) | 37 (32–42.7) | p = 0.040 | |
| APTT, s | Allele A | 33.2 (29.4–35.3) | 32.8 (24.6–35.8) | p = 0.177 |
| Allele G | 33.2 (29.4–37) | 29.8 (25–33.7) | p = 0.035 | |
| Total bilirubin, mmol/L | Allele A | 13.4 (11.1–19.1) | 11.2 (10.7–14.1) | p = 0.128 |
| Allele G | 13.7 (10.8–19.1) | 11.2 (10.5–13.5) | p = 0.029 | |
| AST, mmol/L | Allele A | 23.3 (19–27.8) | 25.5 (23.3–67.4) | p = 0.112 |
| Allele G | 22.2 (16.6–25.8) | 30.8 (23.3–94.1) | p = 0.014 | |
| Creatinine, mmol/L | Allele A | 103 (95–117) | 92 (84–109) | p = 0.044 |
| Allele G | 96 (80–117) | 98 (86–109) | p = 0.825 | |
| Albumin, g/L | Allele A | 50 (45–57) | 43 (37–51) | p = 0.023 |
| Allele G | 50 (45–56) | 46 (42–51) | p = 0.159 | |
| ACE 2 rs2074192 Allele C (n = 22) Allele T (n = 8) | Admission | Discharge | p-Value a | |
| SpO2, %, median (IQR) | Allele C | 96 (93.5–98) | 98 (97–98) | p = 0.019 |
| Allele T | 96 (92–97.8) | 97 (97–98) | p = 0.102 | |
| Segmented neutrophils, % | Allele C | 57 (46–71.3) | 66 (51.3–75.8) | p = 0.016 |
| Allele T | 57 (44.8–65.5) | 68.5 (52.5–73.8) | p = 0.078 | |
| APTT, s | Allele C | 33.3 (29.7–37.1) | 29.8 (25.5–34.9) | p = 0.027 |
| Allele T | 32.8 (29.6–35.1) | 29.8 (25.2–34.5) | p = 0.093 | |
| Fibrinogen, g/L | Allele C | 3.99 (3.55–4.94) | 3.33 (2.76–3.99) | p = 0.017 |
| Allele T | 3.63 (3.55–4.33) | 3.83 (1.75–3.99) | p = 0.611 | |
| Total, mmol/L | Allele C | 12.7 (10.8–15.9) | 11.1 (10.6–13.7) | p = 0.112 |
| Allele T | 12.9 (10.7–17.8) | 10.8 (10.2–12) | p = 0.028 | |
| AST, mmol/L | Allele C | 22.4 (17.2–26.3) | 32.3 (24.2–81.2) | p = 0.004 |
| Allele T | 21.9 (14.9–28.1) | 29.1 (21.3–81.1) | p = 0.327 | |
| ALP, mmol/L | Allele C | 140 (116–1600 | 122 (95.3–147) | p = 0.077 |
| Allele T | 148 (125–165) | 136 (94.3–148) | p = 0.025 | |
| OAS3 rs10735079 Allele A (n = 20) Allele G (n = 13) | Admission | Discharge | p-Value a | |
| Segmented neutrophils, % | Allele A | 61 (47.5–73.8) | 70.5 (53.3–77.3) | p = 0.027 |
| Allele G | 55 (46–69.5) | 63 (48.5–75) | p = 0.307 | |
| Eosinophils, % | Allele A | 1 (0.25–2) | 1 (0–1) | p = 0.134 |
| Allele G | 1 (1–2.5) | 1 (0–1) | p = 0.046 | |
| Hematocrit, % | Allele A | 38.6 (34.3–43.5) | 37.2 (31.5–42) | p = 0.021 |
| Allele G | 42 (35.3–48.2) | 41 (36.2–44) | p = 0.916 | |
| APTT, s | Allele A | 34.2 (30–37.2) | 29.8 (26.9–35.2) | p = 0.033 |
| Allele G | 33.4 (29.9–37.1) | 29.1 (24.7–34.8) | p = 0.066 | |
| Fibrinogen, g/L | Allele A | 3.99 (3.55–)5.05 | 3.63 (2.92–3.99) | p = 0.064 |
| Allele G | 3.99 (3.55–4.1) | 3.33 (2.11–3.88) | p = 0.031 | |
| Total bilirubin, mmol/L | Allele A | 13.2 (10.7–16.7) | 11.1 (10.6–14.3) | p = 0.070 |
| Allele G | 12.9 (11.1–20.6) | 10.7 (10.3–13.2) | p = 0.021 | |
| AST, mmol/L | Allele A | 22.7 (19.4–27.3) | 30.1 (24.5–67.4) | p = 0.006 |
| Allele G | 22.2 (18.6–26.8) | 26.5 (23.9–96.3) | p = 0.116 | |
| ALP, mmol/L | Allele A | 136 (115–152) | 113 (93.8–144) | p = 0.025 |
| Allele G | 138 (121–156) | 127 (94–151) | p = 0.196 | |
| OAS1 rs10774671 Allele A (n = 20) Allele G (n = 14) | Admission | Discharge | p-Value a | |
| Segmented neutrophils, % | Allele A | 47.5 (61–73.8) | 70.5 (53.3–77.3) | p = 0.027 |
| Allele G | 57 (46–69.3) | 63 (48.8–75) | p = 0.183 | |
| Eosinophils, % | Allele A | 1 (0.25–2) | 1 (0–1) | p = 0.134 |
| Allele G | 1 (1–2.25) | 1 (0–1) | p = 0.032 | |
| Hematocrit, % | Allele A | 38.6 (34.3–43.5) | 37.2 (31.5–42) | p = 0.021 |
| Allele G | 41 (35.8–47.7) | 40.2 (35.2–43.5) | p = 0.638 | |
| Fibrinogen, g/L | Allele A | 3.99 (3.55–55) | 3.63 (2.92–3.99) | p = 0.064 |
| Allele G | 3.99 (3.55–4.26) | 3.33 (2.27–3.99) | p = 0.046 | |
| Total bilirubin, mmol/L | Allele A | 13.2 (10.7–16.7) | 11.1 (10.6–14.3) | p = 0.170 |
| Allele G | 13.3 (11.2–22) | 10.9 (10.4–13.7) | p = 0.014 | |
| AST, mmol/L | Allele A | 22.7 (19.4–27.3) | 30.1 (24.5–67.4) | p = 0.006 |
| Allele G | 22.4 (19.5–26.3) | 26 (24.2–95.2) | p = 0.096 | |
| ALP, mmol/L | Allele A | 136 (115–152) | 113 (93.8–144) | p = 0.025 |
| Allele G | 137 (120–155) | 125 (95–148) | p = 0.158 |
Disclaimer/Publisher’s Note: The statements, opinions and data contained in all publications are solely those of the individual author(s) and contributor(s) and not of MDPI and/or the editor(s). MDPI and/or the editor(s) disclaim responsibility for any injury to people or property resulting from any ideas, methods, instructions or products referred to in the content. |
© 2025 by the authors. Licensee MDPI, Basel, Switzerland. This article is an open access article distributed under the terms and conditions of the Creative Commons Attribution (CC BY) license (https://creativecommons.org/licenses/by/4.0/).
Share and Cite
Buchynskyi, M.; Kamyshna, I.; Halabitska, I.; Petakh, P.; Oksenych, V.; Kamyshnyi, O. Genetic Predictors of Paxlovid Treatment Response: The Role of IFNAR2, OAS1, OAS3, and ACE2 in COVID-19 Clinical Course. J. Pers. Med. 2025, 15, 156. https://doi.org/10.3390/jpm15040156
Buchynskyi M, Kamyshna I, Halabitska I, Petakh P, Oksenych V, Kamyshnyi O. Genetic Predictors of Paxlovid Treatment Response: The Role of IFNAR2, OAS1, OAS3, and ACE2 in COVID-19 Clinical Course. Journal of Personalized Medicine. 2025; 15(4):156. https://doi.org/10.3390/jpm15040156
Chicago/Turabian StyleBuchynskyi, Mykhailo, Iryna Kamyshna, Iryna Halabitska, Pavlo Petakh, Valentyn Oksenych, and Oleksandr Kamyshnyi. 2025. "Genetic Predictors of Paxlovid Treatment Response: The Role of IFNAR2, OAS1, OAS3, and ACE2 in COVID-19 Clinical Course" Journal of Personalized Medicine 15, no. 4: 156. https://doi.org/10.3390/jpm15040156
APA StyleBuchynskyi, M., Kamyshna, I., Halabitska, I., Petakh, P., Oksenych, V., & Kamyshnyi, O. (2025). Genetic Predictors of Paxlovid Treatment Response: The Role of IFNAR2, OAS1, OAS3, and ACE2 in COVID-19 Clinical Course. Journal of Personalized Medicine, 15(4), 156. https://doi.org/10.3390/jpm15040156