Abstract
Background: Implant-prosthetic therapy requires a detailed assessment of the bone structure before designing a personalized treatment plan. Tooth extraction at the molar level is followed by a series of bone changes dependent on the patient’s general condition and age and the area in which it was performed. The fractal analysis of cone beam computed tomography (CBCT) represents a way to assess the quality of post-extraction bone regeneration. The purpose of this study was to analyze the alveolar bone changes after tooth extraction using fractal analysis on CBCT images. Methods: This retrospective study included pre- and post-extraction CBCTs at 3 months of 60 patients who underwent 100 extractions of first and/or second molars. Fractal analysis on CBCT images was performed using ImageJ, and the data obtained from the measurements were statistically processed. A multiple regression model was used to assess factors influencing bone remodeling. Results: Fractal analysis performed on CBCT images showed that most patients experienced advanced bone remodeling, this being more pronounced in those from rural areas, in the vertical plane at the mandible and at the second molar. The multiple regression model showed that the factors that play an important role in predicting bone resorption are represented by age group (age above 56 years old is associated with less bone resorption), location (bone resorption is more pronounced at the mandible level), and molar (bone resorption for the second molar is higher). Conclusions: Post-extraction bone changes were influenced by the age of the patient and by the location of the extraction, with the maxilla and first molar having better fractal analysis values compared to the mandible and second molar. These results emphasize the importance of training implantologists in CBCT evaluation to improve personalized implant-prosthetic treatment decisions.
1. Introduction
Implant-prosthetic therapy is a highly personalized type of therapy, which starts from the detailed evaluation of the patient (general condition, oral health, and maxillary bone condition) to the decision to choose the type of implant and prosthetic work and their application in the oral cavity. The planning of the implant-prosthetic restoration must begin from the moment of the decision of tooth extraction so that means can be used to improve the success of the long-term treatment. These refer to extraction techniques and techniques for preserving the size of the alveolar process, as well as implant insertion and prosthetic techniques. In this entire personalized therapeutic approach, the bone evaluation stage with modern technologies, such as cone beam computed tomography (CBCT)/fractal analysis (FA), greatly help the doctor in choosing the extraction technique, the type of biomaterial used for bone preservation, as well as the type of implant used for the kind of bone in the respective area. Without a detailed analysis of all these elements, the long-term success of personalized implant prosthetic therapy cannot be ensured.
The success of the implant therapy depends to a great extent on the health of the jawbones and the peri-implant soft tissues. Alveolar bone changes inevitably occur, in various degrees and forms, after tooth extraction, making the quality of the remaining bone an important aspect to consider [1,2,3]. The highest rate of bone resorption occurs in the first 6 months after tooth extraction [4], with the height decreasing rapidly in the first 3 months [5]. In addition, bone resorption has been shown to be higher in the molar region [6,7] and especially in the maxilla [2,8]. The loss of alveolar bone volume and the concomitant decrease in mineral density were first studied in 1960 [9]. Radiological evaluation of the quantitative and qualitative alveolar bone is crucial for establishing a successful implant treatment plan. One such investigation method is the evaluation of the trabecular pattern using radiological analysis [10].
The three-dimensional imaging investigation method performed using CBCT has become an indispensable method in all branches of dentistry [11,12,13,14,15,16], as it allows for obtaining detailed and high-quality reformatted images [17,18]. In addition, this method offers multiple other advantages, such as a low radiation dose or improved resolution [11,19]. CBCT is an essential tool for establishing the implant treatment plan because, through it, we can easily identify patients at risk of low bone density [10,20].
In 1980, Mandelbrot first introduced the concept of fractal analysis [21,22,23], which can be numerically expressed as fractal dimension [21,22]. This concept has been used in many branches of medical science, so it has also been taken up by the field of dentistry to analyze image patterns and medical imaging [21,22], being a valuable diagnostic tool in objectively characterizing the complexity of the structure and texture of alveolar bone [21,22,24,25,26,27,28,29,30,31,32,33].
By manipulating the grayscale of radiological images of bone trabeculae, the characteristic image of fractal analysis is obtained, making it possible to visualize the internal structure of the alveolar bone [34]. This method can be considered a reflection of the microarchitecture of trabecular bone [35,36]. Numerous studies have indicated that fractal analysis by the box-counting method can successfully evaluate trabecular changes in patients with osteoporosis [26,37,38], in patients with periodontal diseases [39], and in lactating women [40]. This analysis method is even more practical in digital dental systems, as digitizing film is no longer necessary [41]. The highest measurement accuracy of fractal analysis has been reported on cone beam computed tomography (CBCT) [12].
After reviewing the literature, we found that no study has been performed to evaluate the structure of the maxillary bones before tooth extraction and 3 months after using the fractal analysis method in the three CBCT planes. The objective of the present study was to analyze the changes produced in the alveolar bone after tooth extractions using fractal analysis on CBCT images, comparing preoperative values with postoperative values at 3 months. The null hypothesis is that the post-extraction CBCT images performed at 3 months do not differ from the initial CBCT image in the studied areas.
2. Materials and Methods
2.1. Study Design
In this retrospective study, the fractal analysis used CBCT images of patients who underwent dental extractions of maxillary and mandibular molars with natural healing of post-extraction alveoli. All data were retrieved from a database of patients from the Oral Rehabilitation Department, University of Medicine and Pharmacy in Craiova, presented for diagnosis and implant treatment between January 2021 and January 2022. Data collection was performed between January 2023 and January 2024. The study protocol was approved by the Ethics Committee of the University of Medicine and Pharmacy in Craiova (Approval Number 230/28.11.2022). Surgical interventions were undertaken with each subject’s understanding and written informed consent. Patients were treated in full compliance with applicable ethical principles, including the Helsinki Declaration of the World Medical Association (2013 version).
2.2. Patient Selection
The sample size was computed using G*Power 3.1.9.7, Heinrich Heine University Düsseldorf, Germany, based on the following assumptions: a significance level α of 0.05, a power 1-β equal to 0.95, and a medium effect size value (with an awareness of practical significance), resulting in a study lot of a minimum of 55 participants. Therefore, the study group consisted of 60 non-smoking, systemically healthy patients who had posterior teeth (first and/or second molars) to be extracted to plan implant treatment. The patients included in this study belonged to both sexes and were aged between 18 and 75 years. The inclusion/exclusion criteria were drawn up as follows:
Inclusion criteria:
- Patients over 18 years of age.
- Patients with first or second molars that had to be extracted.
- Patients in whom the post-extraction sockets have at least two remaining bone walls.
- Patients who do not have serious systemic diseases in ASA I or ASA II categories.
- Cooperative patients.
- Patients who want implant-prosthetic treatment.
Exclusion criteria:
- Patients with osteoporosis, severe hypertension, diabetes, kidney disease, or liver disease.
- Patients taking anticoagulants, systemic steroids, or systemic bisphosphonates.
- Patients who smoke >10 cigarettes per day, are alcohol dependent or are drug dependent.
- Pregnant or breastfeeding patients.
- Patients with a history of radiotherapy to the surgical area.
- Patients who have chosen immediate post-extraction dental implant placement.
- Patients with poor oral hygiene.
Clinical and tomographic examinations were performed on the region of interest of each patient. Each patient’s file included two CBCTs, one performed pre-extraction and one performed three months post-extraction, which were recommended to prepare the implant treatment plan.
2.3. Patient Evaluation
A dental chart was created for each patient, with the following steps: the clinical examination with dental record, radiological analysis, dental photographs, and blood test results. The patients accepted the individualized treatment plans developed after diagnosing each case by signing the informed consent form. After tooth extraction, the patients were recalled for follow-up at 2 weeks, 1 month, and 3 months.
2.4. Radiographic Evaluation
CBCT analyses were performed before and after tooth extraction using Carestream CS 8100 3D (Carestream Dental LLC., Atlanta, GA, USA), and interpretation was performed using Carestream 3D Imaging Software, 3D Suite 3.10.38.
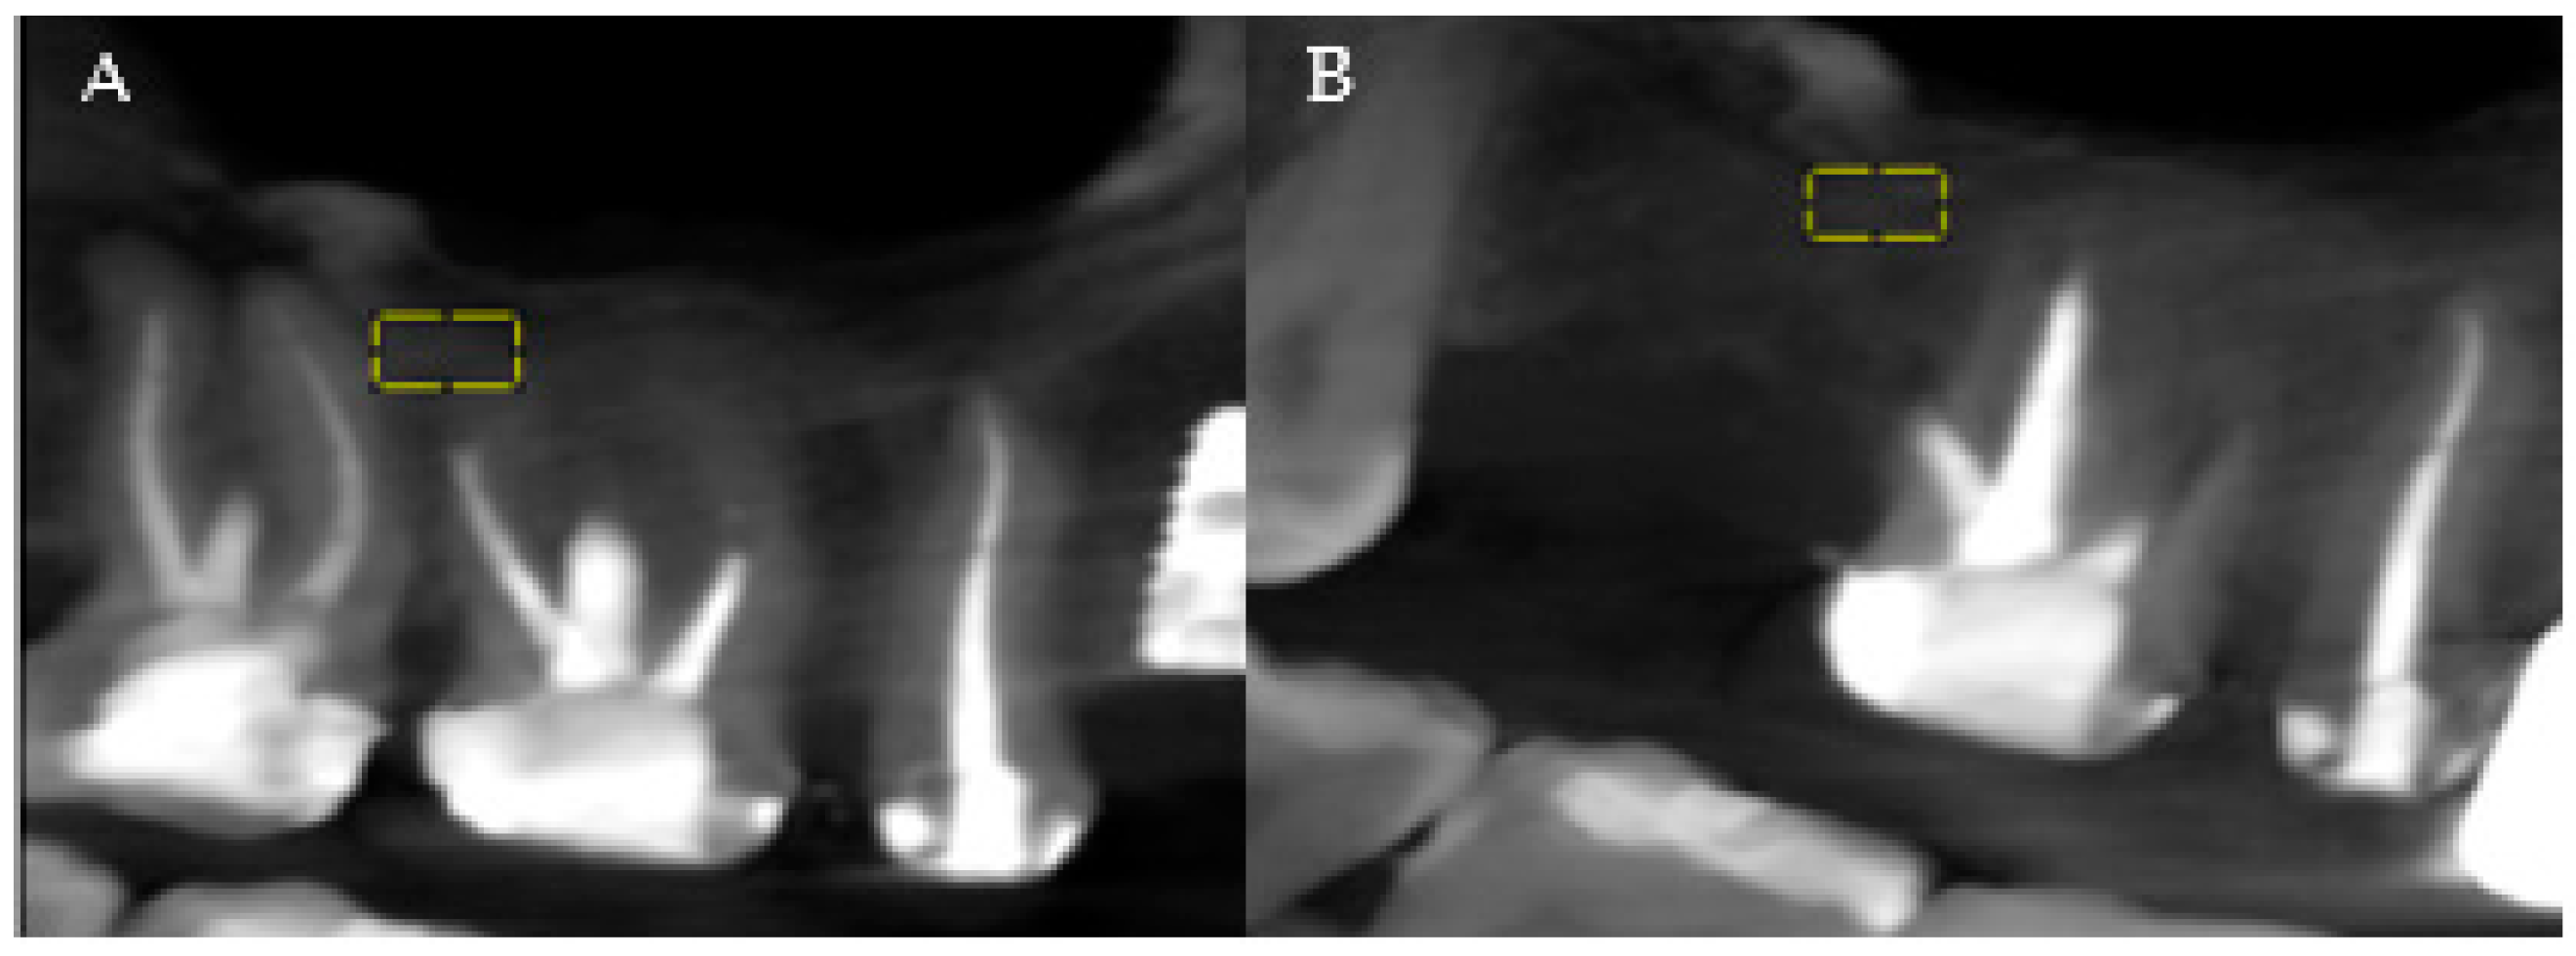
The analysis of the patients’ CBCTs from the pre-and post-extraction stages to place a dental implant was performed with both imaging software and ImageJ software (National Institutes of Health (NIH)). The precise comparison of the data obtained before and after the surgical intervention was achieved by choosing stable reference points on anatomical formations that do not change their size immediately post-extraction. At the level of the maxilla, the analysis was related to the maxillary sinus, and at the level of the mandible, the analysis was referred to the mandibular canal (Figure 1A,B, areas of interest). Measurements were performed for all three planes provided by the CBCT analysis: vertical, sagittal, and transversal.
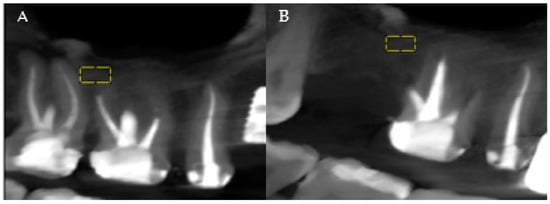
Figure 1.
(A) Maxillary CBCT—before extraction. (B) Maxillary CBCT—after extraction. Yellow = areas of interest.
2.5. Fractal Analysis
The fractal dimension measurement procedure used was the ImageJ software (version 1.54j) and the BoneJ and FracLac plugins from ImageJ. This software was chosen because it is perfect for studying trabecular bone and has the following advantages: it is free, does not require any license, and has the qualities of replicability and reproducibility.
Print screens of the CBCT sections were selected, and the images were stored in TIFF format. A region of interest (ROI) was chosen in the lateral area adjacent to the maxillary or mandibular first or second molar, following the reference selected points on each digital image, and a fractal index was calculated for the portion of the image inside it. The ROIs were placed in the trabecular portion of the maxillary and mandibular bones. For the mandible, the ROI was limited superiorly by the portion of cortical bone and inferiorly by the mandibular canal. For the maxilla, the ROI was limited superiorly by the maxillary sinus and inferiorly by the portion of cortical bone. The same ROI was built for each digital image. The size of the molars can vary and depends mainly on the individual anatomy of each individual. In general, the roots of the upper molars are wider than the lower molars. As a result, the size of the region of interest was chosen according to the minimum mesiodistal size and the minimum height of the molar roots. The dimensions and shapes of the rectangle ROIs were 40 × 20 pixels. They were selected in such a way as to avoid overlapping anatomical formations in the area, such as roots, mandibular canal, and maxillary sinus. The sequence of steps to calculate the fractal dimension was the following (Figure 2):
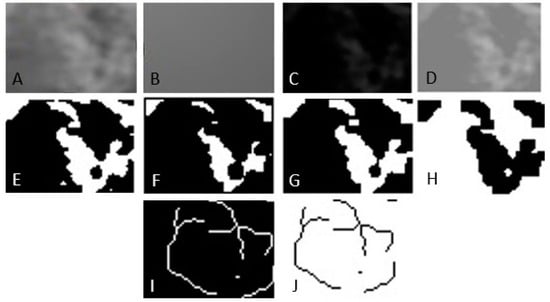
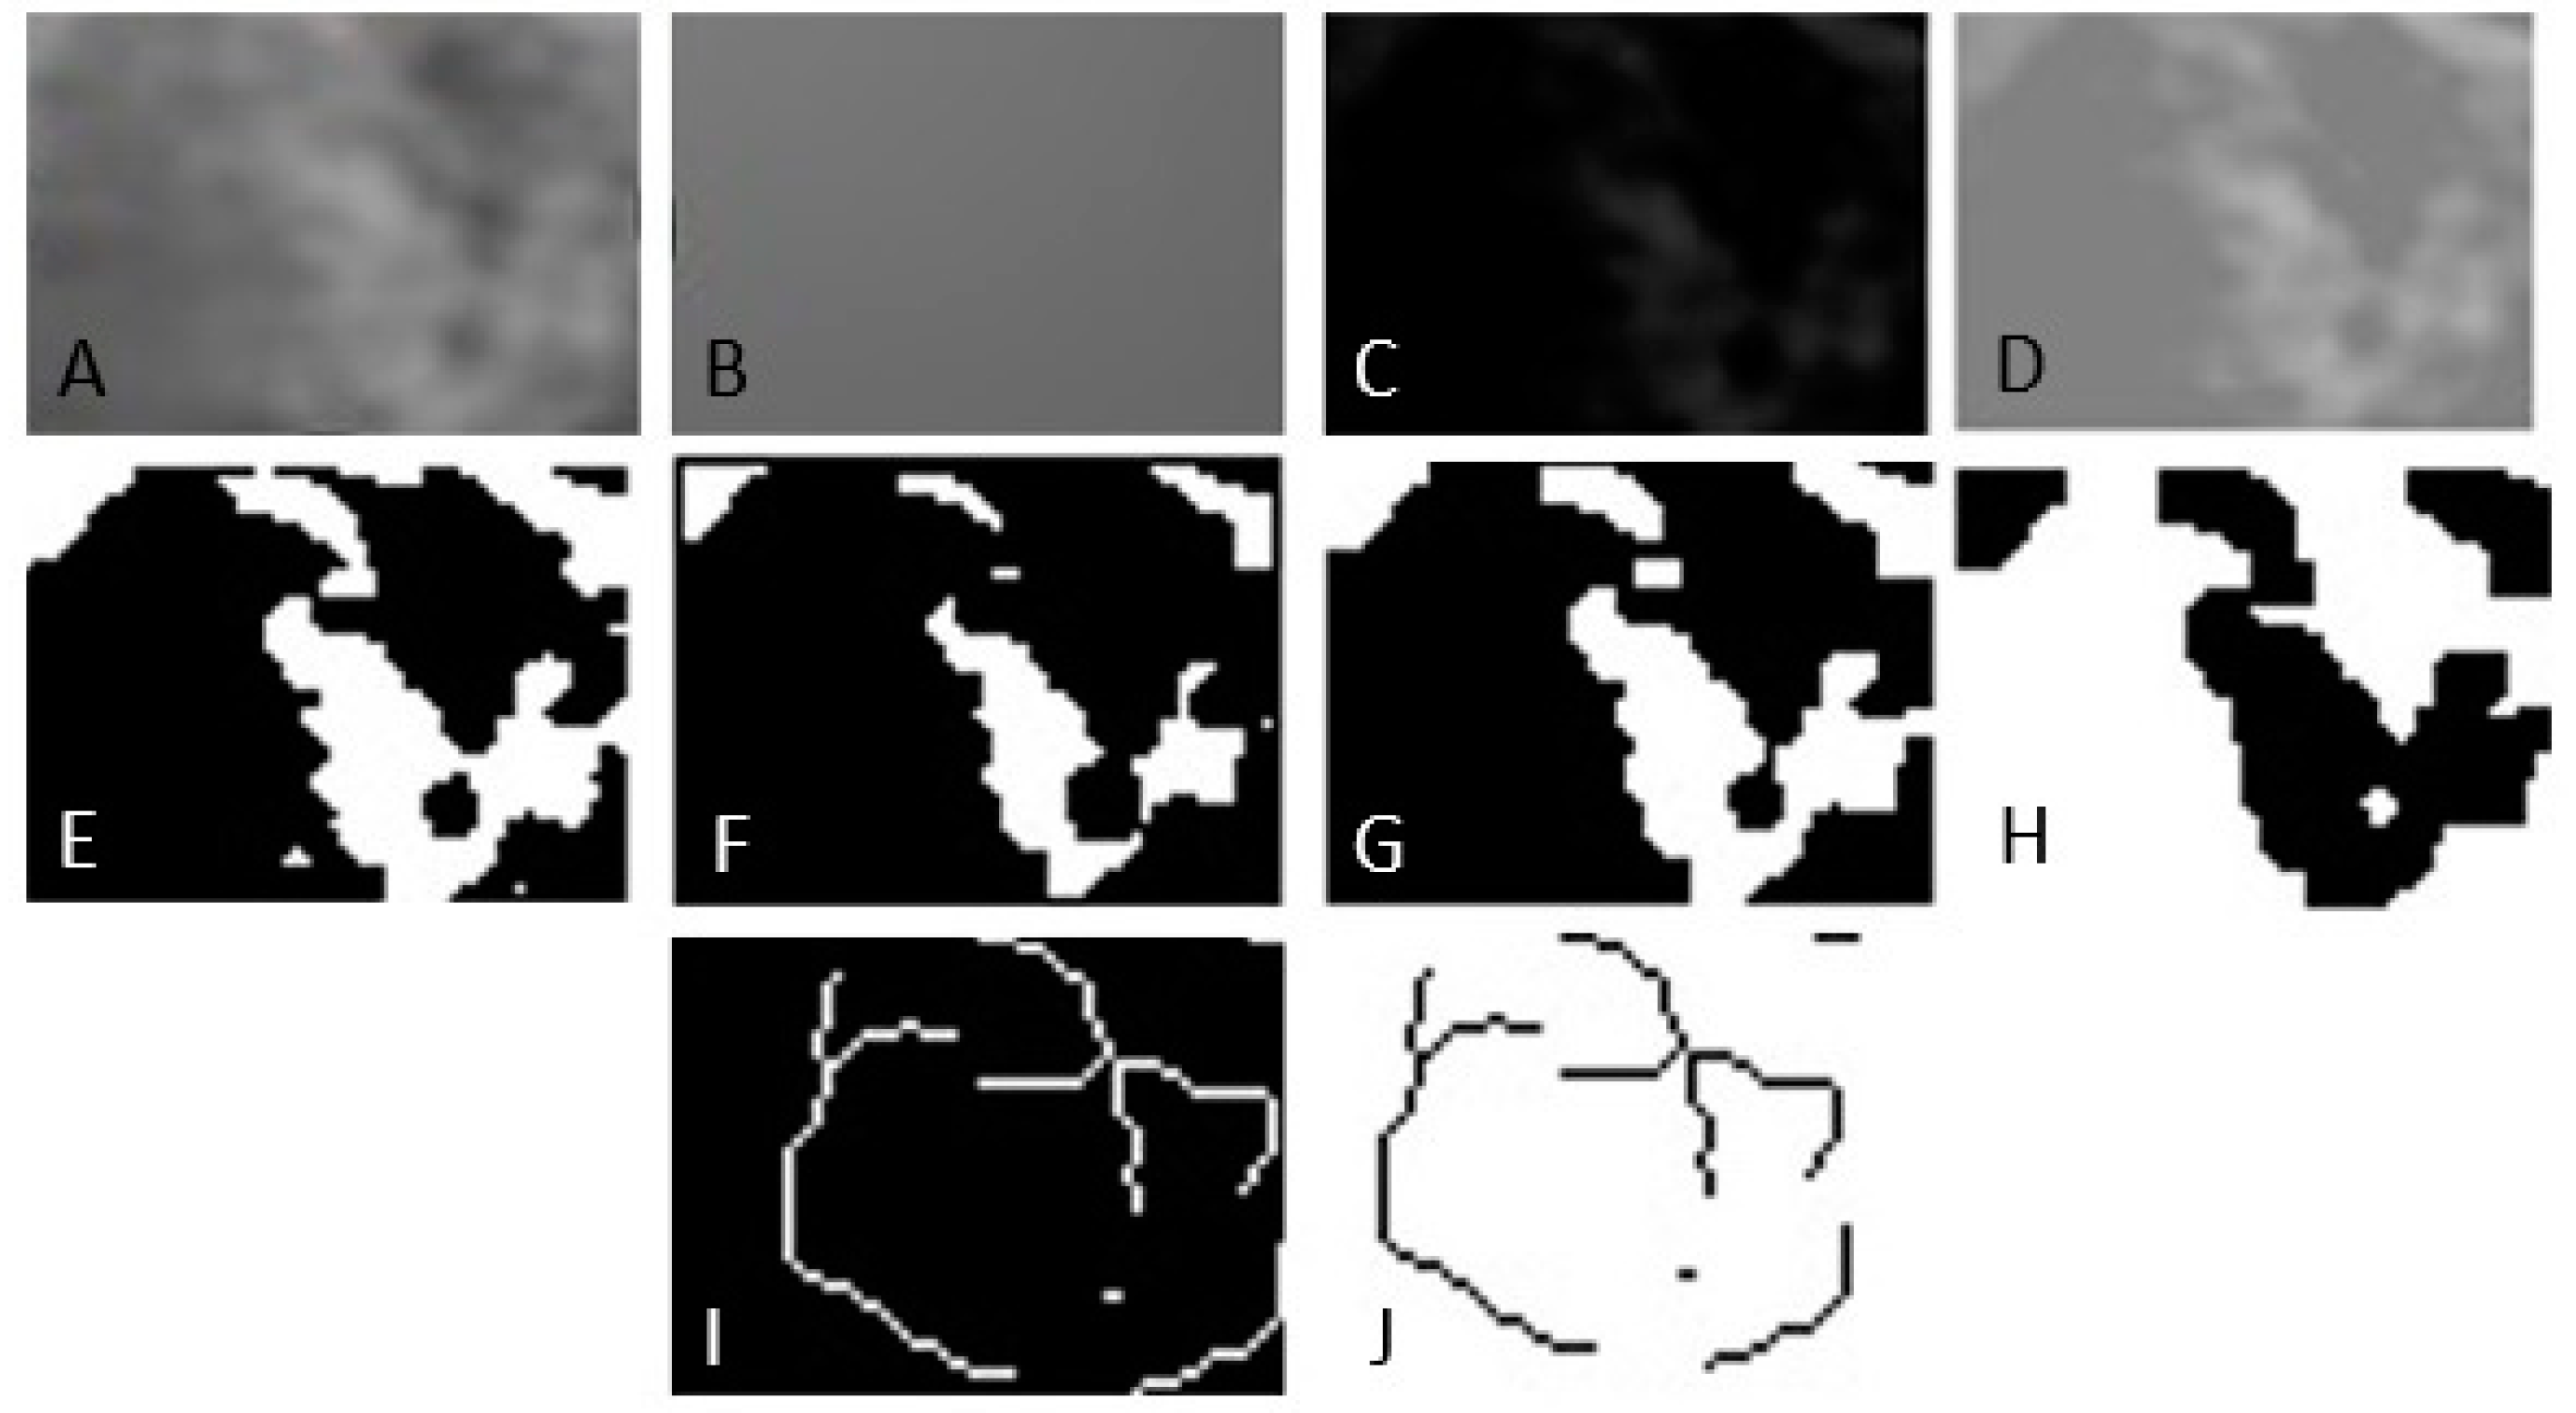
Figure 2.
Image processing method for fractal analysis. (A) Duplication. (B) Addition of Gaussian blur filter. (C) Subtraction. (D) Addition. (E) Binarization. (F) Erosion. (G) Dilatation. (H) Inversion. (I) Skeletonization. (J) Inversion.
- Selecting the region of interest (ROI).
- Cutting and duplicating.
- Smoothing by applying a Gaussian filter with a value of 35 to eliminate variations in image brightness.
- Subtracting the blurred image from the original image.
- Binarization, the trabecular bone image is set to black.
- Erosion and dilation to reduce image noise.
- Skeletonization of the image to be used for fractal analysis.
The fractal dimension was calculated using the box counting method.
The differences between the measurements following the fractal analysis were computed using the values before the procedure and after 3 months. Positive differences reflect bone resorption, as the measurements after 3 months are smaller than the initial ones. Negative differences reflect higher bone measurements after a recovery period of 3 months, which would indicate optimum bone regeneration and healing. Given that most values measured after the procedure were smaller than those measured before, so positive differences, most patients experienced bone resorption.
2.6. Statistical Analysis
Data were analyzed using SPSS (Statistical Package for Social Sciences) software, version 26 (SPSS Inc., Armonk, NY, USA). Parameters were statistically described as follows: nominal and ordinal parameters were defined as frequency distributions and associated percentages, and continuous variables were defined as the couple “mean ± standard deviation (SD)” or median values (when associated with p-values, for non-normally distributed values). Continuous data series were analyzed for normality using the Kolmogorov–Smirnov/Shapiro–Wilk test. Based on these results, comparisons between groups for all continuous variables were performed using the Mann–Whitney U test, and the strength and direction of the relationships between continuous series were performed using Spearman Rank Order correlation. Also, three multiple regression models were developed to determine the effects of several parameters on predicting the level of bone resorption in each CBCT plane. These models included two demographic variables (age and gender) and two clinical variables (location—maxilla/mandible—and molar type—first or second molar). p-values smaller than 0.05 indicate statistically significant results.
3. Results
3.1. Baseline Data
A total of 60 non-smoking, systemically healthy patients met the inclusion criteria to be included in this study, of whom 25 were male and 35 were female, aged between 26 and 67 years (mean: 52.29 ± 12.27 years), with a fairly even distribution between groups in terms of age and gender. The patients were selected from the Oral Rehabilitation Department of the University of Medicine and Pharmacy of Craiova, where more women than men usually present [42]. The choice of age criterion for the two groups was based on the principle of balancing the study groups. Ten patients were from rural areas, and fifty patients were from urban areas (Figure 3).
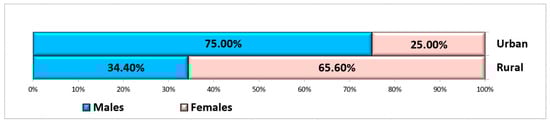
Figure 3.
Distribution of subjects according to gender and residence area.
A total of 100 extractions were performed in these patients: 23 patients had only one extraction, 34 patients had two extractions, and three patients had three extractions each. Thus, 58 extractions were performed in women, and 42 extractions were performed in men. Most extractions were performed in the mandible (59%), and the majority were first molar extractions (58%) (Table 1).

Table 1.
Demographic characteristics of patients included in the study group.
The analysis of the results by age group shows that, in the maxilla, 41 extractions were performed, of which 44% were in the age group ≤ 56 years and 56% were in the age group > 56 years. In the mandible, more extractions were performed in the age group ≤ 56 years (54%), and in the age group > 56 years, there were 46%. Most extractions were of the mandibular first molar, especially in the age group ≤ 56 years, followed by the mandibular second molar and the maxillary first molar. The fewest extractions were of the maxillary second molar (Table 2).
Table 2.
Dental extraction characteristics in the study group.
3.2. Clinical Evaluation
In all patients, no complications occurred during the healing period, and post-extraction pain was of low intensity.
3.3. Fractal Analysis Results
Using fractal analysis on CBCT, preoperative values were compared with postoperative values at 3 months. Post-extraction bone remodeling evolution was quantified as the difference between the measurements performed before the procedure and those performed after 3 months (Table 3). The evolution was measured for all three planes, and it is defined in the following sections as vertical difference, sagittal difference, and transversal difference.
Table 3.
Average values of fractal analysis—before and 3 months after tooth extraction.
Fractal analysis showed that bone density and architecture changed after tooth extraction, and the values in the three planes were similar, with density decreasing in all three planes (Table 3).
An analysis by age revealed that the patients more frequently experienced bone remodeling, measured for all three planes, and more pronounced resorption was observed in the transversal plane (median difference 0.022 compared to 0.009 for the other two planes). A Spearman’s rank-order correlation was run to assess the relationship between the patients’ age and the evolution of vertical measurements. The preliminary analysis showed the relationship to be monotonic, as evaluated by visual inspection of a scatterplot. There was no statistically significant correlation between age and vertical difference, rs (98) = −0.145, p = 0.765. Similar results were obtained for sagittal and transversal differences, with no statistically significant evolutions, p > 0.05.
Gender analysis revealed that bone remodeling is accentuated in males compared to females, as the differences in measurements performed for all three planes are higher in males (Table 4). Overall measurements indicate that post-extraction bone remodeling is generally higher for patients with ages lower than 56 years, as well as for patients living in rural areas.
Table 4.
Differences between the fractal analysis values recorded in the three CBCT planes before and 3 months after tooth extraction, according to median age, age groups, gender, and residence.
A Mann–Whitney U test was run to determine if there were differences in bone remodeling evolution between females and males for all three planes. Distributions of the differences by gender were similar, as assessed by visual inspection. Median differences for females (−0.028) and males (0.034) were statistically significantly different for sagittal measurements, U = 1548.00, z = 2.305, p = 0.021. Median differences were not statistically significant for vertical and transversal measurements, p > 0.05. Similarly, differences were not statistically significant for any of the three planes regarding the age groups or residence of the patients (Table 4).
Table 5 presents the mean values resulting from the fractal analysis, compared before and after extraction at the maxilla/mandible and at the first molar/second molar. On average, the highest values were recorded in the vertical plane at the mandible before extraction, and the lowest values were identified post-extraction in the transverse plane at the mandible. Regarding the first molar and second molar, the highest mean value was observed at the first molar post-extraction, and the lowest mean value was observed at the second molar in the transverse plane post-extraction (Table 5).
Table 5.
Average values of fractal analysis—before and after tooth extraction according to location (maxilla/mandible) and extracted tooth.
According to Table 6, maxillary/mandible measurements indicate a higher bone remodeling level for maxillary values identified in the sagittal and transversal planes and a more pronounced bone healing in the mandible for those two planes. In contrast, mandible differences in the vertical plane are higher than maxillary measurements, indicating bone remodeling in the mandible and better bone healing at the maxillary level. Statistically significant differences are identified for the vertical plane (p = 0.001) but not for the other two planes.
Table 6.
Differences between the fractal analysis values recorded in the three CBCT planes before and 3 months after tooth extraction, according to location (maxilla/mandible) and extracted tooth.
Higher bone remodeling evolutions follow extractions of the first molar compared to extraction of the second molar in both sagittal and transversal planes but not in the vertical plane, where bone healing is predominant for the first molar and bone remodeling is predominant for the second molar. Statistically significant differences are again identified for the vertical plane (p = 0.039) but not for the other two planes (Table 6).
Three multiple regression models were run to predict the fractal analysis evolutions for all three variables (vertical, sagittal, and transversal) from gender, age, location (maxilla/mandible), and molar type. There was linearity as assessed by partial regression plots and a plot of studentized residuals against the predicted values. There was independence of residuals, as assessed by a Durbin–Watson statistic of 1.814 for Vertical FD, 2.244 for Sagittal FD, and 1.876 for Transversal FD. There was homoscedasticity, as assessed by visual inspection of a plot of studentized residuals versus unstandardized predicted values. There was no evidence of multicollinearity, as assessed by tolerance values greater than 0.1. There were no studentized deleted residuals greater than ±3 standard deviations, no leverage values greater than 0.2, and no values for Cook’s distance above 1. The assumption of normality was met, as assessed by a Q-Q Plot.
The multiple regression model statistically significantly predicted the Vertical FD evolution, F(6,93) = 5.239, p < 0.0005, adj. R2 = 0.253. Three variables added statistically significantly to the prediction: age group, location, and molar type, p < 0.05 (Table 7).
Table 7.
Multiple regression model: Linear coefficients—Vertical differences.
For the Vertical FD evolution, an increase in the age group (patients with ages above 56 years) was associated with a decrease in the difference between vertical measurements (so less different values before and after).
The predicted difference (evolution) for the mandible was 0.116 greater than that predicted for the maxillary (with all values of all other independent variables being held constant). So, all other things being equal, the vertical differences in the mandible are 0.116 (on average) greater than in the maxillary. Similarly, the predicted difference (evolution) for the second molar is 0.069 greater than that predicted for the first molar (with all values of all other independent variables being held constant).
The multiple regression model did not statistically significantly predict the Sagittal FD evolution, F(6,93) = 1.150, p = 0.340, nor the Transversal FD evolution, F(6,93) = 1.293, p = 0.268.
4. Discussion
The detailed pre- and post-extraction bone assessment stage is of particular importance in the success of personalized implant-prosthetic treatment. Since the molar area, both maxillary and mandibular, is the most important support area in mastication and occlusion, the restoration of occlusal stops after tooth extraction can be achieved in optimal conditions only through implant-prosthetic treatment [43]. Massive bone resorption occurs post-extraction in these areas, especially in the first 3 months [44,45,46,47]. Therefore, it is essential to know the evolution of the bone during this period so that the best therapeutic decisions can be made to preserve the bone reserve (socket preservation therapies).
For this purpose, CBCT is a very useful tool for the evaluation of the three spatial planes, both of the bone dimensions and of its quality, by calculating bone density. In addition to the density assessment by CBCT (not offered by all radiological software), the fractal analysis of CBCT images brings new information regarding the state of bone mineralization and the quality of bone trabeculae. All this information is beneficial for all dentists practicing personalized implant-prosthetic therapy.
This retrospective study evaluated bone changes in the vertical, horizontal, and sagittal planes after dental extractions. By analyzing the fractal dimension on CBCT images, bone density values were compared before dental extraction and 3 months post-extraction. The same study period was chosen in other studies in the literature [44,45,46,47].
Only molars one and two were included in this study to homogenize the studied groups and to minimize, as much as possible, the structural differences of the alveolar bone. Significant post-extraction resorption occurs at the molar level, especially in the vertical dimension of the alveolar process [2].
The same protocol was used for all patients, and no complications were reported during the healing period; however, most patients experienced a reduction in bone volume. Most patients were female, and the majority of extractions were of mandibular molars.
In recent years, implant treatment has become the first choice for edentulous prosthetics. An accurate preoperative evaluation is crucial for planning dental implant therapy [48,49,50,51,52,53]. The quality of the bone structure is defined by the degree of mineralization, bone morphology, physiology, and the type of trabecular pattern [54,55,56,57,58]. Understanding the structure and microarchitecture of the jaw bones helps choose an ideal therapeutic intervention method [57]. Bone mineral density (BMD) is one of the parameters that most strongly indicates bone quality [56,59,60,61]. It is essential to prepare the bone for implant treatment by controlling the resorption and remodeling phenomena that occur during the healing process [44,45,46].
Numerous studies have demonstrated a significantly greater decrease in bone thickness in the crestal third of the alveolar bone [47,62,63]. Still, other studies have shown a significantly greater reduction in the center of the post-extraction socket [64]. Hayek et al. showed in their research that the density of the cancellous bone is directly responsible for the stability of the dental implant [65]. For this reason, the area of interest analyzed in this article was chosen not to include parts of the cortical bone but only of the trabecular bone.
Standard dental radiological analyses, such as orthopantomography, CBCT, bitewing radiographs, and cephalometric analysis, have been used for fractal analysis [17,27,66]. The main advantage of CBCT is the feasibility of accurately assessing the quality of the bone structure. Other benefits of this radiological evaluation method compared to orthopantomography or conventional computer tomography are the following: a low radiation dose, minimal image distortion, higher resolution, the possibility of obtaining real-size images, and shorter acquisition times [11,13,14,27,67,68,69,70,71]. CBCT is a reliable tool for evaluating and planning implant treatment and assessing bone quality, quantity, and density [5,17,55,68,72,73,74,75,76,77,78,79,80,81,82,83,84].
Also, in recent years, numerous strategies have been developed to assess the structure of the jaw bones. Among these is fractal analysis, which has become increasingly used [85,86,87]. Fractal analysis is a precise, economical, and efficient method of describing the complexity of fractal structures [85,86,87,88,89,90]. The process of obtaining the images is essential in fractal analysis. Amuk et al.’s study demonstrated that image format can influence fractal analysis. At the same time, kVp and mA time settings do not significantly impact fractal analysis for periapical radiographs. The settings used for three-dimensional CBCT images can affect the analysis [66]. For this reason, in this study, we used CBCT images produced by the same device to eliminate this factor that creates variations in fractal analysis. The image format is essential for fractal analysis. JPEG is the most widely used format, which offers a high level of portability. However, it has been proven that the image quality is poorer than that of other formats, such as TIFF. The TIFF format is considered to be the most useful choice because it uses the LC technique [91]. In many studies in the literature in which fractal analysis was performed on images with different formats, it was found that the TIFF format had a significantly higher FD [32,66,92].
Quantification of the trabecular bone pattern uses the box-counting technique [22,88,89,93]. The increase in the fractal dimension value is directly proportional to the complexity of the bone structure [88,89].
Hayek et al. define the results of fractal analysis as bone mineral density values [65]. Reduction in bone density values corresponds to a decrease in fractal dimension [38]. Also, the same study showed that bone density had higher values in the mandible than in the maxilla [65]. A similar result was obtained in our research in the vertical plane.
Hayek et al. correlated the fractal value of intraoral radiographs in Photo Stimulable Phosphor Plate (PSP) at the molar level with the density obtained from the analysis of the bone harvested from the respective area [65]. Their study showed that a fractal value of 1.451 of the maxillary bone in the molar area corresponds to a density of 0.150 g/cm3, evaluated by Misch [94] as type 4. A fractal value of 1.550 in the mandibular molar area corresponds to a bone density of 0.379 g/cm3, representing Misch type 3 density [65,94]. Thus, they highlighted that, in the posterior maxillary area (premolar, molar), there are densities of type 3–4, with fractal values of 1.451 to 1.544, and in the posterior mandibular area, there are densities of type 2–3, with fractal values of 1.550 and 1.563 [65]. In our study, the values of the fractal analysis ranged from 0.66 to 1.378, which shows that the bone density in the lateral maxillary and mandibular areas is very low, corresponding to Misch type 4. Our result correlates with the results of another study conducted on Romanian patients, performed on CBCT, which showed that, in the lateral maxillary area, the bone density corresponded to Misch type 4, and in the lateral mandibular area, it corresponded to Misch type 3 [95]. Another study conducted on another Romanian population group showed CBCT bone density values evaluated at the level of the maxillary 1st molar in the trabecular area with an average of 557.45 HU, Misch type 4 density, and at the level of the mandibular 1st molar in the trabecular area with an average of 561.15 HU, Misch type 3 density [96].
The multiple regression model used to analyze the fractal results of bone density in the maxillary and mandibular molar areas showed correlations with age groups, jaw type, and molar type.
In general, alveolar bone is denser anteriorly and progressively decreases posteriorly. The first molar plays an essential role in mastication, taking on greater forces than the second molar [43]. Wolff’s law states that bone remodels and changes its density depending on the mechanical stress it is subjected to [97]. Because the first molar is more mechanically stressed than the second molar, the bone around it develops to withstand these greater forces, leading to greater density.
In the case of a recent extraction, there may initially be more rapid bone remodeling in the maxilla, which could explain the appearance of a higher density in the short term. In the mandible, bone resorption may be more pronounced at the cortical level, which could give the impression of an apparent decrease in local density. The mandible and maxilla are not uniform in density, as the density varies according to location, bone type, and mechanical stress [97]. The statistically significant differences observed in the measurements made using fractal analysis on CBCT in the vertical plane correlate with the important changes that occur in the vertical plane post-extraction in the two jaws. Since the comparison is made at 3 months and the bone remodeling process is not finished, which can last up to 12 months, this may represent only a transitional phase, which makes the existence of higher values post-extraction in the maxilla than in the mandible plausible. In this case, it is vital to consider the optimal moment of implant insertion to obtain the maximum result in both osseointegration and preservation of the size of the post-extraction alveolar process.
Factors that may lead to higher bone density in elderly patients are reduced bone remodeling or more prolonged exposure to mechanical stress. In young people, bone remodels more rapidly, meaning there is a balance between bone formation and resorption [98]. This process slows down in older people, and cortical bone can become denser but also more fragile (bone sclerosis) [99]. Older patients have been subjected to mechanical stress for longer, which can stimulate osteogenesis and increase bone density in stress areas. Although bone can be dense, it can also be less vascular and more fragile [100].
The decision to extract a tooth, especially a molar, should be accompanied by a decision regarding a socket preservation modality or immediate implantation [2]. Only in this way can the situation be avoided in which extensive significant resorption has already occurred, and the solutions available for performing implant-prosthetic treatment in good conditions involve either avoiding the molar area (as in all on x or fast and fix solutions) [101] or complex interventions with lower chances of success (such as a sinus lift) [102]. All this information is even more important as patients age [103].
The limitations of this study are that it was conducted at a single university, being mono-centric, and the sample may not represent broader demographic variations.
5. Conclusions
Fractal analysis of CBCT in the three planes showed that the bone density of the maxillary and mandibular molar trabecular area was low pre- and post-extraction, with values corresponding to type 4 density assessed by Misch. At 3 months post-extraction, bone density was higher in the maxilla than in the mandible and higher in the first molar than in the second molar. Age was an element that also influenced density, with individuals under 56 years having lower density post-extraction, indicating a higher regeneration rate.
All implantology specialists treating patients in this region should be aware of this data to decide based on evidence-based dentistry to improve the success rate of personalized implant-prosthetic treatment.
Author Contributions
Conceptualization, S.M.P., M.I. and A.S.K.; methodology, S.M.P., I.R.M. and M.O.A.; software, A.I.S. and M.I.; validation, A.I.S., R.E.G. and I.R.M.; formal analysis, M.O.C., M.O.A. and A.I.S.; investigation, A.S.K., R.E.G., A.I.S. and I.R.M.; resources, E.C.D. and M.O.A.; data curation, M.I., A.I.S. and R.E.G.; writing—original draft preparation, A.S.K. and M.I.; writing—review and editing, S.M.P. and I.R.M.; visualization, M.O.C. and E.C.D.; supervision, S.M.P.; project administration, S.M.P. All authors have read and agreed to the published version of the manuscript.
Funding
Article publication charges are supported by the University of Medicine and Pharmacy of Craiova.
Institutional Review Board Statement
This study was conducted in accordance with the Declaration of Helsinki and approved by the Ethics Commission of the University of Medicine and Pharmacy of Craiova, no. 230/28.11.2022.
Informed Consent Statement
Informed consent was obtained from all subjects involved in this study.
Data Availability Statement
The authors declare that the data of this research are available from the corresponding authors upon reasonable request.
Conflicts of Interest
The authors declare no conflicts of interest.
Abbreviations
The following abbreviations are used in this manuscript:
| CBCT | Cone Beam Computed Tomography |
| FD | Fractal Dimension |
| ASA | American Society of Anesthesiologists |
| NIH | National Institutes of Health |
| ROI | Rectangular Region of Interest |
| BMD | Bone Mineral Density |
| PSP | Photo Stimulable Phosphor Plate |
| HU | Hounsfield Units |
References
- Ramalingam, S.; Sundar, C.; Jansen, J.A.; Alghamdi, H. Alveolar bone science: Structural characteristics and pathological changes. In Dental Implants and Bone Grafts; Woodhead Publishing: Sawston, UK, 2020; pp. 1–22. [Google Scholar]
- Khaddour, A.S.; Ghiță, R.E.; Ionescu, M.; Rîcă, R.G.; Mercuț, V.; Manolea, H.O.; Camen, A.; Drăghici, E.C.; Radu, A.; Popescu, S.M. Healing of Extraction Sites After Alveolar Ridge Preservation Using Advanced Platelet-Rich Fibrin: A Retrospective Study. Bioengineering 2024, 11, 566. [Google Scholar] [CrossRef] [PubMed]
- Ozzo, S.; Kheirallah, M. The efficiency of two different synthetic bone graft materials on alveolar ridge preservation after tooth extraction: A split-mouth study. BMC Oral Health 2024, 24, 1040. [Google Scholar] [CrossRef]
- de Sousa Gomes, P.; Daugela, P.; Poskevicius, L.; Mariano, L.; Fernandes, M.H. Molecular and Cellular Aspects of Socket Healing in the Absence and Presence of Graft Materials and Autologous Platelet Concentrates: A Focused Review. J. Oral Maxillofac. Res. 2019, 10, e2. [Google Scholar] [PubMed]
- Schropp, L.; Wenzel, A.; Kostopoulos, L.; Karring, T. Bone healing and soft tissue contour changes following single-tooth ex-traction: A clinical and radiographic 12-month prospective study. Int. J. Periodontics Restor. Dent. 2003, 23, 313–323. [Google Scholar]
- Hämmerle, C.H.; Araújo, M.G.; Simion, M. Osteology Consensus Group 2011. Evidence-based knowledge on the biology and treatment of extraction sockets. Clin. Oral Implant. Res. 2012, 23, 80–82. [Google Scholar]
- Mampilly, M.O.; Rao, L.P.; Sequiera, J.; Rao, B.H.; Chandra, J.; Rai, G. Rehabilitation of edentulous atrophic anterior mandible—The role of vertical alveolar distraction osteogenesis. J. Clin. Diagn. Res. 2014, 8, ZR01–ZR03. [Google Scholar] [CrossRef]
- Kim, J.J.; Ben Amara, H.; Chung, I.; Koo, K.T. Compromised extraction sockets: A new classification and prevalence involving both soft and hard tissue loss. J. Periodontal Implant. Sci. 2021, 51, 100–113. [Google Scholar] [CrossRef] [PubMed]
- Groen, J.J.; Duyvensz, F.; Halsted, J.A. Diffuse alveolar atrophy of the jaw (non-inflammatory form of paradental disease) and pre-senile osteoporosis. Gerontol. Clin. 1960, 2, 68–86. [Google Scholar] [CrossRef]
- Franciotti, R.; Moharrami, M.; Quaranta, A.; Bizzoca, M.E.; Piattelli, A.; Aprile, G.; Perrotti, V. Use of fractal analysis in dental images for osteoporosis detection: A systematic review and meta-analysis. Osteoporos. Int. 2021, 32, 1041–1052. [Google Scholar] [CrossRef]
- Strauss, F.J.; Gil, A.; Smirani, R.; Rodriguez, A.; Jung, R.; Thoma, D. The use of digital technologies in peri-implant soft tissue augmentation—A narrative review on planning, measurements, monitoring and aesthetics. Clin. Oral Implant. Res. 2024, 35, 922–938. [Google Scholar] [CrossRef]
- Rytky, S.J.O.; Tiulpin, A.; Finnilä, M.A.J.; Karhula, S.S.; Sipola, A.; Kurttila, V.; Valkealahti, M.; Lehenkari, P.; Joukainen, A.; Kröger, H.; et al. Clinical Super-Resolution Computed Tomography of Bone Microstructure: Application in Musculoskeletal and Dental Imaging. Ann. Biomed. Eng. 2024, 52, 1255–1269. [Google Scholar] [CrossRef]
- Al-Sosowa, A.A.; Alhajj, M.N.; Abdulghani, E.A.; Al-Moraissi, E.A.; Zheng, H.; Pang, Y.; Wang, J. Three-dimensional Analysis of Alveolar Bone with and Without Periodontitis. Int. Dent. J. 2022, 72, 634–640. [Google Scholar] [CrossRef] [PubMed]
- He, R.T.; Tu, M.G.; Huang, H.L.; Tsai, M.T.; Wu, J.; Hsu, J.T. Improving the prediction of the trabecular bone microarchitectural parameters using dental cone-beam computed tomography. BMC Med. Imaging 2019, 19, 10. [Google Scholar] [CrossRef] [PubMed]
- Karhula, S.S.; Finnilä, M.A.J.; Rytky, S.J.O.; Cooper, D.M.; Thevenot, J.; Valkealahti, M.; Pritzker, K.P.H.; Haapea, M.; Joukainen, A.; Lehenkari, P.; et al. Quantifying Subresolution 3D Morphology of Bone with Clinical Computed Tomography. Ann. Biomed. Eng. 2020, 48, 595–605. [Google Scholar] [CrossRef] [PubMed]
- Feng, B.; Li, F.; Du, Q. Analysis on the relationship between Schneiderian membrane thickening in the posterior maxillary region and periapical lesions by cone beam computed tomography. Hua Xi Kou Qiang Yi Xue Za Zhi 2024, 42, 644–651. [Google Scholar]
- Yeung, A.W.K.; AlHadidi, A.; Vyas, R.; Bornstein, M.M.; Watanabe, H.; Tanaka, R. Nonionizing diagnostic imaging modalities for visualizing health and pathology of periodontal and peri-implant tissues. Periodontology 2000 2024, 95, 87–101. [Google Scholar] [CrossRef]
- Padhye, N.M.; Shirsekar, V.U.; Rakhangi, R.S.; Chalakuzhy, P.M.; Joshi, A.V. Three-dimensional assessment of the mandibular lingual foramina with implications for surgical and implant therapy: A multicentre cross-sectional study. J. Oral Biol. Craniofac. Res. 2023, 13, 186–190. [Google Scholar] [CrossRef]
- Barra, S.G.; Gomes, I.P.; Amaral, T.M.P.; Brasileiro, C.B.; Abreu, L.G.; Mesquita, R.A. New mandibular indices in cone beam computed tomography to identify low bone mineral density in postmenopausal women. Oral Surg. Oral Med. Oral Pathol. Oral Radiol. 2021, 131, 347–355. [Google Scholar] [CrossRef]
- Kathirvelu, D.; Vinupritha, P.; Kalpana, V. A computer aided diagnosis system for measurement of mandibular cortical thickness on dental panoramic radiographs in prediction of women with low bone mineral density. J. Med. Syst. 2019, 43, 148. [Google Scholar] [CrossRef]
- Soylu, E.; Coşgunarslan, A.; Çelebi, S.; Soydan, D.; Demirbaş, A.E.; Demir, O. Fractal analysis as a useful predictor for deter-mining osseointegration of dental implant? A retrospective study. Int. J. Implant. Dent. 2021, 7, 14. [Google Scholar] [CrossRef]
- Geraets, W.G.; van der Stelt, P.F. Fractal properties of bone. Dentomaxillofac. Radiol. 2000, 29, 144–153. [Google Scholar] [CrossRef]
- Sánchez, I.; Uzcátegui, G. Fractals in dentistry. J. Dent. 2011, 39, 273–292. [Google Scholar] [CrossRef]
- Yavuz, E.; Yardimci, S. Comparison of periapical radiography, panoramic radiography, and CBCT in the evaluation of trabecular bone structure using fractal analysis. Oral Radiol. 2024, 40, 394–400. [Google Scholar] [CrossRef]
- Fazzalari, N.L.; Parkinson, I.H. Fractal dimension and architecture of trabecular bone. J. Pathol. 1996, 178, 100–105. [Google Scholar] [CrossRef]
- Ruttimann, U.E.; Webber, R.L.; Hazelrig, J.B. Fractal dimension from radiographs of peridental alveolar bone. A possible diagnostic indicator of osteoporosis. Oral Surg. Oral Med. Oral Pathol. 1992, 74, 98–110. [Google Scholar] [CrossRef]
- Kato, C.N.; Barra, S.G.; Tavares, N.P.; Amaral, T.M.; Brasileiro, C.B.; Mesquita, R.A.; Abreu, L.G. Use of fractal analysis in den-tal images: A systematic review. Dentomaxillofac. Radiol. 2020, 49, 20180457. [Google Scholar] [CrossRef]
- Parkinson, I.H.; Fazzalari, N.L. Methodological principles for fractal analysis of trabecular bone. J. Microsc. 2000, 198, 134–142. [Google Scholar] [CrossRef]
- Dundar, N.; Aslan, E.; Mutlu, O. Fractal dimension, lacunarity, and bone area fraction analysis of peri-implant trabecular bone after prosthodontic loading. Oral Radiol. 2025, 41, 120–130. [Google Scholar] [CrossRef]
- Kış, H.C.; Güleryüz Gürbulak, A. Evaluation of the peri-implant bone trabecular microstructure changes in short implants with fractal analysis. Int. J. Implant. Dent. 2020, 6, 13. [Google Scholar] [CrossRef]
- Gazzotti, S.; Aparisi Gómez, M.P.; Schileo, E.; Taddei, F.; Sangiorgi, L.; Fusaro, M.; Miceli, M.; Guglielmi, G.; Bazzocchi, A. High-resolution peripheral quantitative computed tomography: Research or clinical practice? Br. J. Radiol. 2023, 96, 20221016. [Google Scholar] [CrossRef]
- Toghyani, S.; Nasseh, I.; Aoun, G.; Noujeim, M. Effect of Image Resolution and Compression on Fractal Analysis of the Peri-apical Bone. Acta Inform. Med. 2019, 27, 167–170. [Google Scholar] [CrossRef]
- Kavitha, M.S.; Park, S.Y.; Heo, M.S.; Chien, S.I. Distributional Variations in the Quantitative Cortical and Trabecular Bone Radiographic Measurements of Mandible, Between Male and Female Populations of Korea, and Its Utilization. PLoS ONE 2016, 11, e0167992. [Google Scholar] [CrossRef]
- Ozturk, E.M.A.; Artas, A. Evaluation of Bone Mineral Changes in Panoramic Radiographs of Hypothyroid and Hyperthyroid Patients Using Fractal Dimension Analysis. J. Clin. Densitom. 2024, 27, 101443. [Google Scholar] [CrossRef]
- Lyu, L.; Yang, S.; Jing, Y.; Zhang, C.; Wang, J. Examining trabecular morphology and chemical composition of peri-scaffold osseointegrated bone. J. Orthop. Surg. Res. 2020, 15, 406. [Google Scholar] [CrossRef]
- Pothuaud, L.; Benhamou, C.L.; Porion, P.; Lespessailles, E.; Harba, R.; Levitz, P. Fractal dimension of trabecular bone projection texture is related to three-dimensional microarchitecture. J. Bone Miner. Res. 2000, 15, 691–699. [Google Scholar] [CrossRef]
- Abdinian, M.; Milaei, M.; Soltani, P. Digital panoramic radiography and CBCT as auxiliary tools for detection of low bone mineral density in post-menopausal women: A cross-sectional study. BMC Med. Imaging 2023, 23, 78. [Google Scholar] [CrossRef]
- Southard, T.E.; Southard, K.A.; Jakobsen, J.R.; Hillis, S.L.; Najim, C.A. Fractal dimension in radiographic analysis of alveolar process bone. Oral Surg. Oral Med. Oral Pathol. Oral Radiol. Endodontol. 1996, 82, 569–576. [Google Scholar] [CrossRef]
- Aktuna Belgin, C.; Serindere, G. Evaluation of trabecular bone changes in patients with periodontitis using fractal analysis: A periapical radiography study. J. Periodontol. 2020, 91, 933–937. [Google Scholar] [CrossRef]
- Coşgunarslan, A.; Cangerm, E.M.; Soydan Çabuk, D.; Kış, H.C. The evaluation of the mandibular bone structure changes re-lated to lactation with fractal analysis. Oral Radiol. 2020, 36, 238–247. [Google Scholar] [CrossRef]
- Wilding, R.J.; Slabbert, J.C.; Kathree, H.; Owen, C.P.; Crombie, K.; Delport, P. The use of fractal analysis to reveal remodeling in human alveolar bone following the placement of dental implants. Arch. Oral Biol. 1995, 40, 61–72. [Google Scholar] [CrossRef]
- Popescu, A.M.; Scrieciu, M.; Dobre, F.A.; Roxana, I.; Marinescu, E.C.D.; Cojocaru, M.O.; Popescu, S.M. Oral health and the need for dental care in a group of patients from Oltenia. Rom. J. Dent. Res. 2016, 1, 62–76. [Google Scholar] [CrossRef]
- Omi, M.; Mishina, Y. Roles of osteoclasts in alveolar bone remodeling. Genesis 2022, 60, e23490. [Google Scholar] [CrossRef]
- López-Valverde, N.; Macedo de Sousal, B.; Blanco Rueda, J.A. Changes of the Alveolar Bone Ridge Using Bone Mineral Grafts and Collagen Membranes After Tooth Extraction: A Systematic Review and Meta-Analysis. Bioengineering 2024, 11, 565. [Google Scholar] [CrossRef]
- Wen, C.; Zhang, Q. Pilot study of fractal dimension analysis of osteogenesis for bone substitute materials of Bio-Oss in lateral sinus augmentation. PLoS ONE 2023, 18, e0296248. [Google Scholar] [CrossRef]
- Yu, W.; Zhong, L.; Yao, L.; Wei, Y.; Gui, T.; Li, Z.; Kim, H.; Holdreith, N.; Jiang, X.; Tong, W.; et al. Bone marrow adipogenic lineage precursors promote osteoclastogenesis in bone remodeling and pathologic bone loss. J. Clin. Investig. 2021, 131, e140214. [Google Scholar] [CrossRef]
- Hu, K.F.; Lin, S.W.; Lin, Y.C.; Jeng, J.H.; Huang, Y.T.; Liu, P.F.; Tseng, C.J.; Chou, Y.H. Using Cone-Beam Computed Tomography to Assess Changes in Alveolar Bone Width around Dental Implants at Native and Reconstructed Bone Sites: A Retrospective Cohort Study. J. Pers. Med. 2021, 11, 1011. [Google Scholar] [CrossRef]
- Heimes, D.; Becker, P.; Pabst, A.; Smeets, R.; Kraus, A.; Hartmann, A.; Sagheb, K.; Kämmerer, P.W. How does dental implant macrogeometry affect primary implant stability? A narrative review. Int. J. Implant. Dent. 2023, 9, 20. [Google Scholar] [CrossRef]
- Jaffin, R.A.; Berman, C.L. The excessive loss of Branemark fixtures in type IV bone: A 5-year analysis. J. Periodontol. 1991, 62, 2–4. [Google Scholar] [CrossRef]
- Jemt, T.; Book, K.; Lindén, B.; Urde, G. Failures and complications in 92 consecutively inserted overdentures supported by Brånemark implants in severely resorbed edentulous maxillae: A study from prosthetic treatment to first annual check-up. Int. J. Oral Maxillofac. Implant. 1992, 7, 162–167. [Google Scholar] [CrossRef]
- de Groot, R.J.; Oomens, M.A.E.M.; Forouzanfar, T.; Schulten, E.A.J.M. Bone augmentation followed by implant surgery in the edentulous mandible: A systematic review. J. Oral Rehabil. 2018, 45, 334–343. [Google Scholar] [CrossRef]
- Duan, Q.; An, J.; Mao, H.; Liang, D.; Li, H.; Wang, S.; Huang, C. Review about the Application of Fractal Theory in the Research of Packaging Materials. Materials 2021, 14, 860. [Google Scholar] [CrossRef]
- Ataman-Duruel, E.T.; Beycioğlu, Z.; Yılmaz, D.; Goyushov, S.; Çimen, T.; Duruel, O.; Yılmaz, H.G.; Tözüm, T.F. Evaluation of Cortical Thicknesses and Bone Density Values of Mandibular Canal Borders and Coronal Site of Alveolar Crest. J. Oral Maxillofac. Res. 2023, 14, e4. [Google Scholar] [CrossRef]
- Huang, H.; Chen, D.; Lippuner, K.; Hunziker, E.B. Human Bone Typing Using Quantitative Cone-Beam Computed Tomography. Int. Dent. J. 2023, 73, 259–266. [Google Scholar] [CrossRef]
- Hao, Y.; Zhao, W.; Wang, Y.; Yu, J.; Zou, D. Assessments of jawbone density at implant sites using 3D cone-beam computed tomography. Eur. Rev. Med. Pharmacol. Sci. 2014, 18, 1398–1403. [Google Scholar]
- Shemtov-Yona, K. Quantitative assessment of the jawbone quality classification: A meta-analysis study. PLoS ONE 2021, 16, e0253283. [Google Scholar] [CrossRef]
- Selvaraj, A.; Jain, R.K.; Nagi, R.; Balasubramaniam, A. Correlation between gray values of cone-beam computed tomograms and Hounsfield units of computed tomograms: A systematic review and meta-analysis. Imaging Sci. Dent. 2022, 52, 133–140. [Google Scholar] [CrossRef]
- Tabassum, A.; Chainchel Singh, M.K.; Ibrahim, N.; Ramanarayanan, S.; Mohd Yusof, M.Y.P. Quantifications of Mandibular Trabecular Bone Microstructure Using Cone Beam Computed Tomography for Age Estimation: A Preliminary Study. Biology 2022, 11, 1521. [Google Scholar] [CrossRef]
- Guo, Z.; Du, X.; Wang, L.; Li, K.; Jiao, J.; Guglielmi, G.; Zhurakivska, K.; Lo Muzio, L.; Blake, G.M.; Cheng, X. Measurements of volumetric bone mineral density in the mandible do not predict spinal osteoporosis. Dentomaxillofac. Radiol. 2020, 49, 20190280. [Google Scholar] [CrossRef]
- Martinez, H.; Davarpanah, M.; Missika, P.; Celletti, R.; Lazzara, R. Optimal implant stabilization in low density bone. Clin. Oral Implant. Res. 2001, 12, 423–432. [Google Scholar] [CrossRef]
- Holahan, C.M.; Wiens, J.L.; Weaver, A.; Assad, D.; Koka, S. Relationship between systemic bone mineral density and local bone quality as effectors of dental implant survival. Clin. Implant. Dent. Relat. Res. 2011, 13, 29–33. [Google Scholar] [CrossRef]
- Al-Fakeh, H.; Sharhan, H.M.; Ziyad, T.A.; Abdulghani, E.A.; Al-Moraissi, E.; Al-Sosowa, A.A.; Liu, B.; Zhang, K. Three-dimensional radiographic assessment of bone changes around posterior dental implants at native bone site in Gansu Province, Northwest of China: A retrospective cohort study. J. Stomatol. Oral Maxillofac. Surg. 2022, 123, e186–e191. [Google Scholar] [CrossRef]
- Qu, F.; Huang, Y.J.; Wang, Y.Y.; Cao, X.M.; Shen, Y.Y.; Wu, Z.A.; Wu, Y.Q.; Xu, C. Cone-beam CT evaluation of post-extraction alveolar bone changes at the maxillary incisor sites in an East Asian population: A cross-sectional study. Heliyon 2024, 10, e32027. [Google Scholar] [CrossRef]
- Chappuis, V.; Engel, O.; Reyes, M.; Shahim, K.; Nolte, L.P.; Buser, D. Ridge alterations post-extraction in the esthetic zone: A 3D analysis with CBCT. J. Dent. Res. 2013, 92, 195S–201S. [Google Scholar] [CrossRef]
- Hayek, E.; Aoun, G.; Geha, H.; Nasseh, I. Image-Based Bone Density Classification Using Fractal Dimensions and Histological Analysis of Implant Recipient Site. Acta Inform. Medica 2020, 28, 272–277. [Google Scholar] [CrossRef]
- Amuk, M.; Saribal, G.S.; Ersu, N.; Yilmaz, S. The effects of technical factors on the fractal dimension in different dental radio-graphic images. Eur. Oral Res. 2023, 57, 68–74. [Google Scholar] [CrossRef]
- Naitoh, M.; Hirukawa, A.; Katsumata, A.; Ariji, E. Evaluation of voxel values in mandibular cancellous bone: Relationship be-tween cone-beam computed tomography and multislice helical computed tomography. Clin. Oral Implant. Res. 2009, 20, 503–506. [Google Scholar] [CrossRef]
- Park, C.S.; Kang, S.R.; Kim, J.E.; Huh, K.H.; Lee, S.S.; Heo, M.S.; Han, J.J.; Yi, W.J. Validation of bone mineral density measurement using quantitative CBCT image based on deep learning. Sci. Rep. 2023, 13, 11921. [Google Scholar] [CrossRef]
- Mozzo, P.; Procacci, C.; Tacconi, A.; Martini, P.T.; Andreis, I.A. A new volumetric CT machine for dental imaging based on the cone-beam technique: Preliminary results. Eur. Radiol. 1998, 8, 1558–1564. [Google Scholar] [CrossRef]
- Schulze, D.; Heiland, M.; Thurmann, H.; Adam, G. Radiation exposure during midfacial imaging using 4- and 16-slice com-puted tomography, cone beam computed tomography systems and conventional radiography. Dentomaxillofac. Radiol. 2004, 33, 83–86. [Google Scholar] [CrossRef]
- Bayat, N.; Ghavimi, M.A.; Rahimipour, K.; Razi, S.; Esmaeili, F. Radiographic texture analysis of the hard tissue changes following socket preservation with allograft and xenograft materials for dental implantation: A randomized clinical trial. Oral Maxillofac. Surg. 2024, 28, 705–713. [Google Scholar] [CrossRef]
- González-Martín, O.; Lee, E.A.; Veltri, M. CBCT fractal dimension changes at the apex of immediate implants placed using undersized drilling. Clin. Oral Implant. Res. 2012, 23, 954–957. [Google Scholar] [CrossRef]
- Poiana, I.R.; Dobre, R.; Popescu, R.I.; Pituru, S.M.; Bucur, A. Utility of Cone-Beam Computed Tomography in the Detection of Low Bone Mass—A Systematic Review. J. Clin. Med. 2023, 12, 5890. [Google Scholar] [CrossRef]
- Razi, T.; Niknami, M.; Alavi Ghazani, F. Relationship between Hounsfield Unit in CT Scan and Gray Scale in CBCT. J. Dent. Res. Dent. Clin. Dent. Prospect. 2014, 8, 107–110. [Google Scholar]
- Orlando, F.; Arosio, F.; Arosio, P.; Di Stefano, D.A. Bone Density and Implant Primary Stability. A Study on Equine Bone Blocks. Dent. J. 2019, 7, 73. [Google Scholar] [CrossRef]
- Magat, G.; Ozcan Sener, S. Evaluation of trabecular pattern of mandible using fractal dimension, bone area fraction, and gray scale value: Comparison of cone-beam computed tomography and panoramic radiography. Oral Radiol. 2019, 35, 35–42. [Google Scholar] [CrossRef]
- Suttapreyasri, S.; Suapear, P.; Leepong, N. The Accuracy of Cone-Beam Computed Tomography for Evaluating Bone Density and Cortical Bone Thickness at the Implant Site: Micro-Computed Tomography and Histologic Analysis. J. Craniofac. Surg. 2018, 29, 2026–2031. [Google Scholar] [CrossRef]
- Bastami, F.; Shahab, S.; Parsa, A.; Abbas, F.M.; Noori Kooshki, M.H.; Namdari, M.; Lisar, H.A.; Rafiei, T.; Fahimipour, F.; Salehi, M.; et al. Can gray values derived from CT and cone beam CT estimate new bone formation? An in vivo study. Oral Maxillofac. Surg. 2018, 22, 13–20. [Google Scholar] [CrossRef]
- Quirynen, M.; Lamoral, Y.; Dekeyser, C.; Peene, P.; van Steenberghe, D.; Bonte, J.; Baert, A.L. CT scan standard reconstruction technique for reliable jawbone volume determination. Int. J. Oral Maxillofac. Implant. 1990, 5, 384–389. [Google Scholar]
- Feldkamp, L.A.; Goldstein, S.A.; Parfitt, A.M.; Jesion, G.; Kleerekoper, M. The direct examination of three-dimensional bone architecture in vitro by computed tomography. J. Bone Miner. Res. 1989, 4, 3–11. [Google Scholar] [CrossRef]
- Goyushov, S.; Dursun, E.; Tözüm, T.F. Mandibular cortical indices and their relation to gender and age in the cone-beam computed tomography. Dentomaxillofac. Radiol. 2020, 49, 20190210. [Google Scholar] [CrossRef]
- Ko, Y.C.; Tsai, M.T.; Fuh, L.J.; Tsai, M.J.; Wang, X.H.; Huang, H.L.; Hsu, J.T. Association between Age of Menopause and Thickness of Crestal Cortical Bone at Dental Implant Site: A Cross-Sectional Observational Study. Int. J. Environ. Res. Public Health 2020, 17, 5868. [Google Scholar] [CrossRef] [PubMed]
- Khosla, S.; Riggs, B.L.; Atkinson, E.J.; Oberg, A.L.; McDaniel, L.J.; Holets, M.; Peterson, J.M.; Melton, L.J., 3rd. Effects of sex and age on bone microstructure at the ultradistal radius: A population-based noninvasive in vivo assessment. J. Bone Miner. Res. 2006, 21, 124–131. [Google Scholar] [CrossRef]
- Arisan, V.; Karabuda, Z.C.; Avsever, H.; Özdemir, T. Conventional multi-slice computed tomography (CT) and cone-beam CT (CBCT) for computer-assisted implant placement. Part I: Relationship of radiographic gray density and implant stability. Clin. Implant. Dent. Relat. Res. 2013, 15, 893–906. [Google Scholar] [CrossRef]
- Eser, S.; Sarıbaş, E. Anatomical assessment of the trabecular structure of the alveolar bone in periodontal disease by fractal analysis method. Folia Morphol. 2024, 83, 157–167. [Google Scholar] [CrossRef] [PubMed]
- Carvalho, B.F.; de Castro, J.G.K.; de Melo, N.S.; de Souza Figueiredo, P.T.; Moreira-Mesquita, C.R.; de Paula, A.P.; Sindeaux, R.; Leite, A.F. Fractal dimension analysis on CBCT scans for detecting low bone mineral density in postmenopausal women. Imaging Sci. Dent. 2022, 52, 53–60. [Google Scholar] [CrossRef] [PubMed]
- Wang, S.H.; Shen, Y.W.; Fuh, L.J.; Peng, S.L.; Tsai, M.T.; Huang, H.L.; Hsu, J.T. Relationship Between Cortical Bone Thickness and Cancellous Bone Density at Dental Implant Sites in the Jawbone. Diagnostics 2020, 10, 710. [Google Scholar] [CrossRef]
- Afzoon, S.; Ghorbani, F.; Hasani, M. Evaluation of the mandibular condyles trabecular structure in patients with severe class III pattern: A computed tomography (CT) fractal analysis study. Sci. Rep. 2023, 13, 18183. [Google Scholar] [CrossRef]
- Demiralp, K.Ö.; Kurşun-Çakmak, E.Ş.; Bayrak, S.; Akbulut, N.; Atakan, C.; Orhan, K. Trabecular structure designation using fractal analysis technique on panoramic radiographs of patients with bisphosphonate intake: A preliminary study. Oral Radiol. 2019, 35, 23–28. [Google Scholar] [CrossRef]
- Da Silva, M.E.B.; Dos Santos, H.S.; Ruhland, L.; Rabelo, G.D.; Badaró, M.M. Fractal analysis of dental periapical radiographs: A revised image processing method. Oral Surg. Oral Med. Oral Pathol. Oral Radiol. 2023, 135, 669–677. [Google Scholar] [CrossRef]
- Miranda-Viana, M.; Fontenele, R.C.; Nogueira-Reis, F.; Farias-Gomes, A.; Oliveira, M.L.; Freitas, D.Q.; Haiter-Neto, F. DICOM file format has better radiographic image quality than other file formats: An objective study. Braz. Dent. J. 2023, 34, 150–157. [Google Scholar] [CrossRef]
- Yasar, F.; Apaydin, B.; Yilmaz, H.H. The effects of image compression on quantitative measurements of digital panoramic radiographs. Med. Oral Patol. Oral Y Cirugia Bucal 2012, 17, e1074–e1081. [Google Scholar] [CrossRef] [PubMed]
- Leite, A.F.; de Souza Figueiredo, P.T.; Caracas, H.; Sindeaux, R.; Guimaraes, A.T.B.; Lazarte, L.; de Paula, A.P.; de Melo, N.S. Systematic review with hierarchical clustering analysis for the fractal dimension in assessment of skeletal bone mineral density using dental radio-graphs. Oral Radiol. 2015, 31, 1–13. [Google Scholar] [CrossRef]
- Misch, C.E. Density of bone: Effect on treatment plans, surgical approach, healing, and progressive boen loading. Int. J. Oral Implantol. 1990, 6, 23–31. [Google Scholar] [PubMed]
- Bucur, S.M.; Cocoș, D.I.; Cucui, R.M.S.; Nazarie, S. Evaluation of the bone supply necessary for implant insertion using the cbct technique–prospective study. Rom. J. Oral Rehabil. 2021, 13. [Google Scholar]
- Morar, L.; Băciuț, G.; Băciuț, M.; Bran, S.; Colosi, H.; Manea, A.; Dinu, C. Analysis of CBCT bone density using the Hounsfield scale. Prosthesis 2022, 4, 414–423. [Google Scholar] [CrossRef]
- Siddiqui, J.A.; Partridge, N.C. Physiological Bone Remodeling: Systemic Regulation and Growth Factor Involvement. Physiology 2016, 31, 233–245. [Google Scholar] [CrossRef]
- Jonasson, G.; Skoglund, I.; Rythén, M. The rise and fall of the alveolar process: Dependency of teeth and metabolic aspects. Arch. Oral Biol. 2018, 96, 195–200. [Google Scholar] [CrossRef]
- Daluz, A.; Saliba-Serre, B.; Foti, B.; Lan, R. Age estimation from alveolar bone loss, re-evaluation of Ruquet’s method. Forensic Sci. Med. Pathol. 2024, 20, 79–88. [Google Scholar] [CrossRef]
- Teterina, A.; Niratisairak, S.; Morseth, B.; Bolstad, N. General and local predictors of mandibular cortical bone morphology in adult females and males: The seventh survey of the Tromsø Study. Clin. Oral Investig. 2023, 27, 6577–6587. [Google Scholar] [CrossRef]
- Preoteasa, E.; Florica, L.I.; Obadan, F.; Imre, M. Minimally Invasive Implant Treatment Alternatives for. Curr. Concepts Dent. Implantol. 2015, 77. [Google Scholar]
- Mitrea, M.; Walid, E.A.; Saveanu, C.I.; Hurjui, L.L.; Niculescu, S.; Dmour, A.; Forna, N.C. Clinical implications of sinus lift procedures. Rom. J. Oral Rehabil. 2021, 13, 144–152. [Google Scholar]
- Cho, Y.J.; Jeong, Y.T.; Cho, H.W.; Lee, J.M. A Revisit of Socket Preservation for Dental Implantation. Anti-Aging 2024, 2, 3–12. [Google Scholar]

Disclaimer/Publisher’s Note: The statements, opinions and data contained in all publications are solely those of the individual author(s) and contributor(s) and not of MDPI and/or the editor(s). MDPI and/or the editor(s) disclaim responsibility for any injury to people or property resulting from any ideas, methods, instructions or products referred to in the content. |
© 2025 by the authors. Licensee MDPI, Basel, Switzerland. This article is an open access article distributed under the terms and conditions of the Creative Commons Attribution (CC BY) license (https://creativecommons.org/licenses/by/4.0/).